1. Introduction
Brillouin optical time domain analysis (BOTDA) is the sensing of temperature and strain changes along an optical fiber by measuring the frequency shift changes of Brillouin backscattering. As compared to other sensing modalities (e.g., Rayleigh- and Raman-based), BOTDA is not strictly power dependent and can be used over distances as long as 100 km. BOTDA may be used to monitor the operation and structural integrity of oil and gas pipelines and wells, electrical power lines, and transportation infrastructure (e.g., bridges, railroads, highways) [
1,
2].
Because frequency shift changes are a linear combination of temperature and strain changes, their discrimination is a challenge [
3,
4,
5]. Temperature and strain can be discriminated by solving a system of linear equations that comprise measurements of frequency shift changes from two spatial channels (spatial channels 1 and 2). The spatial channels are subjected to the same temperature and strain changes, yet they have different temperature and strain coefficients. For example, two single-mode optical fibers can be used [
6]. However, because they occupy different claddings, they may not experience the same temperature and strain changes. Additionally, two spatial modes of a multimode optical fiber can be used [
7,
8,
9]. However, because they occupy the same core, the multimode optical fiber may not be fabricated such that the coefficients are sufficiently different. Another solution using two fibers in a cable to discriminate temperature and strain has been proposed [
10], in which one fiber is deployed in a loose tube to measure the temperature only, and the other is deployed in a tight buffer to sense both the temperature and strain. However, this approach has two issues that cause measurement errors. Firstly, the loose-tubed fiber is not completely strain-free, which results in measurement errors on temperature and strain. Secondly, the difference in fiber length between the two fibers also causes measurement errors at sensing locations.
Recently, it was demonstrated that two cores of a multicore optical fiber can be used [
11,
12]. This contrasts the use of two single-mode optical fibers and two spatial modes of a multimode optical fiber. Because the cores occupy the same cladding, they can experience the same temperature and strain changes. Additionally, because the cores are separate, the multicore optical fiber can be fabricated such that the coefficients are sufficiently different. In general, the ability of spatial channels to discriminate temperature from strain is quantified by error amplification factors, which are a measure of the coefficients’ differences [
13]. For multicore optical fibers, temperature (strain) error amplification factors greater than 12.05 °C/MHz (253.77
/MHz) were demonstrated. Therefore, it may be of interest to fabricate a multicore optical fiber such that the error amplification factors are lower.
Here, a multicore optical fiber that has two cores is fabricated. The differences between the cores’ temperature and strain coefficients are such that temperature(strain) changes can be discriminated with error amplification factors of 4.57 °C/MHz (69.11 /MHz), which is 2.63 (3.67) times lower than previously demonstrated. As proof of principle, using the multicore optical fiber and a commercial BOTDA, the temperature (strain) changes of a thermally expanding metal cylinder are discriminated with an error of 0.24% (3.7%).
2. Theory
In BOTDA, frequency shift changes are a linear combination of temperature and strain changes. Temperature and strain changes can be discriminated by solving a system of linear equations that comprise measurements of frequency shift changes from two spatial channels (spatial channels 1 and 2). The spatial channels are subjected to the same temperature and strain changes, yet they have different temperature and strain coefficients. In matrix form, where the coefficients comprise a matrix, the system of linear equations is given by [
13]:
and
are the measured frequency shifts changes of spatial channels 1 and 2, respectively.
is the measurement error of
and
. It is assumed that
is the same for
and
, because it is assumed that
and
are measured in the same manner.
and
(
and
) are the temperature and strain coefficients, respectively, of spatial channel 1 (spatial channel 2).
and
are the temperature and strain changes, respectively, experienced by spatial channels 1 and 2.
and
(
and
) can be experimentally determined by measuring
and
while varying
(
) and keeping
(
) constant. Effectively,
,
,
and,
are the slopes of best fit lines of the measurements. It is assumed that the measurement errors of
,
,
and,
are negligible.
and
can be solved for by multiplying both sides of Equation (1) by the inverse of the matrix. It can be shown that the resulting errors of
and
are given, respectively, by the equations [
13]:
and,
Note that Equations (2) and (3) were calculated in accordance with error propagation, i.e., all terms that comprise were added in quadrature. As can be seen, , , and, make up factors that multiplicatively increase (amplify) . These factors are referred to here as temperature and strain error amplification factors, respectively, i.e., and , respectively. Effectively, and are a measure of the difference between , , and, . The ability of the spatial channels to discriminate and is quantified by and , respectively.
3. Experiment
3.1. Multicore Optical Fiber
A multicore optical fiber with two cores (core 1 and 2) was fabricated. Details regarding the transmission characteristics of cores 1 and 2 can be found in references [
14,
15]. The transmission characteristics of cores 1 and 2 were comparable to those of a standard single-mode optical fiber; however, because the fiber was made in a research lab, the attenuation (0.23 dB/km for Core 1, and 0.29 dB/km for Core 2) was slightly higher than that of a standard single-mode fiber. It is expected that the attenuation will decrease when the fiber is made in the production process. The fiber diameter (9.3 μm for Core 1, and 10.4 μm for Core 2) is similar to the standard single-mode fiber diameter, and therefore compatible for typical Brillouin sensing applications.
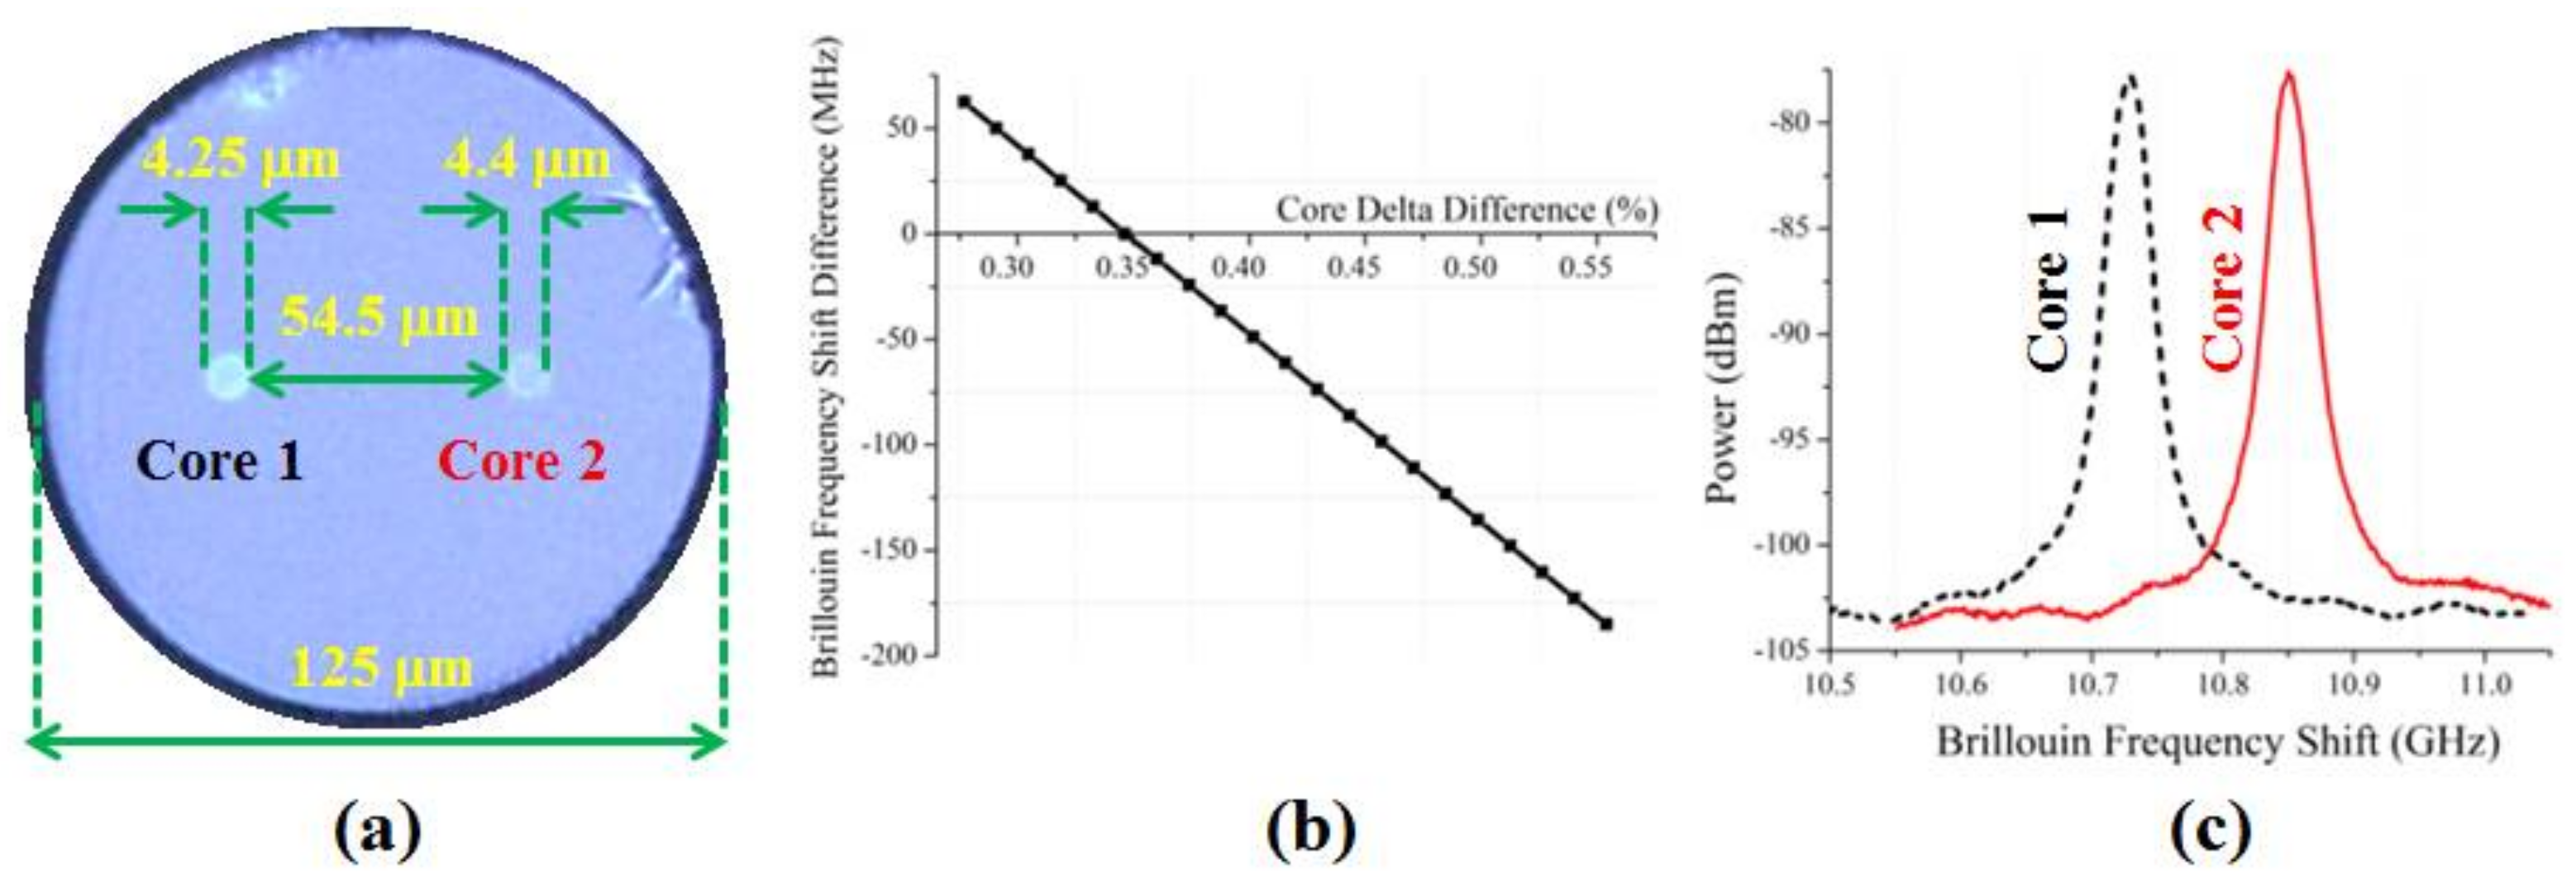
Figure 1a shows the multicore optical fiber’s cross-section. It had a 125 μm diameter cladding. Cores 1 and 2 served as spatial channels 1 and 2, respectively. Cores 1 and 2 had radii of 4.25 μm and 4.4 μm, respectively, and were separated by 54.5 μm. Cores 1 and 2 were Ge doped, had step index profiles, and had deltas of 0.46% and 0.34%, respectively.
Figure 1b shows a theoretical calculation of the difference between the frequency shifts of cores 1 and 2 as a function of the difference between their deltas when one of the cores had a delta of 0.34% [
14]. The frequency shifts from cores 1 and 2 were measured using a commercial BOTDA. The commercial BOTDA is described below.
Figure 1c shows the measured frequency shifts, which were 10.73 GHz and 10.85 GHz, respectively. Using different core compositions, the fiber cores’ responses to temperature and strain (i.e.,
,
,
and,
) were also sufficiently different.
3.2. Commercial Brillouin Optical Time Domain Analyzer
In the experiments, and were measured using a commercial BOTDA (OZ Optics). A light pulse (1550 nm) was launched into cores 1 or 2 at one end of the multicore optical fiber, and continuous-wave light was launched into cores 1 or 2, respectively, at the other end (i.e., counter propagating pulse and continuous-wave). The light pulse and continuous-wave light interact via an electrostriction-induced acoustic wave, i.e., stimulated Brillouin back-scattering. The frequency difference between the light pulse and the continuous wave light could be varied from 10.5 GHz to 11.0 GHz. Due to stimulated Brillouin scattering, there was power amplification (gain) when the frequency shift of the spontaneous Brillouin back-scattering was equal to the frequency difference between the light pulse and the continuous wave light. and were measured by measuring that power amplification (i.e., the Brillouin gain spectrum). The spatial resolution of the commercial BOTDA was 1 m. The lengths of the multicore optical fibers used in the experiments were 20 m. and were measured by measuring a frequency shift every 1 m over 20 m and then averaging. of the commercial BOTDA depended on many factors, including launched power, optical fiber length, and measurement time. In the experiments, was ~0.64 MHz.
The commercial BOTDA had two channels (channels 1 and 2). and were measured simultaneously by connecting cores 1 and 2 to channels 1 and 2. Cores 1 and 2 were connected to channels 1 and 2, respectively, via fusion splicing of a single-mode optical fiber. However, due to size, only one single-mode optical fiber could be spliced to a core at a time. Therefore, two multicore optical fibers were used: One single-mode optical fiber was spliced to core 1 of one multicore optical fiber, and another single-mode optical fiber was spliced to core 2 of another multicore optical fiber.
3.3. Experimental Determination of and
and
were experimentally determined by measuring
and
while varying
and keeping
constant. Effectively,
and
are the slopes of best fit lines of the measurements. The 20 m lengths of the two multicore optical fibers were loosely coiled and placed in an oven. Note that loose coiling ensured that
was constant.
was varied by varying the temperature of the oven. The temperature of the oven was varied from 35 °C to 95 °C in increments of 5 °C. A thermocouple was also placed in the oven. The thermocouple was used to measure the temperature of the oven. For each increment,
and
were measured using the commercial BOTDA.
and
were plotted as a function of
.
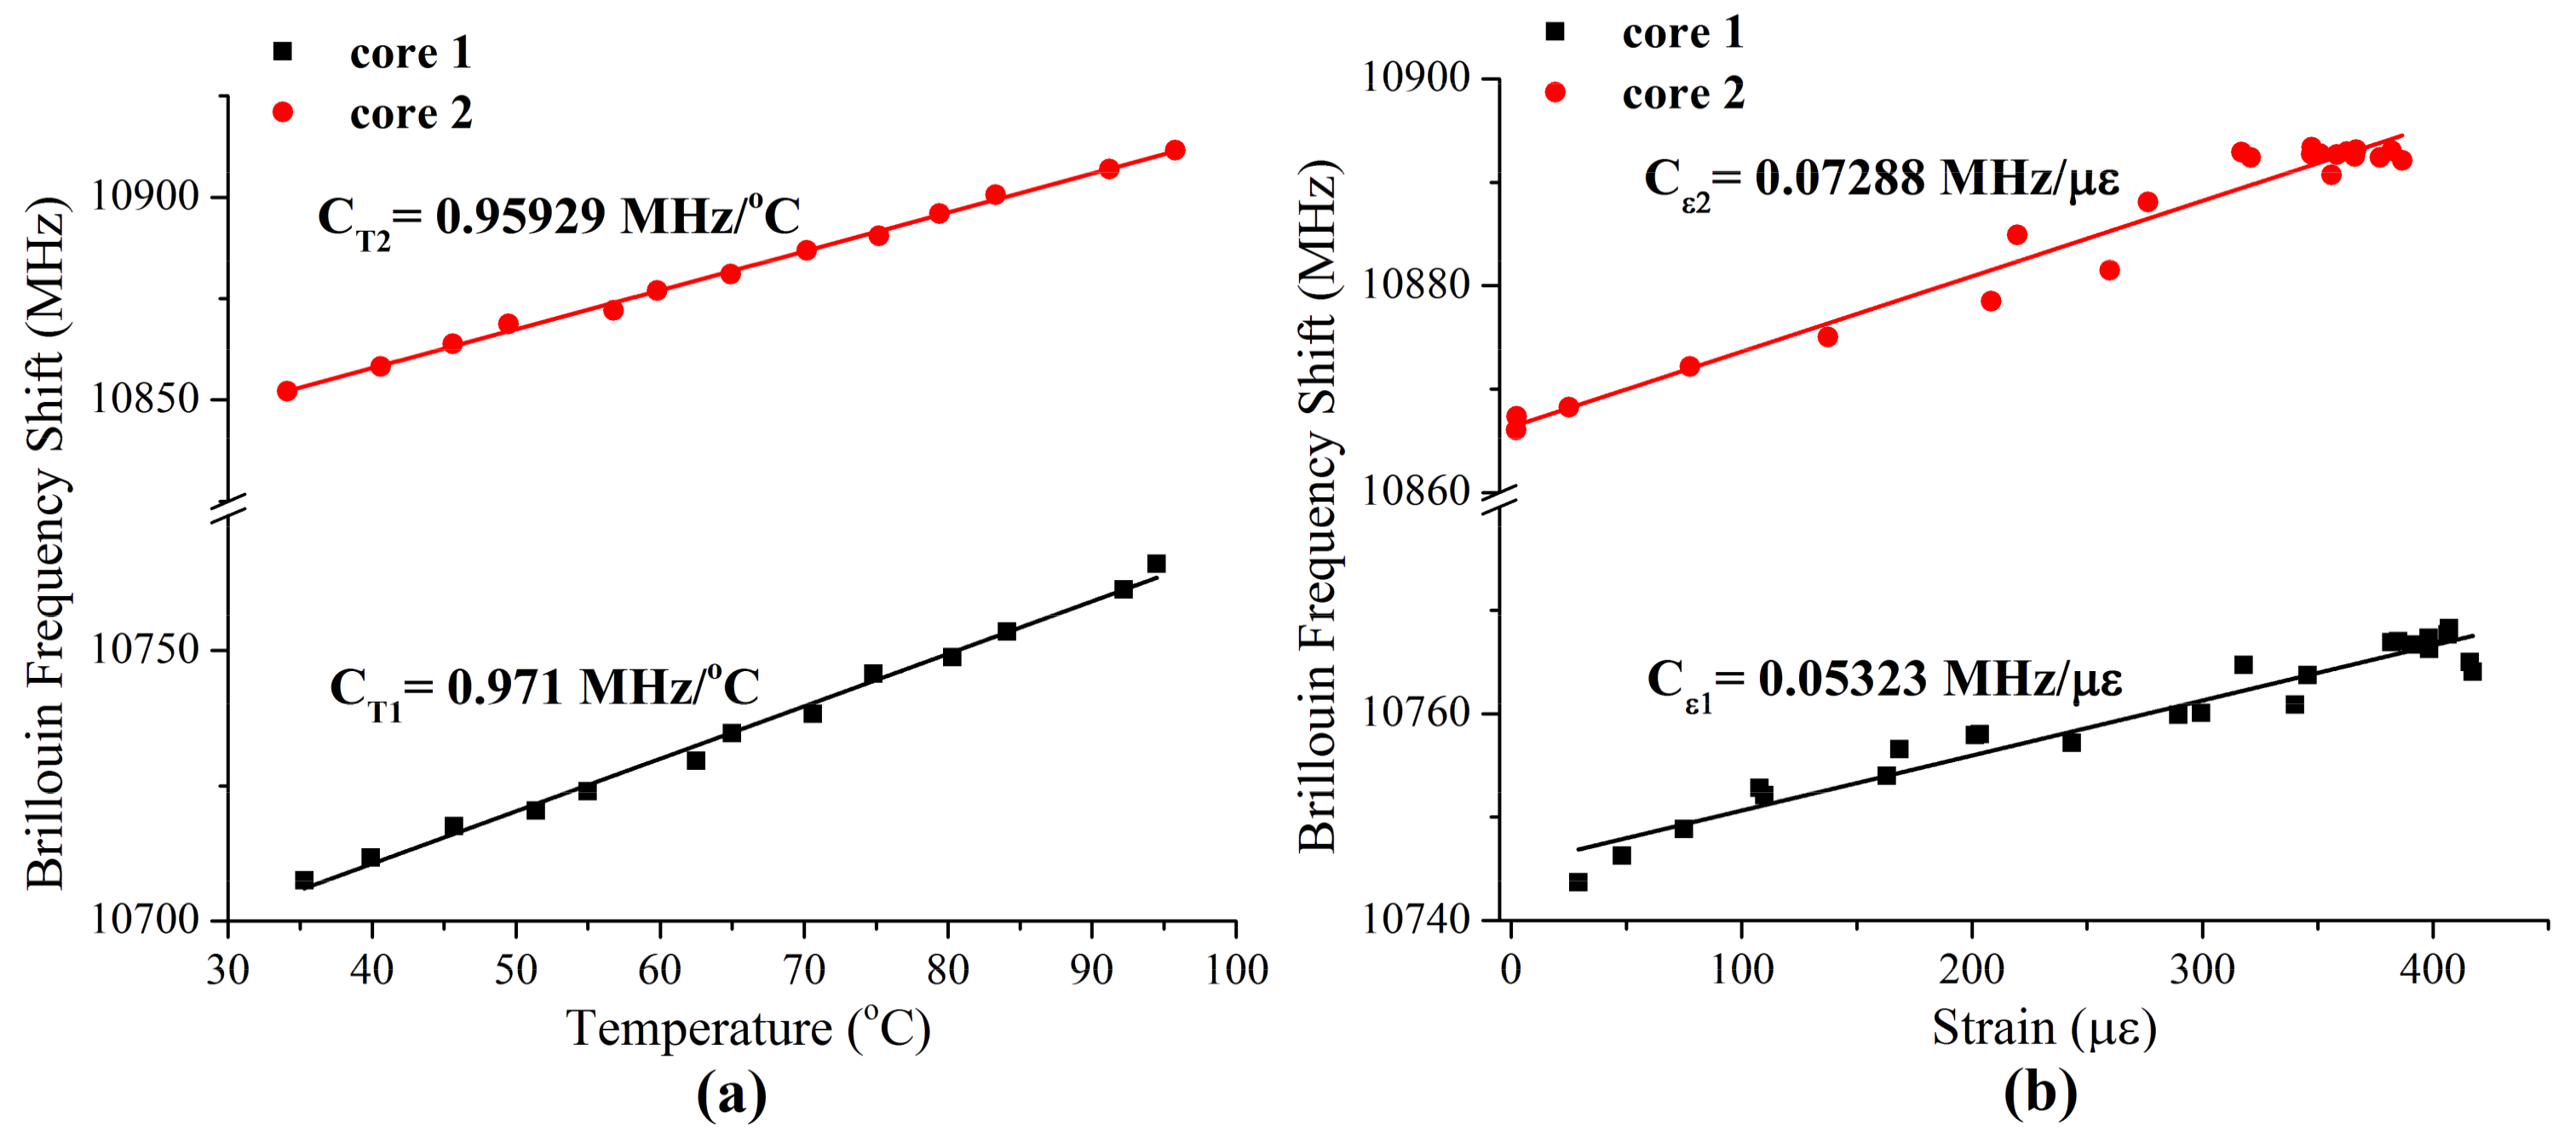
Figure 2a shows the plots.
and
were determined by calculating the best fit lines of the plots.
Figure 2a also shows the plots of the best fit lines. The determined values of
and
are shown in the first row of
Table 1. The measurement errors of
and
were 0.02456 MHz/°C and 0.01456 MHz/°C, respectively.
3.4. Experimental Determination of and
and
were experimentally determined by measuring
and
while varying
and keeping
constant. Effectively,
and
are the slopes of best fit lines of the measurements. The two 20 m lengths of the multicore optical fiber were wound between two posts that were separated by 10 m. The position of one post was fixed and the position of the other post was varied by a motor controlled stage (Thorlabs
®). The motor-controlled stage had 0.1 μm and 8 μm position resolution and repeatability, respectively.
was varied by varying the position of the motor-controlled stage that stretched the two 20 m lengths of the multicore optical fiber.
was varied from 0 μ
to 400 μ
in various increments. The determination of the increments is described below. For each increment,
and
were measured using the commercial BOTDA.
and
were plotted as a function of
.
Figure 2b shows the plots.
and
were determined by calculating the best fit lines of the plots.
Figure 2b also shows plots of the best fit lines. The determined values of
and
are shown in the first row of
Table 1. The measurement errors of
and
were 0.00282
/MHz and 0.00313
MHz, respectively.
The increments were determined via calibration with a standard single-mode optical fiber whose strain coefficient was known (Corning® SMF-28®). During the experiment, the standard single-mode optical fiber was also wound between the two posts. When the position of the motor-controlled stage was varied, the frequency shift from the standard single-mode optical fiber was measured using the commercial BOTDA. The increment was determined by using the known strain coefficient and the measured frequency shift to calculate .
3.5. Comparison with References [11] and [12]
Using the experimentally determined values of
,
,
and,
,
and
were calculated according to Equations (2) and (3), respectively.
and
are shown in the first column of
Table 1:
= 4.57 °C/MHz and
= 69.11
/MHz. These values were compared to those of References [
11] and [
12].
,
,
and,
reported in References [
11] and [
12] are shown in the second and third columns, respectively, of
Table 1. Using these,
and
were calculated according to Equations (2) and (3), respectively.
and
for References [
11] and [
12] are shown in the second and third columns, respectively, of
Table 1. For Reference [
11],
= 12.05 °C/MHz and
= 253.77
/MHz For Reference [
12],
= 13.25 °C/MHz and
= 299.18
/MHz. Here,
and
are 2.63 times and 3.67 times lower, respectively, than for Reference [
11]. Here,
and
are 2.90 times and 4.33 times lower, respectively, than for Reference [
12].
3.6. Proof of Principle
As proof of principle, and to verify the improved accuracy for both temperature and strain measurements, the
and
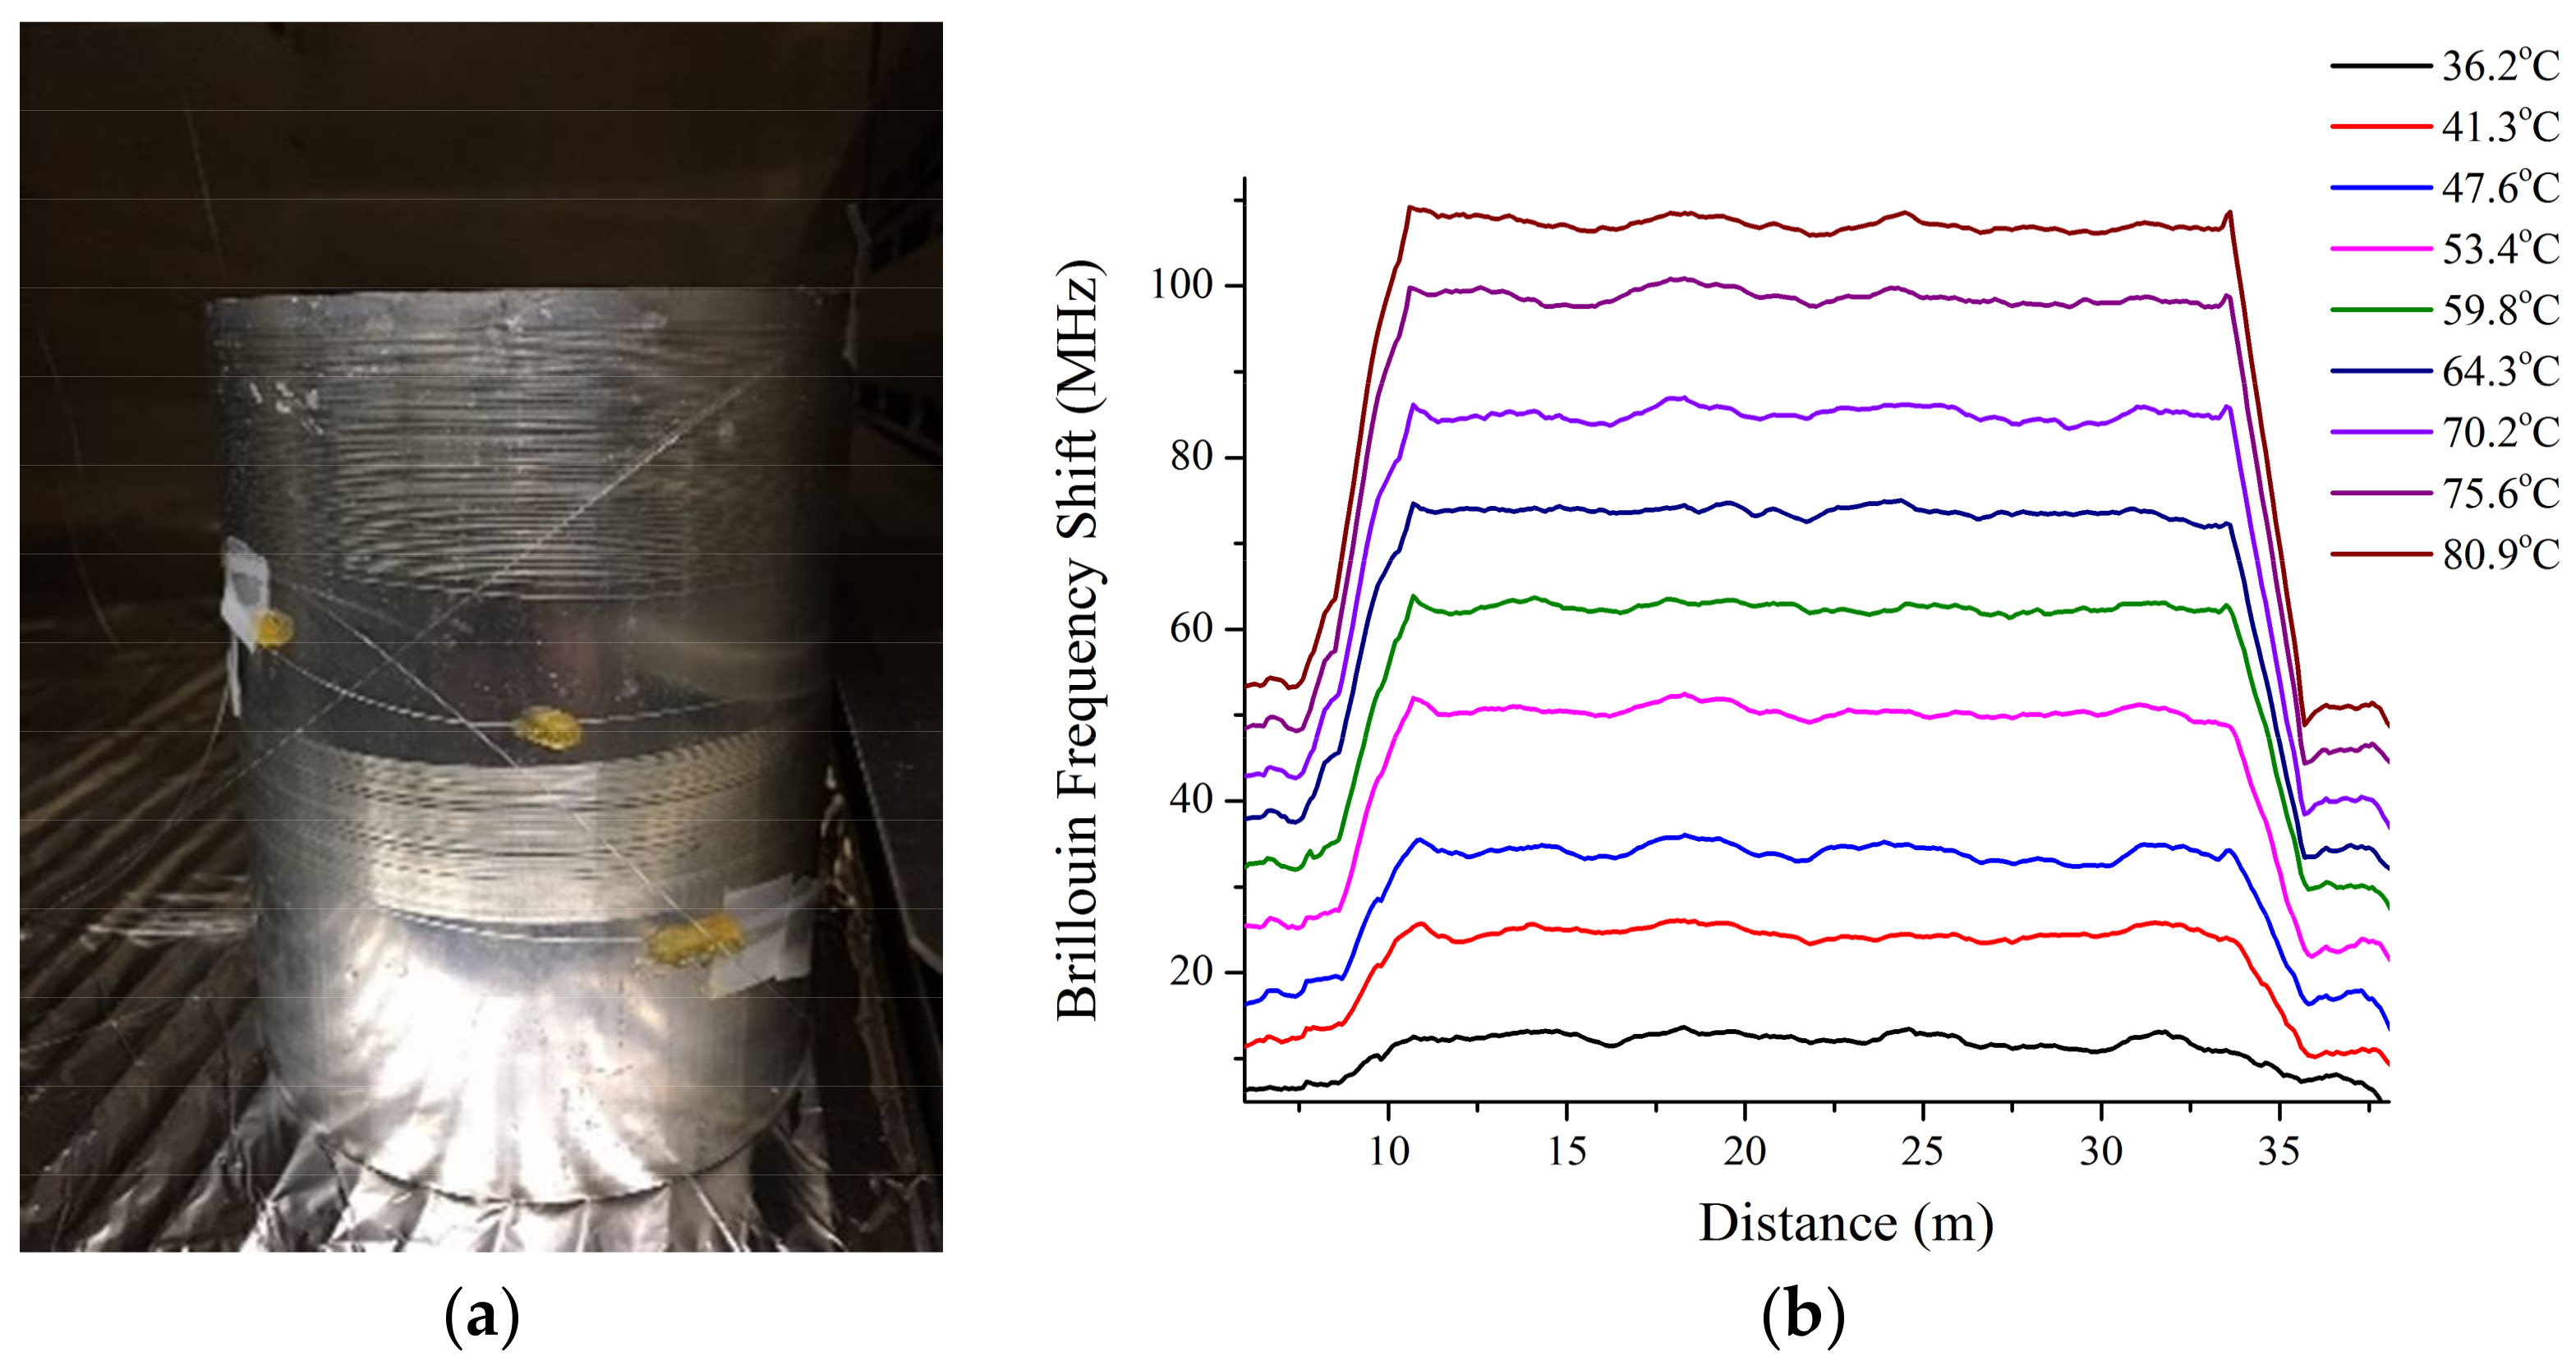
of a thermal expansion of a hollow metal cylinder were sensed using the two-core fiber. The metal cylinder was made of aluminum alloy 6063-T5. The diameter of the cylinder is 12 cm with a wall thickness of 3 mm. Two-core fibers with length of 20 meters were tightly wound around the metal cylinder, which is shown in
Figure 3a. Cores 1 and 2 of the two-core fiber were probed by the commercial BOTDA via APC patch cables that were fusion spliced to the samples. Although the two-core fiber presented challenges to interrogate using commercially off-the-shelf fiber-connecting devices, this technical difficulty can be readily resolved by using 3D fan-in and fan-out waveguide devices. Using ultrafast laser direct waveguide writing, appropriately low-loss waveguide fan-in and fan-out devices can be readily fabricated in silica glass to connect two standard single-core fibers to the dual-core fibers, and therefore facilitate fiber sensor interrogation [
16]. The metal cylinder was placed in an oven. At elevated temperatures, the expansion of the metal cylinder will exert strain on the fiber given the larger thermal expansion coefficient of aluminum alloy compared to that of silica fiber. Given the well-known material properties of the aluminum alloy and its simple geometry, the strain induced on the fiber can be precisely determined. The temperature of the oven was changed from the ambient temperature to 90 °C in increments of approximately 5 °C. For each increment,
and
were measured using the commercial BOTDA. A thermocouple was placed in the oven to verify the temperature changes of the metal cylinder. The strain changes of the metal cylinder due to thermal expansion were calculated using a finite element analysis (FEA) method (COMSOL). The Brillouin frequency shifts vs temperature along the 20-m section of the fiber of Core 1 are presented in
Figure 3b. The measurement was acquired with 1-m spatial resolution and was 5 point-averaged to yield a smooth profile.
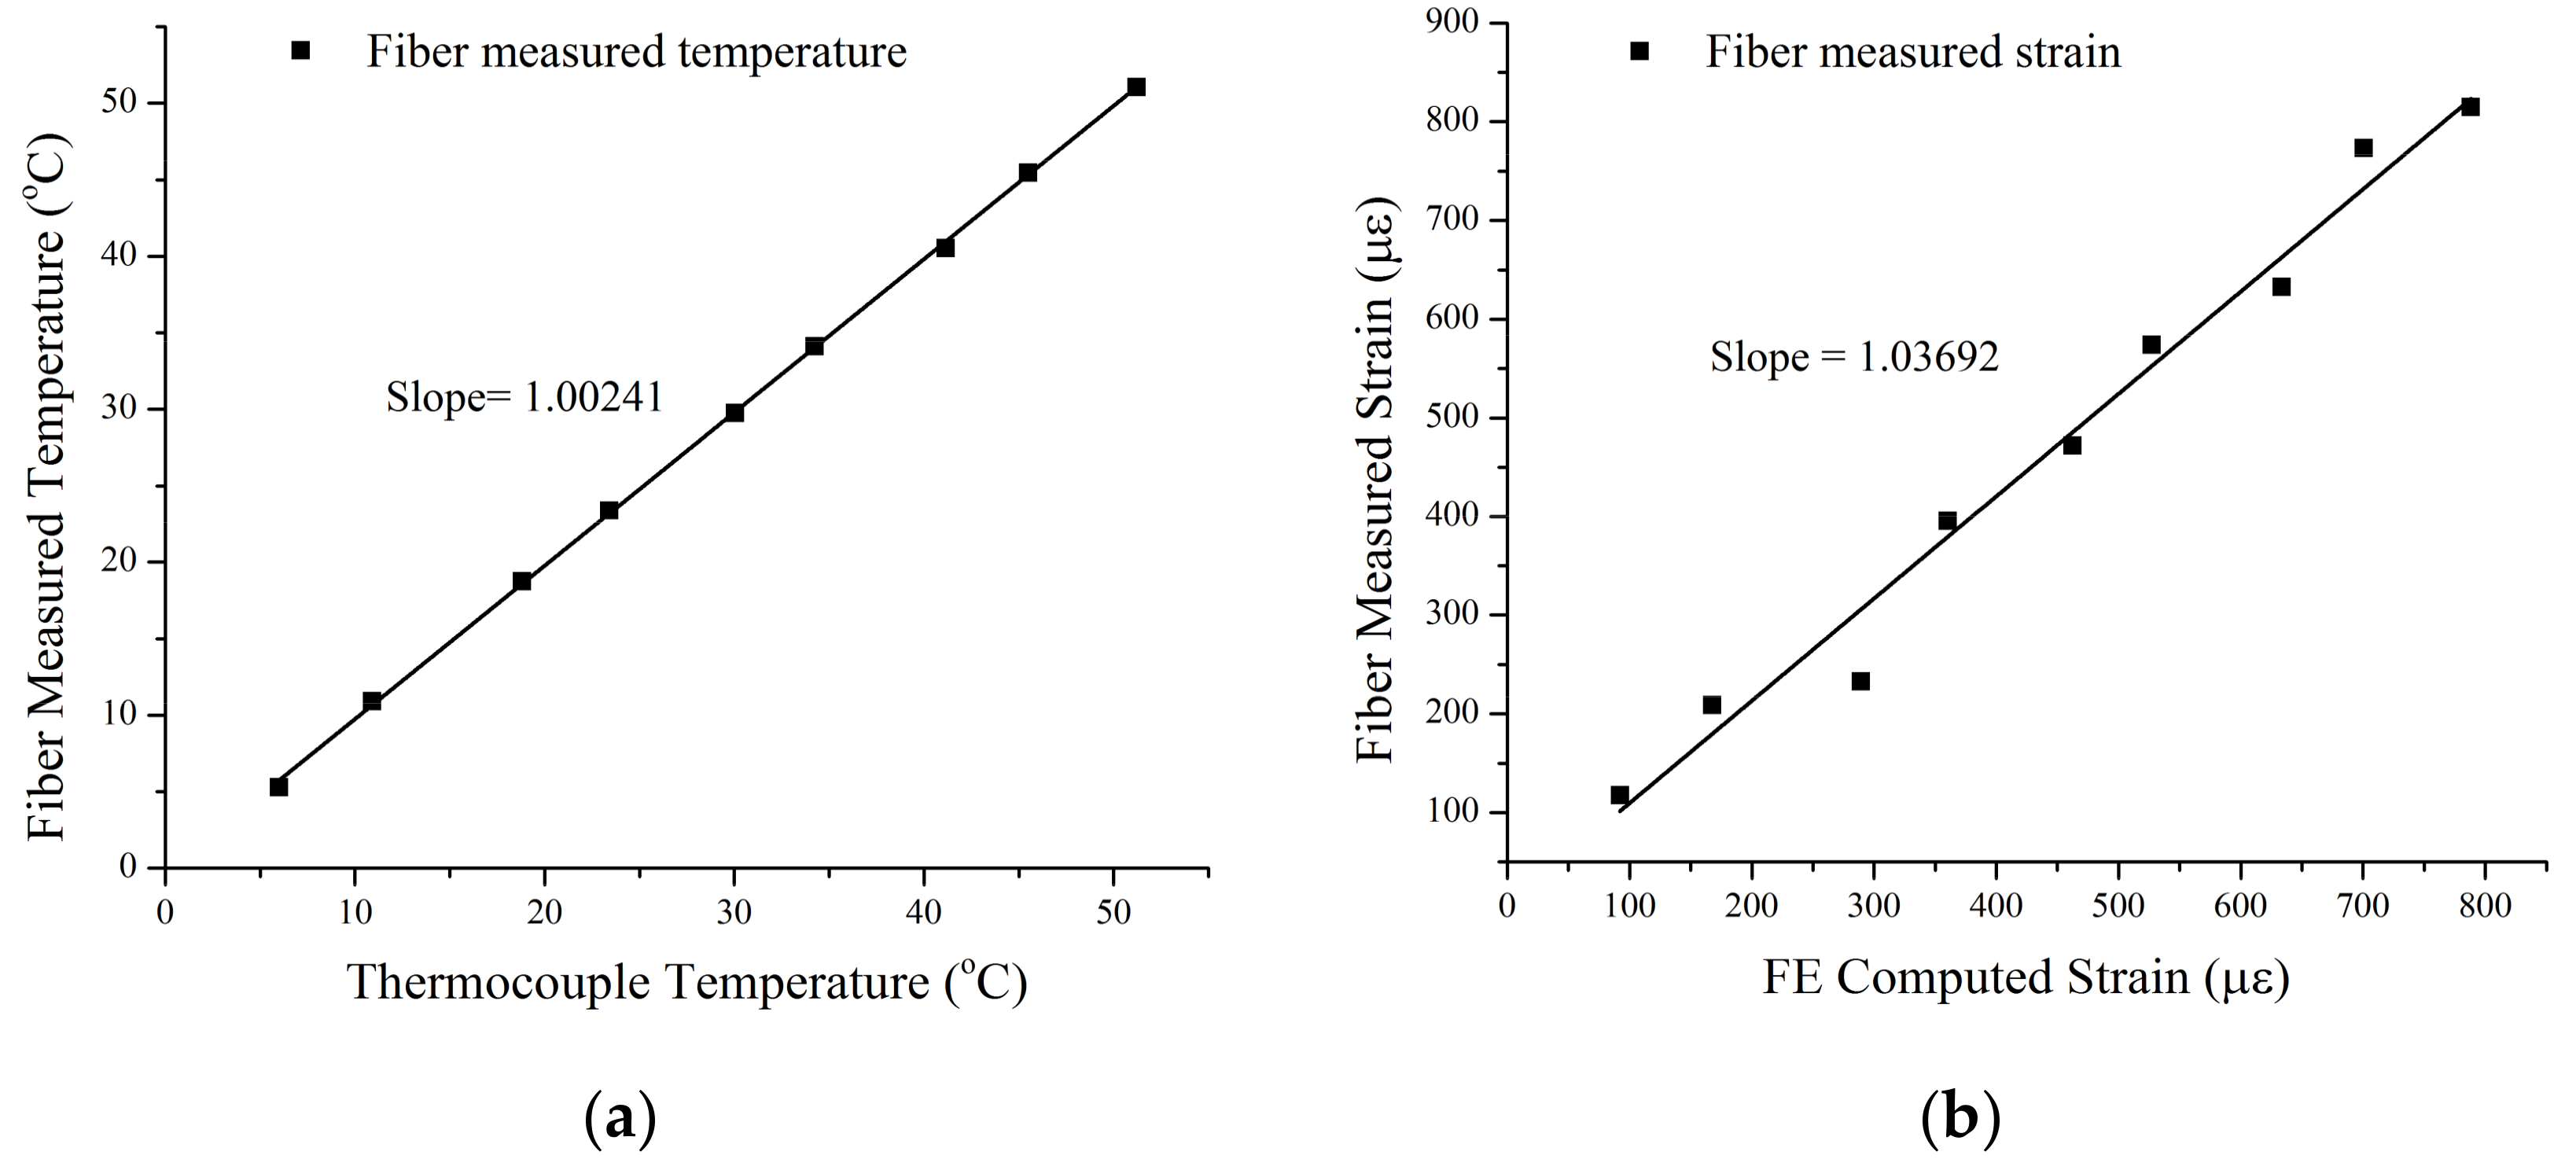
For each measurement, temperature and strain measured by the two-core fibers were calculated using the matrix formulation (Equation (1)) from the measured Brillouin frequency shifts
and
from Core 1 and Core 2. These results are graphically presented in
Figure 4, while fiber-measured temperature and strain are plotted against the temperature measured by the thermal coupler and FEA simulation.
Slopes of linear fits of the temperature and strain calibration figure presented in
Figure 4 yields 0.24% system error for temperature measurements and 3.7% system error for strain measurements. The error with the strain measurement is relatively higher than that of temperature. This is due to the fact that the dual core fibers are 13–18 times more sensitive to temperature changes (MHz/°C) than strain changes (MHz/
), as previously depicted in
Figure 2. To better illustrate the measurement accuracy at different temperature and strain ranges, experimental data presented in
Figure 4 is also presented in
Table 2, while dual-core fiber-measured temperature and strains are compared with calibration measurements and calculations from temperatures ranges between 36.1 °C to 81.3 °C. On averages, the two-core fiber yielded 1.7% measurement error for temperatures and 10.7% average error for strain measurements. The large measurement errors are mostly contributed to by those measurements performed at lower temperatures of below 50 °C with lower thermal expansion-induced strains. At higher temperatures of above 50 °C, the average measurement errors reduce to 0.45% and 5.3%, respectively.
4. Conclusions
In conclusion, a multicore optical fiber that had two cores was fabricated. The differences between the cores’ temperature and strain coefficients were such that temperature (strain) changes could be discriminated with error amplification factors of 4.57 °C/MHz (69.11 /MHz), which is 2.63 (3.67) times lower than previously demonstrated. As proof of principle, using the multicore optical fiber and a commercial BOTDA, the temperature (strain) changes of a thermally expanding metal cylinder were discriminated with an average error of 0.24% (3.7%).
Here, it was assumed that the measurement errors of
,
,
and,
were negligible. A theoretical analysis of error amplification factors that is more complete than Equations (1)–(3) should account for non-negligible measurement errors of
,
,
and,
[
13]. However, the measurement errors of
,
,
and,
reported here and in References [
11] and [
12] were a few percent. When using a multicore optical fiber for BOTDA, strain due to bending must be taken into account [
11]. However, here, it was assumed that strain due to bending was uniform over the length of the multicore optical fiber and negligible.
Here, temperature and strain resolutions are not reported. Reporting of strain and temperature resolutions may be considered arbitrary, because temperature and strain resolutions depend on many experimental factors, including launched power, optical fiber length, and measurement time. Because different works utilize differing experimental factors, temperature and strain resolutions may not be comparable. In contrast, error amplification factors are comparable because, for a given set of experimental factors, error amplification factors quantify the difference between the abilities of two multicore optical fibers to discriminate temperature from strain.
It may be of interest to investigate the use of other types of multimode and multicore optical fibers to discriminate temperature and strain in BOTDA, e.g., those with elliptical cores [
17,
18,
19,
20].
Acknowledgments
Mohamed A. S. Zaghloul, Mohan Wang and Kevin P. Chen are supported in part by the U. S. Department of Energy grants M3CA-14-PA-PITT-0702-0320 and FE-DE-0029063 and the U.S. Department of Energy sponsored and the Oak Ridge Institute for Science and Education administered National Energy Technology Laboratory Research Participation Program.
Author Contributions
M.A.S.Z., K.P.C., M.-J.L., G.M., Y.-K.H. and T.W. conceived and designed the experiments; M.A.S.Z. performed the experiments; M.A.S.Z. and M.W. analyzed the data; M.-J.L. and S.L. contributed the specialized multicore fiber; M.A.S.Z., G.M., M.-J.L. and K.P.C. wrote the paper.
Conflicts of Interest
The authors declare no conflicts of interest.
References
- Bao, X.; Chen, L. Recent progress in Brillouin scattering based fiber sensors. Sensors 2011, 11, 4152–4187. [Google Scholar] [CrossRef] [PubMed]
- Motil, A.; Bergman, A.; Tur, M. State of the art of Brillouin fiber-optic distributed sensing. Opt. Laser Technol. 2016, 78, 81–103. [Google Scholar] [CrossRef]
- Parker, T.R.; Farhadiroushan, M.; Handerek, V.A.; Rogers, A.J. Temperature and strain dependence of the power level and frequency of spontaneous Brillouin scattering in optical fibers. Opt. Lett. 1997, 22, 787–789. [Google Scholar] [CrossRef] [PubMed]
- Lee, C.C.; Chiang, P.W.; Chi, S. Utilization of a dispersion-shifted fiber for simultaneous measurement of distributed strain and temperature through Brillouin frequency shift. IEEE Photonics Technol. Lett. 2001, 13, 1094–1096. [Google Scholar] [CrossRef]
- Alahbabi, M.N.; Cho, Y.T.; Newson, T.P. Simultaneous temperature and strain measurement with combined spontaneous Raman and Brillouin scattering. Opt. Lett. 2005, 30, 1276–1278. [Google Scholar] [CrossRef] [PubMed]
- Zou, L.; Sezerman, O.M.; Oz Optics Ltd. Method and System for Simultaneous Measurement of Strain and Temperature. U.S. Patent 7,599,047, 6 October 2009. [Google Scholar]
- Weng, Y.; Ip, E.; Pan, Z.; Wang, T. Single-end simultaneous temperature and strain sensing techniques based on Brillouin optical time domain reflectometry in few-mode fibers. Opt. Express 2015, 23, 9024–9039. [Google Scholar] [CrossRef] [PubMed]
- Li, A.; Wang, Y.; Fang, J.; Li, M.J.; Kim, B.Y.; Shieh, W. Few-mode fiber multi-parameter sensor with distributed temperature and strain discrimination. Opt. Lett. 2015, 40, 1488–1491. [Google Scholar] [CrossRef] [PubMed]
- Xu, Y.; Ren, M.; Lu, Y.; Lu, P.; Bao, X.; Wang, L.; Messaddeq, Y.; LaRochelle, S. Multi-parameter sensor based on stimulated Brillouin scattering in inverse-parabolic graded-index fiber. Opt. Lett. 2016, 41, 1138–1141. [Google Scholar] [CrossRef] [PubMed]
- Bao, X.; Webb, D.J.; Jackson, D.A. Combined distributed temperature and strain sensor based on Brillouin loss in an optical fiber. Opt. Lett. 1994, 19, 141–143. [Google Scholar] [CrossRef] [PubMed]
- Mizuno, Y.; Hayashi, N.; Tanaka, H.; Wada, Y.; Nakamura, K. Brillouin scattering in multi-core optical fibers for sensing applications. Sci. Rep. 2015, 5, 11388. [Google Scholar] [CrossRef] [PubMed]
- Zhao, Z.; Dang, Y.; Tang, M.; Li, B.; Gan, L.; Fu, S.; Wei, H.; Tong, W.; Shum, P.; Liu, D. Spatial-division multiplexed Brillouin distributed sensing based on a heterogeneous multicore fiber. Opt. Lett. 2017, 42, 171–174. [Google Scholar] [CrossRef] [PubMed]
- Jin, W.; Michie, W.C.; Thursby, G.; Konstantaki, M.; Culshaw, B. Simultaneous measurement of strain and temperature: Error analysis. Opt. Eng. 1997, 36, 598–610. [Google Scholar] [CrossRef]
- Li, M.J.; Li, S.; Derick, J.A.; Stone, J.S.; Chow, B.C.; Bennett, K.W.; Sutherlin, D.M. Dual core optical fiber for distributed Brillouin fiber sensors. In Proceedings of the Asia Communications and Photonics Conference, Shanghai, China, 11–14 November 2014. [Google Scholar]
- Chen, K.P.; Zaghloul, M.; Wang, M.; Li, M.J. Dual-Core Fiber Characterizations for Distributed Simultaneous Temperature and Strain Measurements Using Brillouin Optical Time Domain Analysis. In Proceedings of the Asia Pacific Optical Sensors Conference, Shanghai, China, 11–14 October 2016. [Google Scholar]
- Thomson, R.R.; Bookey, H.T.; Psaila, N.D.; Fender, A.; Campbell, S.; Macpherson, W.N.; Barton, J.S.; Reid, D.T.; Kar, A.K. Ultrafast-laser inscription of a three dimensional fan-out device for multicore fiber coupling applications. Opt. Express 2007, 15, 11691–11697. [Google Scholar] [CrossRef] [PubMed]
- Ip, E.; Milione, G.; Li, M.J.; Cvijetic, N.; Kanonakis, K.; Stone, J.; Peng, G.; Prieto, X.; Montero, C.; Moreno, V.; et al. SDM transmission of real-time 10GbE traffic using commercial SFP+ transceivers over 0.5 km elliptical-core few-mode fiber. Opt. Express 2015, 23, 17120–17126. [Google Scholar] [CrossRef] [PubMed]
- Milione, G.; Ip, E.; Li, M.J.; Stone, J.; Peng, G.; Wang, T. Mode crosstalk matrix measurement of a 1 km elliptical core few-mode optical fiber. Opt. Lett. 2016, 41, 2755–2758. [Google Scholar] [CrossRef] [PubMed]
- Milione, G.; Ji, P.; Ip, E.; Li, M.J.; Stone, J.; Peng, G. Real-time Bi-directional 10GbE Transmission using MIMO-less Space-division-multiplexing with Spatial Modes. In Proceedings of the IEEE Optical Fiber Communications Conference and Exhibition (OFC), Anaheim, CA, USA, 20–24 March 2016; pp. 1–3. [Google Scholar]
- Milione, G.; Ip, E.; Huang, Y.K.; Ji, P.; Wang, T.; Li, M.J.; Stone, J.; Peng, G. 1.2-Tb/s MIMO-less transmission over 1 km of four-core elliptical-core few-mode fiber with 125-µm diameter cladding. In Proceedings of the IEEE OptoElectronics and Communications Conference (OECC) Held Jointly with 2016 International Conference on Photonics in Switching (PS), Niigata, Japan, 3–7 July 2016; pp. 1–3. [Google Scholar]
© 2018 by the authors. Licensee MDPI, Basel, Switzerland. This article is an open access article distributed under the terms and conditions of the Creative Commons Attribution (CC BY) license (http://creativecommons.org/licenses/by/4.0/).

