Aerial Coverage Analysis of Cellular Systems at LTE and mmWave Frequencies Using 3D City Models


Abstract
:1. Introduction
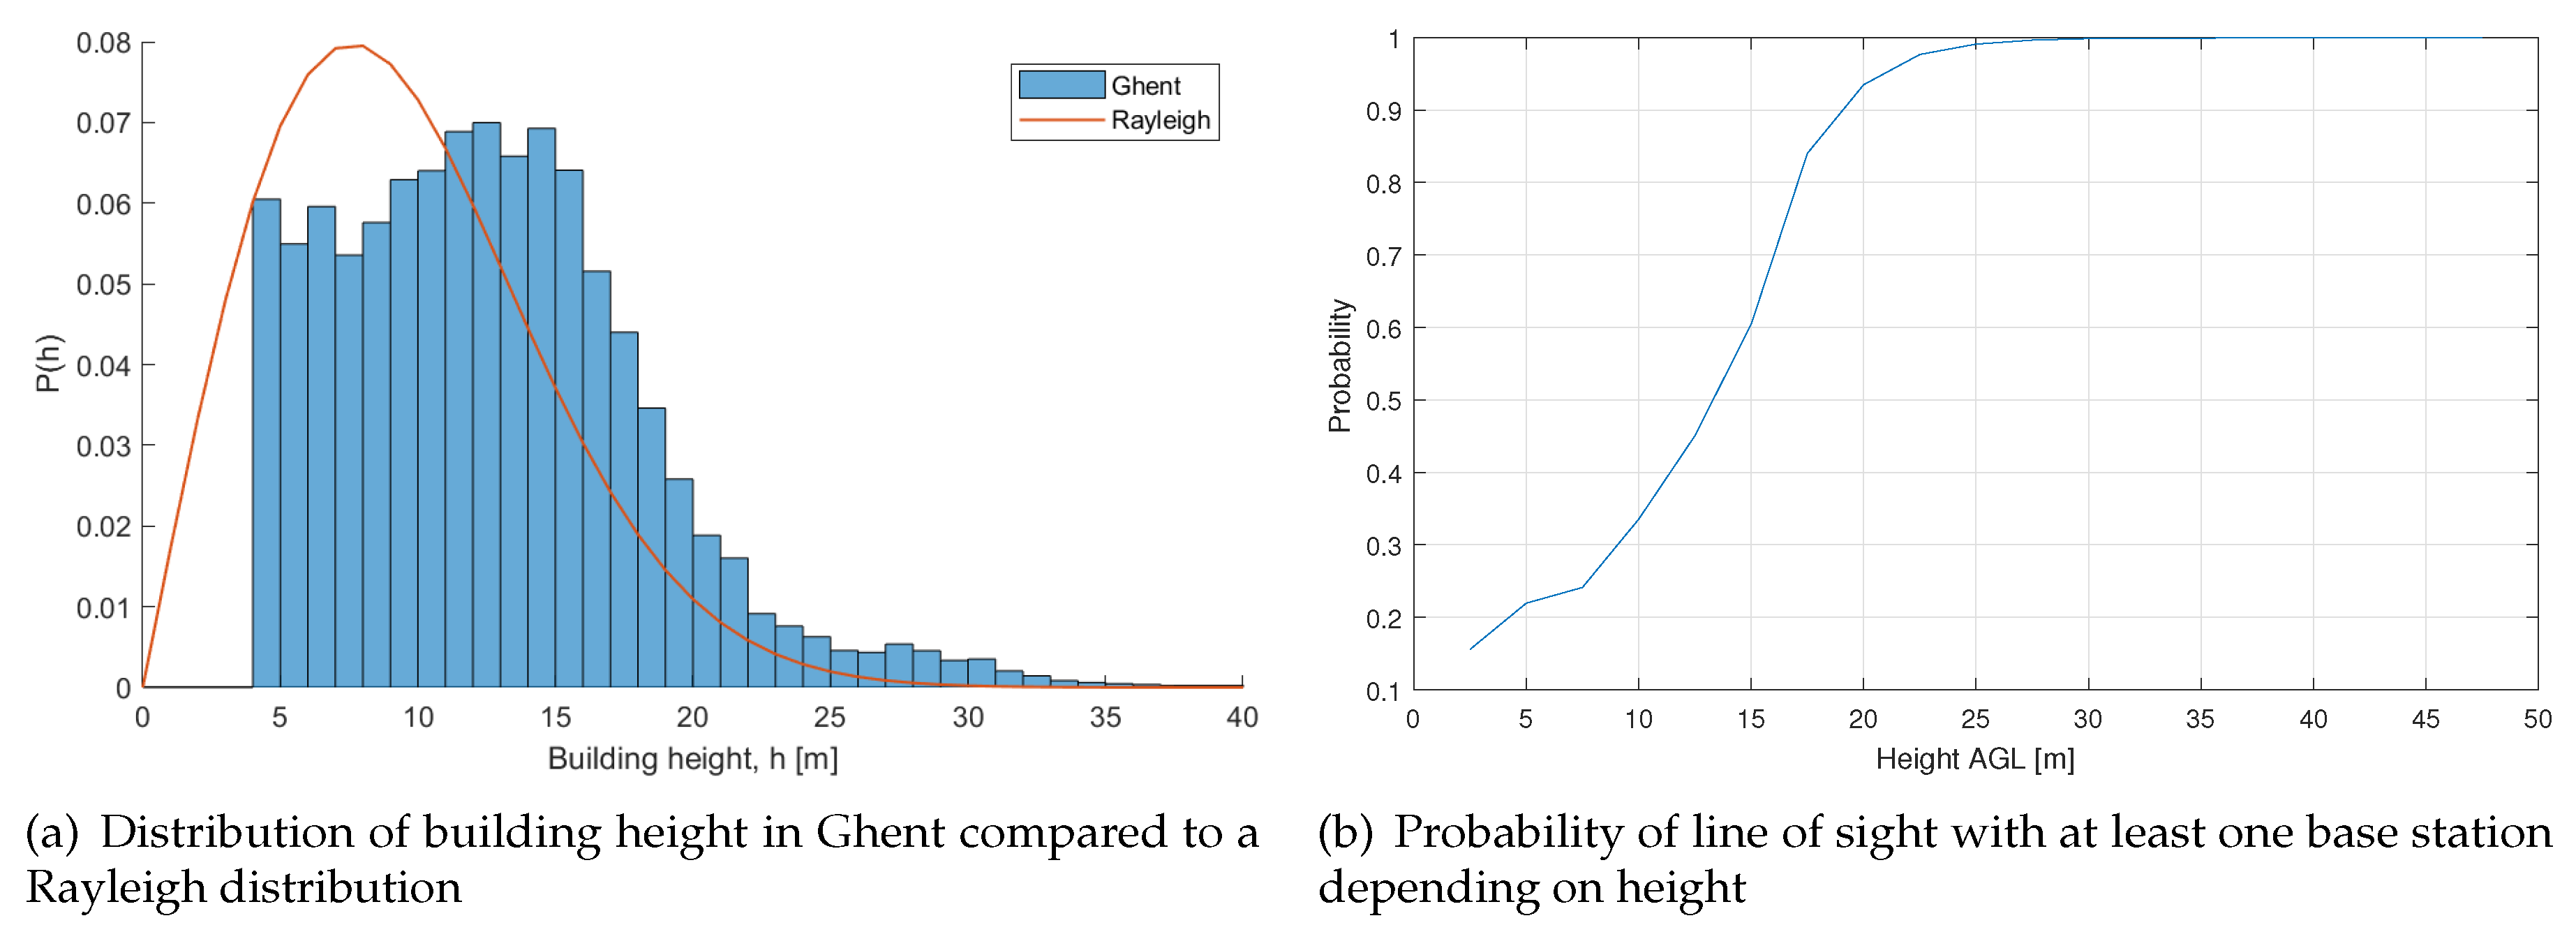
- From what altitude onwards can we assume LOS communication in an urban environment?
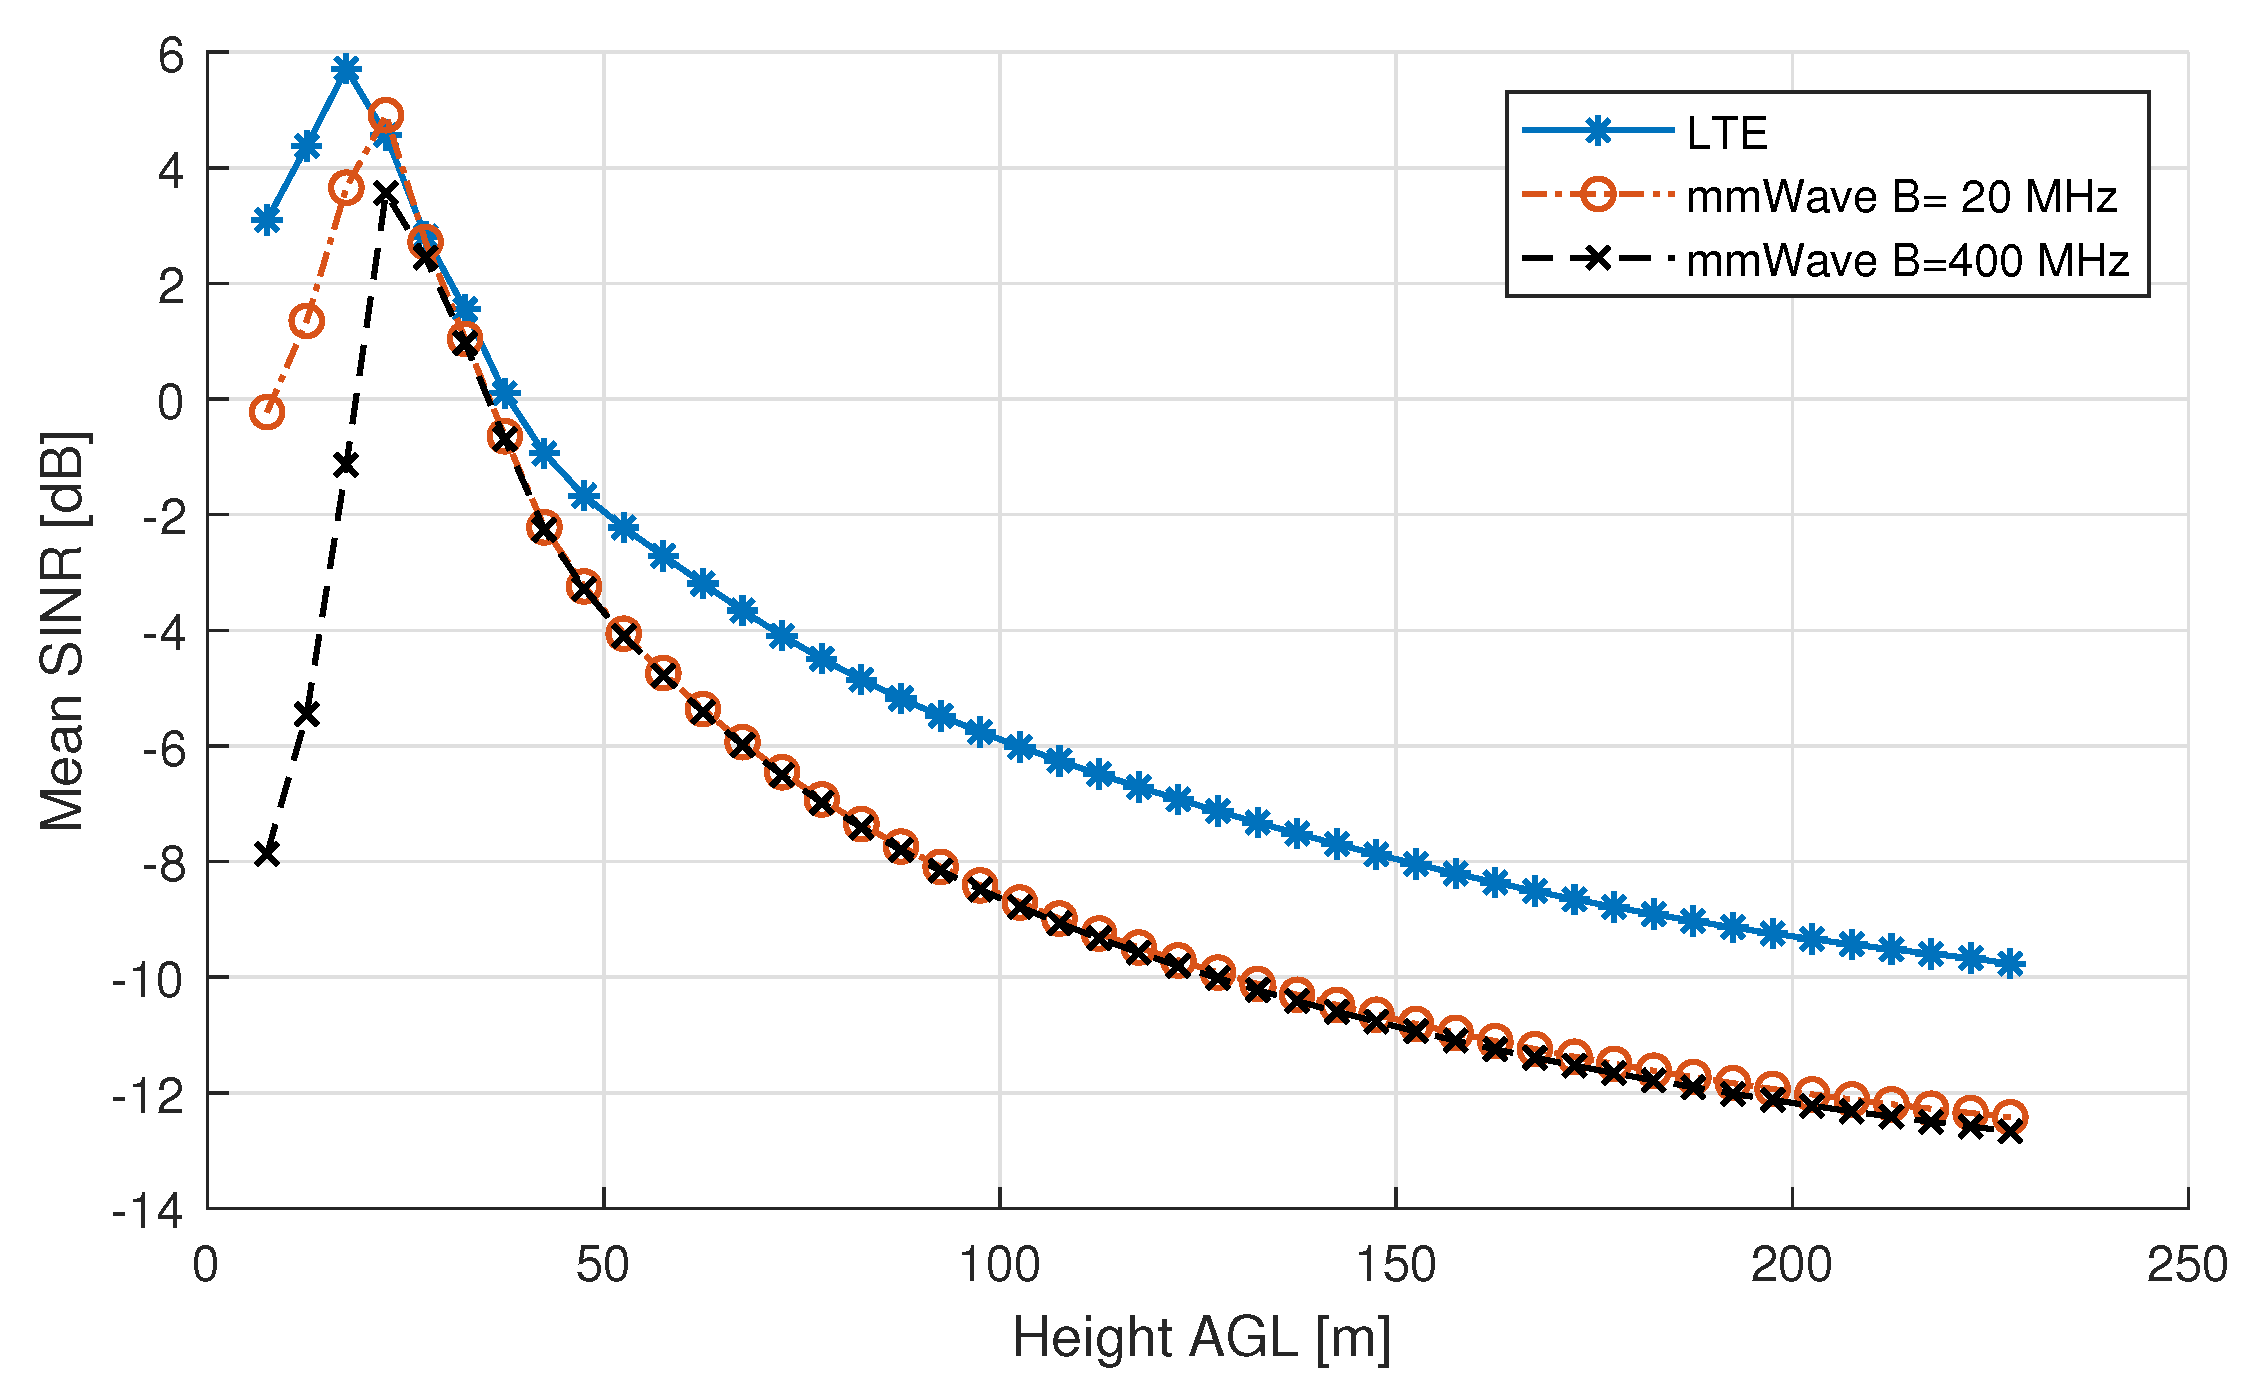
- Is mmWave communication superior to LTE for providing coverage to UAVs, as it enables networks with less interference?
- Can we have a good aerial coverage at mmWave frequencies using the same base station density (as claimed in [15]), or is it necessary to deploy many more cells?
- As mmWave promises cells with more directive antennas, how directional should the antenna array be for optimizing aerial coverage?
2. System Model
2.1. Network Model
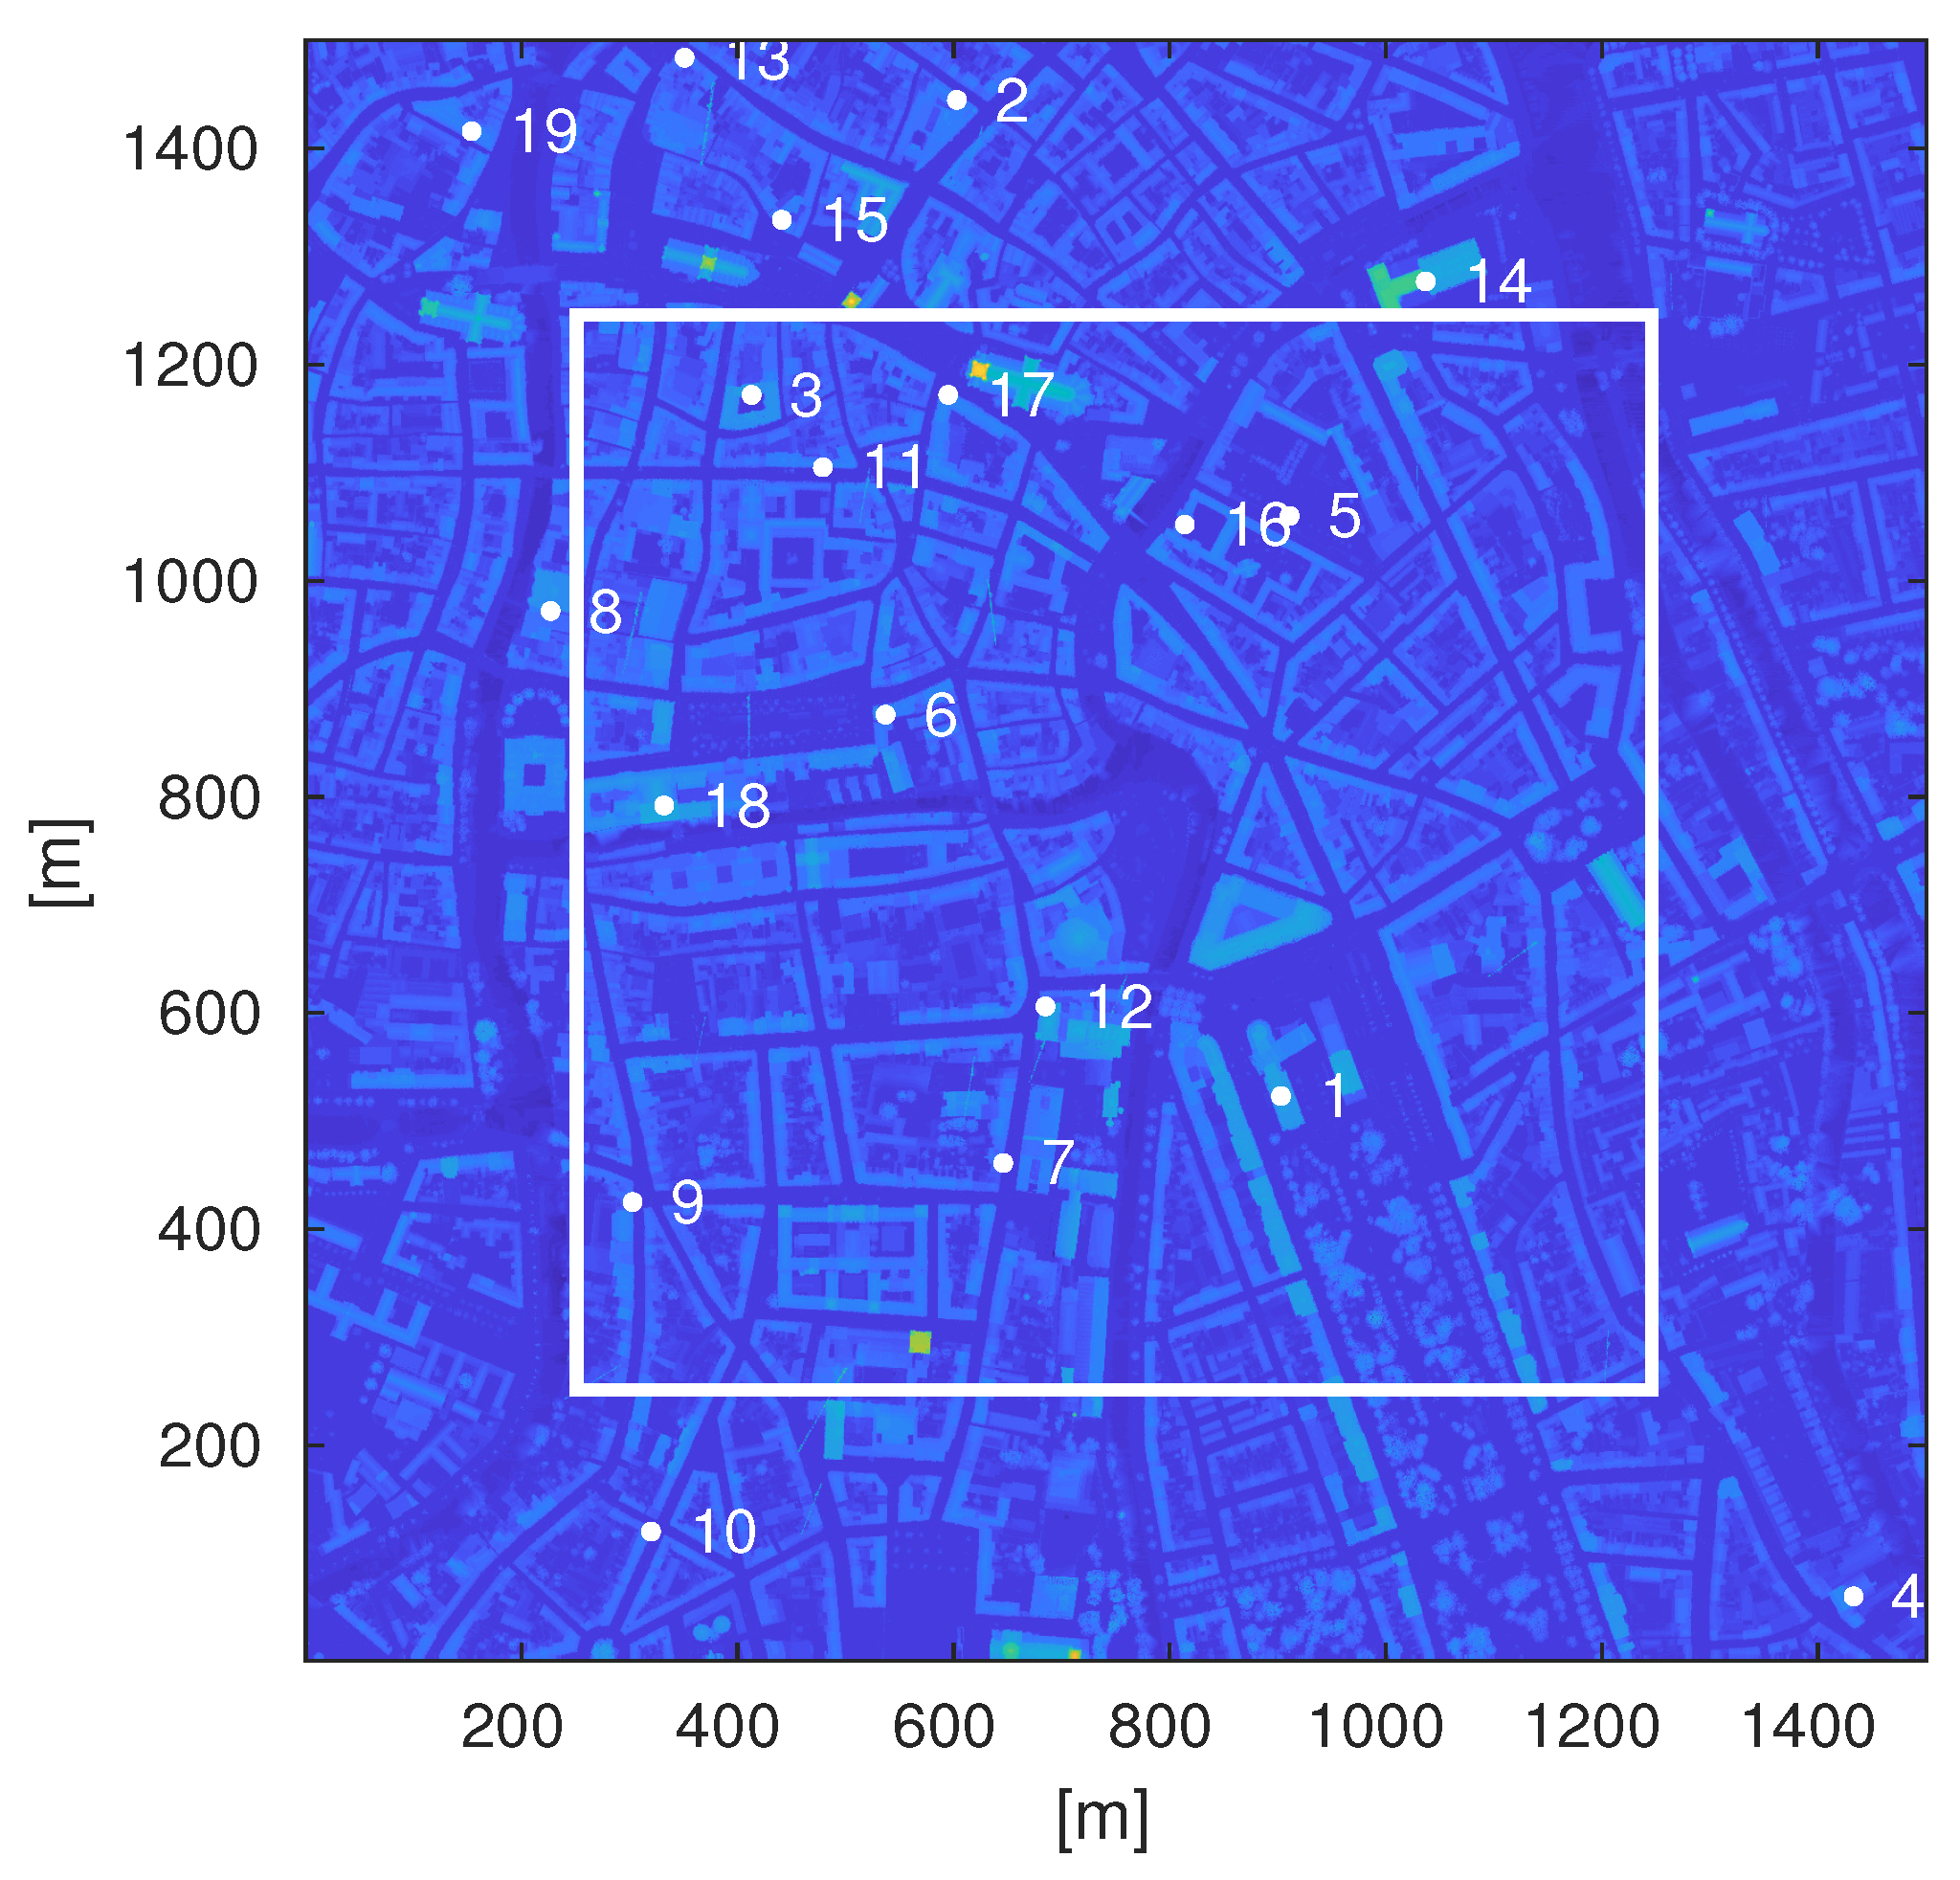
2.1.1. Environment
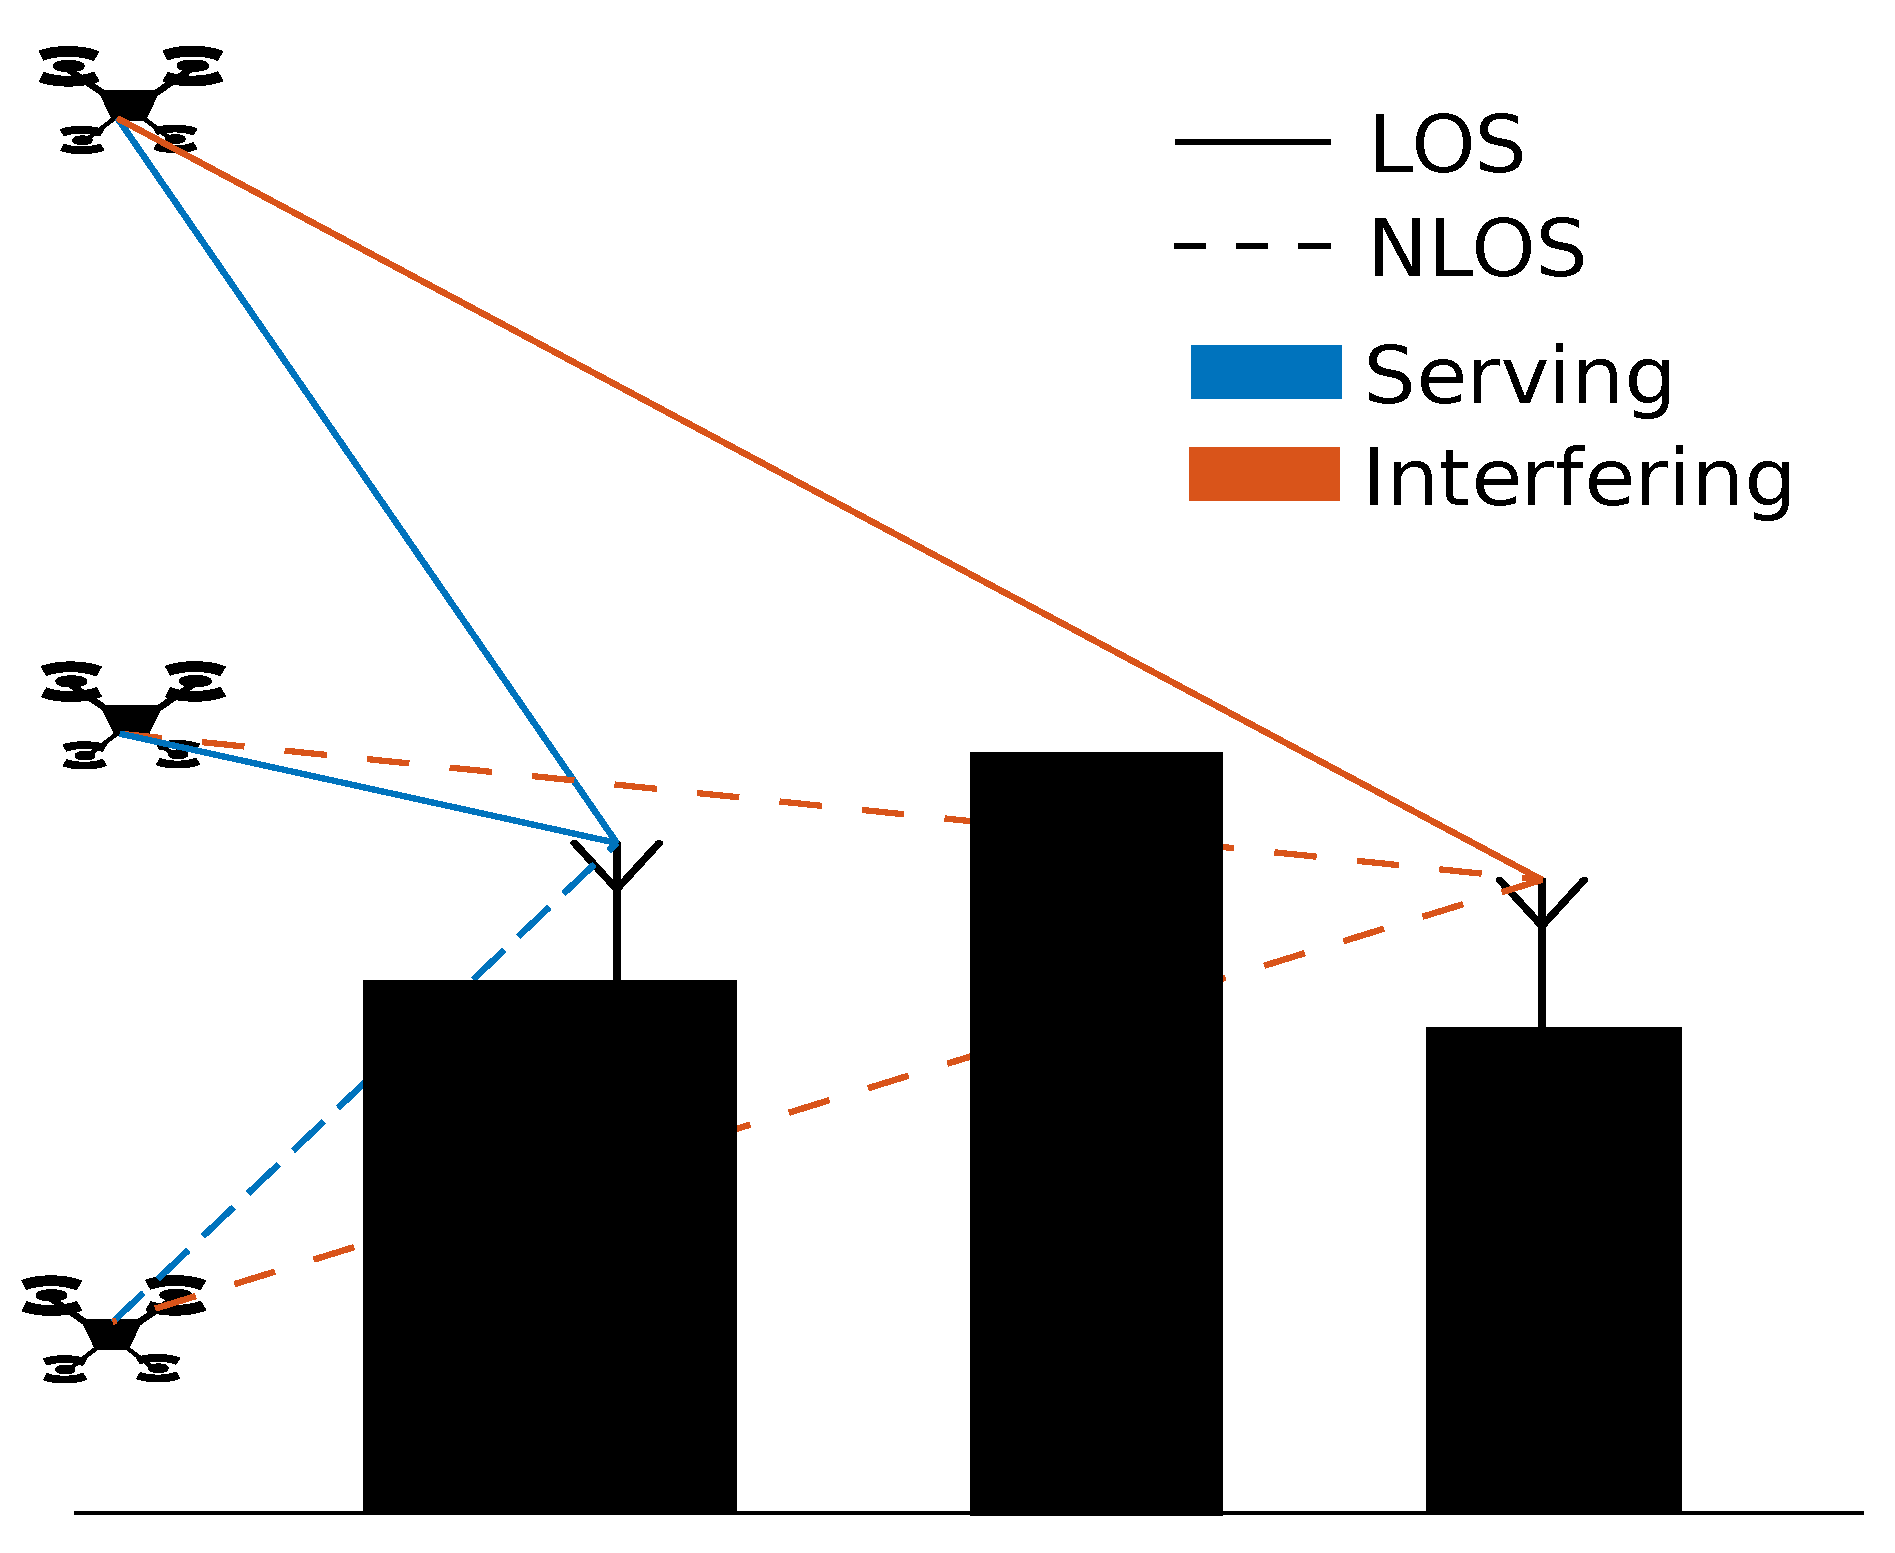
2.1.2. Link Model
2.2. Scenarios
2.2.1. Load Types
2.2.2. Coverage Probability
3. Simulation Results
3.1. Environment Characterization
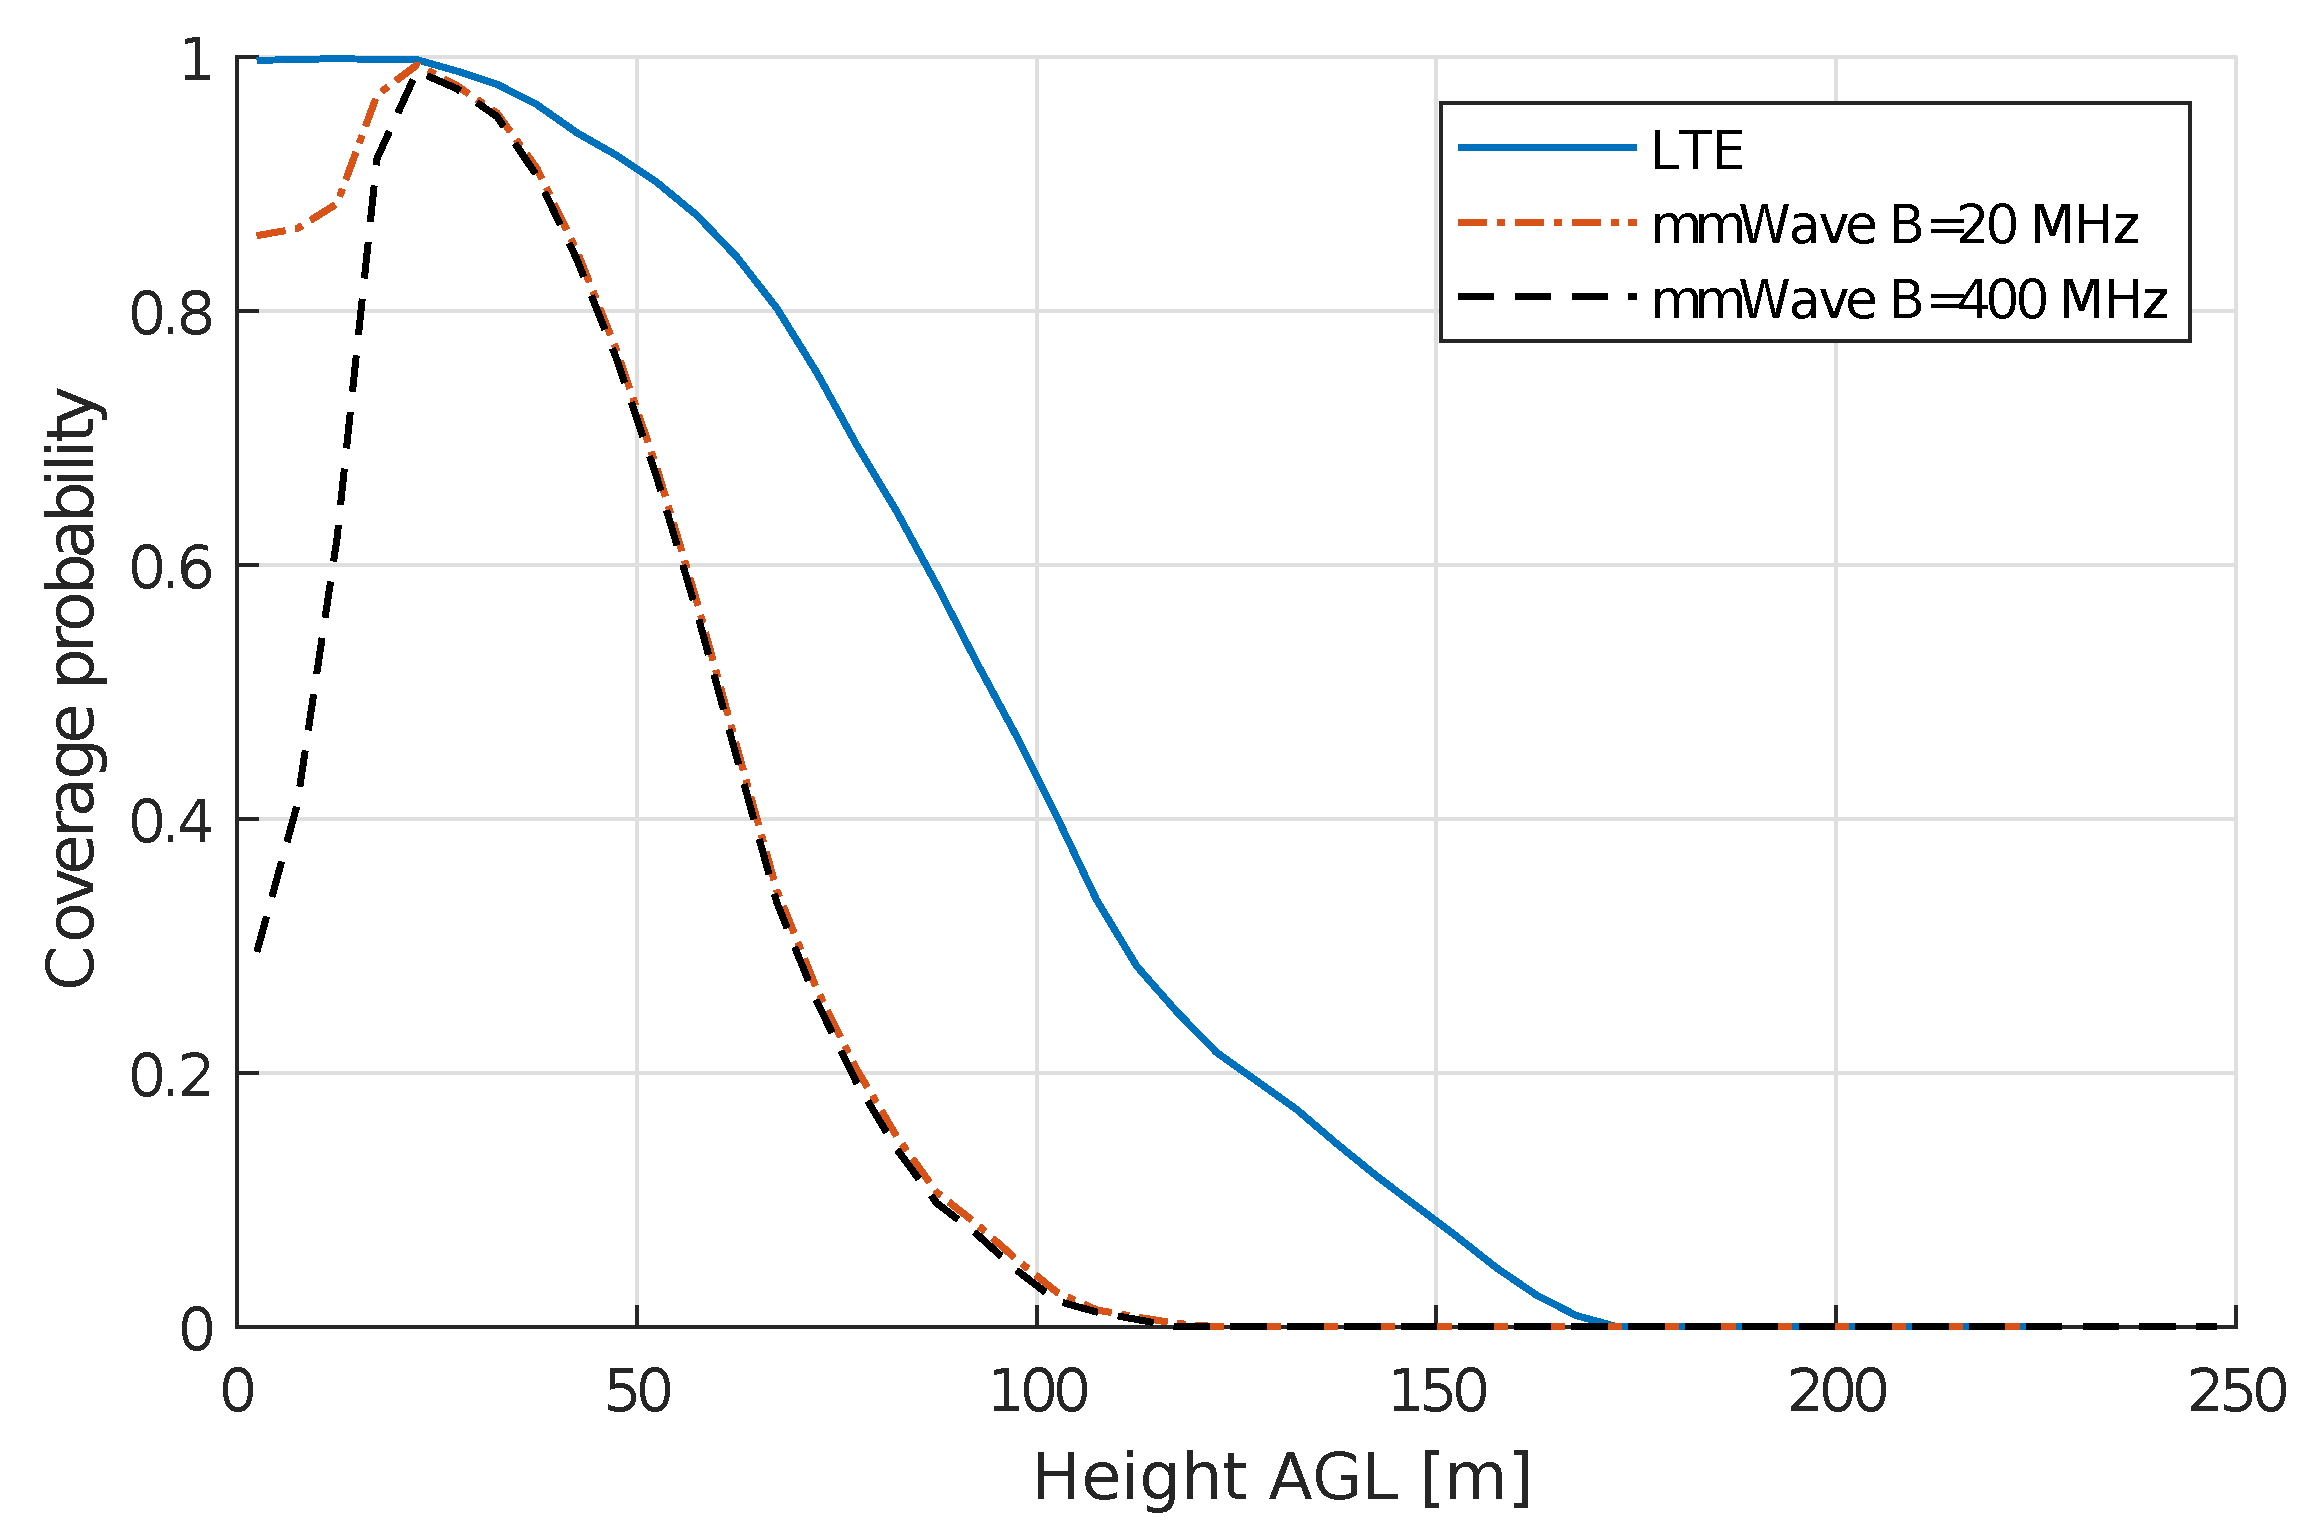
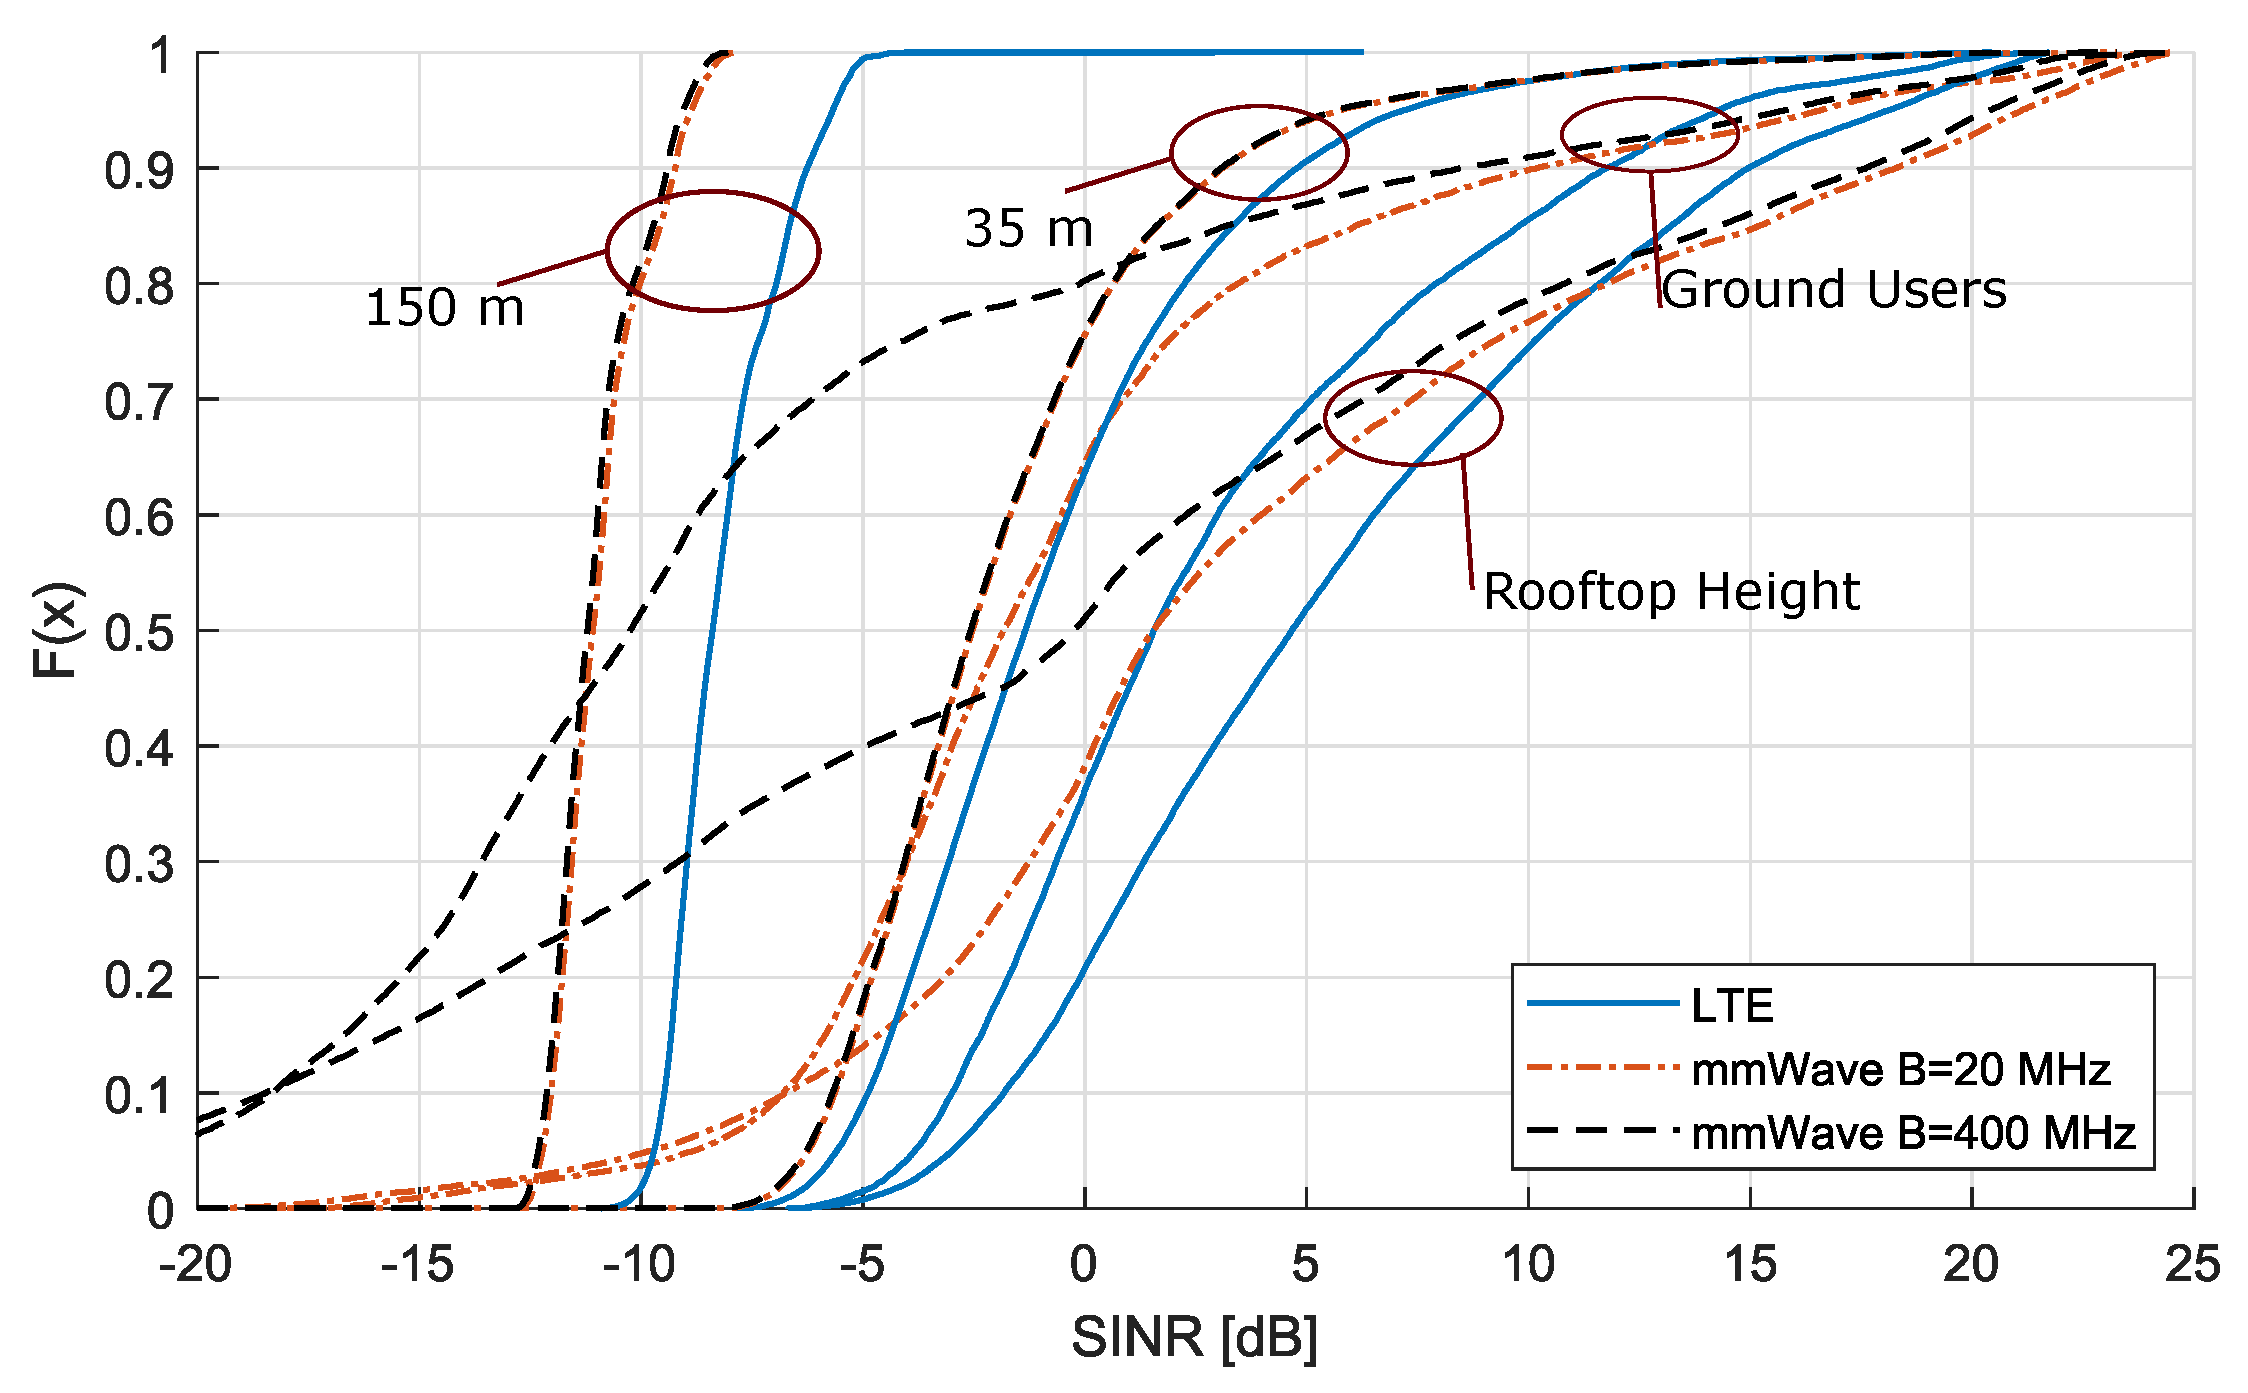
3.2. LTE vs. mmWave
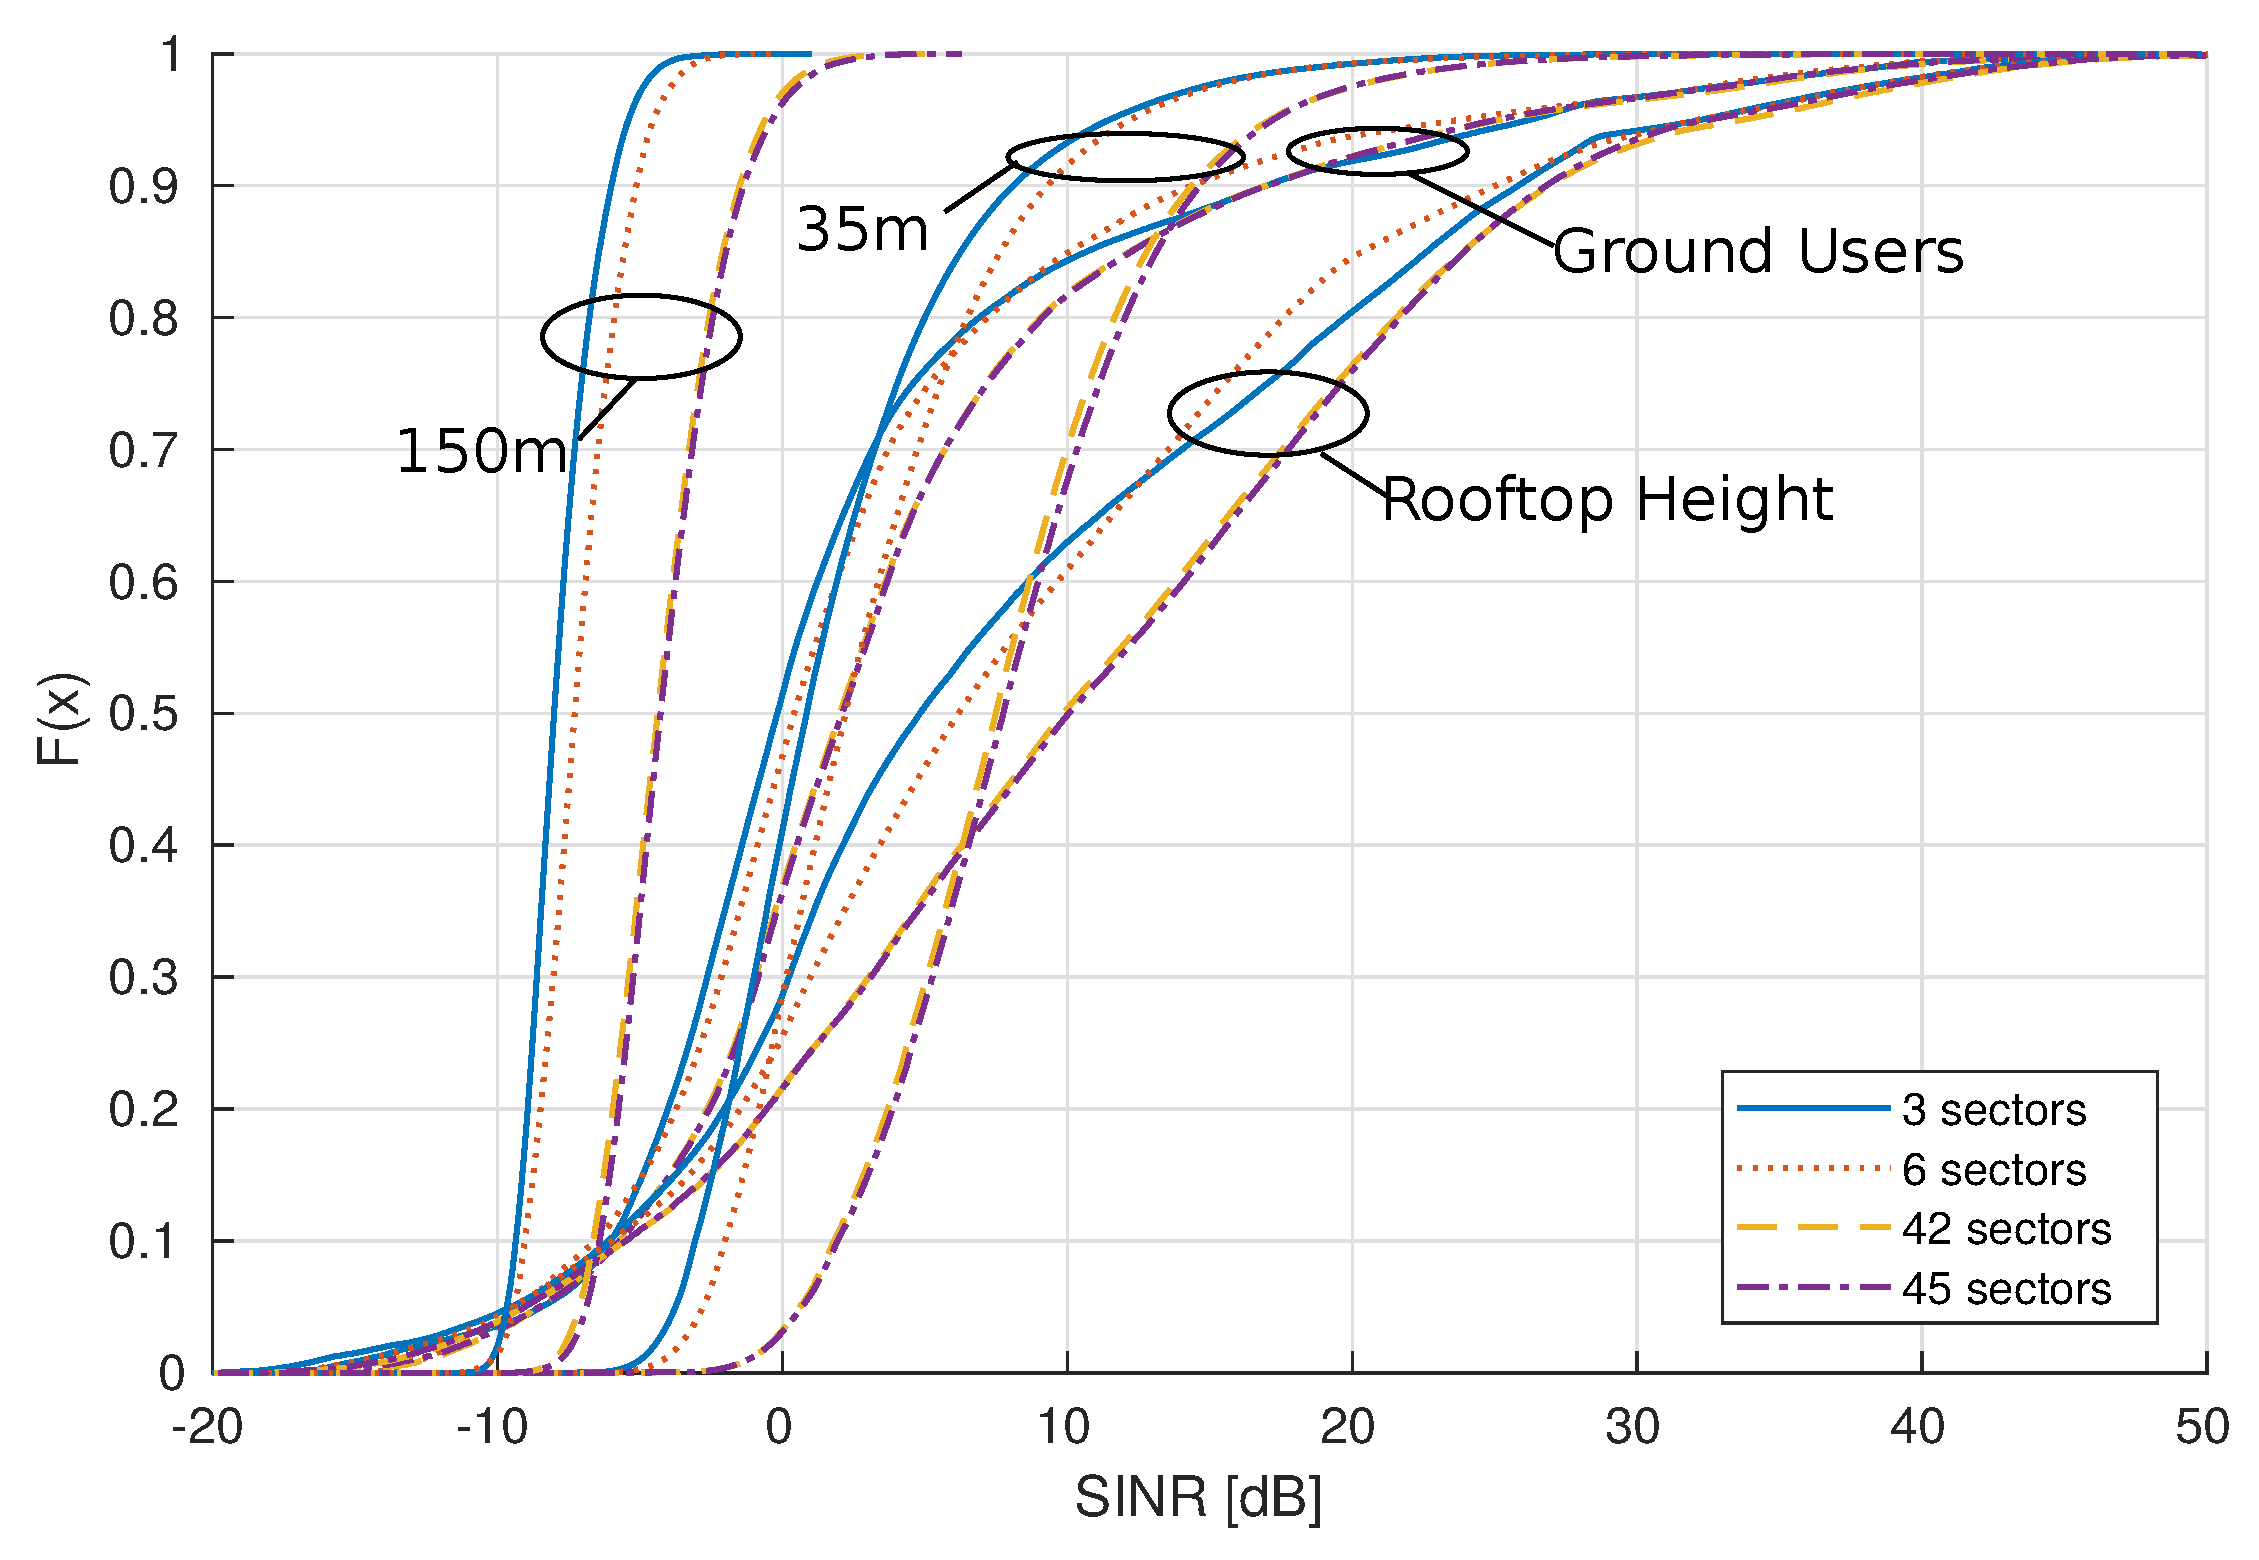
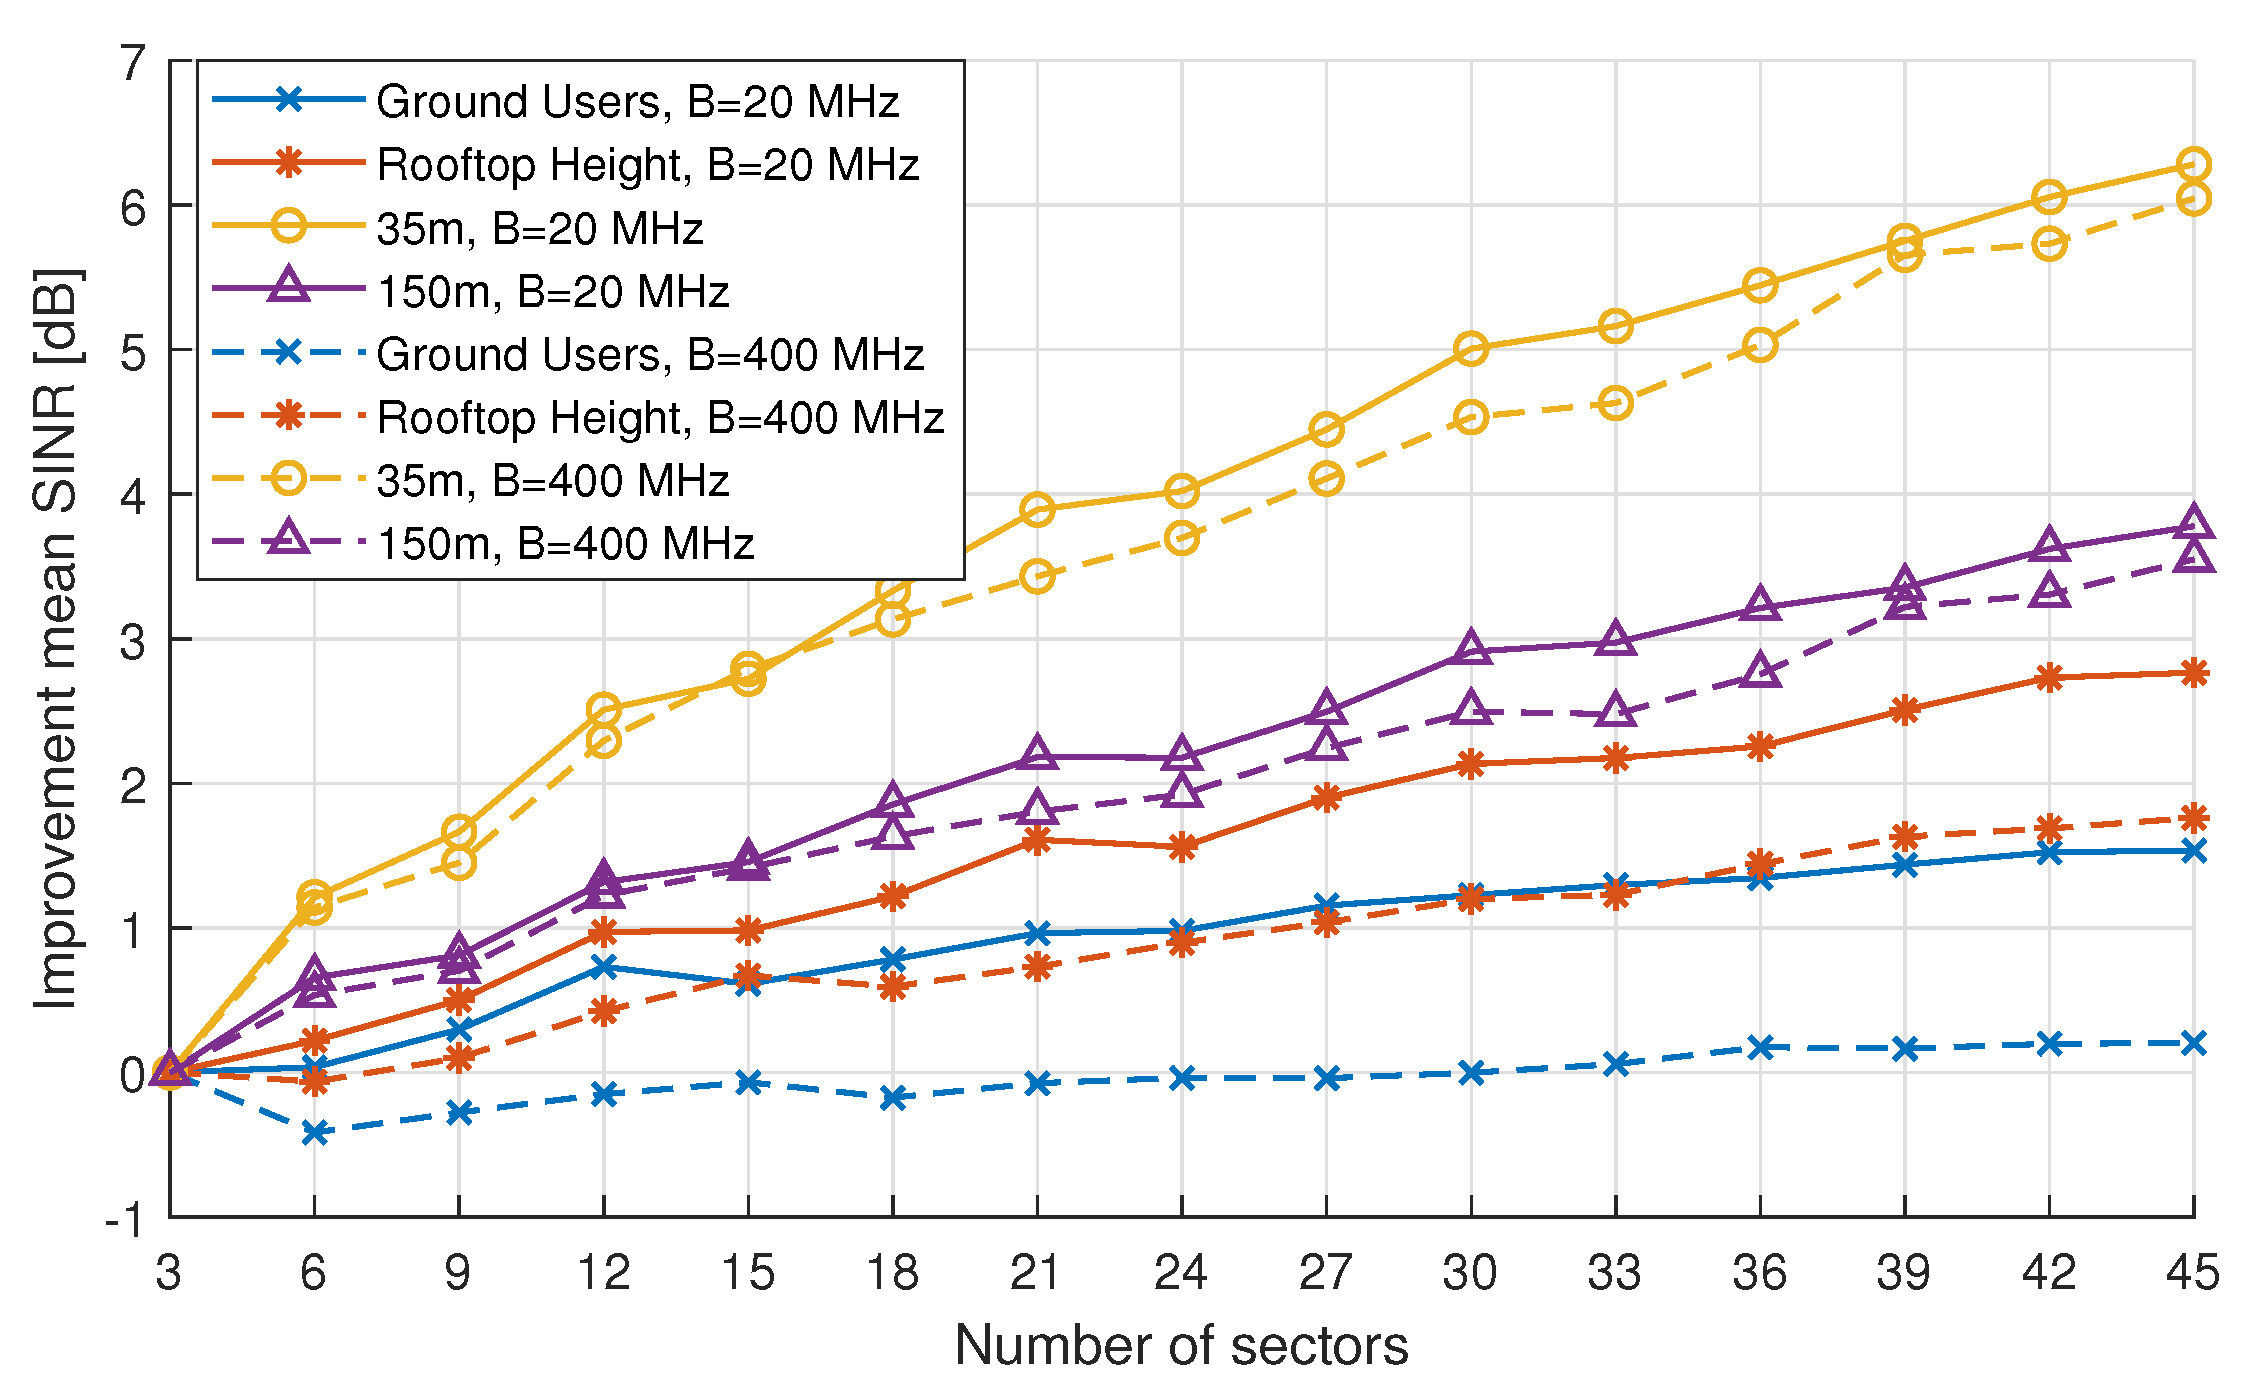
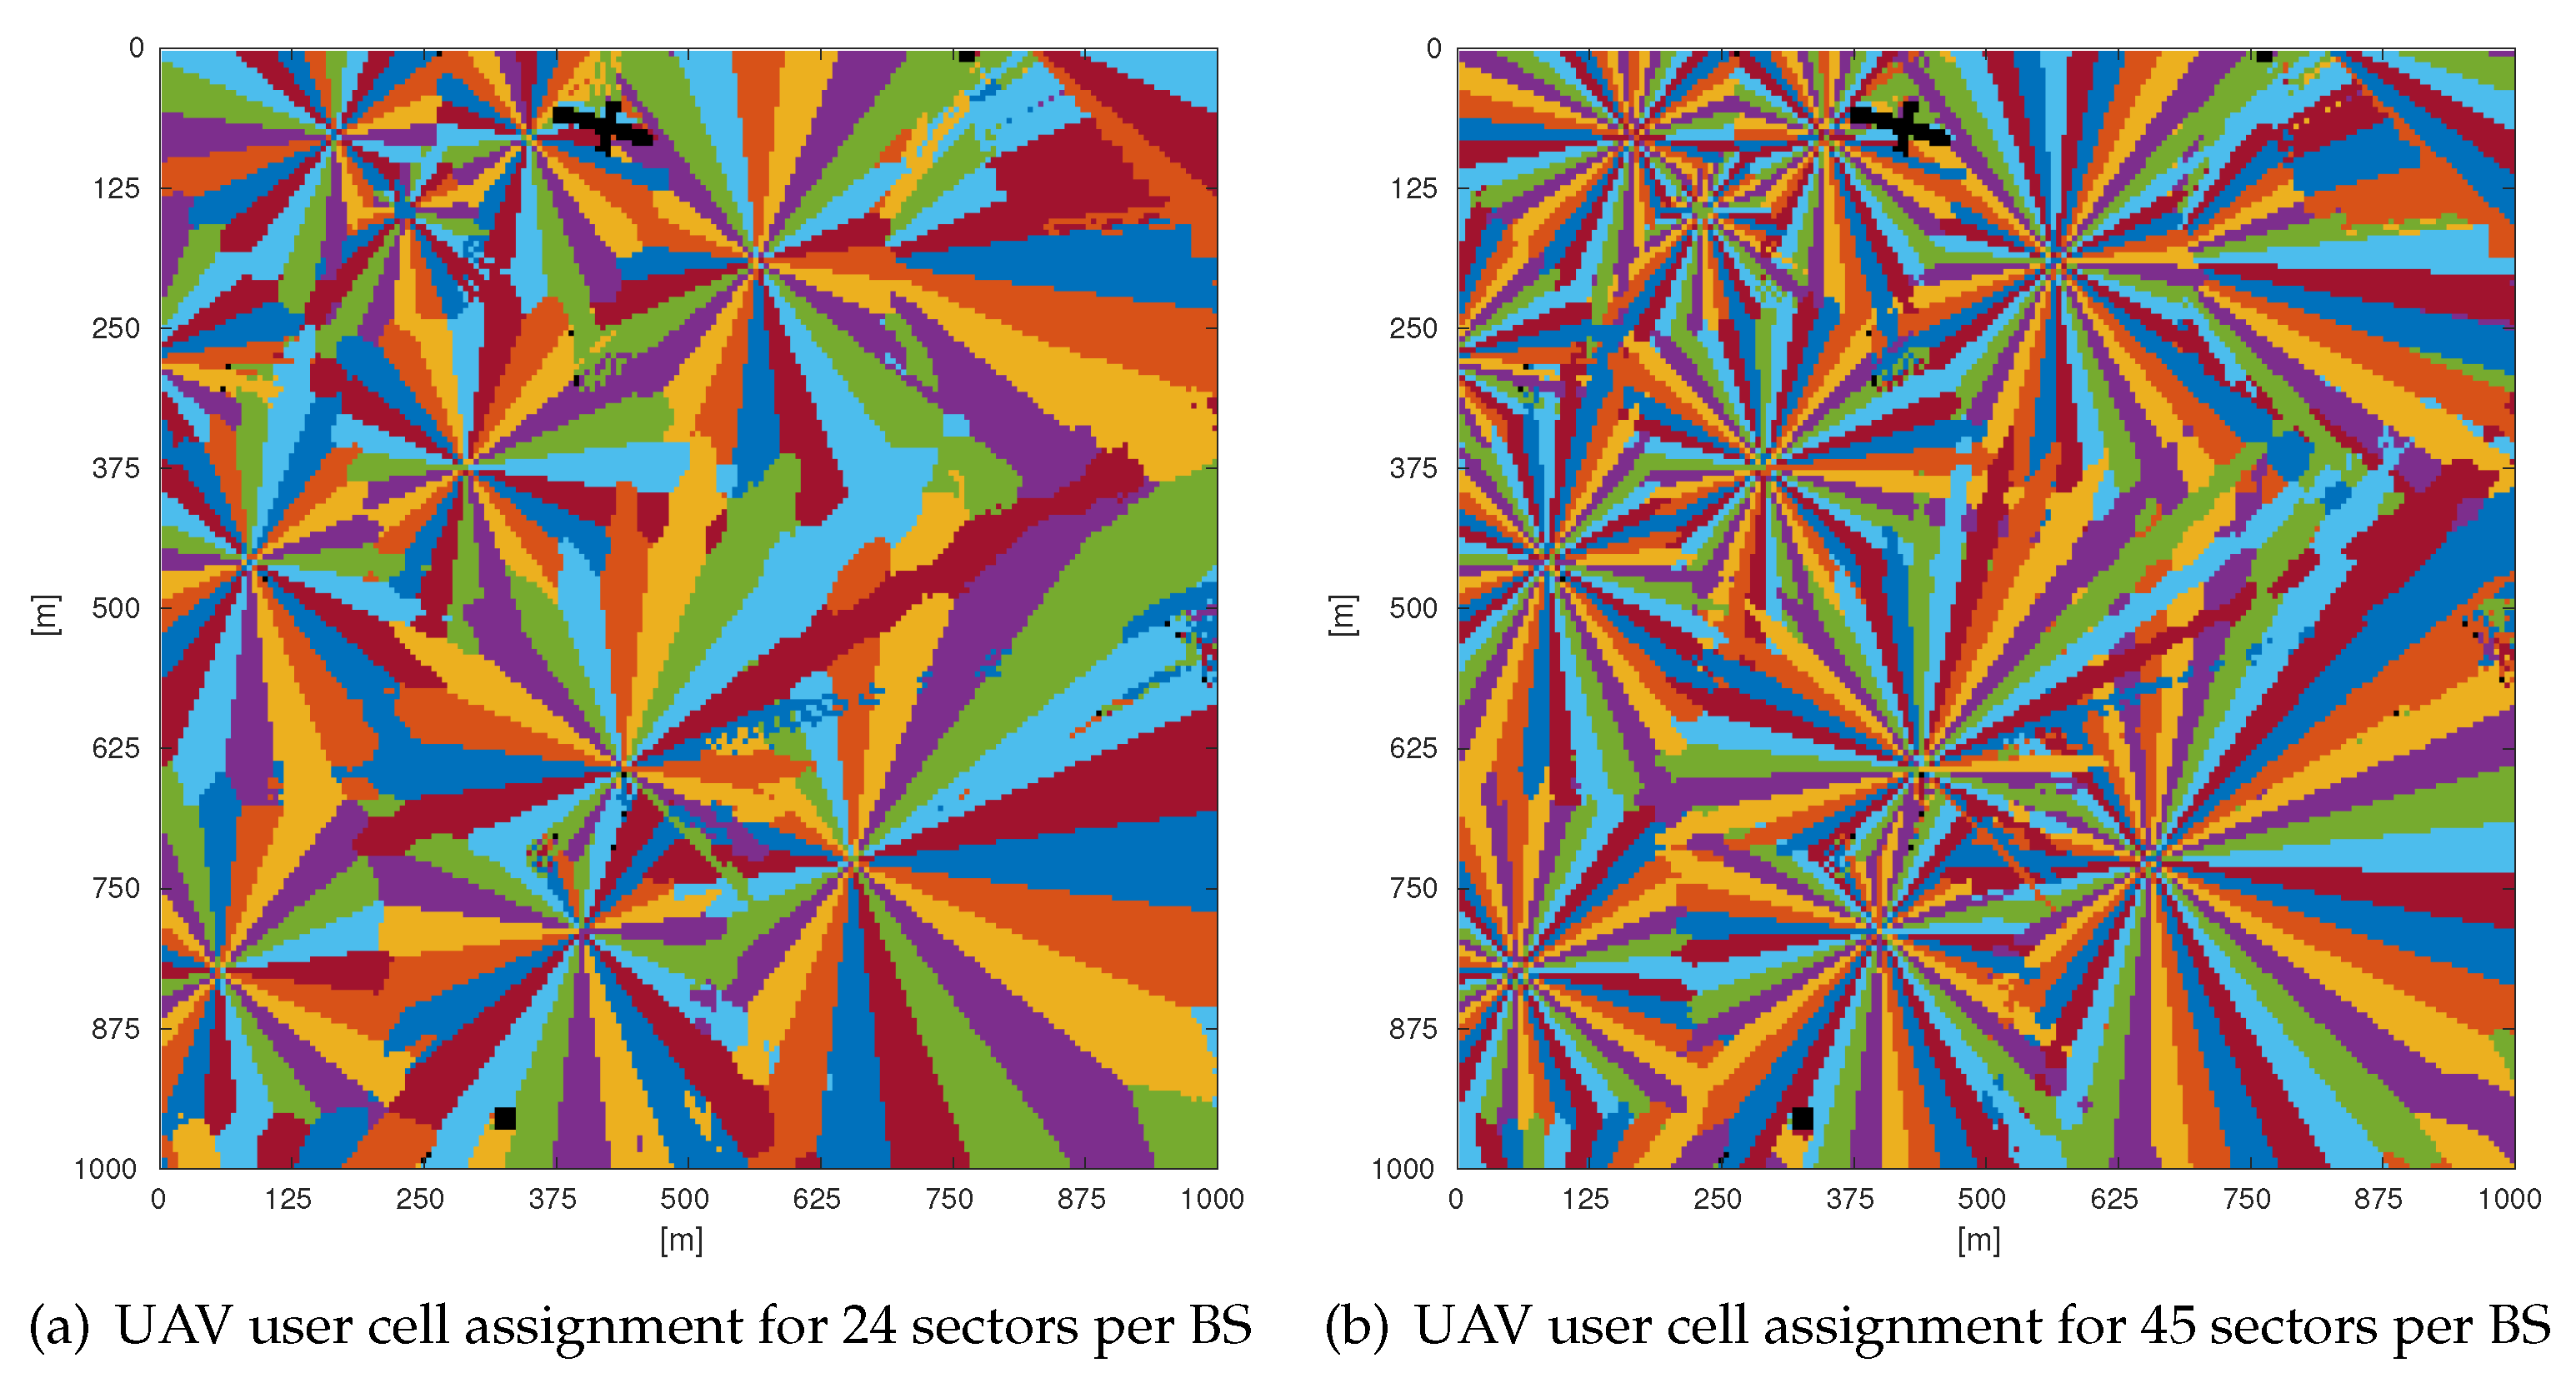
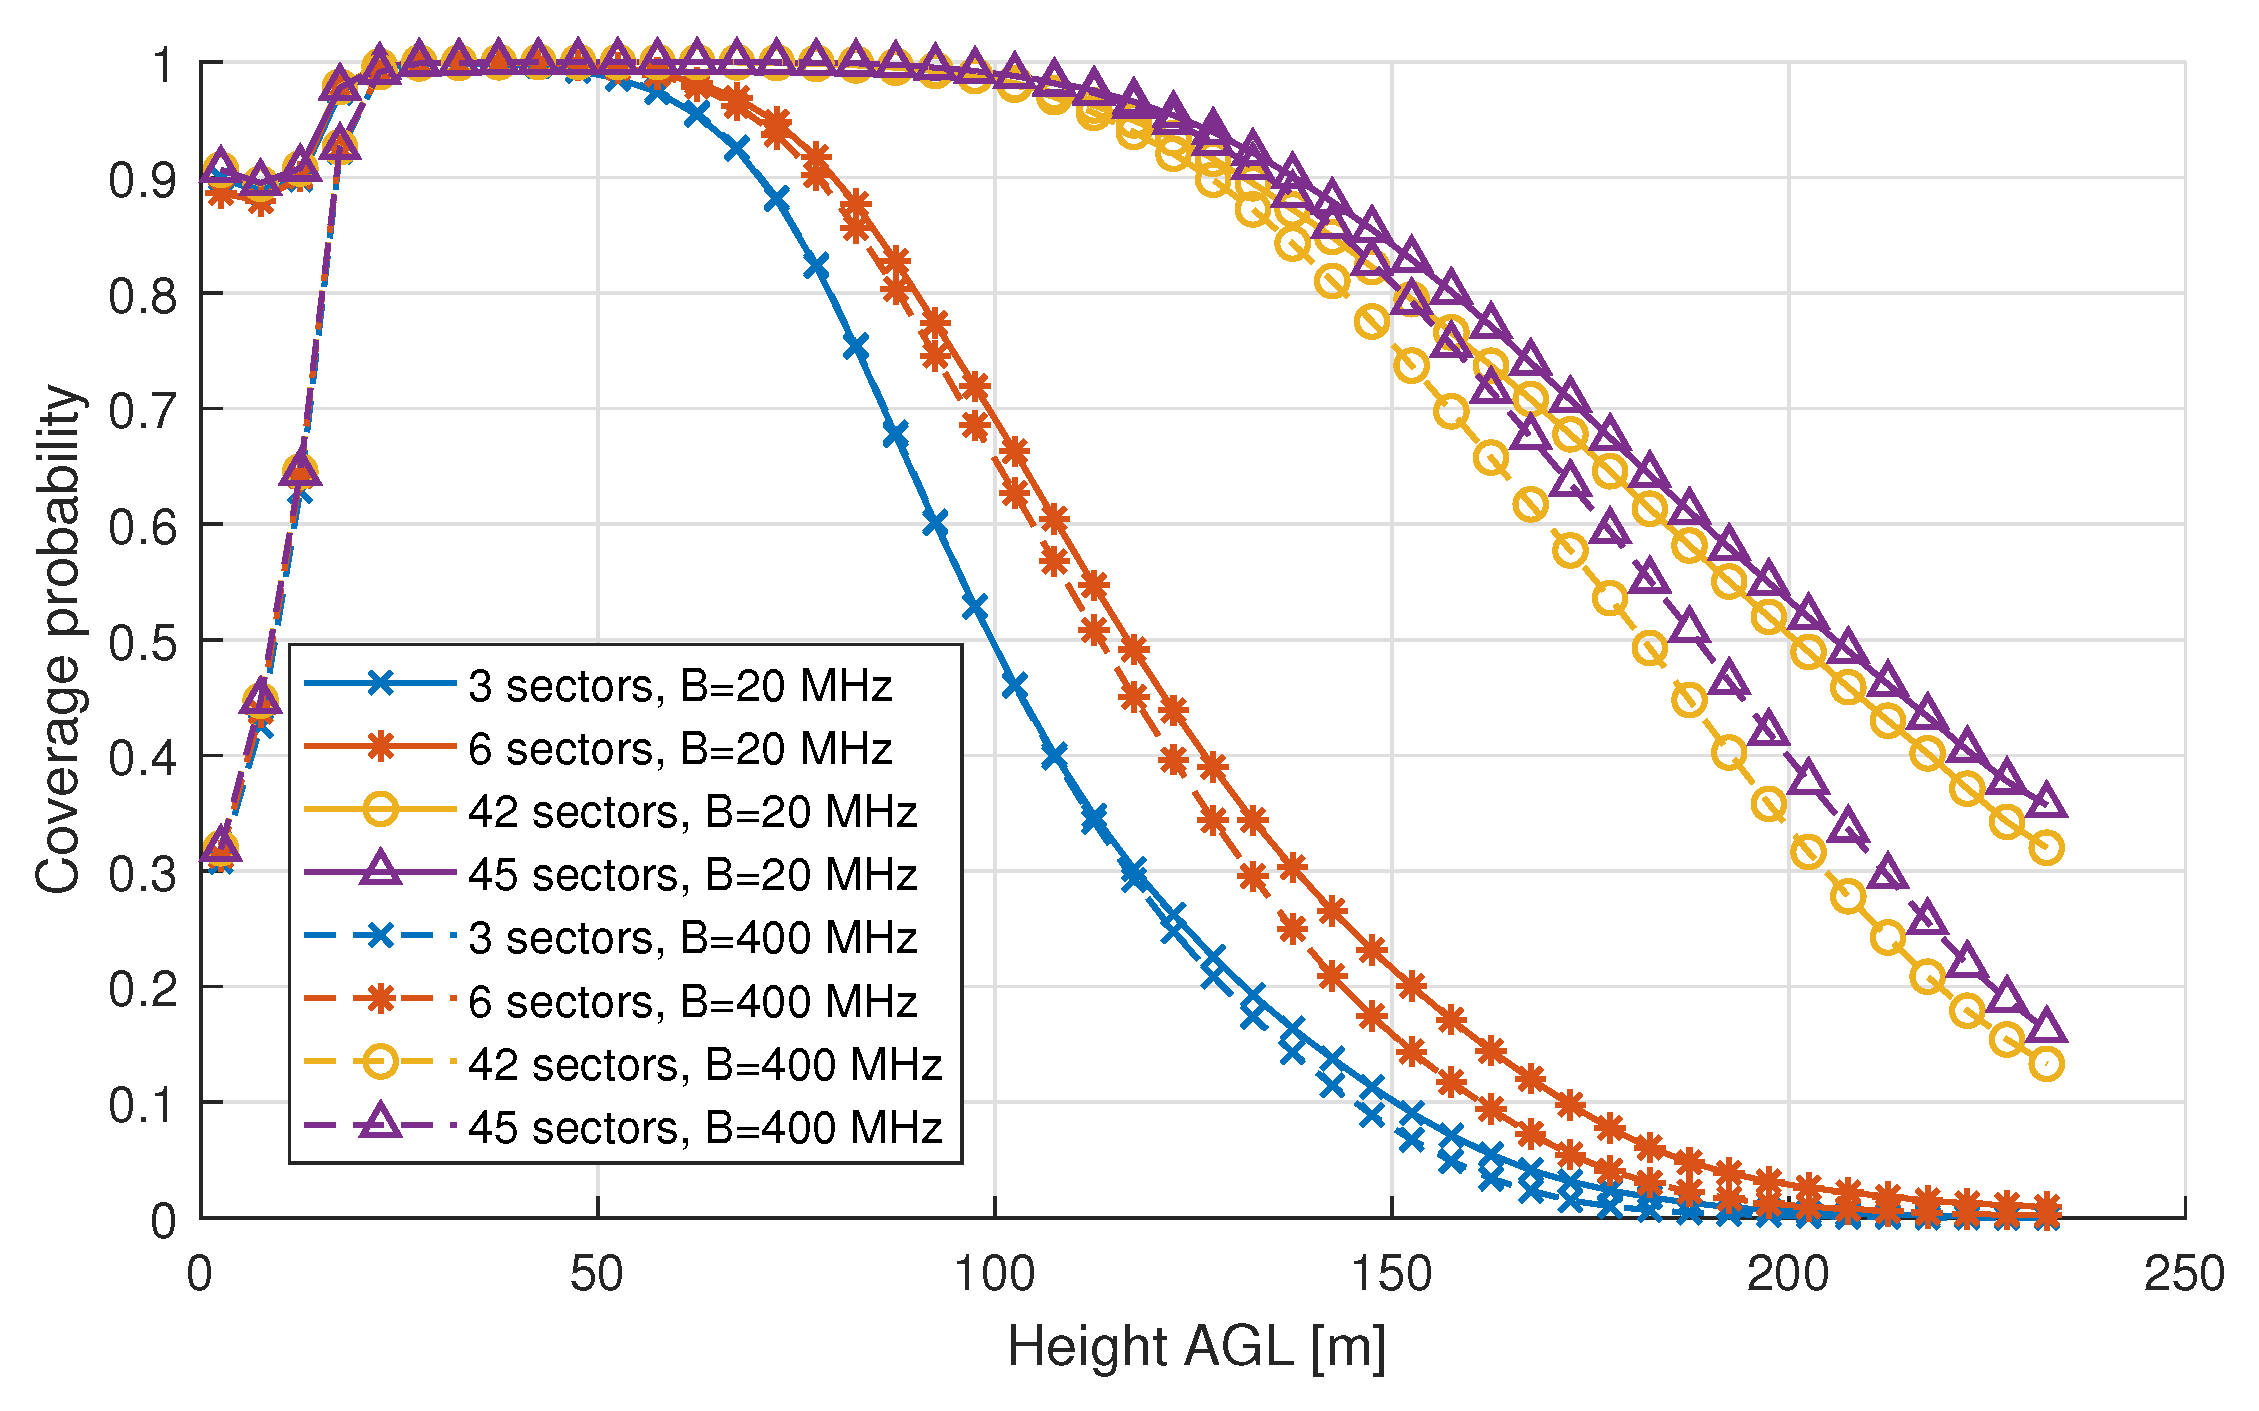
3.3. Interference Management
4. Conclusions and Further Work
Author Contributions
Funding
Acknowledgments
Conflicts of Interest
Abbreviations
| AGL | Above Ground Level |
| AUE | Aerial User Equipment |
| BS | Base Stations |
| LOS | Line-of-Sight |
| LTE | Long-Term Evolution |
| MaMIMO | Massive Multiple Input Multiple Output |
| mmWave | Millimeter wave |
| NLOS | Non-line-of-Sight |
| PL | Path loss |
| SINR | Signal-to-Interference-plus-Noise Ratio |
| UAV | Unmanned Aerial Vehicles |
| UE | User Equipment |
References
- Fly under the Special Rule for Model Aircraft. Available online: https://www.faa.gov/uas/getting_started/model_aircraft/ (accessed on 31 October 2018).
- Fotouhi, A.; Qiang, H.; Ding, M.; Hassan, M.; Giordano, L.G.; García-Rodríguez, A.; Yuan, J. Survey on UAV Cellular Communications: Practical Aspects, Standardization Advancements, Regulation, and Security Challenges. arXiv, 2018; arXiv:1809.01752. [Google Scholar]
- LTE Unmanned Aircraft Systems; Trial Report; Qualcomm Technologies, Inc.: San Diego, CA, USA, 2017.
- Lin, X.; Yajnanarayana, V.; Muruganathan, S.D.; Gao, S.; Asplund, H.; Maattanen, H.; Bergstrom, M.; Euler, S.; Wang, Y.E. The Sky Is Not the Limit: LTE for Unmanned Aerial Vehicles. IEEE Commun. Mag. 2018, 56, 204–210. [Google Scholar] [CrossRef] [Green Version]
- Van Den Bergh, B.; Chiumento, A.; Pollin, S. LTE in the sky: Trading off propagation benefits with interference costs for aerial nodes. IEEE Commun. Mag. 2016, 54, 44–50. [Google Scholar] [CrossRef]
- Nguyen, H.C.; Amorim, R.; Wigard, J.; Kovács, I.Z.; Sørensen, T.B.; Mogensen, P.E. How to Ensure Reliable Connectivity for Aerial Vehicles Over Cellular Networks. IEEE Access 2018, 6, 12304–12317. [Google Scholar] [CrossRef]
- Azari, M.M.; Rosas, F.; Chiumento, A.; Pollin, S. Coexistence of Terrestrial and Aerial Users in Cellular Networks. In Proceedings of the 2017 IEEE Globecom Workshops (GC Wkshps), Singapore, 4–8 December 2017; pp. 1–6. [Google Scholar] [CrossRef]
- Azari, M.M.; Rosas, F.; Pollin, S. Reshaping Cellular Networks for the Sky: The Major Factors and Feasibility. In Proceedings of the 2018 IEEE International Conference on Communications, Kansas City, MO, USA, 20–24 May 2018. [Google Scholar]
- Challita, U.; Saad, W.; Bettstetter, C. Cellular-Connected UAVs over 5G: Deep Reinforcement Learning for Interference Management. arXiv, 2018; arXiv:1801.05500. [Google Scholar]
- Zeng, Y.; Jin, S.; Wu, Q.; Gao, F. Network-connected UAV communications. China Commun. 2018, 15, iii–v. [Google Scholar] [CrossRef]
- Rangan, S.; Rappaport, T.S.; Erkip, E. Millimeter-Wave Cellular Wireless Networks: Potentials and Challenges. Proc. IEEE 2014, 102, 366–385. [Google Scholar] [CrossRef]
- Xiao, Z.; Xia, P.; Xia, X. Enabling UAV cellular with millimeter-wave communication: potentials and approaches. IEEE Commun. Mag. 2016, 54, 66–73. [Google Scholar] [CrossRef] [Green Version]
- Kulkarni, M.N.; Singh, S.; Andrews, J.G. Coverage and rate trends in dense urban mmWave cellular networks. In Proceedings of the 2014 IEEE Global Communications Conference, Austin, TX, USA, 8–12 December 2014; pp. 3809–3814. [Google Scholar] [CrossRef]
- Singh, S.; Kulkarni, M.N.; Ghosh, A.; Andrews, J.G. Tractable Model for Rate in Self-Backhauled Millimeter Wave Cellular Networks. IEEE J. Sel. Areas Commun. 2015, 33, 2196–2211. [Google Scholar] [CrossRef] [Green Version]
- AT&T is Deploying White Box Hardware in Cell Towers to Power Mobile 5G Era. Available online: https://about.att.com/story/att_deploying_white_box_hardware_in_cell_towers.html (accessed on 31 October 2018).
- NR; Base Station (BS) Radio Transmission and Reception; Technical Specification 38.104; 3GPP: Sophia Antipolis, France, 2018.
- Rappaport, T.S.; Gutierrez, F.; Ben-Dor, E.; Murdock, J.N.; Qiao, Y.; Tamir, J.I. Broadband Millimeter-Wave Propagation Measurements and Models Using Adaptive-Beam Antennas for Outdoor Urban Cellular Communications. IEEE Trans. Antennas Propag. 2013, 61, 1850–1859. [Google Scholar] [CrossRef]
- Maccartney, G.R.; Rappaport, T.S.; Samimi, M.K.; Sun, S. Millimeter-Wave Omnidirectional Path Loss Data for Small Cell 5G Channel Modeling. IEEE Access 2015, 3, 1573–1580. [Google Scholar] [CrossRef]
- Rappaport, T.S.; MacCartney, G.R.; Samimi, M.K.; Sun, S. Wideband Millimeter-Wave Propagation Measurements and Channel Models for Future Wireless Communication System Design. IEEE Trans. Commun. 2015, 63, 3029–3056. [Google Scholar] [CrossRef]
- Radio Frequency (RF) System Scenarios; Technical Report 36.942; 3GPP: Sophia Antipolis, France, 2018.
- Agentschap voor Geografische Informatie Vlaanderen: Standaardproducten Digitaal Hoogtemodel Vlaanderen II. Available online: https://download.agiv.be/Producten/Detail?id=966&title=Standaardproducten_Digitaal_Hoogtemodel_Vlaanderen_II (accessed on 26 July 2018).
- Belgisch Instituut Voor Postdiensten en Telecommunicatie, Antennewebsite BIPT. Available online: http://www.bipt.be/nl/operatoren/radio/antennes-gedeeld-antennegebruik/antennewebsite-bipt (accessed on 26 July 2018).
- Reference Radiation Patterns of Omnidirectional, Sectoral and Other Antennas for the Fixed and Mobile Service for Use in Sharing Studies in the Frequency Range from 400 MHz to about 70 GHz; Recommendation F.1336; ITU-R: Geneva, Switzerland, 2014.
- Study on Channel Model for Frequencies from 0.5 to 100 GHz; Technical Report 38.901; 3GPP: Sophia Antipolis, France, 2017.
- Enhanced LTE Support for Aerial Vehicles; Technical Report 36.777; 3GPP: Sophia Antipolis, France, 2017.
- Nguyen, H.C.; Amorim, R.; Wigard, J.; Kovacs, I.Z.; Mogensen, P. Using LTE Networks for UAV Command and Control Link: A Rural-Area Coverage Analysis. In Proceedings of the 2017 IEEE 86th Vehicular Technology Conference (VTC-Fall), Toronto, ON, Canada, 24–27 September 2017; pp. 1–6. [Google Scholar] [CrossRef]
- Muruganathan, S.D.; Lin, X.; Maattanen, H.; Zou, Z.; Hapsari, W.A.; Yasukawa, S. An Overview of 3GPP Release-15 Study on Enhanced LTE Support for Connected Drones. arXiv, 2018; arXiv:1805.00826. [Google Scholar]
- Propagation Data and Prediction Methods Required for the Design of Terrestrial Broadband Radio Access Systems Operating in a Frequency Range from 3 to 60 GHz; Recommendation P.1410-5; ITU-R: Geneva, Switzerland, 2013.
- Azari, M.M.; Rosas, F.; Chiumento, A.; Ligata, A.; Pollin, S. Uplink performance analysis of a drone cell in a random field of ground interferers. In Proceedings of the 2018 IEEE Wireless Communications and Networking Conference (WCNC), Barcelona, Spain, 15–18 April 2018; pp. 1–6. [Google Scholar] [CrossRef]


| Parameters | Values |
|---|---|
| Carrier frequencies | 1.8 GHz, 38 GHz |
| Signal bandwidth, B | 20 MHz, 400 MHz |
| White noise power density, [20] | −174 dBm/Hz |
| UE noise figure, F [20] | 9 dB |
| Active ground user density, | 20 users/km |
| # iterations | 100 |
| # Sectors per BS | 3 | 6 | 9 | 12 | 15 | 18 | 21 | 24 | 27 | 30 | 33 | 36 | 39 | 42 | 45 |
|---|---|---|---|---|---|---|---|---|---|---|---|---|---|---|---|
| 65 | 32.5 | 21.67 | 16.25 | 13 | 10.83 | 9.29 | 8.13 | 7.22 | 6.5 | 5.91 | 5.42 | 5 | 4.64 | 4.33 | |
| 18 | 21.01 | 22.77 | 24.02 | 24.99 | 25.78 | 26.45 | 27.03 | 27.54 | 28 | 28.41 | 28.79 | 29.14 | 29.46 | 29.76 | |
| 46 | 42.99 | 41.23 | 39.98 | 39.01 | 38.22 | 37.55 | 36.97 | 36.46 | 36 | 35.59 | 35.21 | 34.86 | 34.54 | 34.24 |
© 2018 by the authors. Licensee MDPI, Basel, Switzerland. This article is an open access article distributed under the terms and conditions of the Creative Commons Attribution (CC BY) license (http://creativecommons.org/licenses/by/4.0/).
Share and Cite
Colpaert, A.; Vinogradov, E.; Pollin, S. Aerial Coverage Analysis of Cellular Systems at LTE and mmWave Frequencies Using 3D City Models. Sensors 2018, 18, 4311. https://doi.org/10.3390/s18124311
Colpaert A, Vinogradov E, Pollin S. Aerial Coverage Analysis of Cellular Systems at LTE and mmWave Frequencies Using 3D City Models. Sensors. 2018; 18(12):4311. https://doi.org/10.3390/s18124311
Chicago/Turabian StyleColpaert, Achiel, Evgenii Vinogradov, and Sofie Pollin. 2018. "Aerial Coverage Analysis of Cellular Systems at LTE and mmWave Frequencies Using 3D City Models" Sensors 18, no. 12: 4311. https://doi.org/10.3390/s18124311
APA StyleColpaert, A., Vinogradov, E., & Pollin, S. (2018). Aerial Coverage Analysis of Cellular Systems at LTE and mmWave Frequencies Using 3D City Models. Sensors, 18(12), 4311. https://doi.org/10.3390/s18124311