1. Introduction
Interest in photonic crystal fibers (PCFs) has lasted for more than two decades since their invention in 1996 [
1]. The possibility of dispersion characteristics’ modification by a proper design of the geometrical structure as well as high optical power density in the fiber core led to applications in nonlinear optics [
2,
3]. Pumping PCFs with high-energy pulses in the anomalous regime of dispersion results in soliton fission that broaden the spectrum of a pulse, due to specific nonlinear phenomena, leading to supercontinuum generation (SG) which can theoretically span several octaves in the frequency domain.
The most popular material of fiber optics, that is fused silica glass, has a relatively low nonlinear refractive index
n2 = 2.74 × 10
−20 m
2/W at the wavelength of 1053 nm [
4] compared to soft glasses [
5] or liquids [
6], but its transmission band is limited to approx. 2 μm. The decrease of transmission in silica glass for longer wavelengths, caused by multi-photon absorption by Si–O bondings and vibrational resonances on OH–ions motivates the search for other materials for PCF development that would allow for transmission in mid-infrared (mid-IR). Such transmission is a property of glasses containing heavy atoms with lower excitation energy of optical phonons. A number of these glasses also exhibit higher
n2 than fused silica. For SG a number of glasses are used, such as fluoride glasses, chalcogenide glasses containing compounds of sulphur, arsenic and selenium [
7,
8,
9], tellurite glasses [
10] and lead oxide glasses [
11,
12].
The transmission of ZBLAN glasses ranges up to approximately 5 µm, what allows for SG in the spectral range of 0.8–4.5 µm [
13,
14], despite relatively low
n2. These glasses have similar linear and nonlinear refractive index to fused silica glass, but their development requires high quality materials that comes at a high cost of the technological process, including the necessity of isolation from external environment to prevent chemical reaction of fluorine compounds with other compounds in the air, and to prevent pollution because of high toxicity of these substances.
Chalcogenide glasses have the largest
n2 ≈ 10
−18 m
2/W, among glasses typically used for drawing of fibers, and the zero dispersion wavelength (ZDW) is located in mid-IR (
λZDW > 4.5 µm), while the transmission wavelength range extends to over a dozen of micrometers, depending on chemical composition. Pumping of fibers made of these glasses in the anomalous dispersion regime (
λp >
λZDW) requires advanced mode-locked lasers tuned in the range of 4–7 μm. In the paper by Petersen et al. [
8] SG in the range of 1.4–13.3 µm was demonstrated in step-index chalcogenide fibers, under pumping with 100 fs–long pulses, centered at a wavelength of
λp = 6.3 µm and with peak power of
P0 = 2.3 MW, from a complex optical parametric amplifier system.
Zhao et al. also demonstrated mid-IR SG in a low-loss Te-based chalcogenide step-index fiber [
15]. The fiber exhibits an optical loss of 2–3 dB/m in the range of 6.2–10.3 μm and 3.2 dB/m at 10.6 μm. The supercontinuum spectrum was generated in the range of 1.5–14 μm when a 23 cm–long fiber was pumped by a 4.5 μm laser with 150 fs–long pulses and the repetition rate
frep = 1 kHz.
Recently, mid-IR SG has been demonstrated in a low-loss telluride glass fiber with a double cladding. The fiber has attenuation lower than 10 dB/m in the range of 8–14 μm. Ultrashort pulses with a central wavelength of 7 μm, allowed for SG spanning from 2.0 μm to 16 μm for a 40-dB spectral flatness [
16].
Furthermore, a suspended–core PCF made of tellurite glasses (tellurium oxide glass) has been demonstrated by Domachuk et al. [
17] that enable SG in the range of 0.79–4.87 µm. The core diameter was 2.5 µm, while
λZDW = 1.38 µm. The fiber was pumped using an optical parametric oscillator (OPO) emitting 110 fs–long pulses with
frep = 80 MHz for
λp = 1.55 µm and the mean power
Pavg = 150 mW. Less than 1 cm of fiber was used, which was enough to generate hyperspectral supercontinuum at a standard pump wavelength, due to high nonlinearity of the fiber and ultrashort pump pulse duration. It also allowed to broaden the supercontinuum spectrum over 3 µm despite usually high absorption of multicomponent oxide glasses at this wavelength due to OH impurities. On the other hand, telluride glasses are fragile what makes development in the low-cost stack-and-draw process problematic. The suspended core geometry does allow high nonlinearity due to strong confinement, but at the same time it is also strongly isolated thermally from the cladding that leads to a fiber being more susceptible to laser damage, compared to other types of PCFs with low air-glass filling factor.
PCFs made from heavy metal oxide glasses, such as SF
6 with
n2 = 2.2 × 10
−19 m
2/W, are an alternative to tellurite glasses. Omenetto et al. [
11] demonstrated a fiber with four air-holes surrounding a core of diameter
dr = 2.6 µm, which exhibited
λZDW = 1.30 µm. When pumped with an OPO source with
λp = 1.55 µm SG was achieved in the range of 0.7–3.0 µm with a dynamics of 40 dBs.
Other glasses are also used, e.g. bismuth-based glasses. In one of our previous works, we have demonstrated SG in the range of 100–2500 nm with a 5 dB flatness in a PCF made of lead-bismuth-gallate glass and pumped in the femtosecond regime at 1540 nm [
18]. Later, a PCF which allowed for SG in the range of 1.2–2.0 µm was shown, when pumped with OPO source with
λp = 1.55 µm, 100 fs–long pulses, and
frep = 1.0 kHz [
19]. Finally, spectral and coherence evolution were experimentally measured for SC generated in PCFs made of SF
6 glass [
20]. A significant part of our previous work in multi-component oxide soft glass was related to fibers with normal dispersion profiles and a comprehensive review of coherent supercontinuum generation in soft glass photonic crystal fibers can be found in [
21].
Table 1 summarizes selected typical properties of glasses used for development of PCFs.
Using OPO sources for SG does not allow for building compact all-fiber systems with broad and high power emission spectrum in the near- and mid-IR, which is important, e.g., in fluorescent microscopy [
26], optical coherence tomography [
27] and environmental monitoring [
28].
In this work we analyze the performance of a PCF made of a heavy metal oxide glass that allows for SG over a full octave under pumping from mode-locked, fiber-based lasers emitting pulses at 1.56 μm. First, the fiber is modelled and optimal geometrical parameters are selected to achieve flat and low chromatic dispersion in the anomalous regime for spectrally efficient, soliton-based SG. Then, the fiber is developed in the stack-and-draw process and, finally, its nonlinear performance is investigated using SG simulations and physical experiment.
2. Numerical Simulations of Linear Properties of the PCF
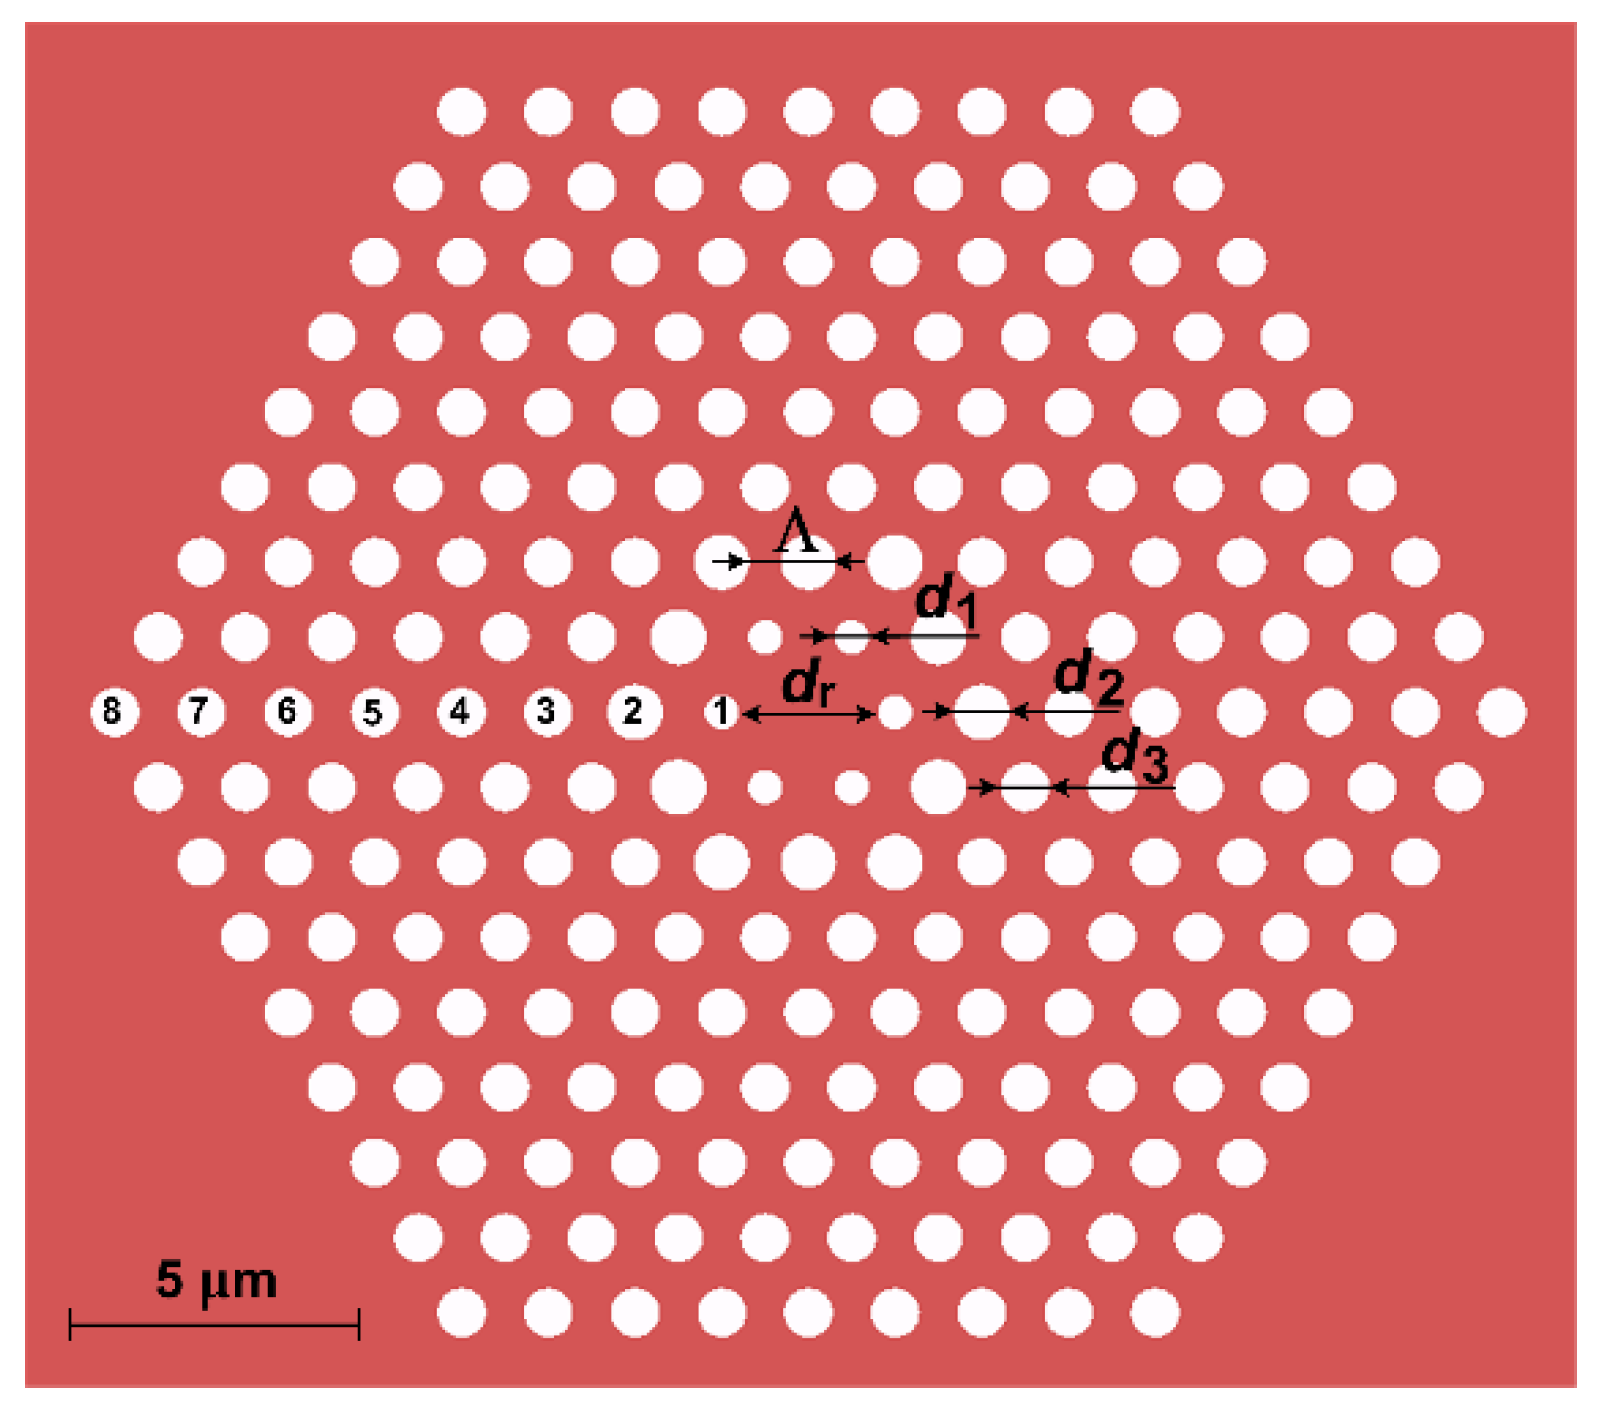
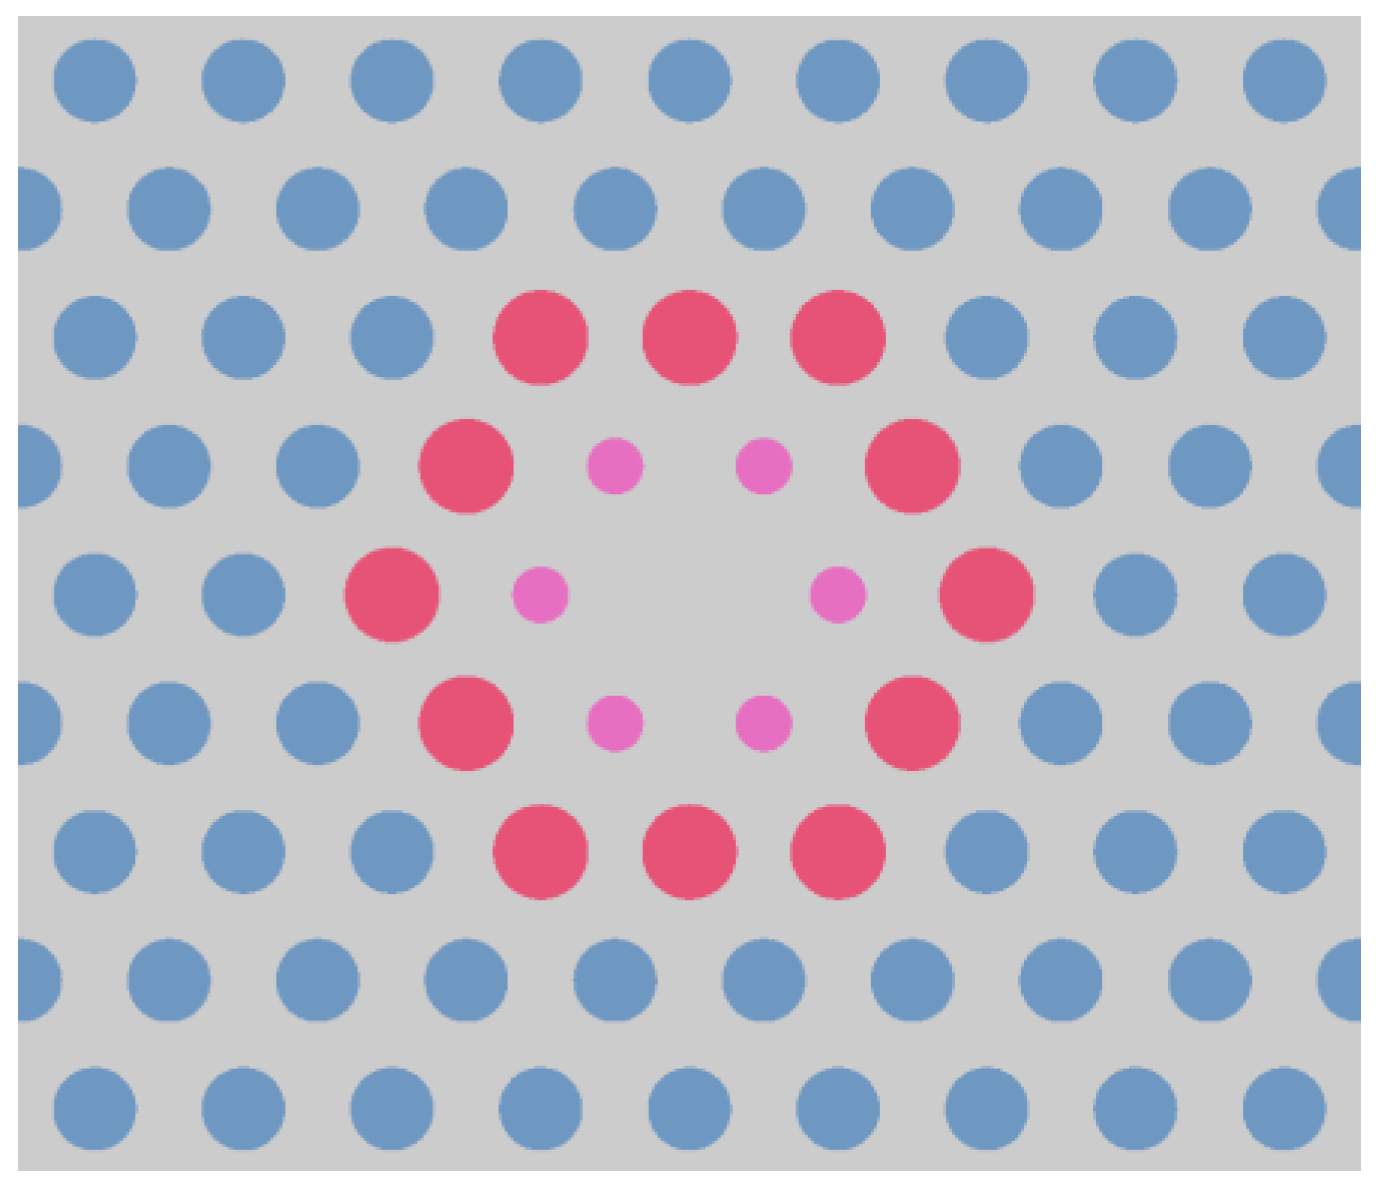
The analyzed PCF consists of a solid core surrounded by a hexagonal air-hole photonic cladding. Its structure is shown in
Figure 1, where
dr denotes the diameter of the core,
d1—the diameter of the holes directly surrounding the core in the first row,
d2—the diameter of the holes in the second row, and
d3—the diameter of the remaining holes. Due to variable diameters of the holes this structure holds effectively three different filling factors
d/
Λ in the cladding.
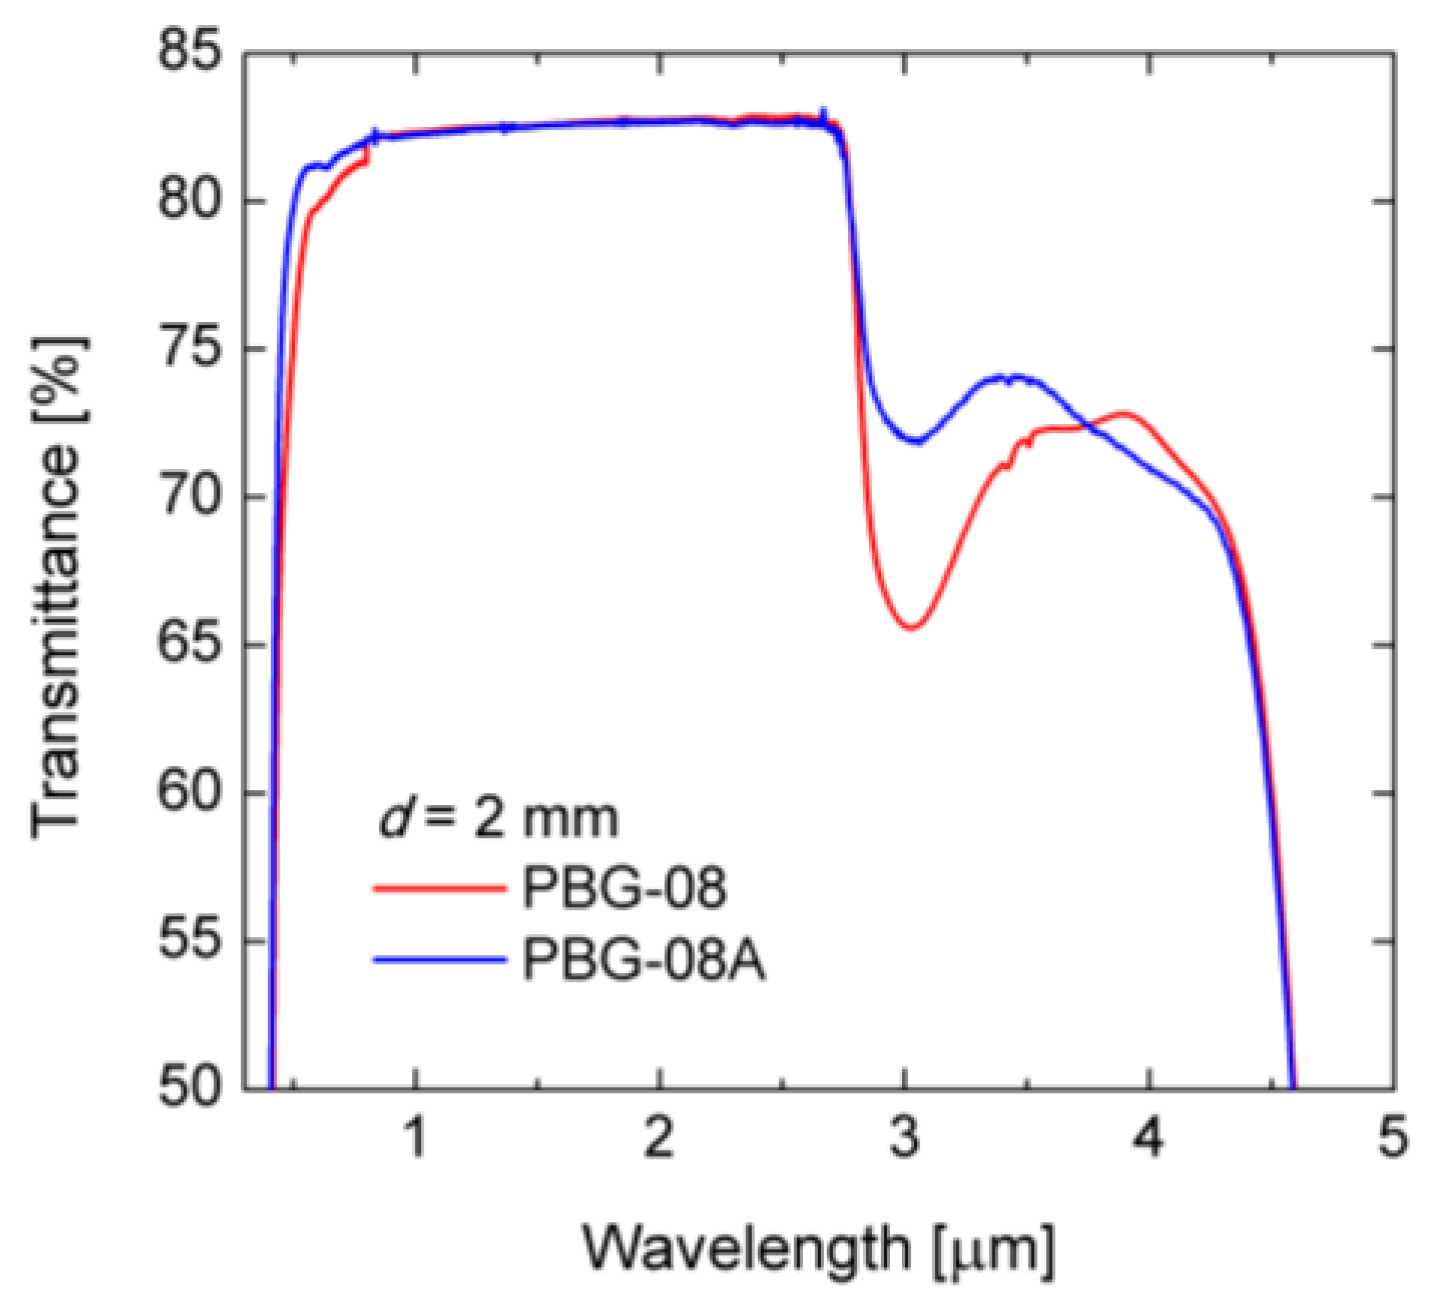
As a base material for the PCF PBG-08A glass was chosen. This is an in-house developed glass with the chemical composition similar with that of the lead-bismuth-galate PBG-08 glass [
18]. The glass was developed under a protective gas atmosphere, what led to the reduction of the water content. As a result, the transmission of the glass was increased in comparison with PBG-08 to 75% for the wavelength of 3 μm. The characteristics of the transmission for both glasses are shown in
Figure 2.
The refractive indices of PBG-08 and PBG-08A glass are similar but
nPBG-08A is higher than
nPBG-08 by approx. 0.005. The measurement was done using a Michelson interferometer with the accuracy of 0.002. The refractive index characteristic of PBG-08A glass is modelled using Sellmeier’s equation below. The Sellmeier’s coefficients calculated on the basis of experimental results are presented in
Table 2.
The aim of the numerical study was to design a new air–glass structure of a photonic cladding that allows for single mode operation and for flat and low chromatic dispersion in the anomalous regime. We analyzed the influence of the geometrical parameters of the structure, namely the lattice constant
Λ, and diameters of the holes,
d1,
d2,
d3, on linear properties of the PCF in terms of effective refractive index
neff(
λ), attenuation
A(
λ), and dispersion
D(
λ) for the wavelength range of 0.8–5 μm. We assumed that the PCF would be coupled to a mode-locked laser emitting at
λp = 1.56 µm, therefore ZDW should be lower than the pump wavelength. A commercial-grade simulator, eigenmode solver and propagator was used to perform the calculations [
29].
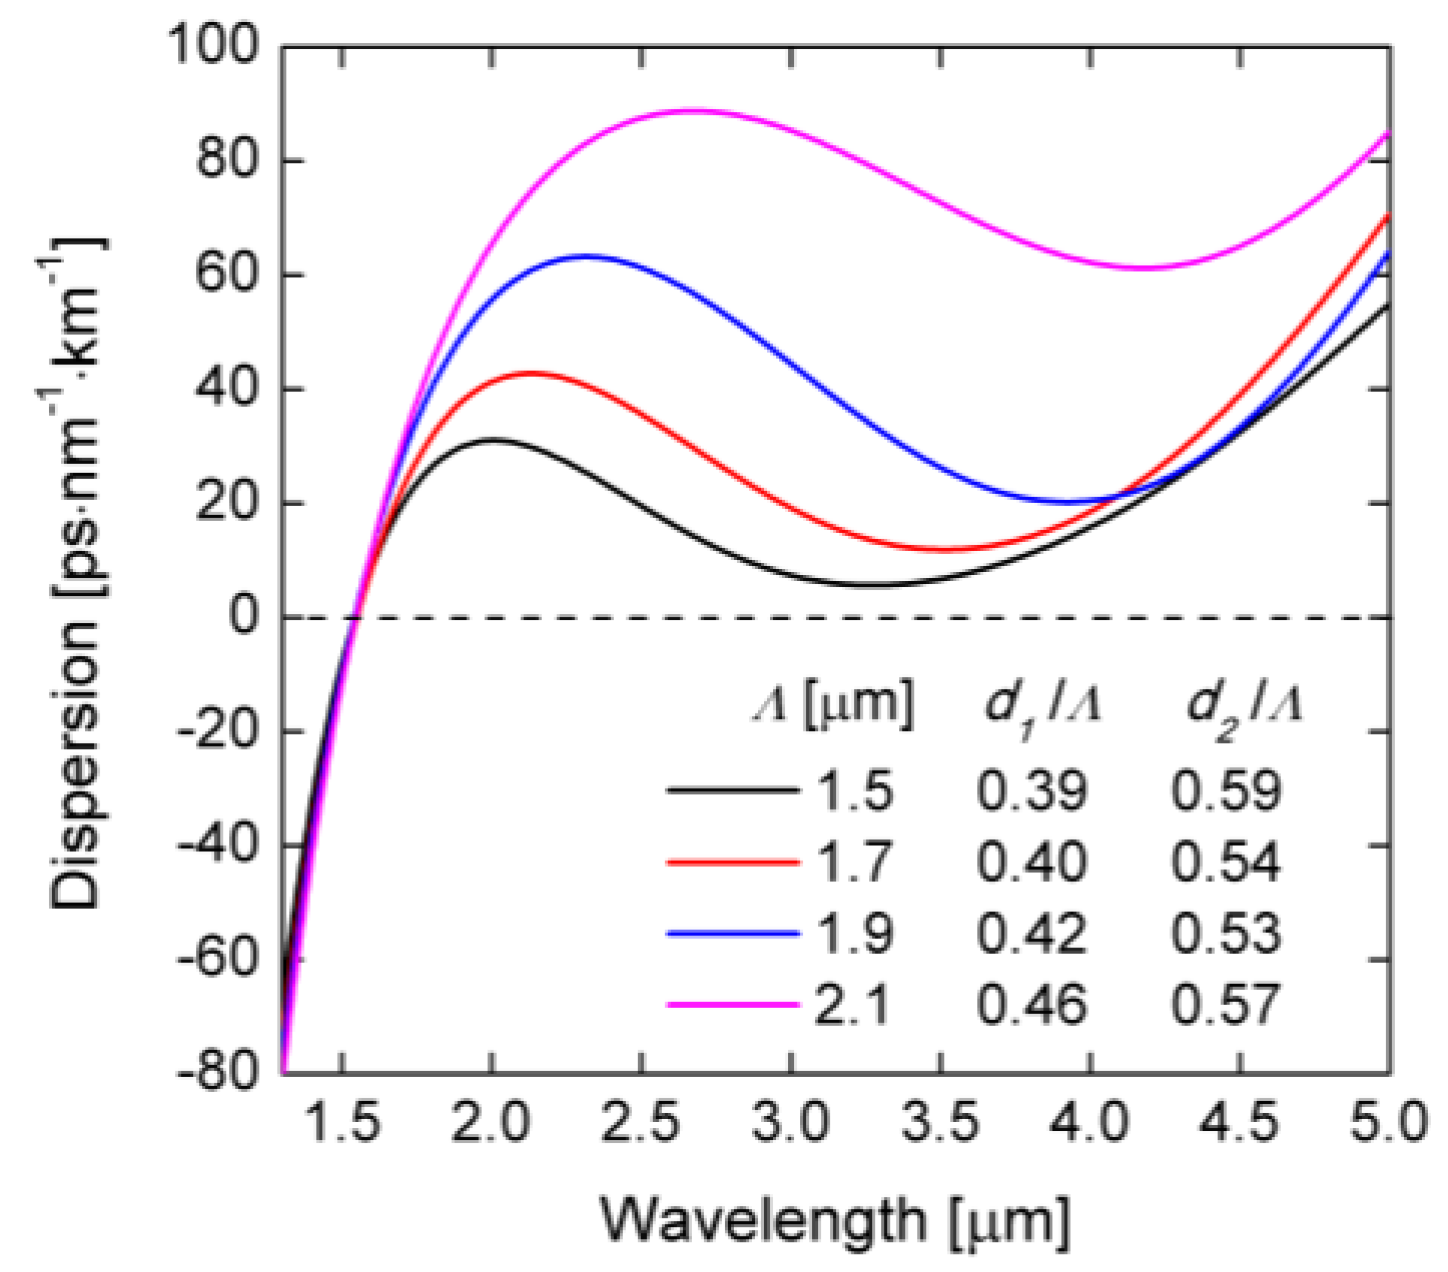
The possibility of controlling the lattice constant
Λ and the diameter of air-holes in three subsequent rows allows for precise shaping of dispersion characteristics in a wide range of wavelengths. First, the influence of the lattice constant was simulated for
Λ in the range of 1.5–2.1 µm and two different filling factors in the first and outer rows of holes. The resulting dispersion characteristics of the fundamental mode are shown in
Figure 3. The local maximum of the dispersion characteristic in the vicinity of ZDW is the lowest for
Λ = 1.5 µm. Thus, this value was used for further analysis.
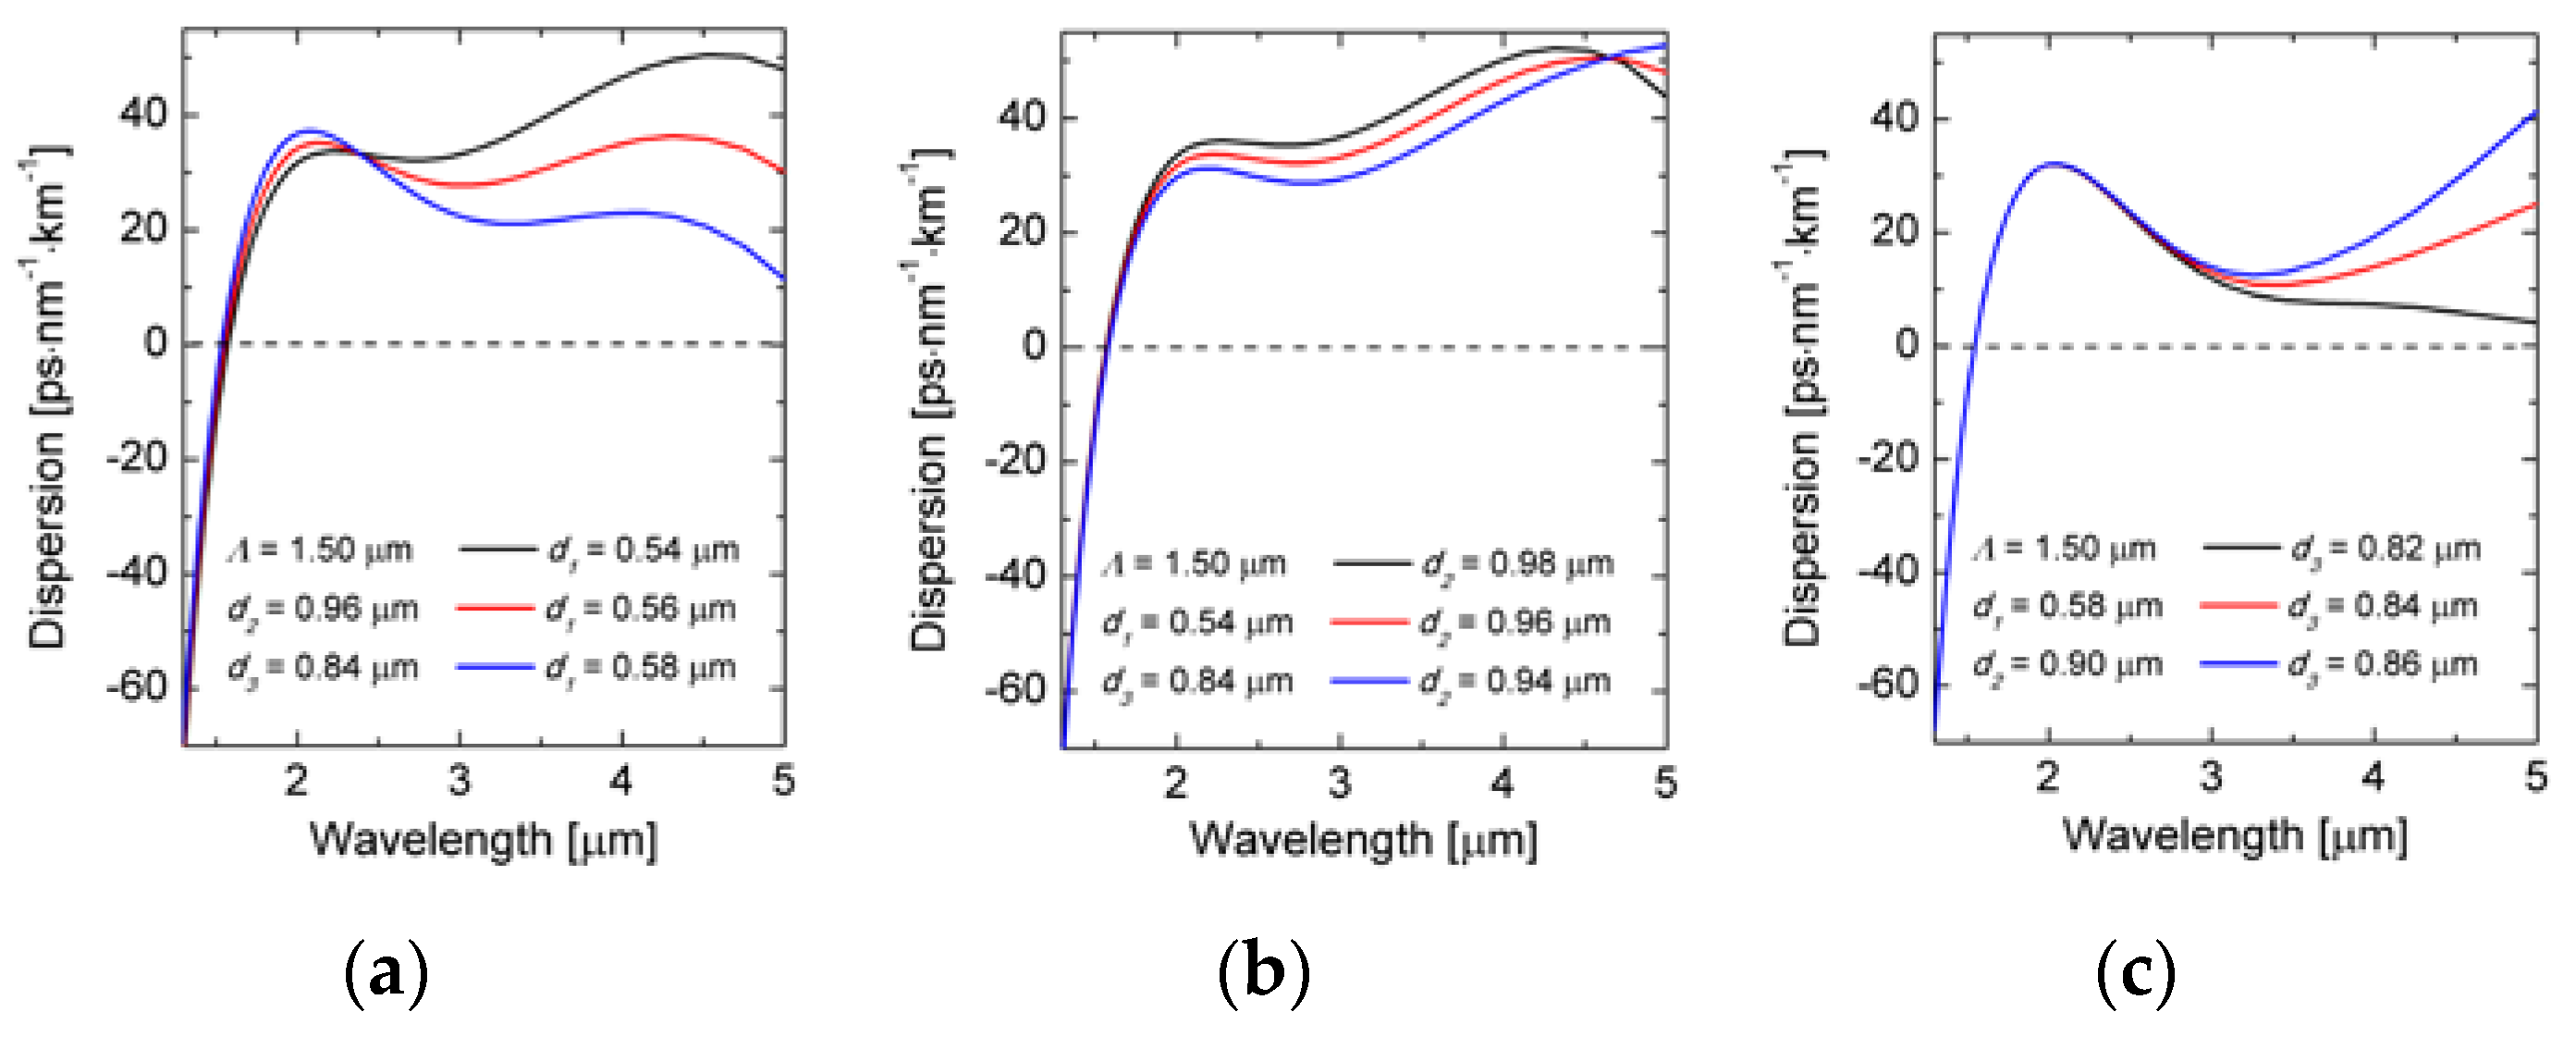
The subsequent computations were performed for a set of diameters
d1,
d2 and
d3. Selected dispersion characteristics are shown in
Figure 4. The change of the diameter
d1 has the biggest influence on the location of ZDW and the shape of the dispersion characteristic in the range of 1.0–5.0 μm (see
Figure 4a) [
30]. The change of the diameter
d2 has only small effect on ZDW and influences the dispersion characteristic mainly in the range of 2–4.5 μm (see
Figure 4b). The change of the diameter
d3 has almost no effect on ZDW but influences the dispersion characteristic in the range of 2.5–5 μm (see
Figure 4c). Thus, using three different filling factors in the lattice geometry, one has the opportunity to precisely shape the dispersion characteristics, but at the same time even small variations in the diameters of the air-holes during fiber development, on the level of tens of nanometers, can lead to a significant change of the characteristics.
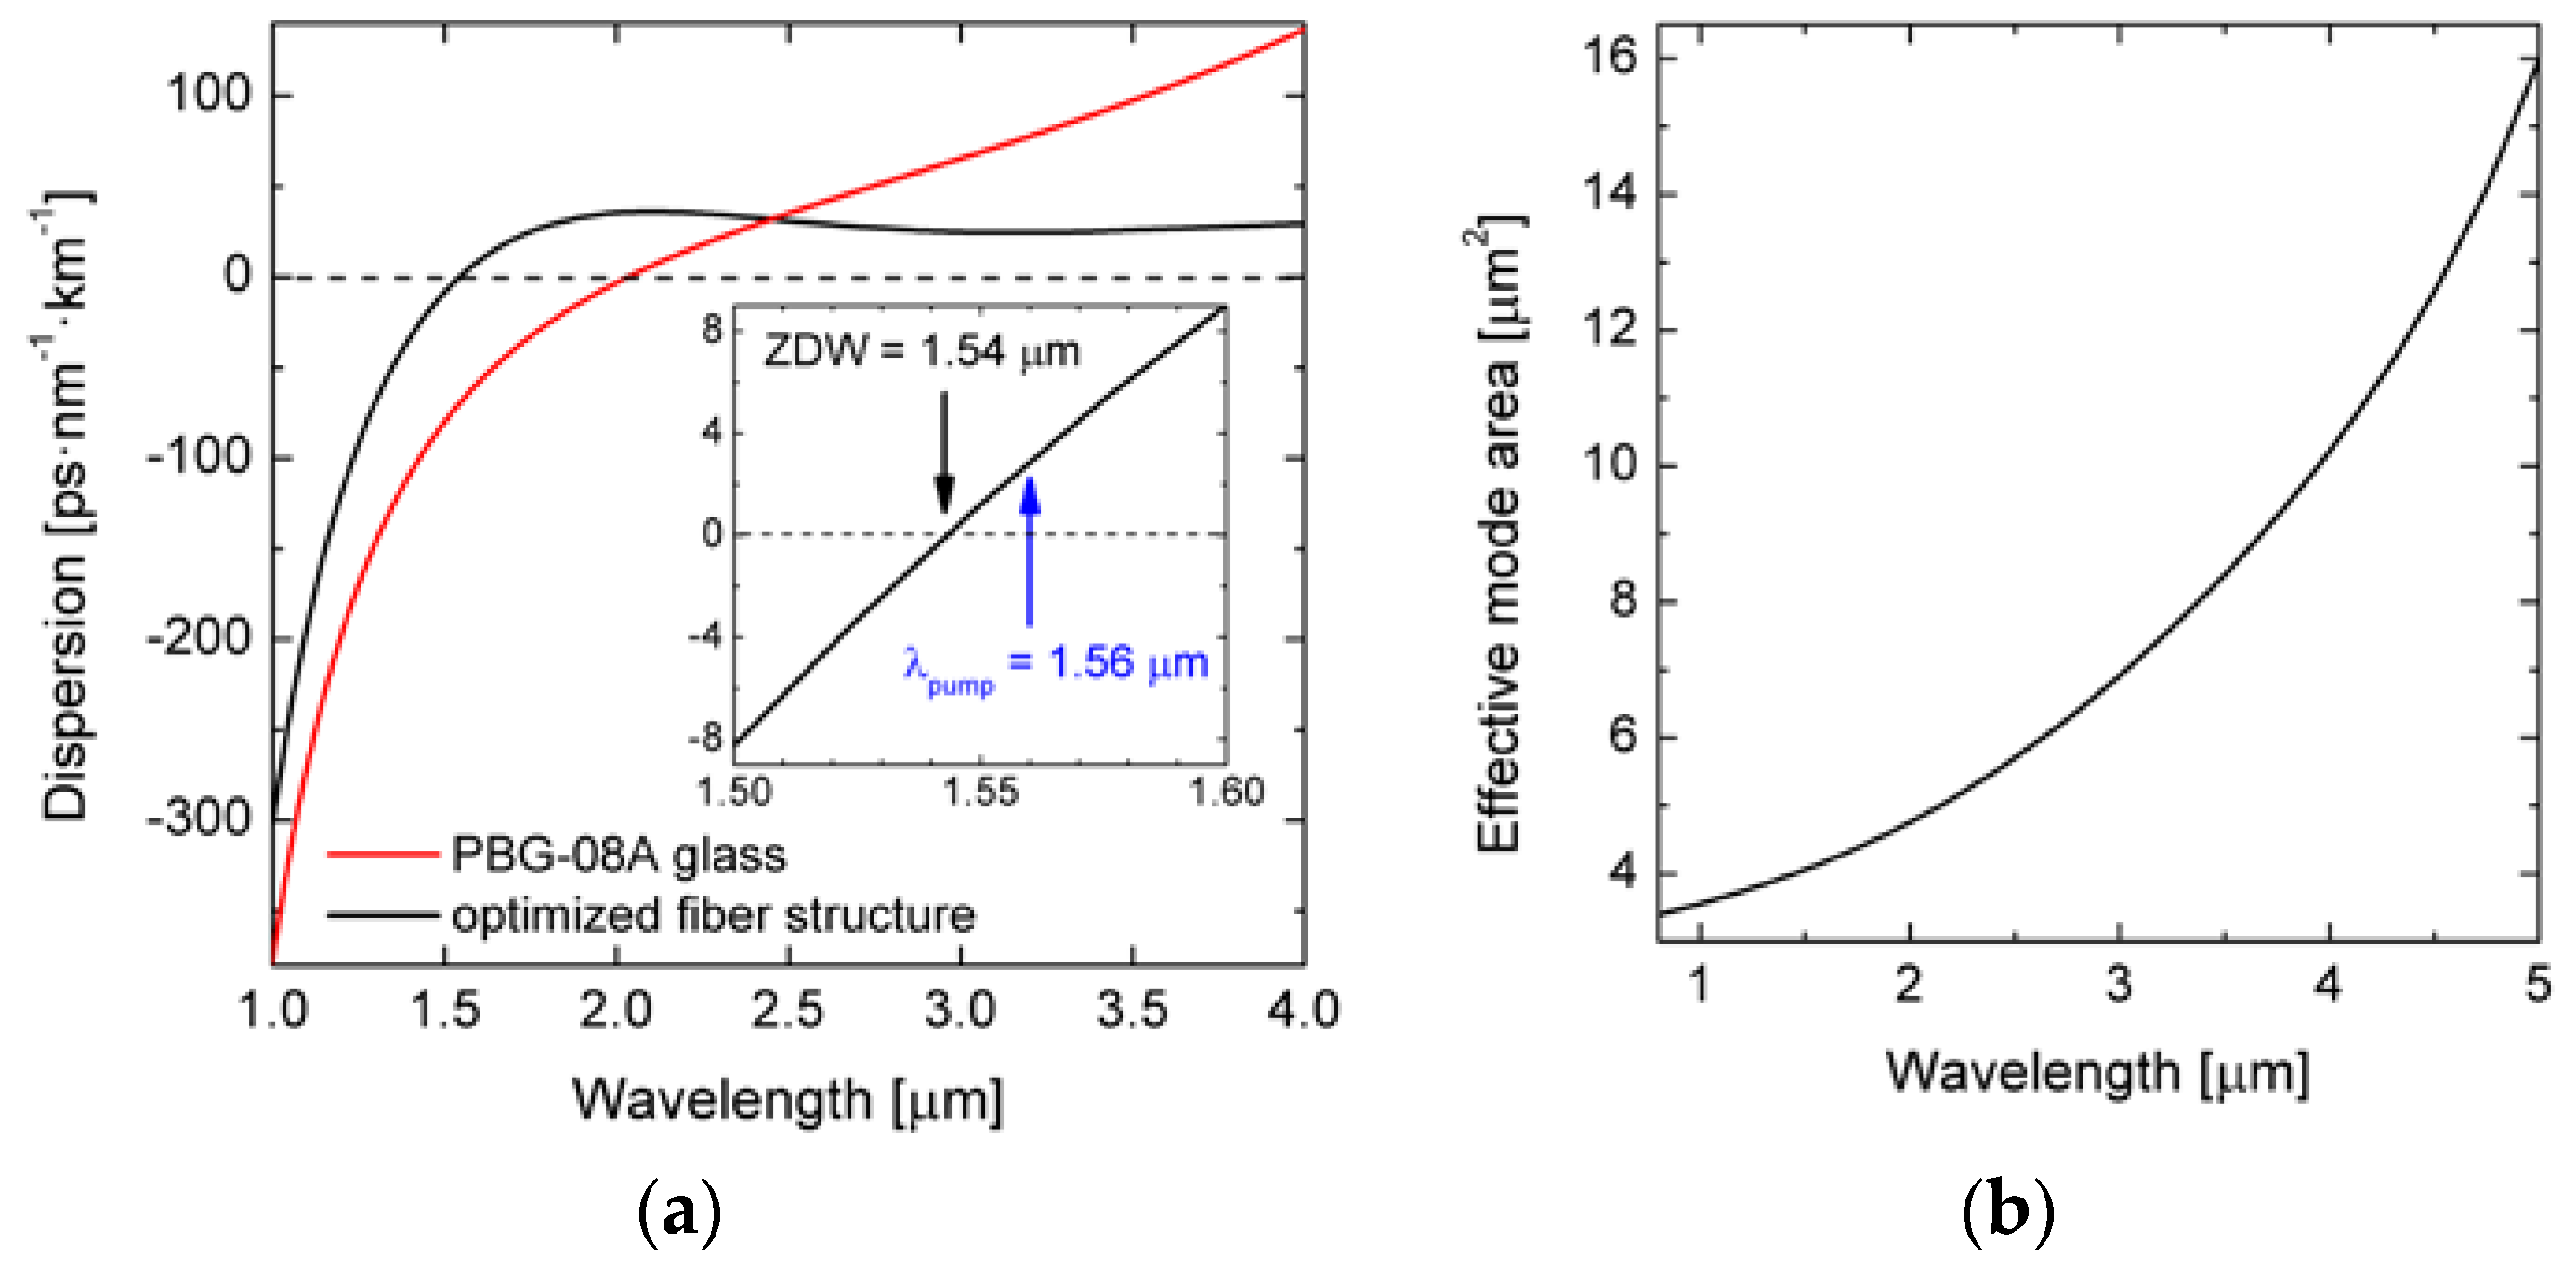
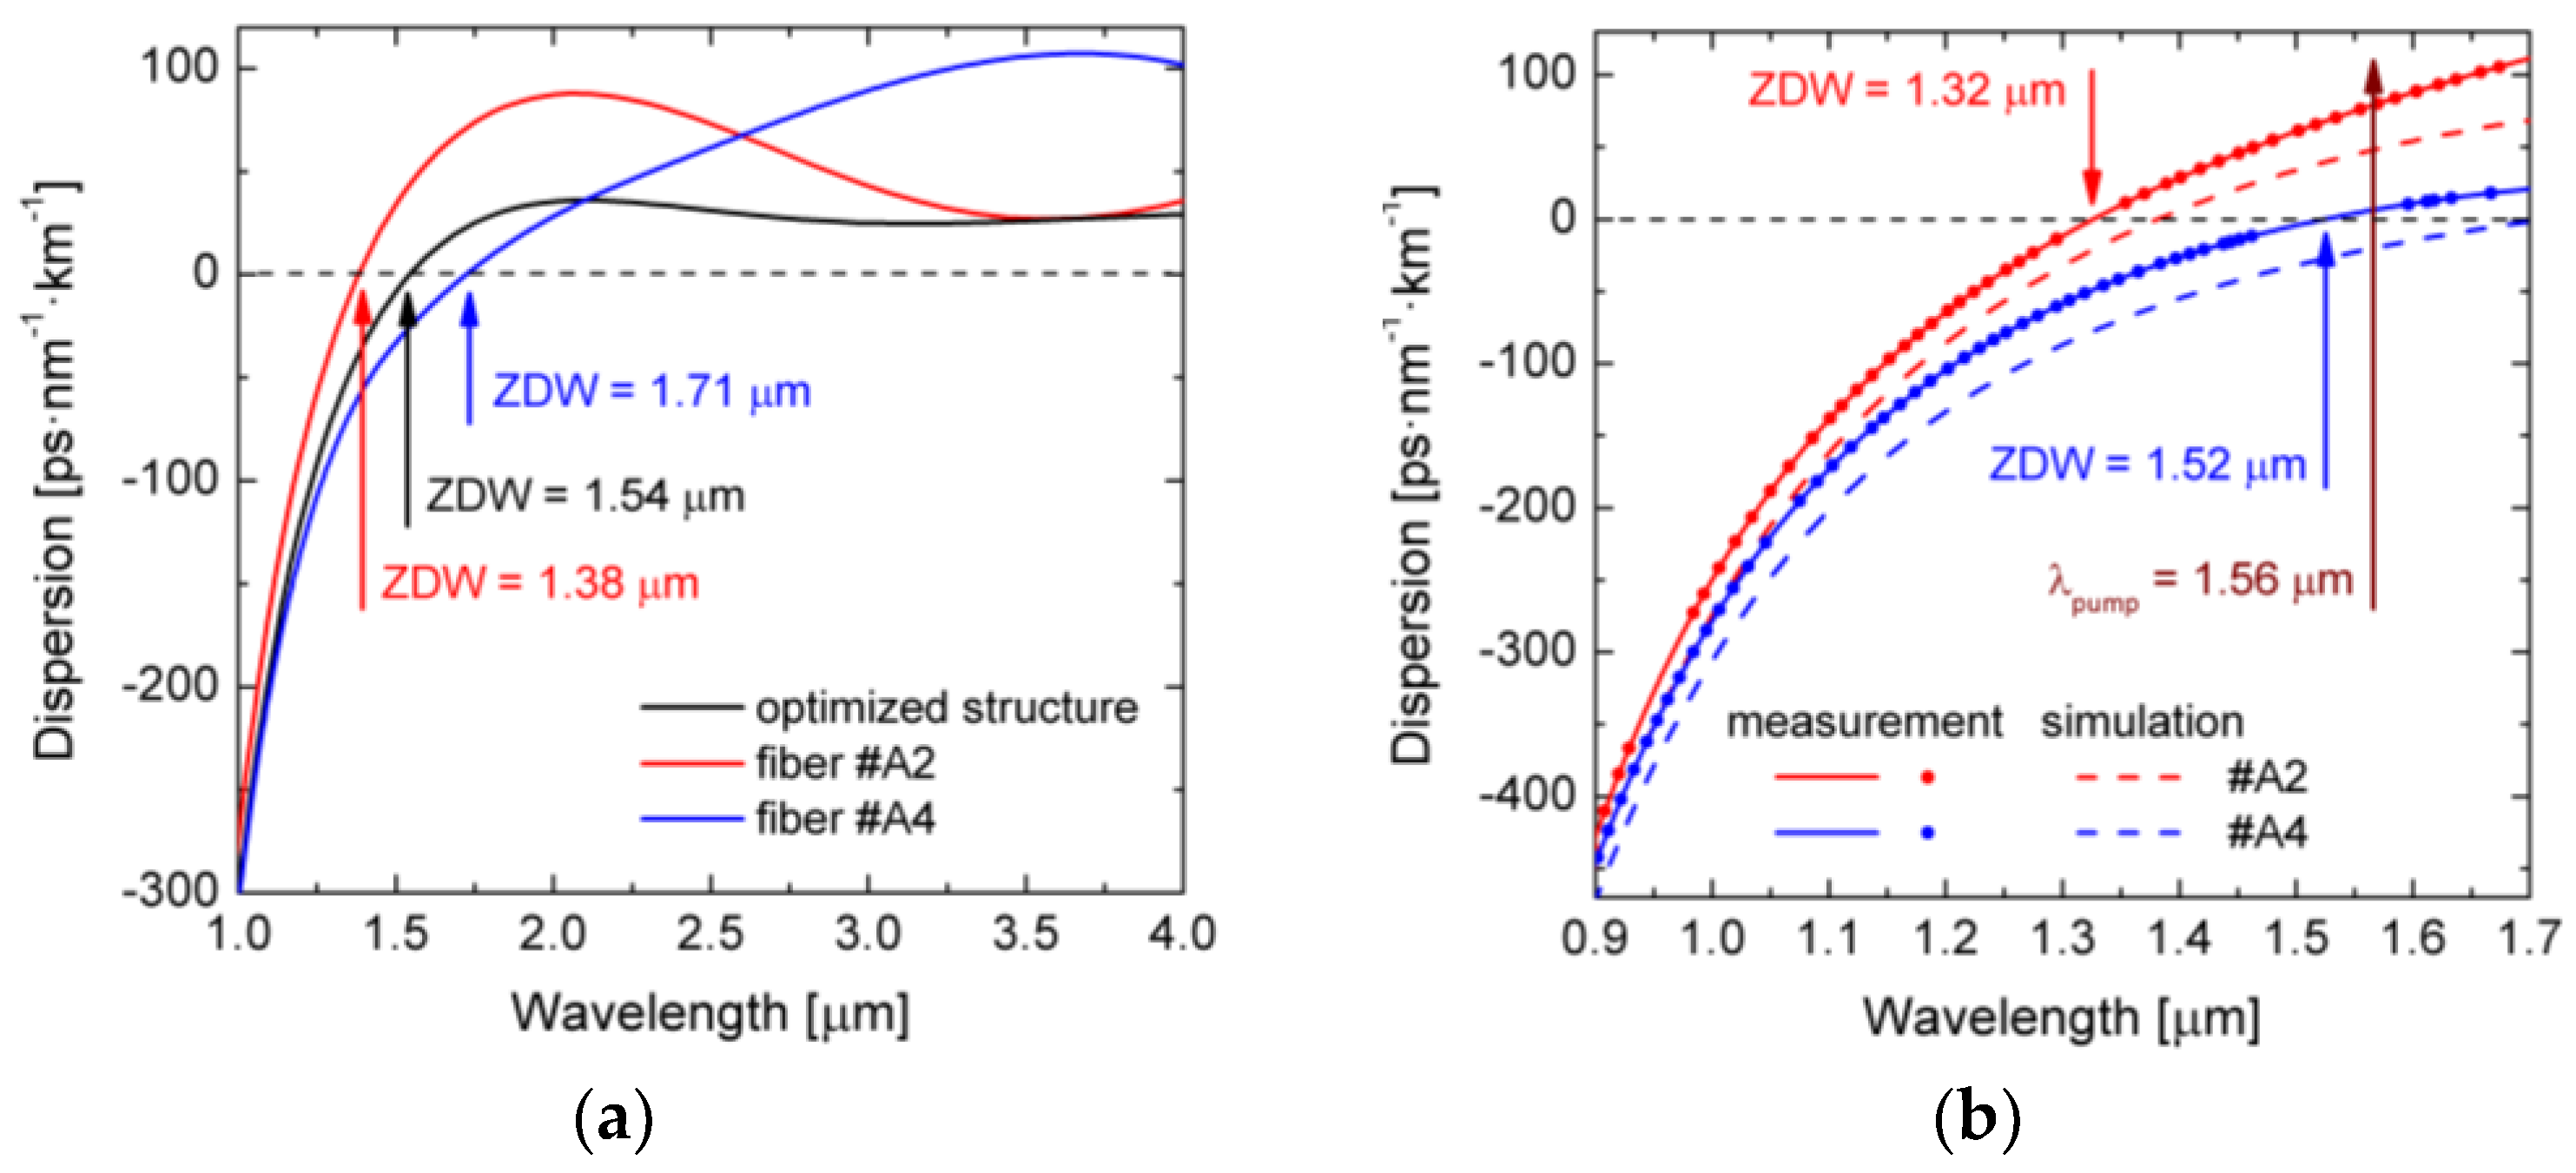
As a final dispersion-optimized structure the fiber with parameters given in
Table 3 was chosen, that exhibits the lowest and flat dispersion in the vicinity of ZDW in the anomalous dispersion regime. The geometrical structure of this PCF is shown in
Figure 5. The dispersion characteristics and the effective mode area
Aeff are shown in
Figure 6. In this fiber ZDW is located at 1.543 µm and the maximum dispersion value
Dmax = 36 ps/(nm·km) was obtained for the wavelength of 2.106 µm. For
λp = 1.56 µm the total fiber dispersion equals
D = 2.8 ps/(nm·km) while the group dispersion equals
β2 = −3.6 ps
2/km and calculated
Aeff is 4.13 μm
2.
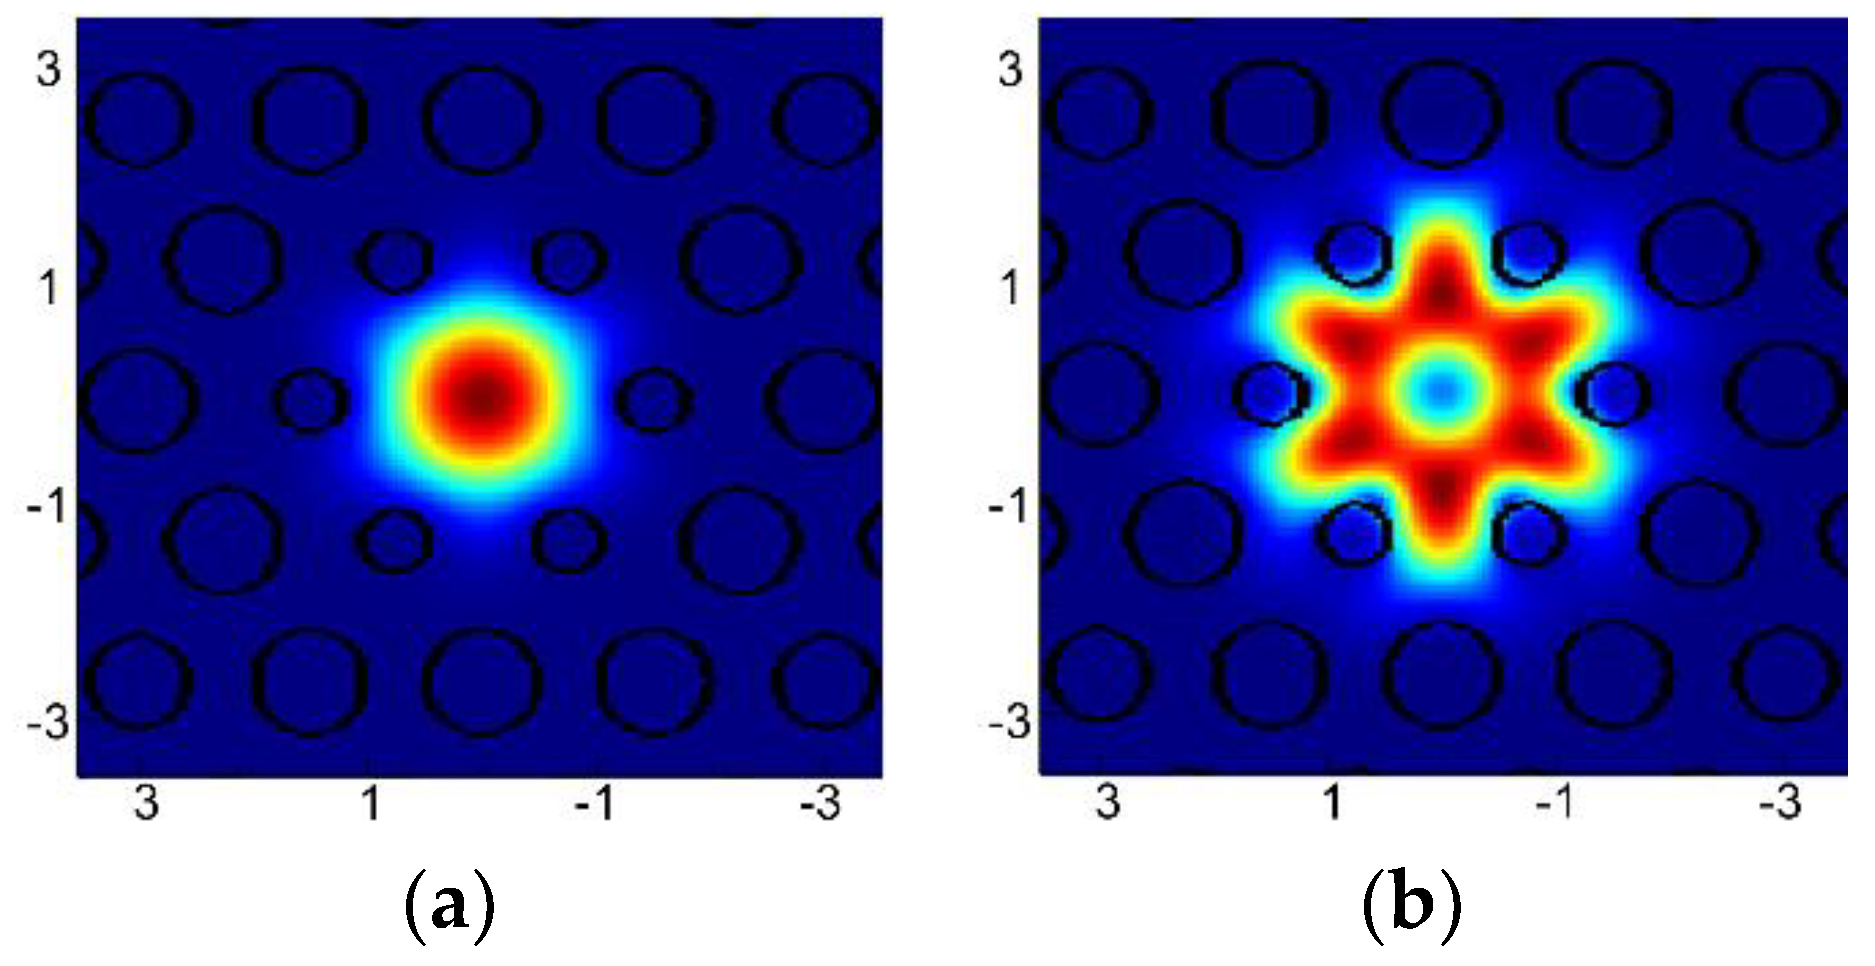
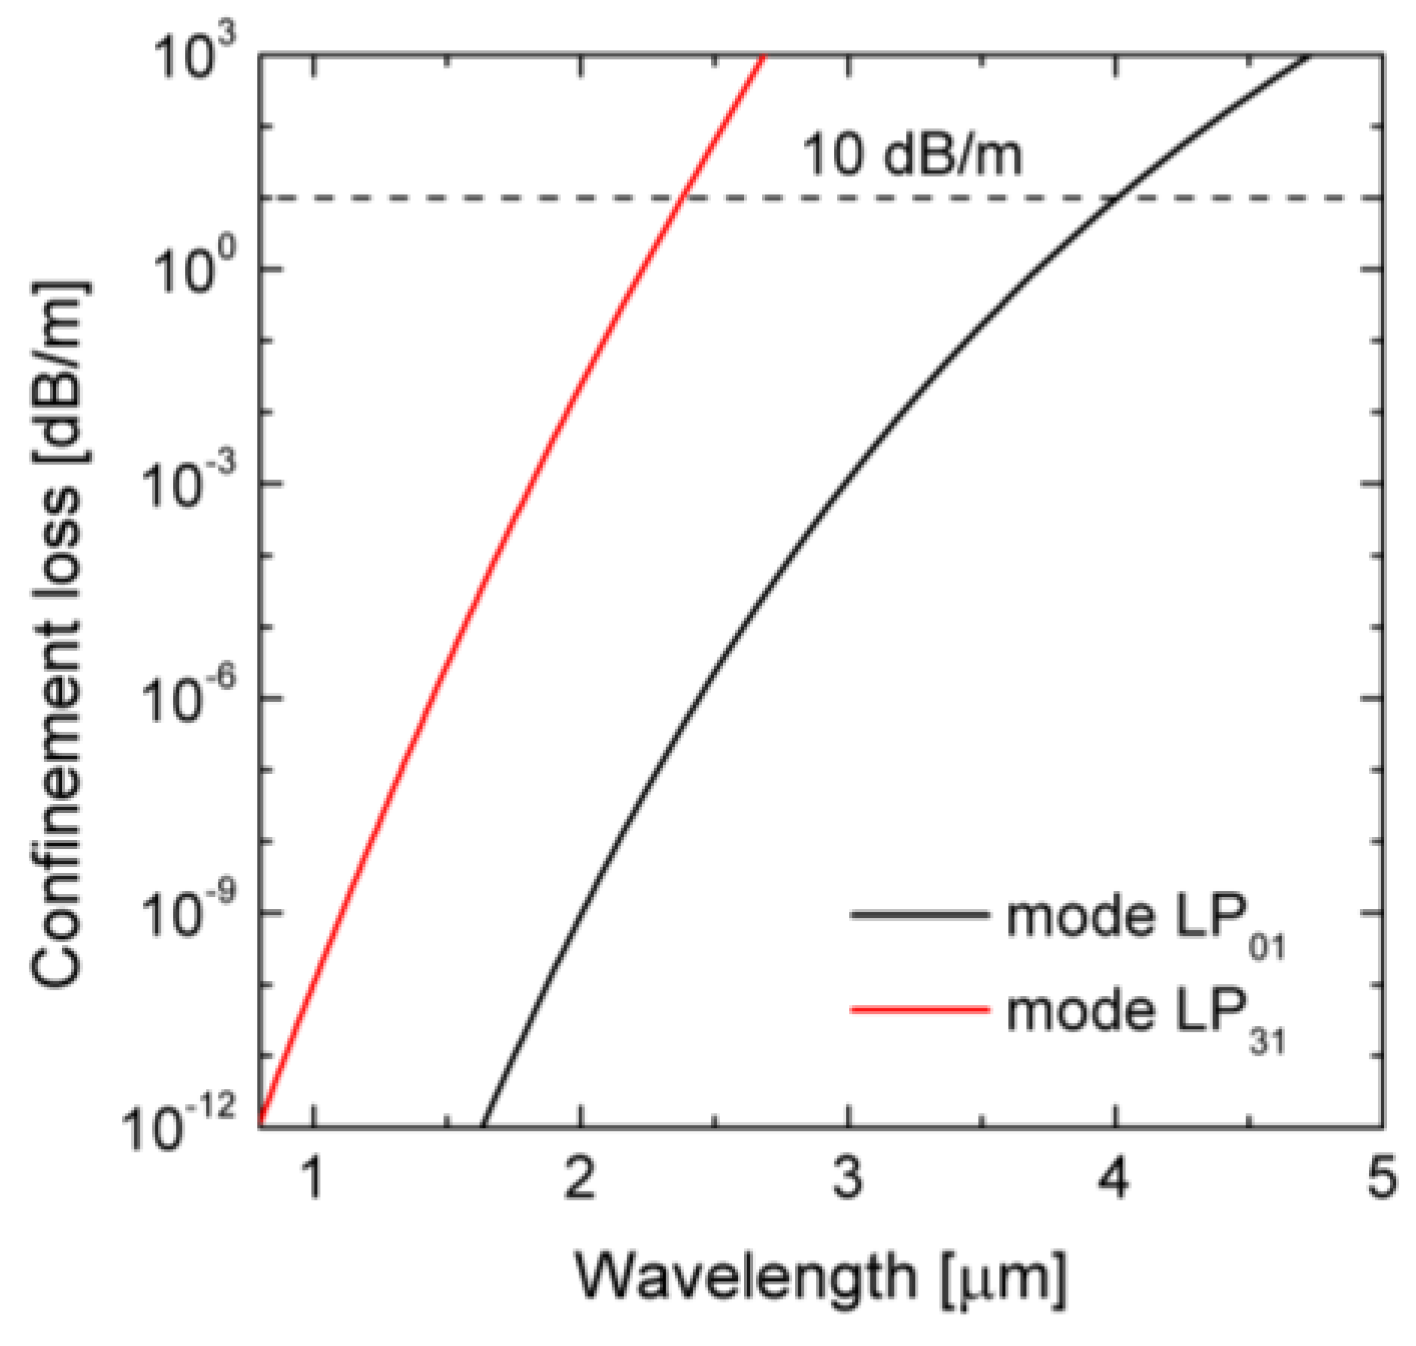
In the next step, the mode analysis for the dispersion-optimized PCF was performed. Two-dimensional distributions of intensity of the only propagating modes are shown in
Figure 7. Additionally, attenuation was computed for the analyzed modes in the range of 0.8–5.0 μm, shown in
Figure 8. As a cut-off attenuation criterion 10 dB/m was selected [
31]. Therefore, propagation of the mode LP
31 is possible, but its attenuation is higher than attenuation of the fundamental mode (FM) by a factor of 10
9. Theoretical cut-off wavelength for the mode LP
31 is 2.38 μm and for the FM it is 4.0 μm, which means that the fiber does not guide light in the core for wavelengths longer than 4.0 μm. Although for the pump wavelength
Λp = 1.56 µm two modes are guided, the effective coupling efficiency is equal 0.3 for FM and close to zero for the mode LP
31, when a Gaussian beam with numerical aperture 0.6 is considered.
3. PCF Development
Dispersion-optimized PCFs were then developed in a stack-and-draw process [
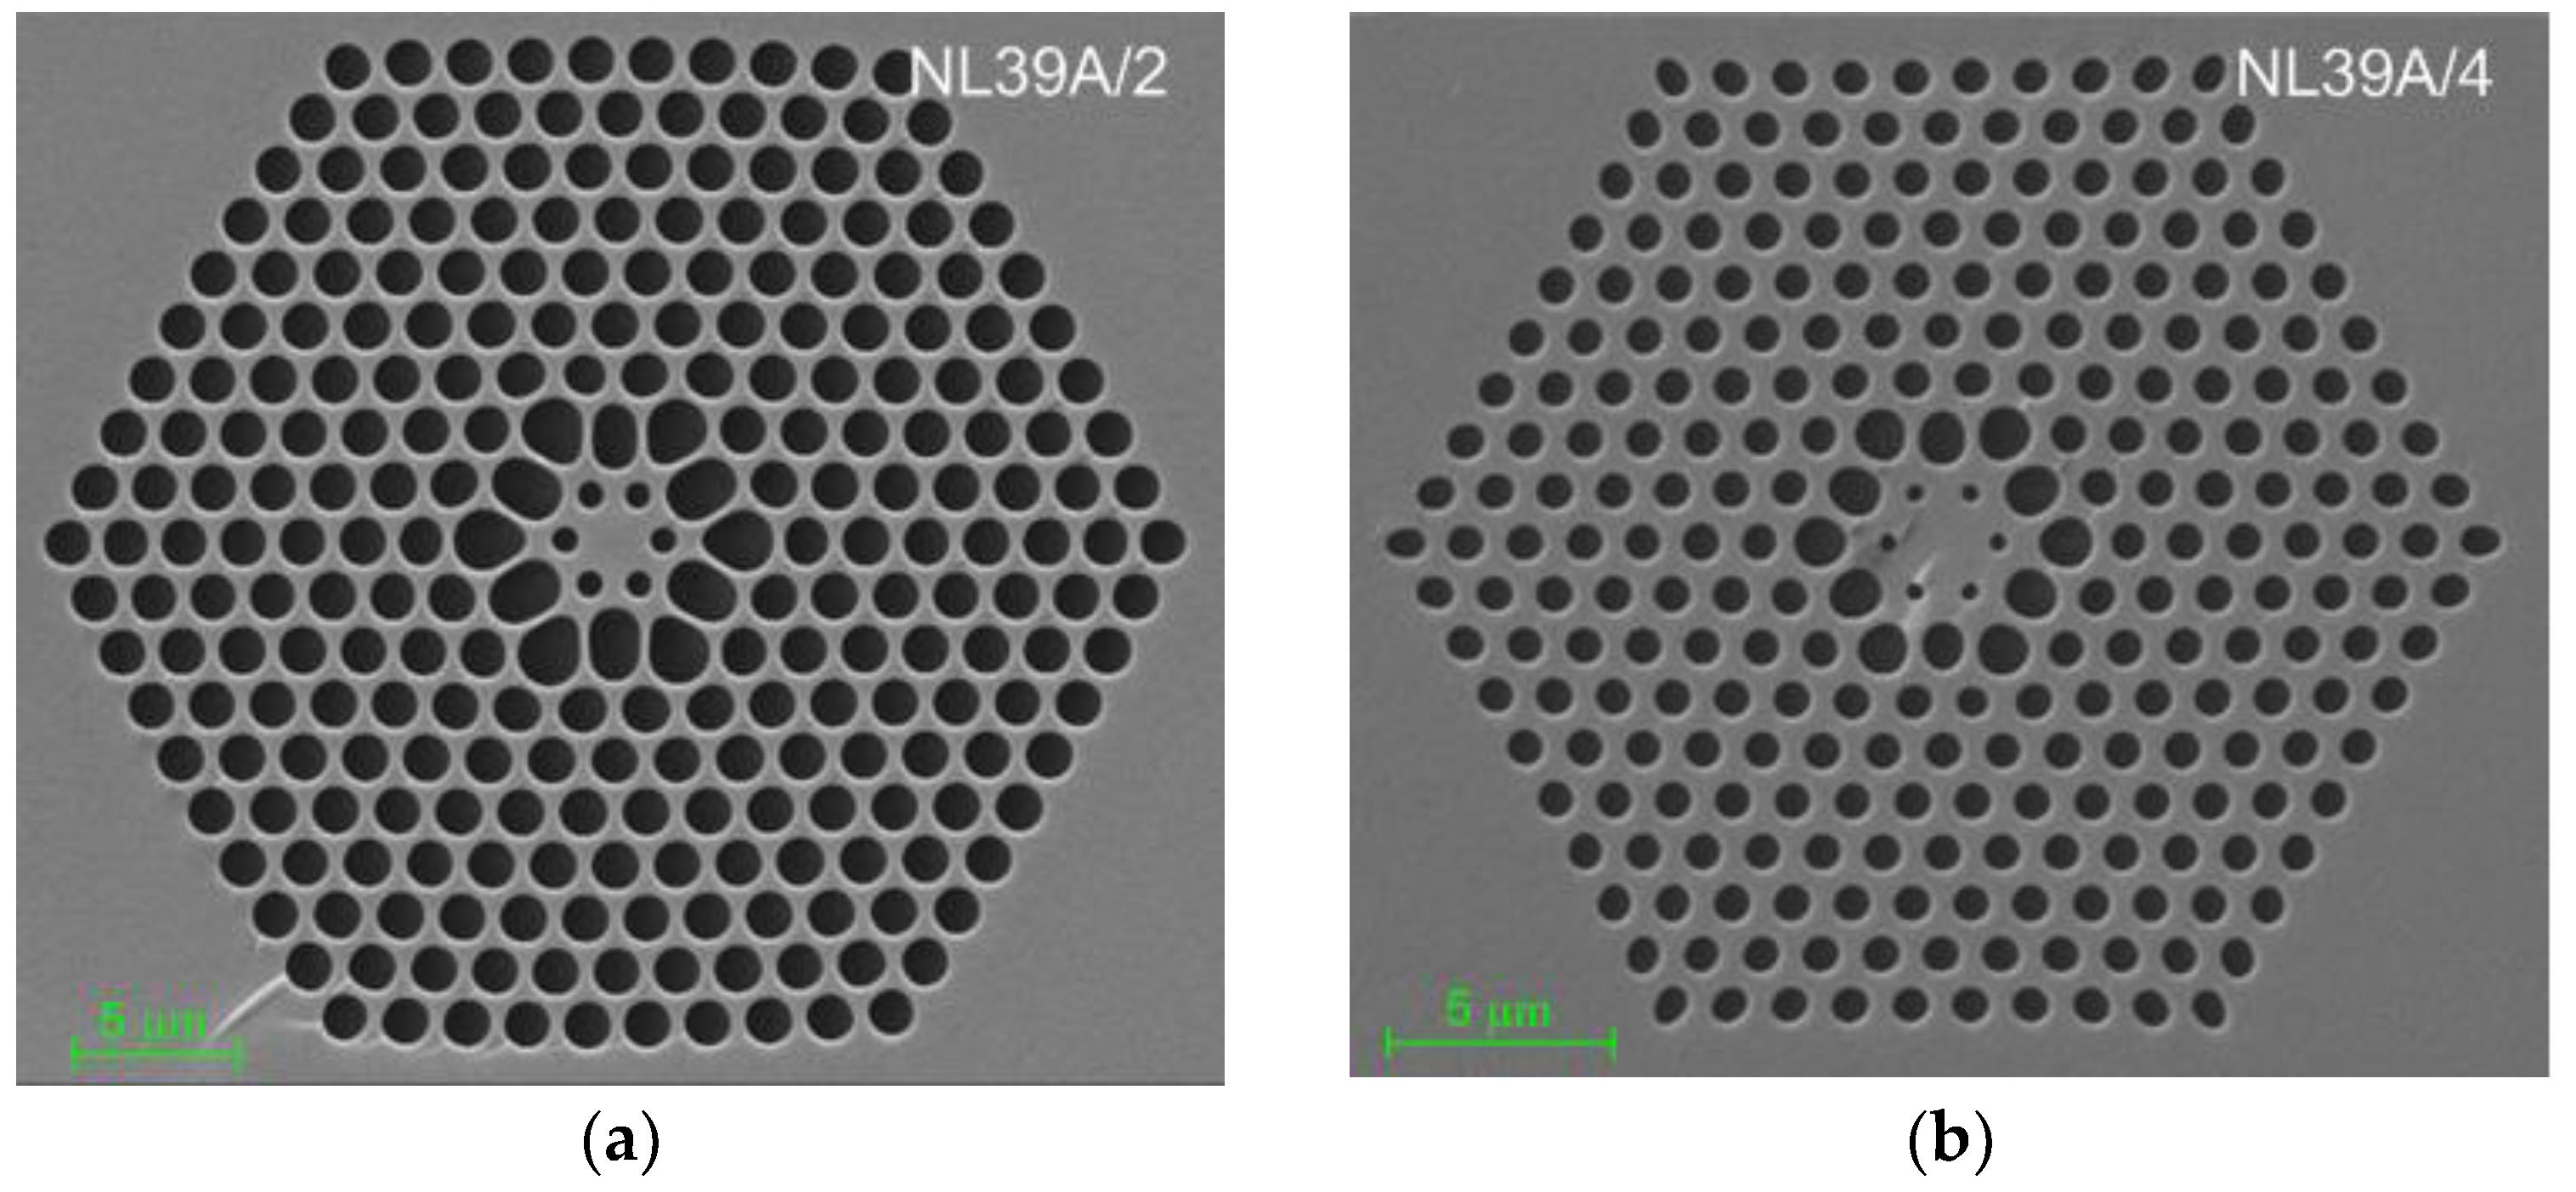
32]. The drawing process had two stages. First, a subpreform was stacked from capillary tubes and rods and the initial drawing was done with the low pressure to close the gaps between capillaries and rods. Capillaries had different internal diameters for the particular rows of air-holes. Then, the top of the resulting preform was sealed and the final fiber was drawn. The increase of the pressure in the capillaries caused by the increase of the temperature influenced the diameters of the holes. A series of PCFs was drawn, using a prepared subpreform, which differ in size and internal structure. The differences are a result of different drawing speed. The images of the cross-sections of two selected fibers with structures close to the designed one, labeled #A2 and #A4, made by a scanning electron microscope, are shown in
Figure 9. The geometrical parameters of PCFs are presented in
Table 4, where the external diameter of the fiber is denoted as
Øout.
The structures of PCFs are different from the ideal one but at the same time they are stable over the lengths of single-digit meters, while for SG only tens of centimeters are required. It means that having a certain developed structure its performance is not degraded due to fabrication errors. Stack-and-draw technology does not allow for such precise control of air-hole sizes even if we close the top end of the preform [
33,
34]. For technological reasons we were not able to use different pressure for subsequent rows of air-holes as suggested in [
35,
36], but there are a number of factors influencing the final structure, including velocity of drawing, temperature distribution in the furnace, length of the furnace, thickness of the fiber, localization of air-holes in the cladding. Nevertheless, the shape and symmetry of the cladding is maintained.
The air-holes in the second row are deformed and have oval or elliptical shape. The lattice constant is not preserved in the whole cladding and is reduced in the first ring of holes due to large diameter of the air-holes in the second row. For the fiber #A2 the lattice constant decreases from approx. 1.8 µm to 1.4 µm, while for the fiber #A4 from approx. 1.3 µm to 1.2 µm. The fiber #A2 has significantly bigger filling factor in the rows from 2 to 9 than in case of the designed structure. This discrepancy is decreased in the fiber #A4 through the reduction of the diameters of the air-holes that, in turn, led to the decrease of the diameters of the air-holes surrounding the core.
4. Characterization of Linear Properties of Developed PCFs
The developed fibers were characterized with respect to linear optical properties, namely mode structure, attenuation, numerical aperture (NA) and chromatic dispersion. The modes were determined at the wavelength of 1.56 µm using an amplified spontaneous emission source (ASE), capable to emit spatially coherent light in the range of 1.51–1.62 µm. The output plane of the PCF was imaged on a phosphorus-enriched CCD camera using a microscopic objective 60×/0.85, what allowed to record IR images in the range of 1.46–1.60 µm.
A change of the position of the fiber with respect to the focus of the light-introducing lens was applied to excite the fundamental and higher order modes. The measurement was performed for both long (more than 2 m) and short (40–50 cm) sections of the fibers. For long sections only fundamental mode was observed.
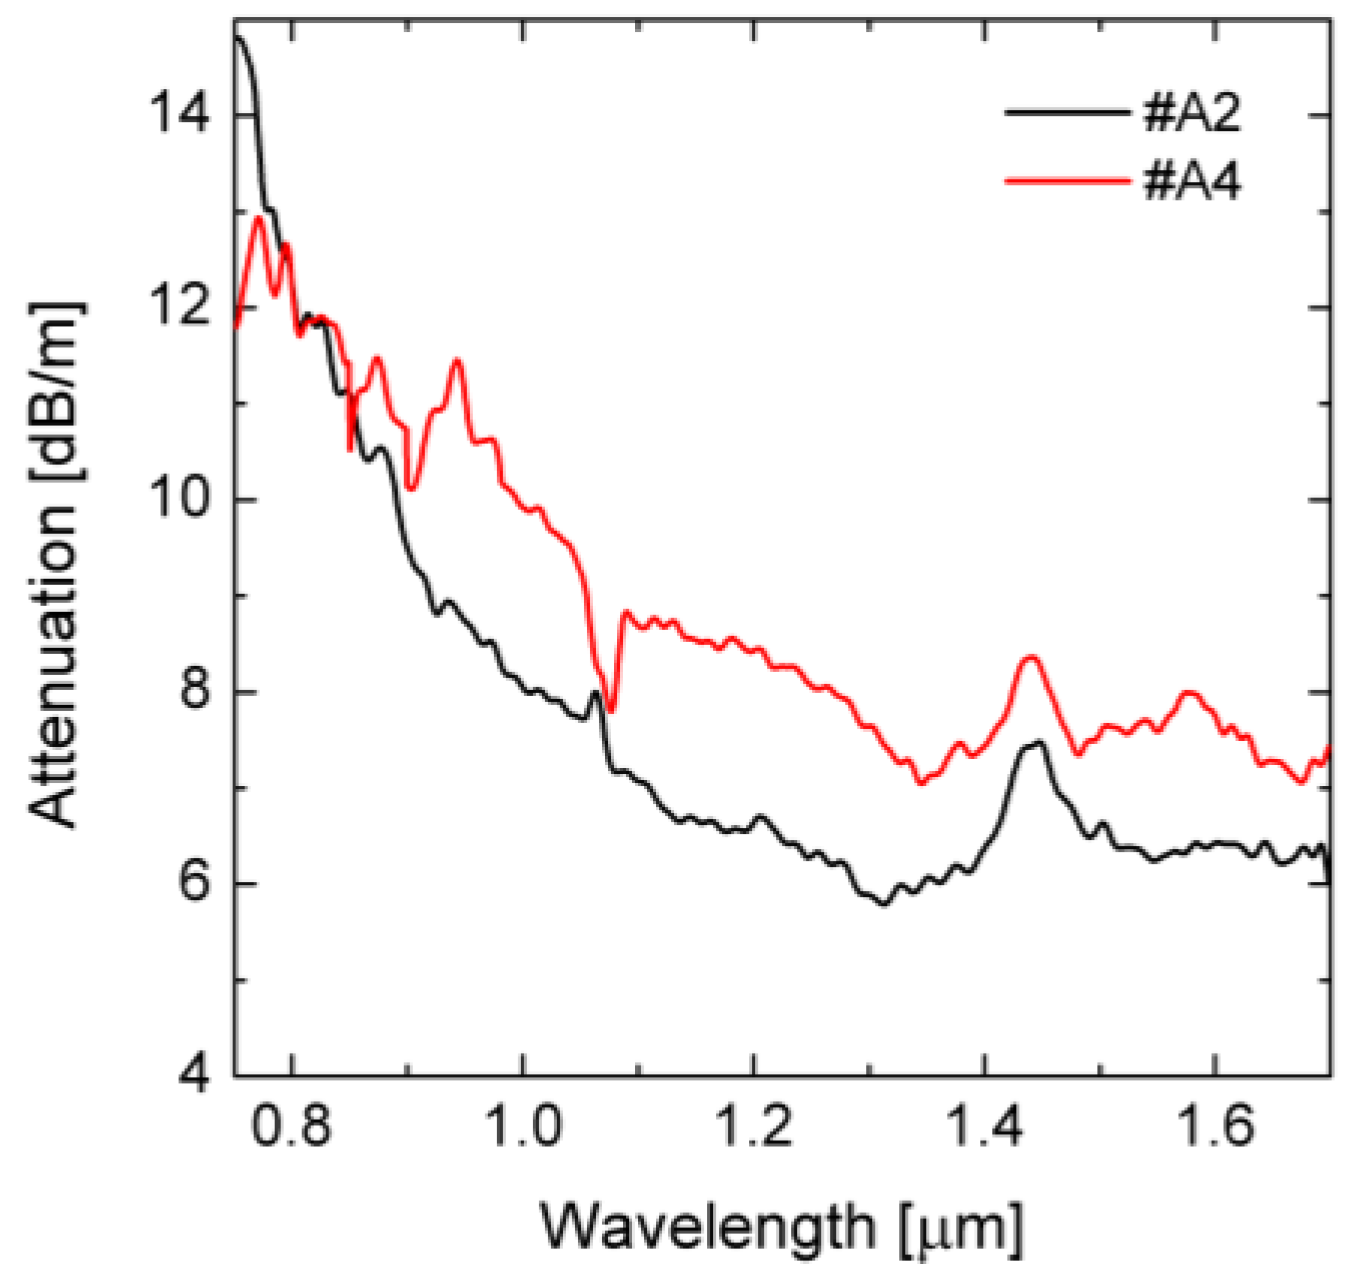
The attenuation was measured using the cut-back method. The resulting attenuation characteristics are shown in
Figure 10. The characteristics are typical for the PBG glasses with the increase below 1.30 µm and the peak of 7–10 dB/m around 1.55 µm. For
λp = 1.56 µm the attenuation reaches 6.3 dB/m and 7.7 dB/m for the fibers #A2 and #A4, respectively. Higher attenuation of the fiber #A4 compared to #A2 results from higher confinement losses and fabrication imperfections. The latter causes an emission of light to the photonic cladding and outer glass layer through micro-ruptures that are common in soft glasses.
The numerical apertures of the fibers #A2 and #A4 were measured with ASE source with central wavelength of 1.56 µm using the CCD camera and under the assumption that the beam is Gaussian with the waist located at the end of the fiber. For the fiber #A2 NA = 0.52, while for the fiber #A4 NA = 0.51.
The chromatic dispersion was both numerically modelled and experimentally measured. Simulations were performed on the basis of SEM images of the fibers, while for the measurement we used a Mach-Zehnder interferometer [
37]. The resulting dispersion characteristics are shown in
Figure 11 and the values of ZDW and the dispersion
Dp for pumping at
λp = 1.56 µm are presented in
Table 5. The dispersion of the fiber #A2 for
λp is located in the anomalous regime. In case of the fiber #A4 ZDW is located close to
λp and actually the fiber can be excited in the normal or anomalous regime.
Measured and predicted in numerical simulations chromatic dispersion characteristics do not overlap, although the overall tendency is maintained. Measured values are shifted towards shorter wavelengths. In case of the fiber #A4 the wavelength difference equals 189 µm. There are a number of factors influencing the outcome of the numerical simulations. First, the procedure of binarization of the SEM image may not be accurate and, thus, change the diameters of the air-holes. Second, the structure of the PCF along the fiber is not perfectly maintained. As a result, the actually measured fiber can be different from the fiber imaged by SEM. Third, the accuracy of the Mach-Zehnder interferometer is limited to single-digit nanometers.
The effective mode are was modelled on the basis of SEM images. For the fiber #A2 Aeff = 3.11 µm2, while for the fiber #A4 Aeff = 3.70 µm2.
5. Supercontinuum Generation in Developed PCFs
Simulations of SG were performed for both the dispersion-optimized ideal structure and the developed fibers #A2 and #A4. Generalized nonlinear Schrödinger equation (GNLSE) was solved numerically to simulate the pump pulse propagation, and specifically the split-step Fourier algorithm was implemented [
38,
39]. In the GNLSE of the form of:
where
A represents the complex pulse envelope,
z is the coordinate along the fiber (propagation) length, and the left-hand side describes linear processes, while the right-hand side describes the nonlinear processes. The second term in the left-hand side accounts for a linear loss with loss coefficient
α, and the third term represents the dispersion with the dispersion coefficient
βk associated with Taylor series expansion of the propagation constant
β(
ω) about central frequency
ω0. At the right-hand side, the nonlinear coefficient is given by
γ = n
2∙ω
0/(
c∙
Aeff), where
n2 = 2 × 10
−19 m
2/W is the nonlinear refractive index of the fiber glass, here measured using z-scan at 1064 nm [
5], the Raman response of glass is parametrized analogically to [
38,
39], and specifically the first order Raman shift frequency for the fiber glass in this work is
ΩR = ±29 THz, and the Lorentzian fit to the first-order Raman scattering term is described by time-frequency of excited optical fonons
τ1 = 5.5 fs, and time-width of Lorentz band
τ2 = 32 fs. The contribution of delayed Raman scattering response to the Kerr nonlinearity was
fR = 0.05. The simulation time window corresponded in the spectral domain to the wavelength range of 0.8–5.0 μm. The pump pulse duration (auto-correlation width) was
timp = 400 fs.
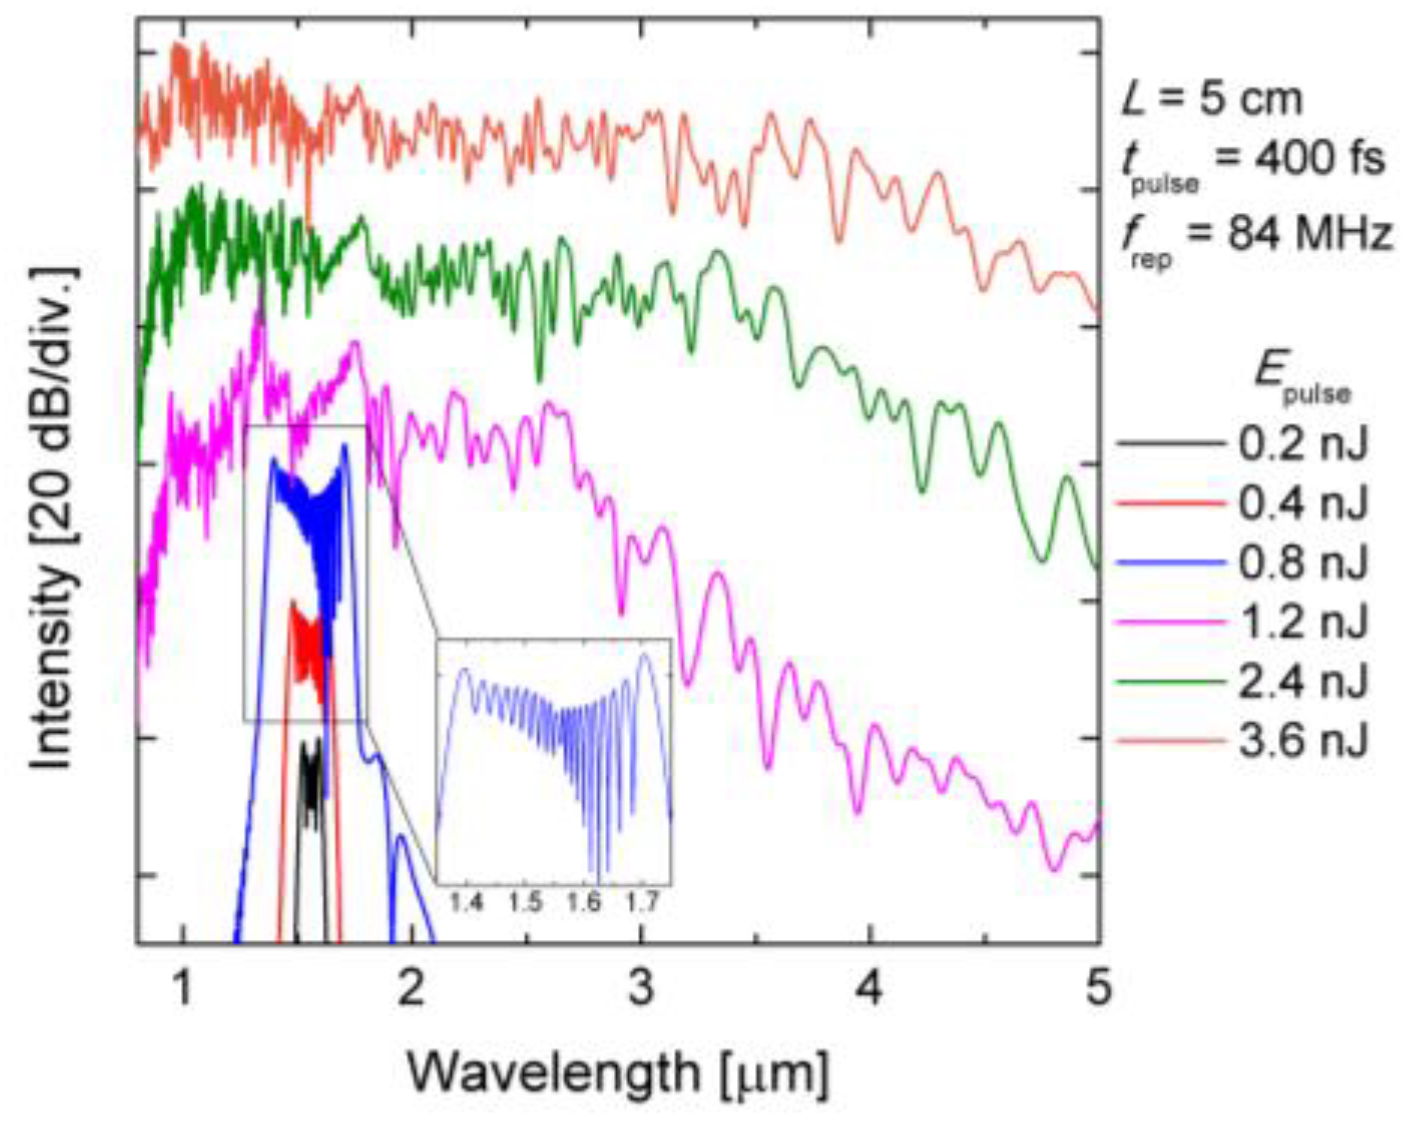
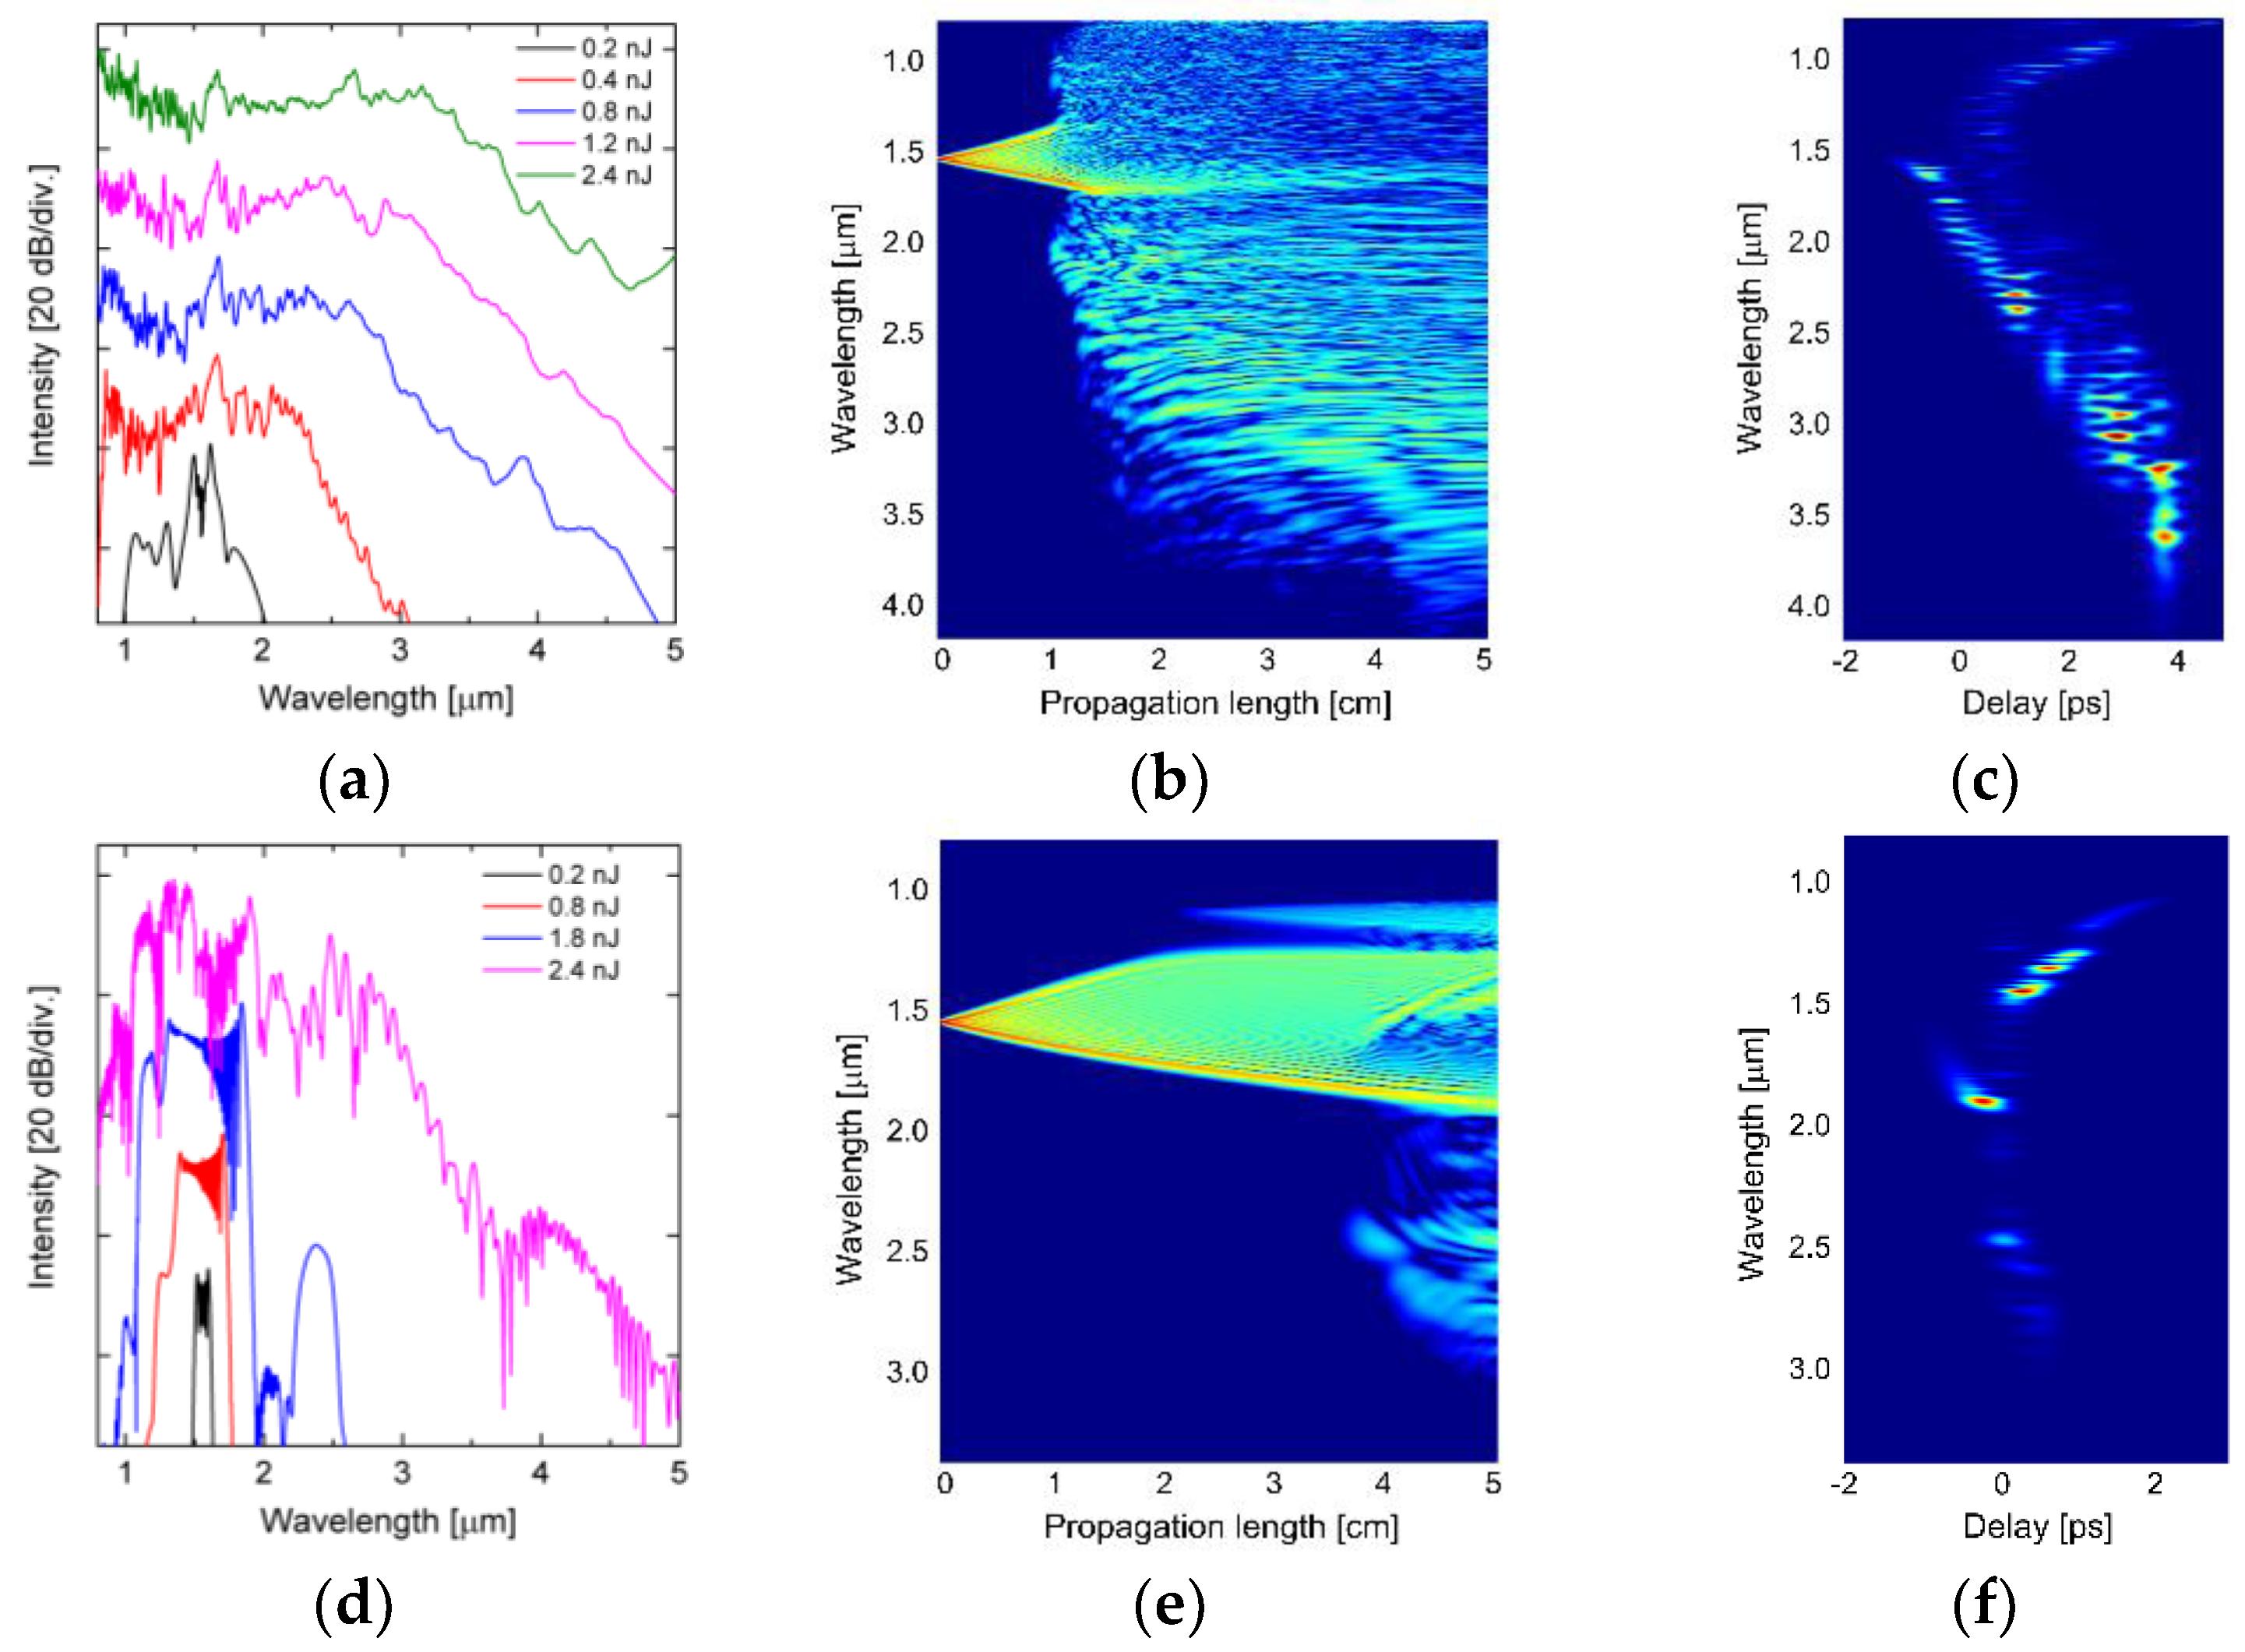
In
Figure 12 supercontinuum pulse spectra simulated for the ideal dispersion-optimized PCF are shown for the wavelength range of 0.8–5.0 μm, for different input pulse energies. The length of the fiber is 5 cm. For the pulse energy
Eimp = 0.8 nJ the broadening dynamics are limited practically to self-phase modulation (SPM) within a wavelength span of approximately 400 nm and within 20 dB dynamic range. Increasing
Eimp to more than 1 nJ results in further spectrum broadening, and for
Eimp = 2.4 nJ supercontinuum goes up to 3.6 μm in IR within 20 dB dynamics. In
Table 6 dispersion lengthscale
LD, nonlinear lengthscale
LNL, and soliton fission lengthscale
Lsol for
N-order solitons are summarized, for the pulse energy
Eimp = 2.4 nJ. The dispersion lengthscale is expressed as
LD =
t02/|
β2|, while the other lengthscales are defined as
LNL = 1/
γP0 (where
P0 is the peak pump power),
Lsol =
LD/
N, and the soliton order is expressed as
N =
LD/
LNL.
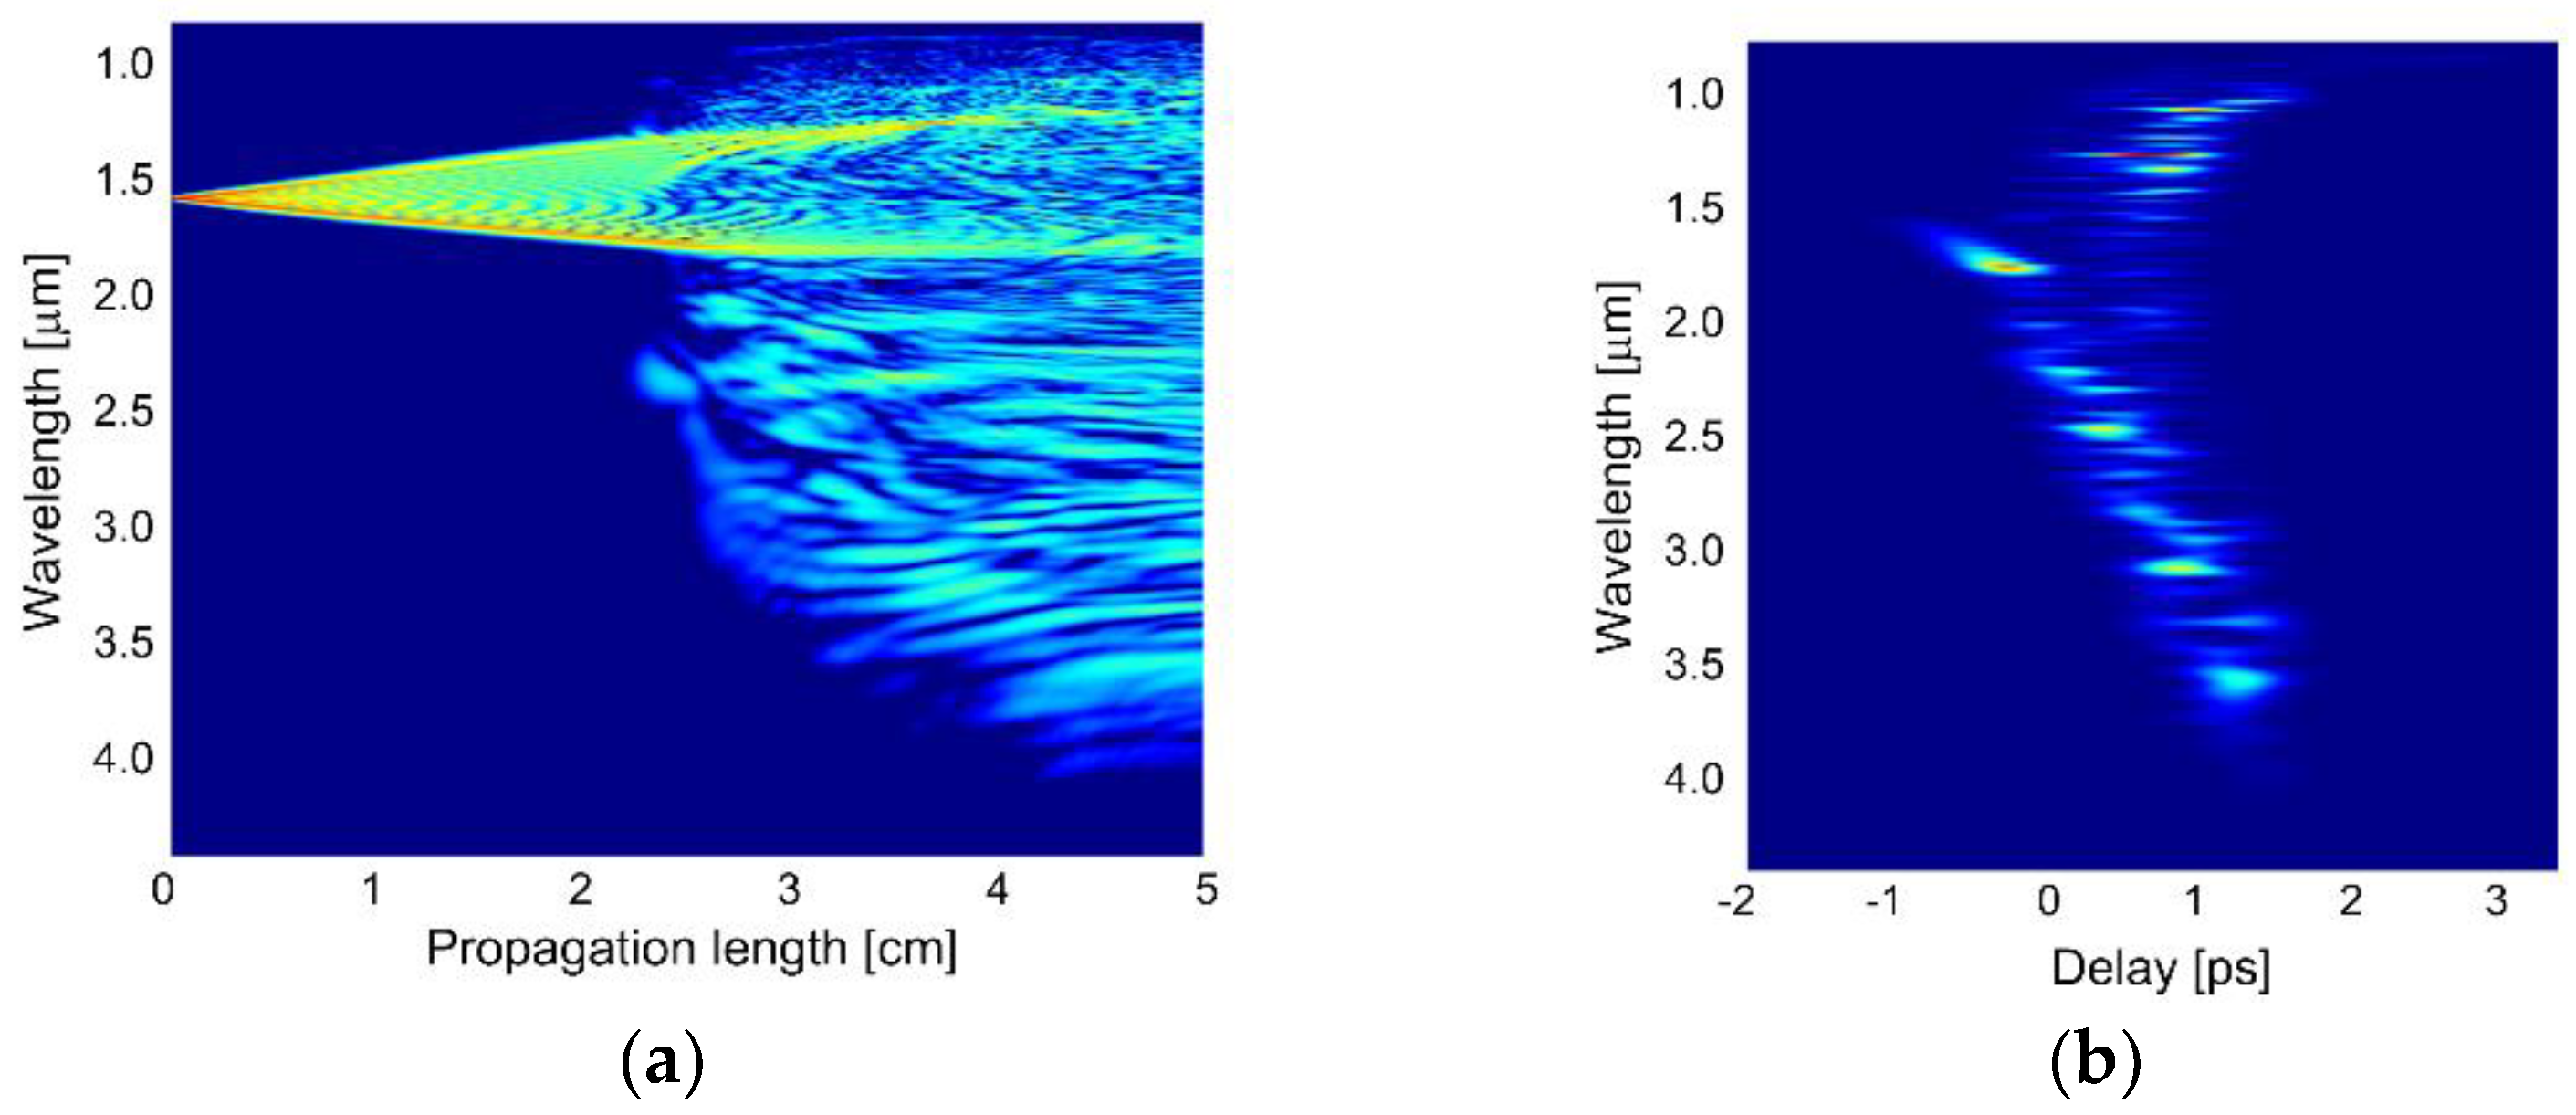
The evolution of the pulse as a function of the propagation length is shown in
Figure 13a, while the calculated group delay trace (spectrogram) is shown in
Figure 13b, for
Eimp = 2.4 nJ and
L = 5 cm. At the beginning of the fiber, the spectrum of the pulses expands due to SPM. This is expected, because
LNL is larger than
LD, therefore SG occurs with dominance of nonlinear contribution over dispersion. Around 2 cm of propagation, the high order input soliton has already undergone fission into multiple low order solitons, which is in rough agreement with the 1.3 cm value estimated using formula
Lsol =
LD/
N. Due to high order
N = 334 of the soliton introduced by the pump, the supercontinuum is expected to be time-incoherent, despite femtosecond pumping [
40]. The modulation instability lengthscale can be estimated as 16∙
LNL, which in this case is just over 6 cm. This result provides rationale for assuming the fiber length of 5 cm, in order to observe supercontinuum generation before amplification of significant noise. Soliton fission and their subsequent Raman redshift is accompanied by a radiation of higher frequencies, the dispersive waves, which is responsible for broadening of the supercontinuum spectrum towards shorter wavelengths. As a result of the decay the lower-order solitons are shifted towards IR due to Raman scattering (SSFS, soliton self-frequency shift). Because of relatively low anomalous chromatic dispersion at wavelengths redshifted from ZDW (0–36 ps/(nm·km)) broad phase matching can be achieved in the range of 1–4 μm for the degenerated four-wave mixing.
In the next step, nonlinear propagation simulations were conducted using fiber linear properties data calculated for real fiber structures using SEM images of the fibers #A2 and #A4. The results are shown in
Figure 14, while in
Table 7 nonlinear parameters are shown, namely group velocity dispersion
β2, third-order dispersion
β3, nonlinear coefficient
γ, dispersion length
LD, nonlinear length
LNL, soliton decay length
Lsol, order of solitons
N, for
λp = 1.56 µm and
Eimp = 2.4 nJ.
In the nonlinear propagation simulations for the fiber #A2, it is assumed that pumping falls into wavelengths, where there is anomalous chromatic dispersion. Results of simulations are summarized in
Figure 14a–c. High nonlinearity results in pulse nonlinear lengthscale of
LNL = 0.3 mm, however
LD is also short, one order of magnitude larger than
LNL, as opposed to two orders of magnitude in the ideal fiber. First 1 cm of propagation is dominated by SPM, which is followed by soliton fission and Raman redshift, accompanied by dispersive wave generation. Calculated soliton order is over three times smaller, than in the fiber considered in the design stage, thus the group delay trace shows several discernible soliton features between around 0.5 and 4 ps of delay (
Figure 14c). Due to very short nonlinear length scale, the estimated modulation instability lengthscale is just below 5 cm, suggesting onset of noise amplification and decoherence of supercontinuum pulses over the final 2 mm of the fiber. The width of the spectrum is 0.8–3.7 μm within 20 dB dynamics.
In the nonlinear propagation simulations for the fiber #A4, the
λZDW >
λp and the pump pulse is introduced at wavelengths with normal dispersion regime. The broadening is again initiated by SPM, because
LNL is still roughly 20 times shorter than
LD. When the redshifted part of SPM reaches and crosses ZDW at 1.714 µm, solitons begin to emerge at anomalous dispersion wavelengths. Their redshift is faintly visible in the group delay trace in
Figure 14f just before end of 5 cm of propagation. In this scenario, the redshifting solitons also generate dispersive waves across ZDW, which here result in destructive beating with the normal dispersion-broadened spectral components, giving rise to complicated spectral evolution both in the group delay (
Figure 14f) and along the fiber length (
Figure 14e). The supercontinuum spectrum covers 1.0–2.9 μm.
For the coupling of pump laser light to the fibers in the experimental part of work, two microscopic objectives 40×/0.65 were used. At the output, the collimated beam was focused on a front face of a multi-mode fiber, using an achromatic lens with
f = 50 mm. The multi-mode fiber was connected to an optical spectrum analyzer (OSA). Two OSAs were used, both from Yokogawa, one device covered spectral range of 0.6–1.7 µm and the other of 1.2–2.4 µm. The length of both nonlinear PCFs (#A2 and #A4) was
L = 15 cm and the coupling efficiency was estimated at 15%. The length of the fiber samples was motivated with handling convenience. The broadening of the spectrum as a function of average power
Pavg of the laser source is shown in
Figure 15.
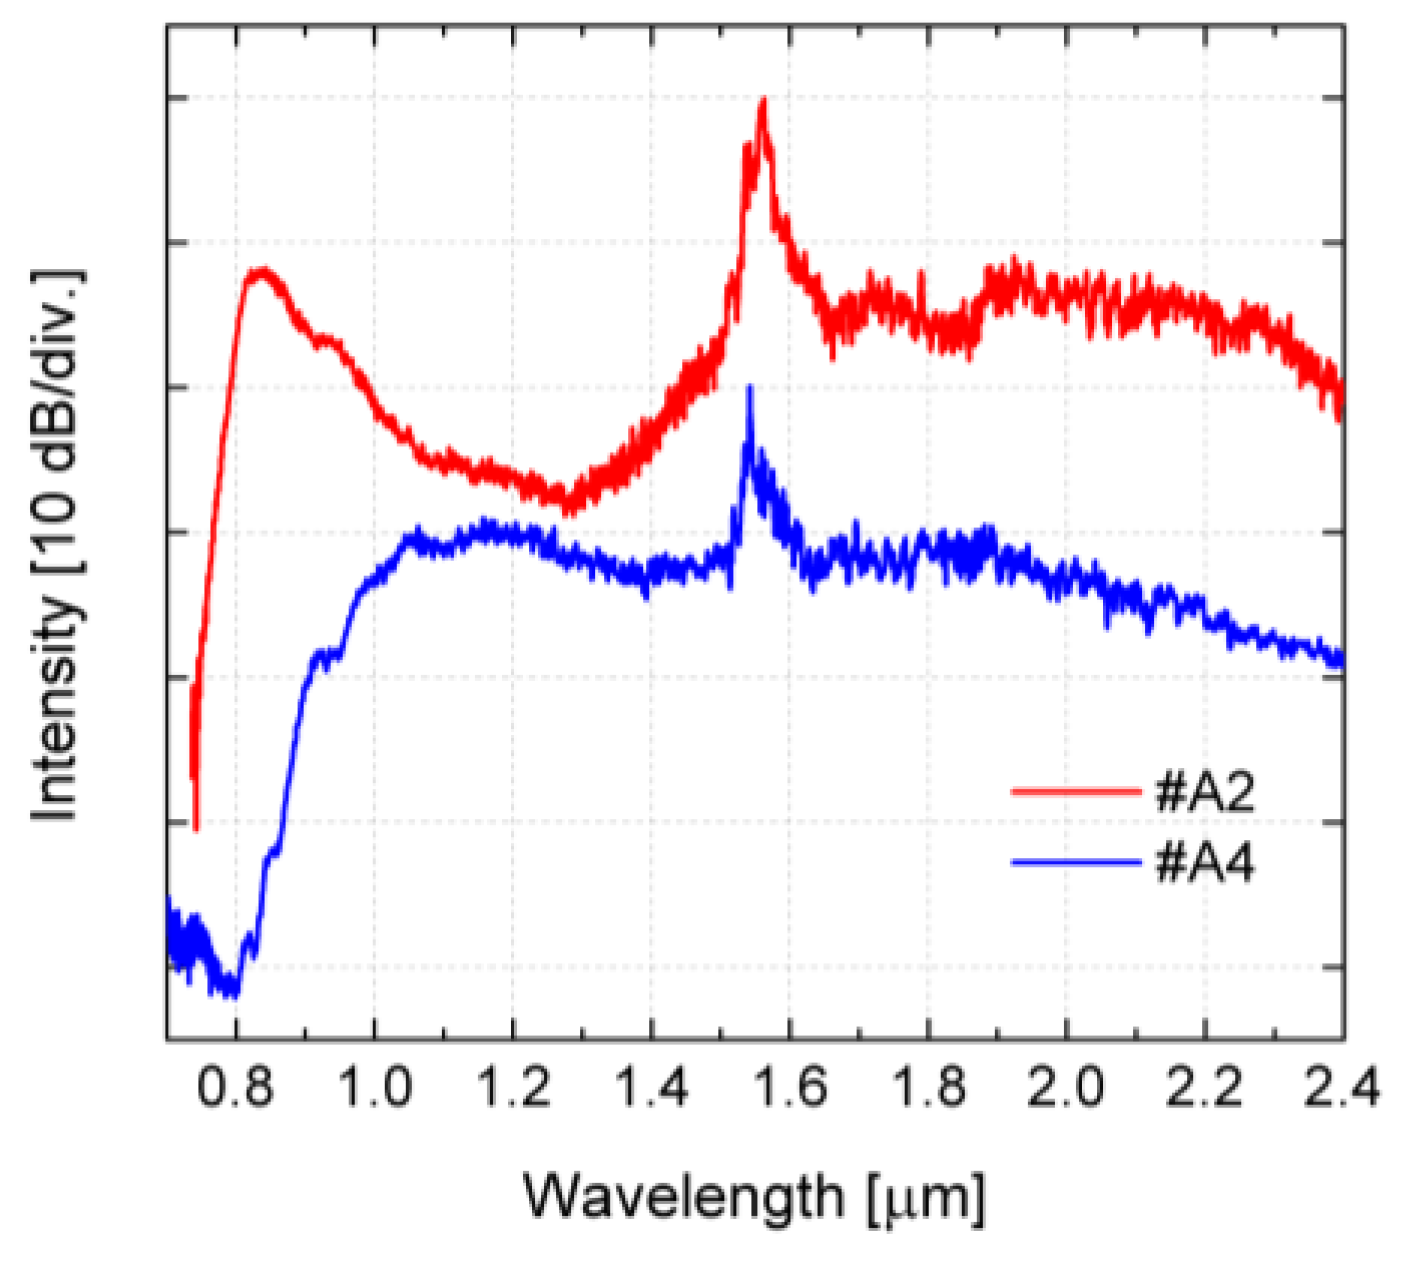
Taking into account the coupling efficiency approx. Pavg = 100 mW was obtained, which corresponded to peak power of P0 = 2.95 kW and coupled pulse energy of Eimp = 1.18 nJ. In the physical experiments with the fiber #A2, pumping is in the anomalous dispersion wavelengths, and the spectrum is efficiently broadened towards the short-wave range. For Pavg = 60 mW (Eimp = 0.11 nJ) a peak appears for the wavelength of 0.96 μm caused by the dispersive wave caused by the soliton decay in the long-wavelength range. At this pump power the spectrum is still non-uniform and exhibits a decrease of the intensity in the range of 0.96–1.4 μm along with the spectrum limit at 1.80 μm. The increase of the pump power results in the broadening of the spectrum towards IR. For wavelengths shorter than λp the spectrum becomes smooth and flat and the short-wavelength limit is shifted towards visible wavelengths but slower than long-wavelength limit. For Pavg = 660 mW (Eimp = 1.18 nJ) the spectrum still shows a clearly pronounced dispersive wave separated by a slightly less intense plateau in the range of 0.84–1.51 μm wavelengths. For the dynamic range of 30 dB the spectral coverage of SG in fiber #A2 is not less than 0.76–2.4 μm wavelengths, since the detection limit of OSA was 2.4 μm.
The fiber #A4 is pumped very close to the ZDW, and part of the pump pulse spectrum falls into normal dispersion wavelengths, while part of the pulse spectrum covers anomalous dispersion wavelengths of the fiber. For average power of Pavg = 60 mW the pulse is broadened only due to SPM and its width is equal to 0.41 μm (1.35–1.76 μm) within 30 dB dynamics. The increase of the power of the laser in the range of 90–510 mW broadens the flat supercontinuum spectrum in the short-wavelength range. For waves longer than 1.56 μm the intensity decreases with the wavelength. Starting from Pavg = 260 mW a blue-shifted peak appears in the spectrum at about 0.9 μm that is assigned to a dispersive wave related to a soliton, which emerges at the anomalous dispersion side of the ZDW, where enough energy is transferred over to the anomalous dispersion wavelength range of fiber. For the maximum available pump power, the supercontinuum covers wavelength range of 0.86–2.4 μm (measurement limited by OSA sensitivity range). This less reach in terms of blue-shifted wavelength than the width for the fiber #A2, but at the same time the spectrum is flatter than in the case of #A2 fiber.
In
Figure 16 the characteristics of supercontinuum spectrum are compared, for the fibers #A2 and #A4, for
Pavg = 660 mW. The width of supercontinuum spectra, for different dynamics and the length of the fibers 15 cm, are shown in
Table 8.

 ,
, 


