Development and Application of an Atmospheric Pollutant Monitoring System Based on LoRa—Part I: Design and Reliability Tests

Abstract
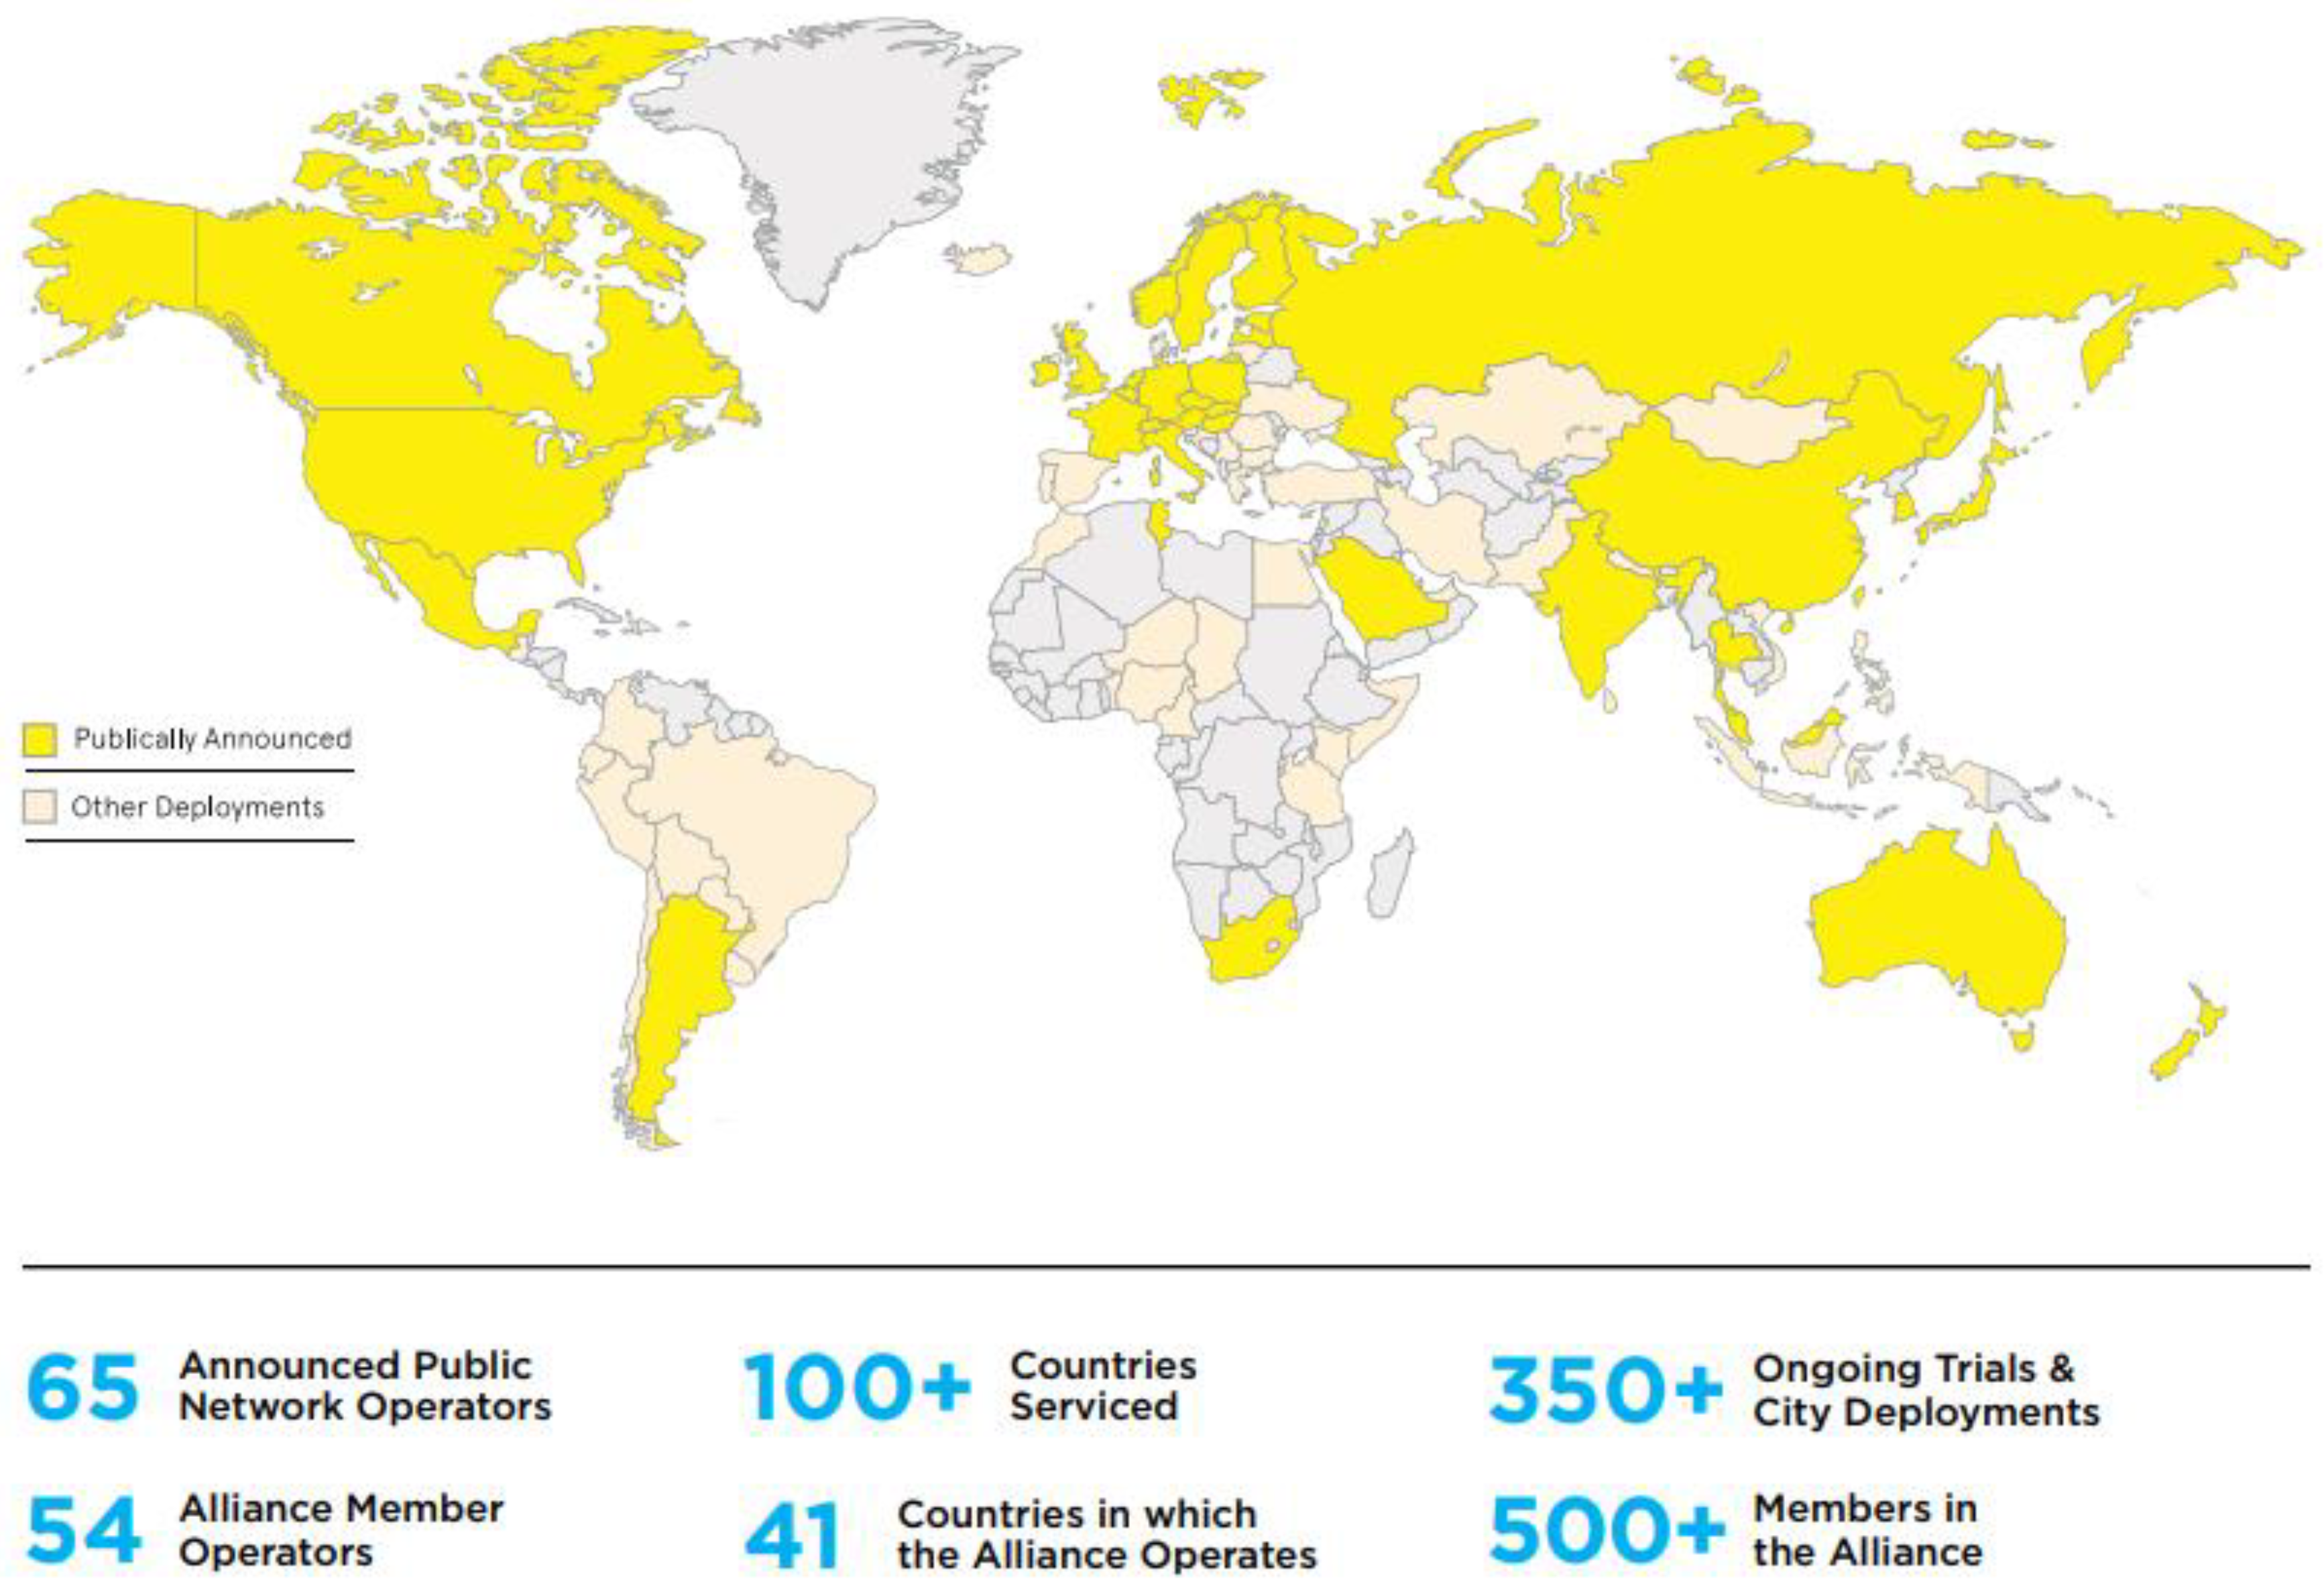
:1. Introduction
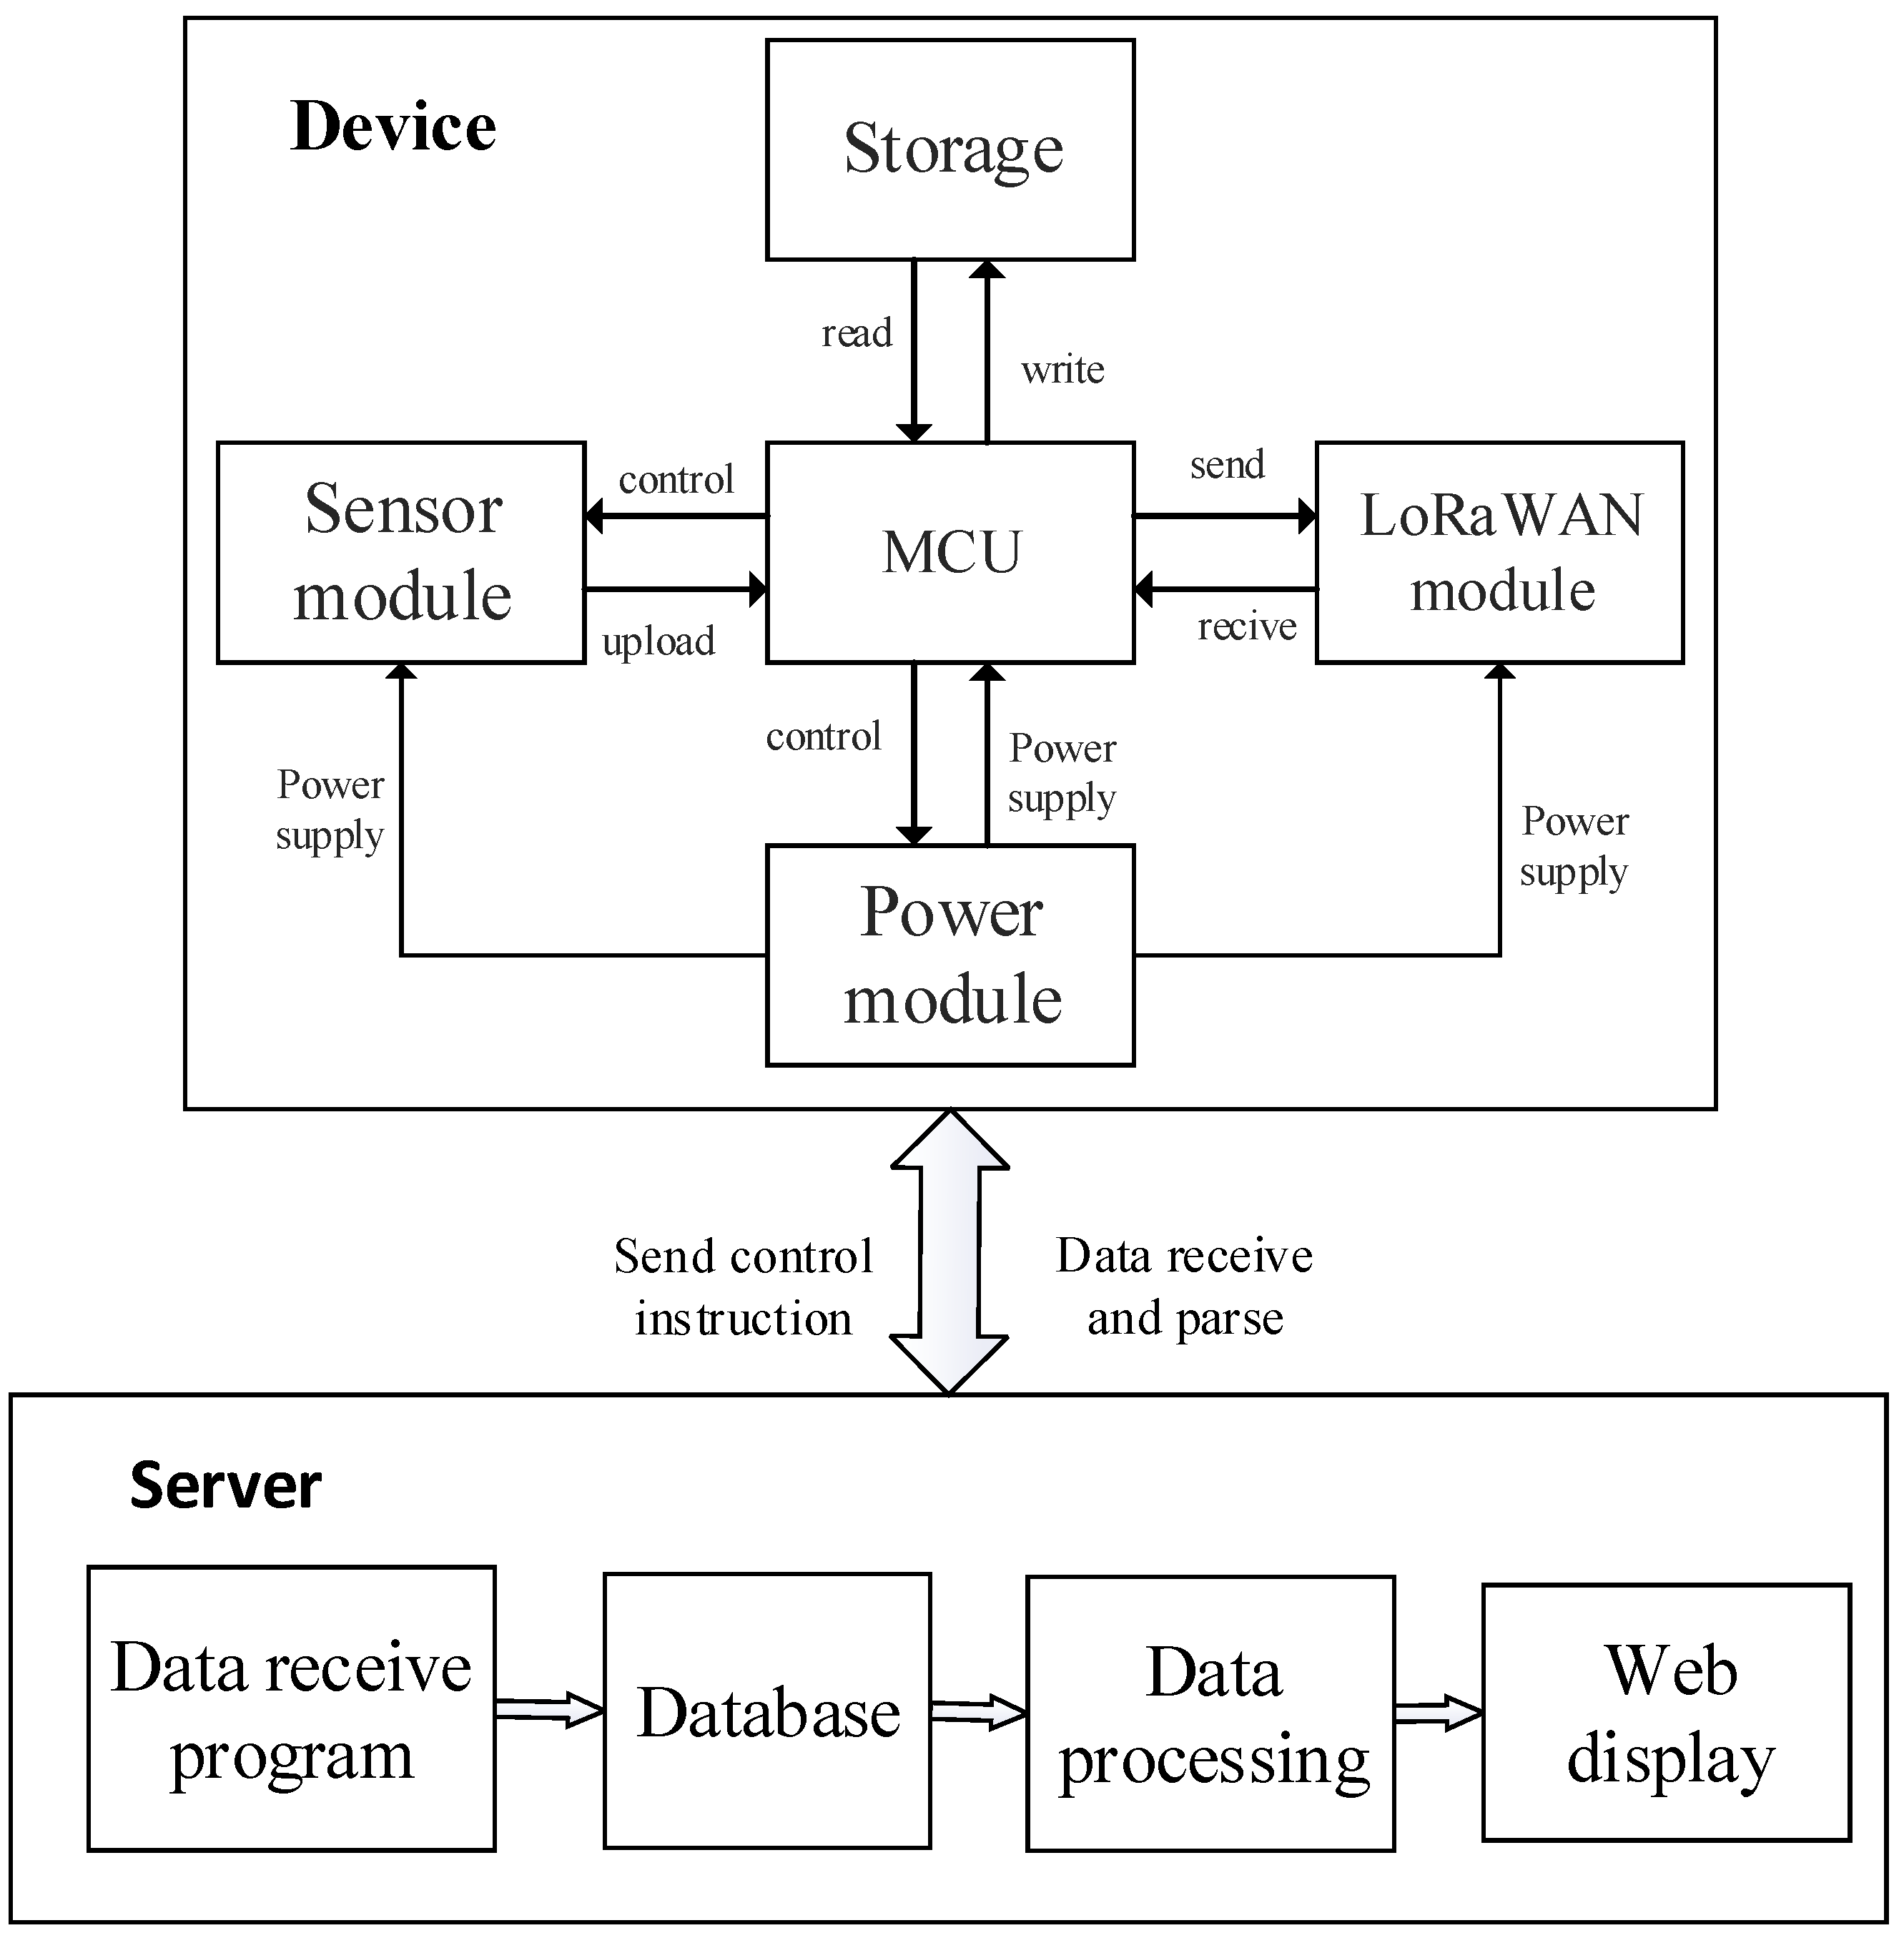
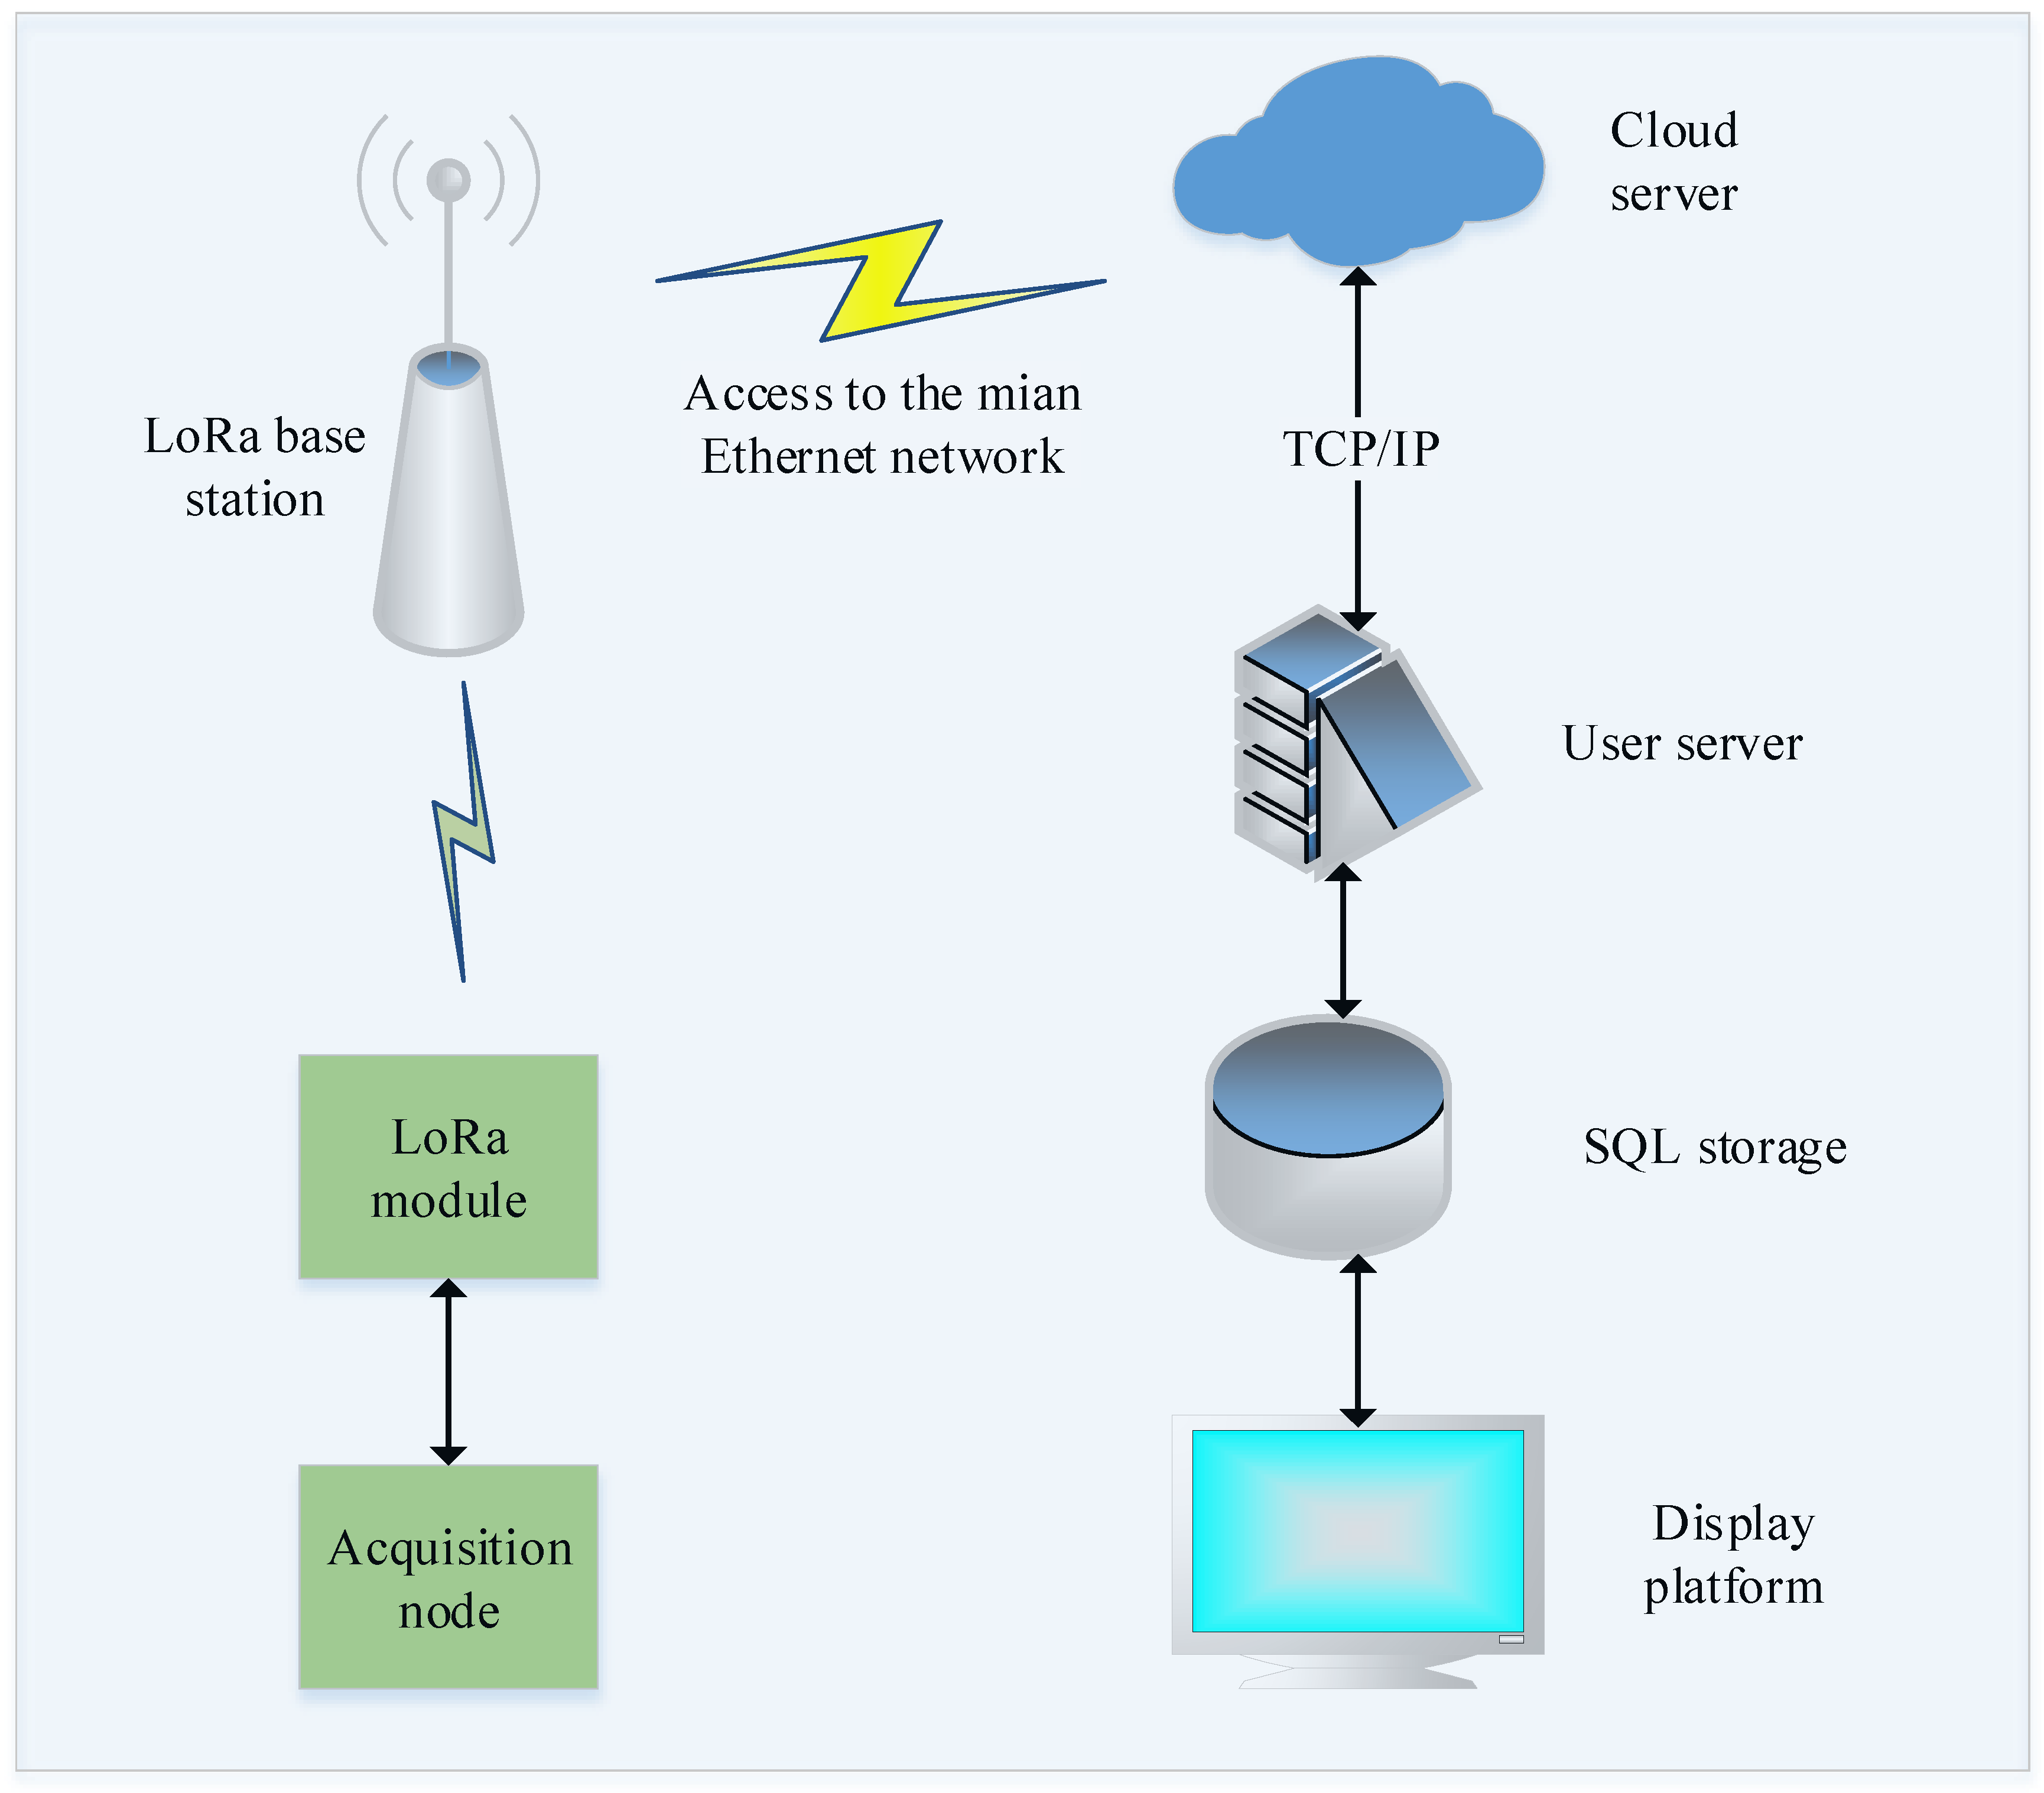
2. System Structure
2.1. Node Device
2.2. Server Side
3. System Design
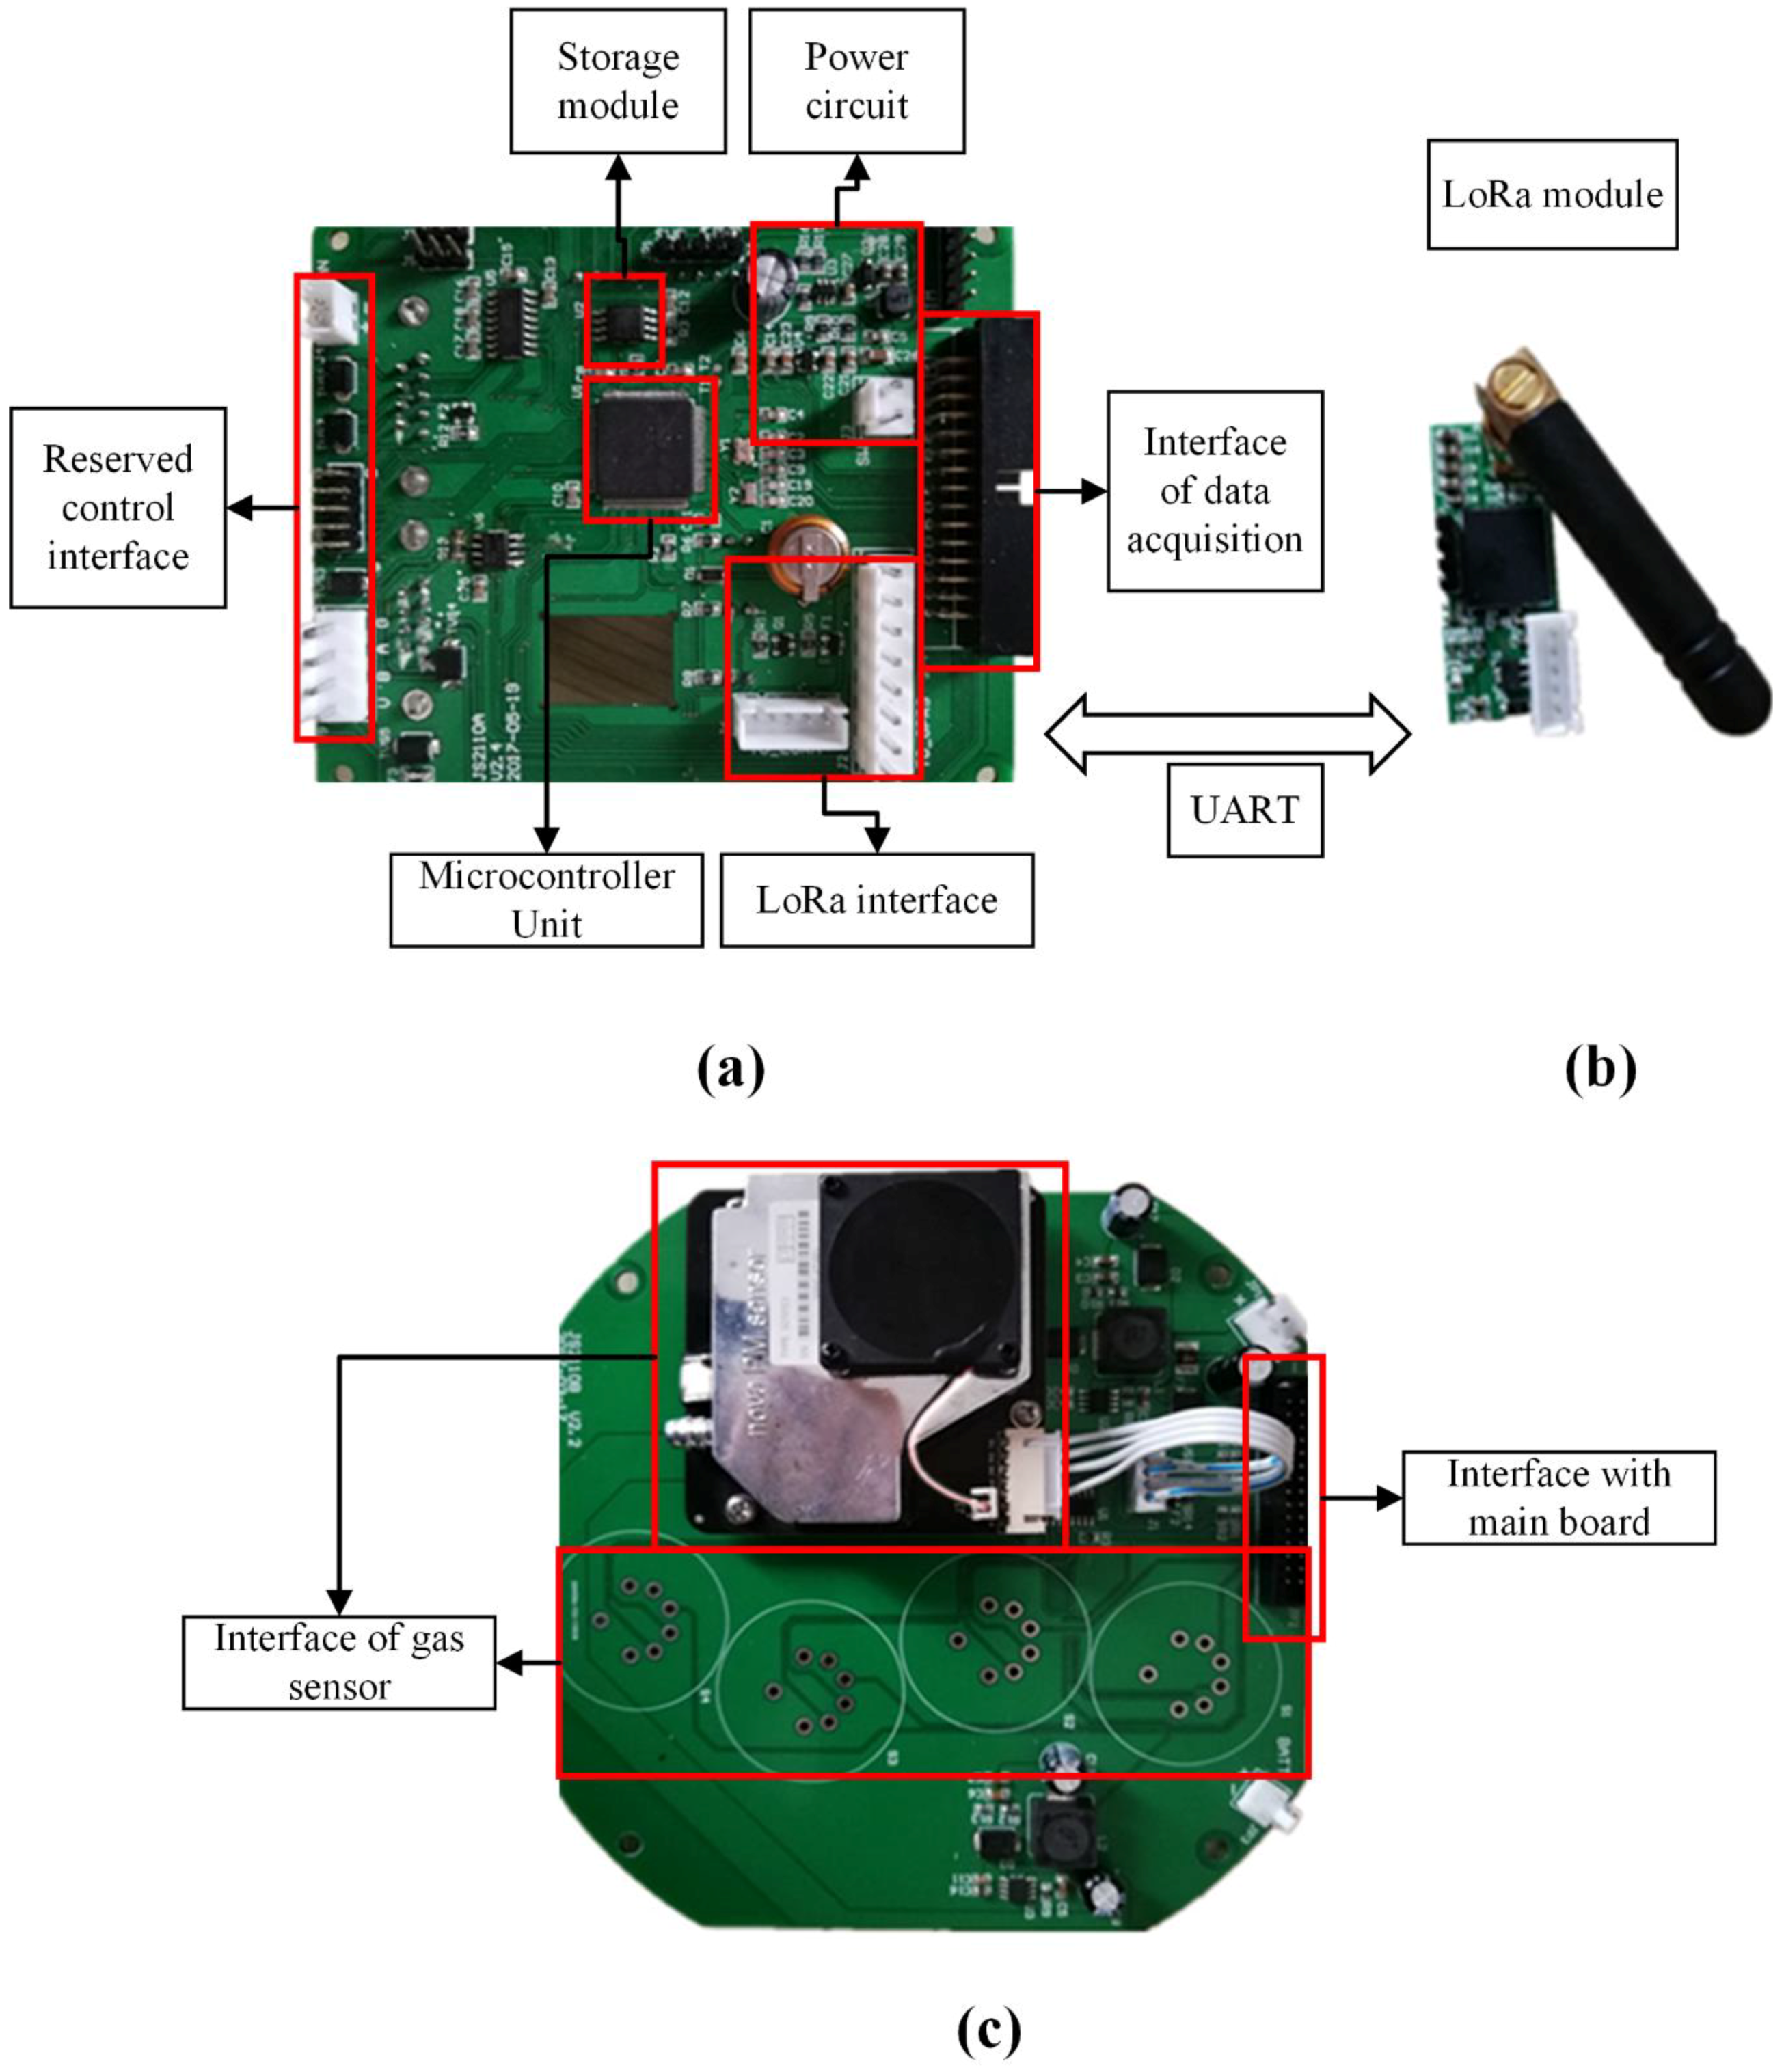
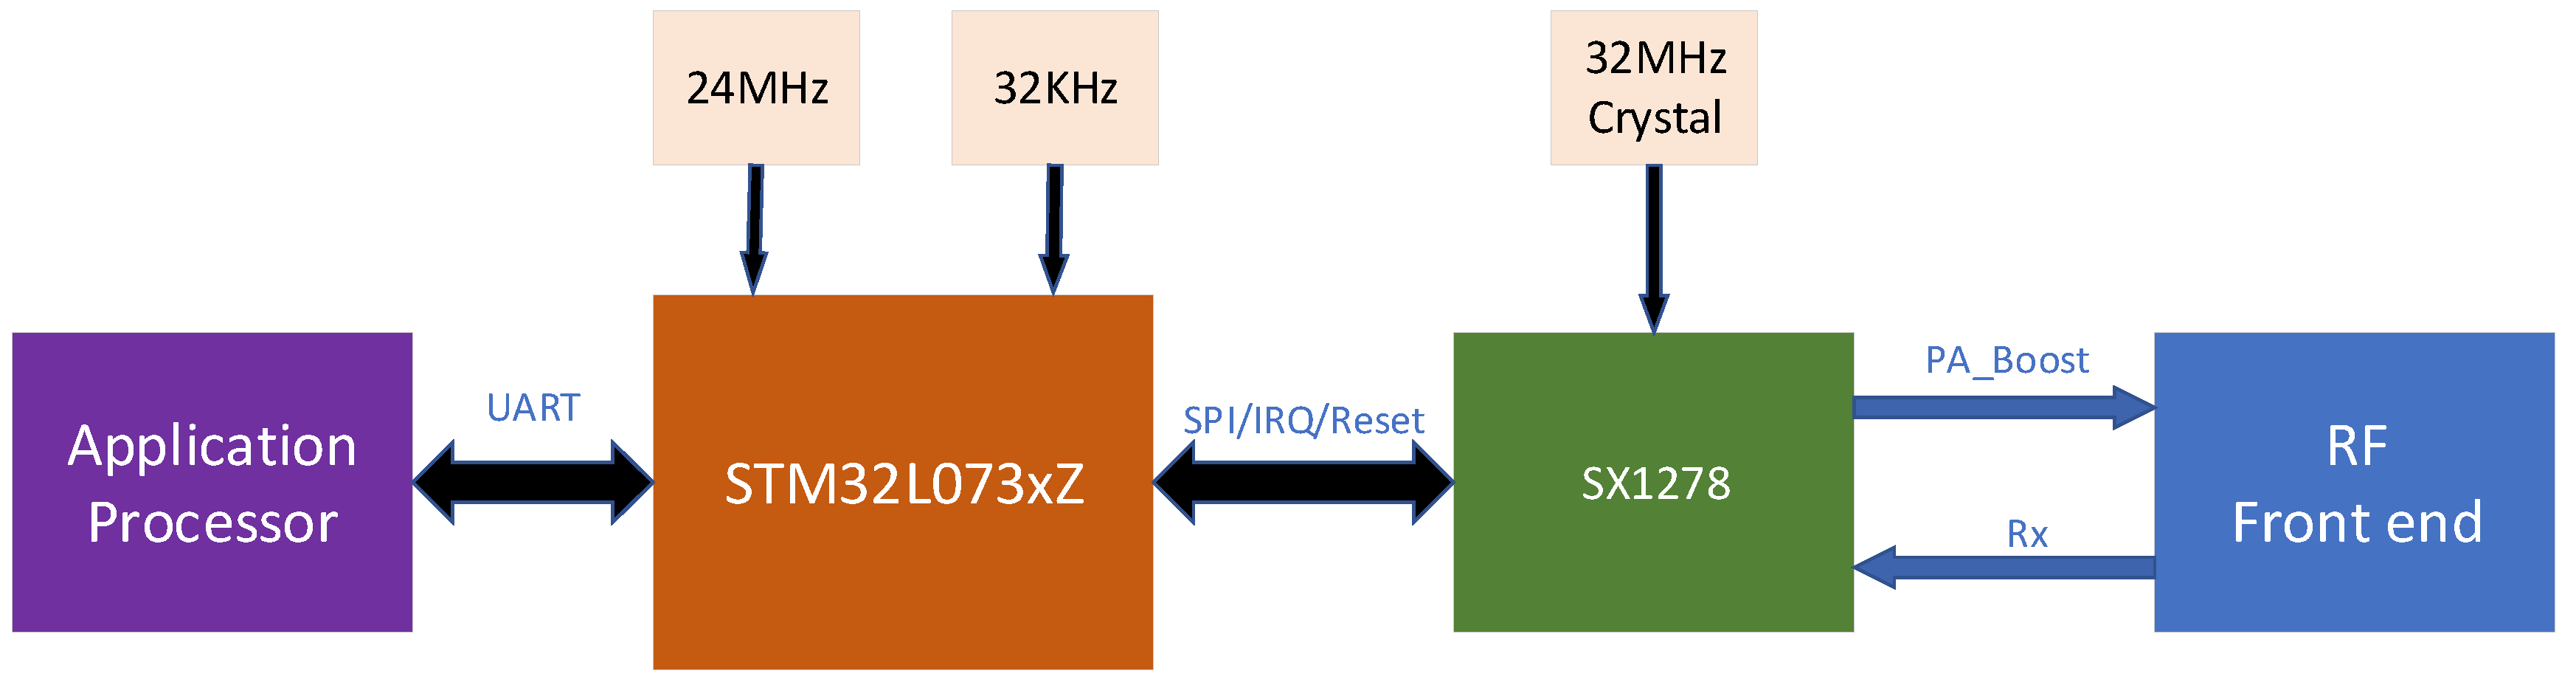
3.1. Hardware Design
3.1.1. Main Board
3.1.2. Data Collection Board
3.2. Software Design
3.2.1. Software Design of Server
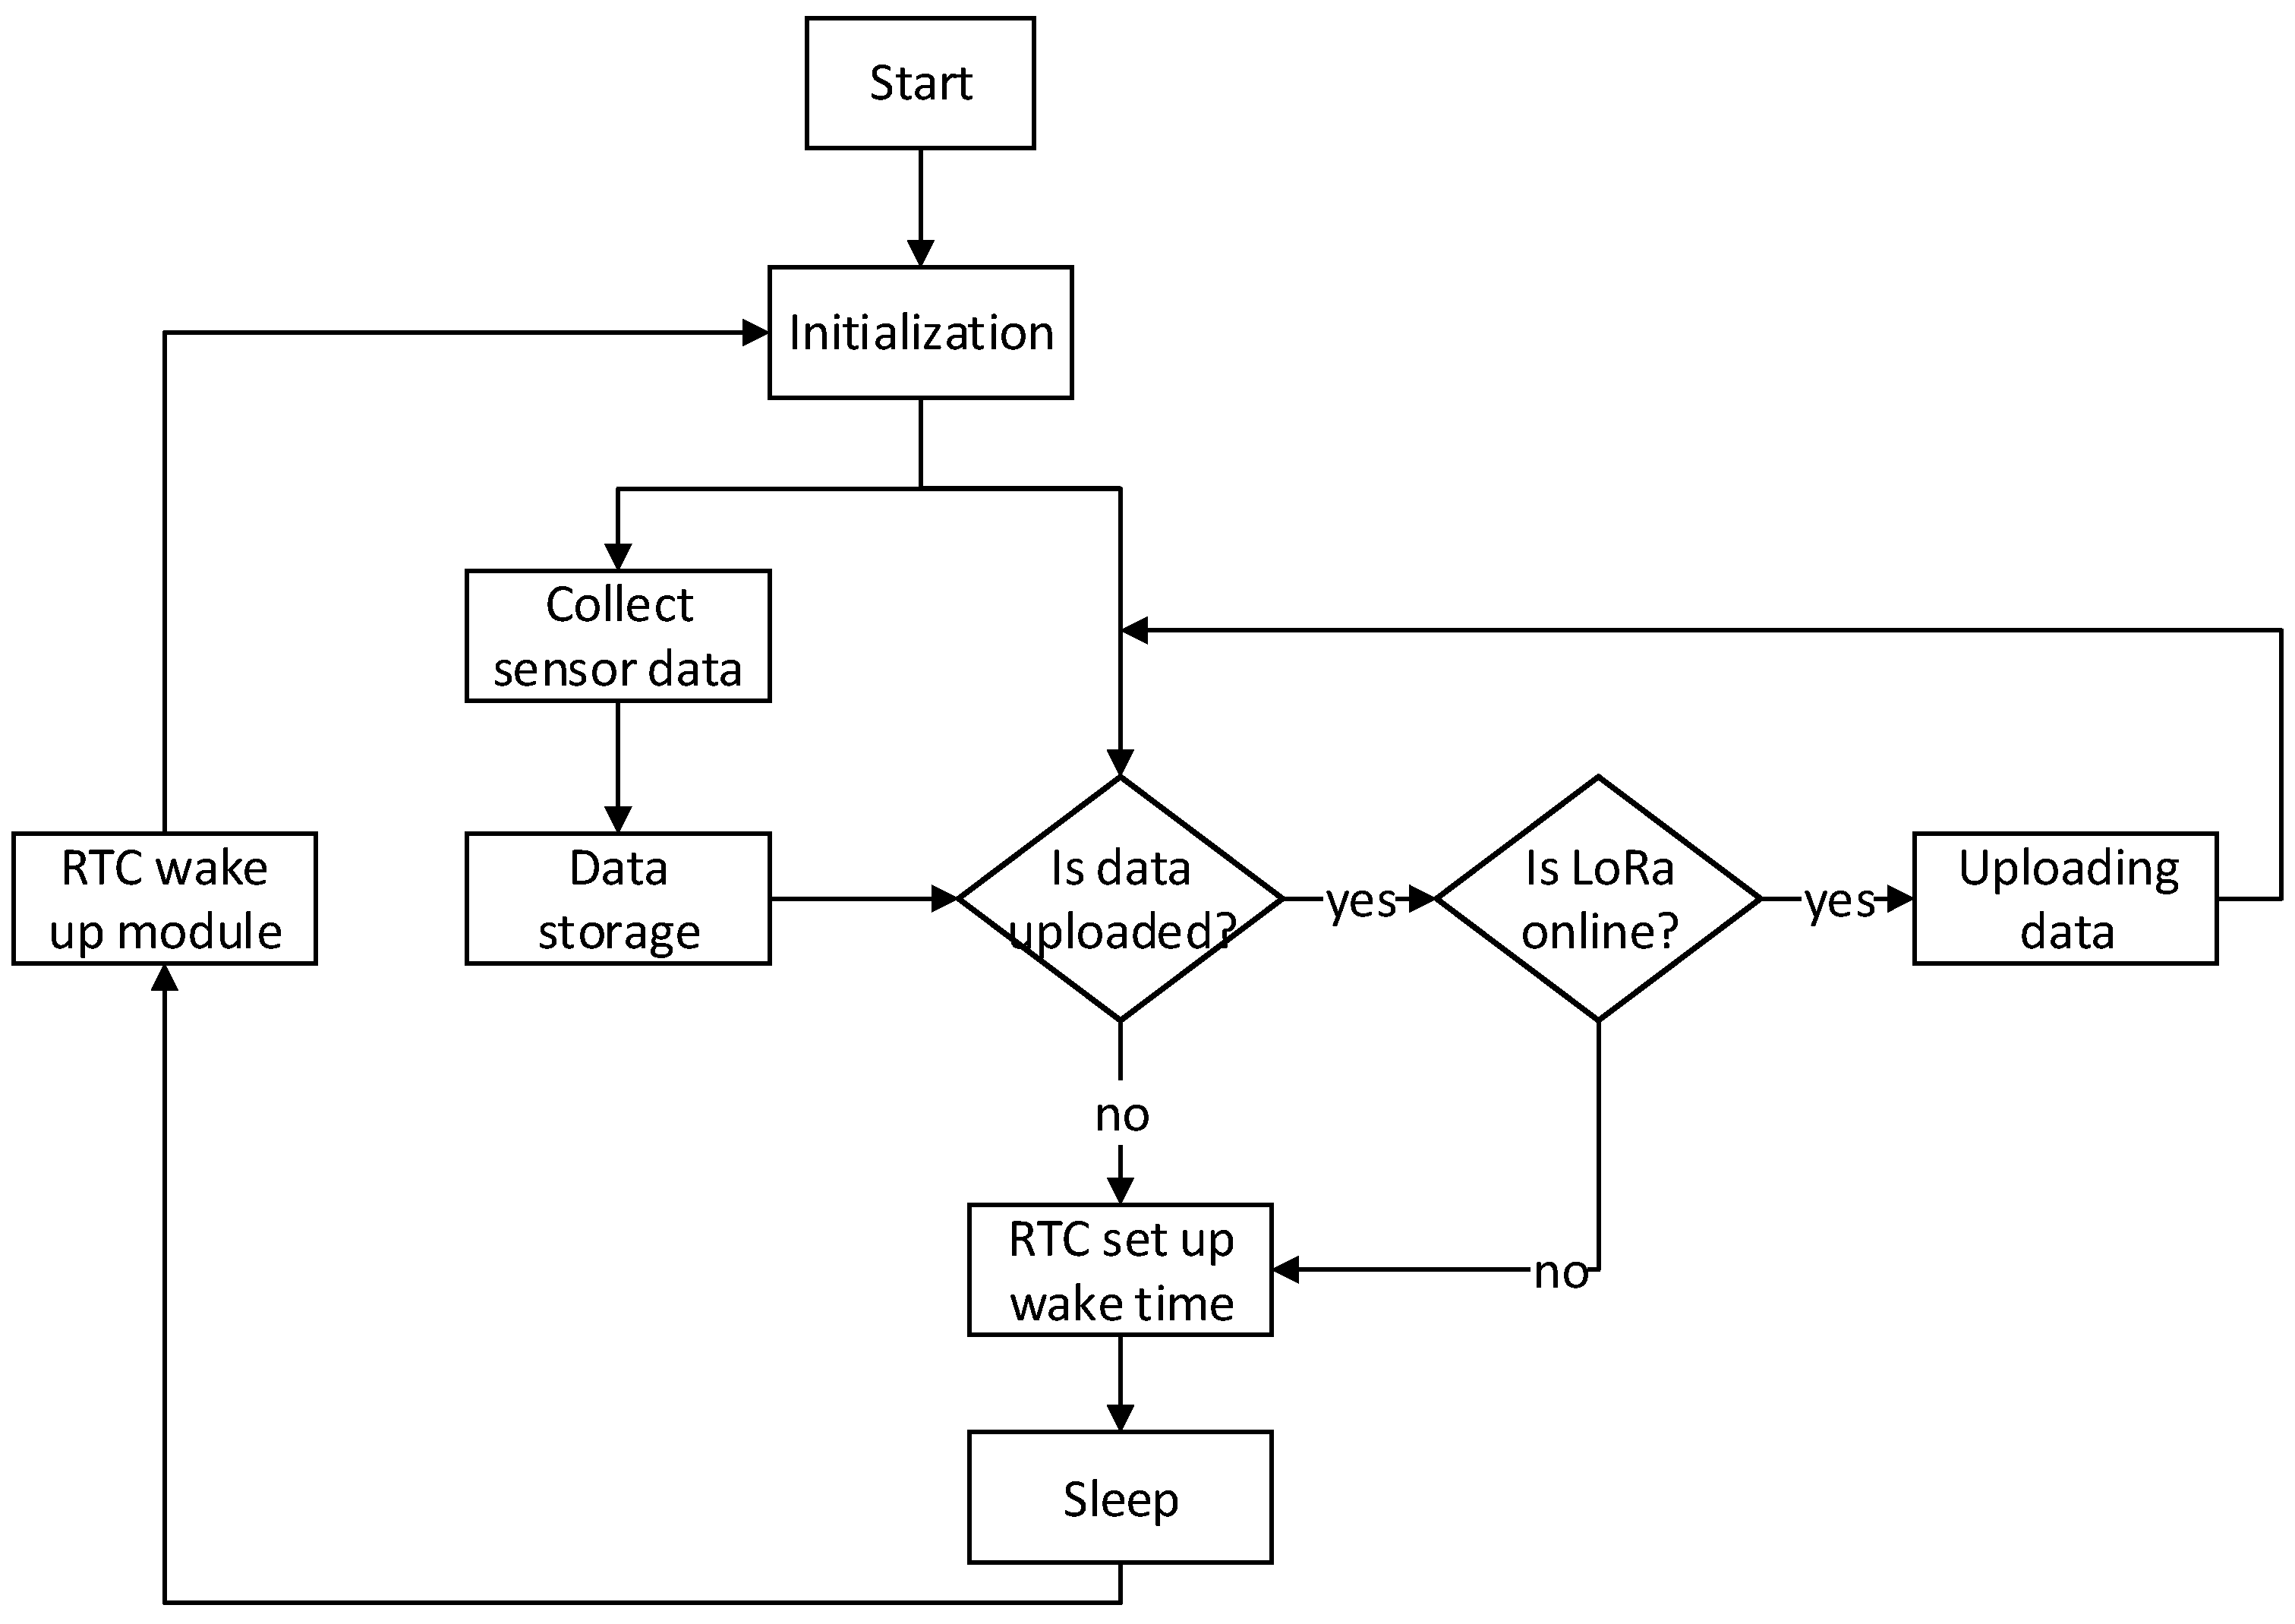
3.2.2. Embedded Software Design
4. Key Technology
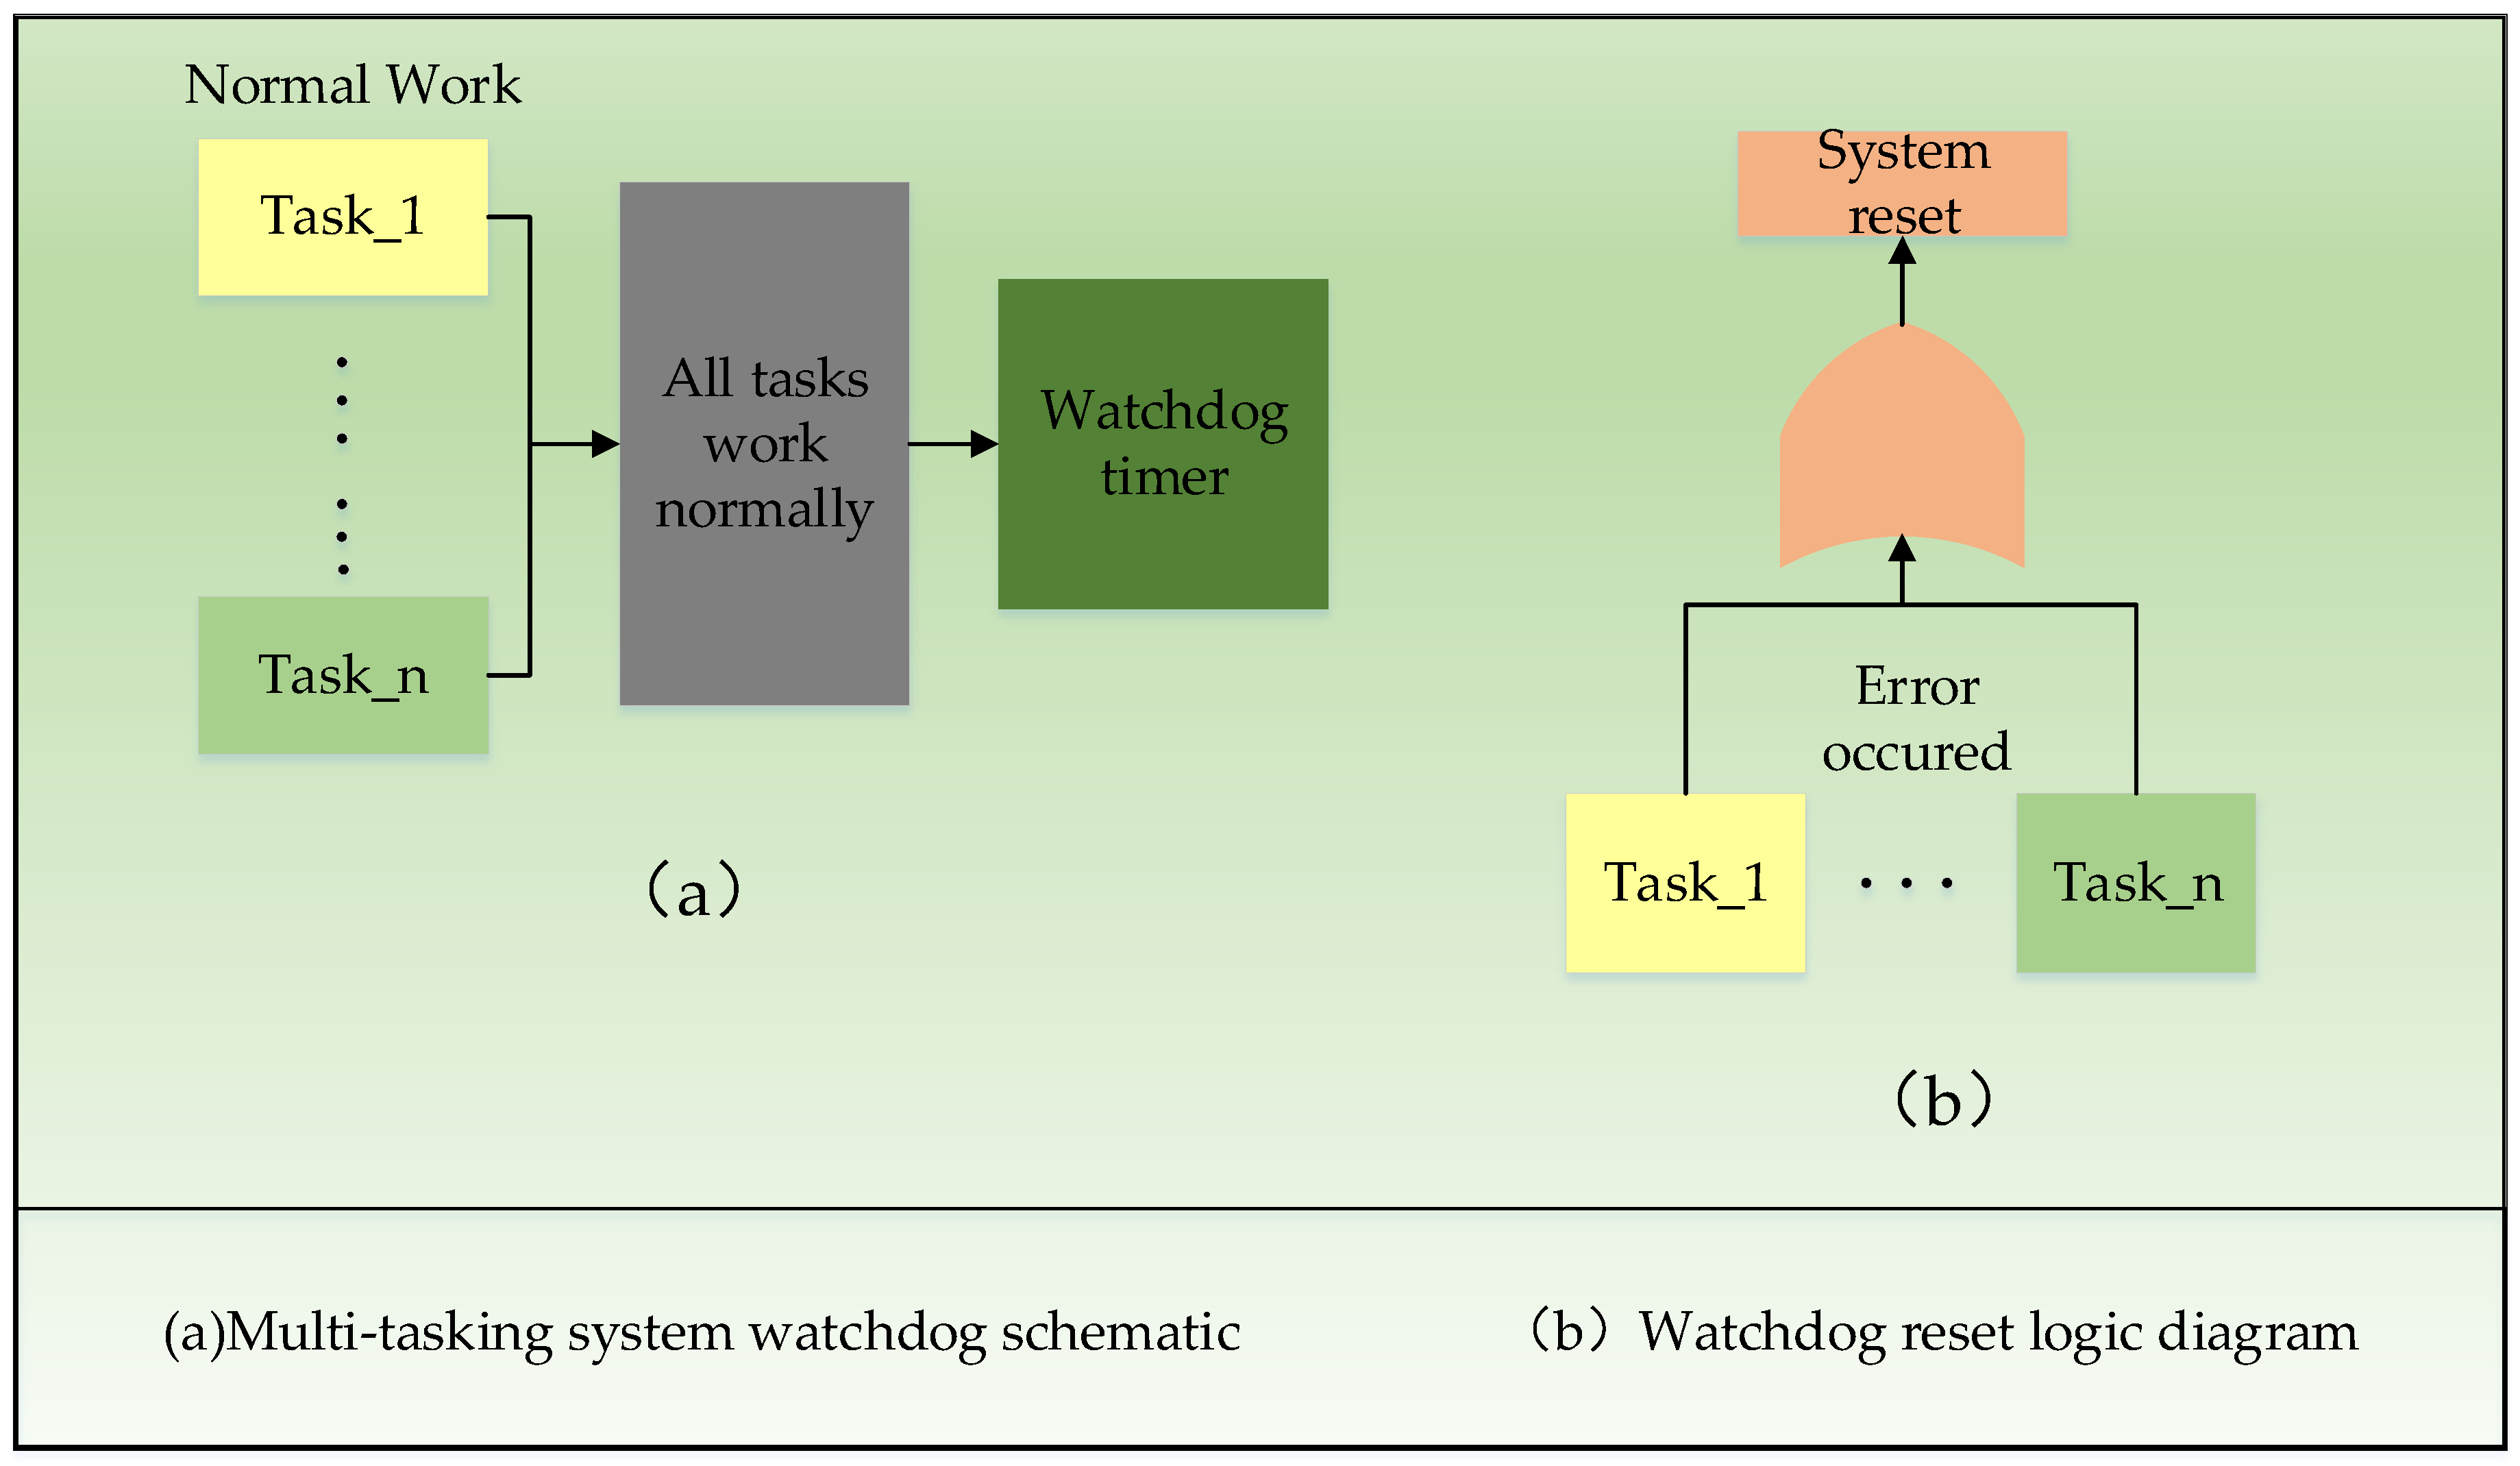
4.1. System Operational Stability
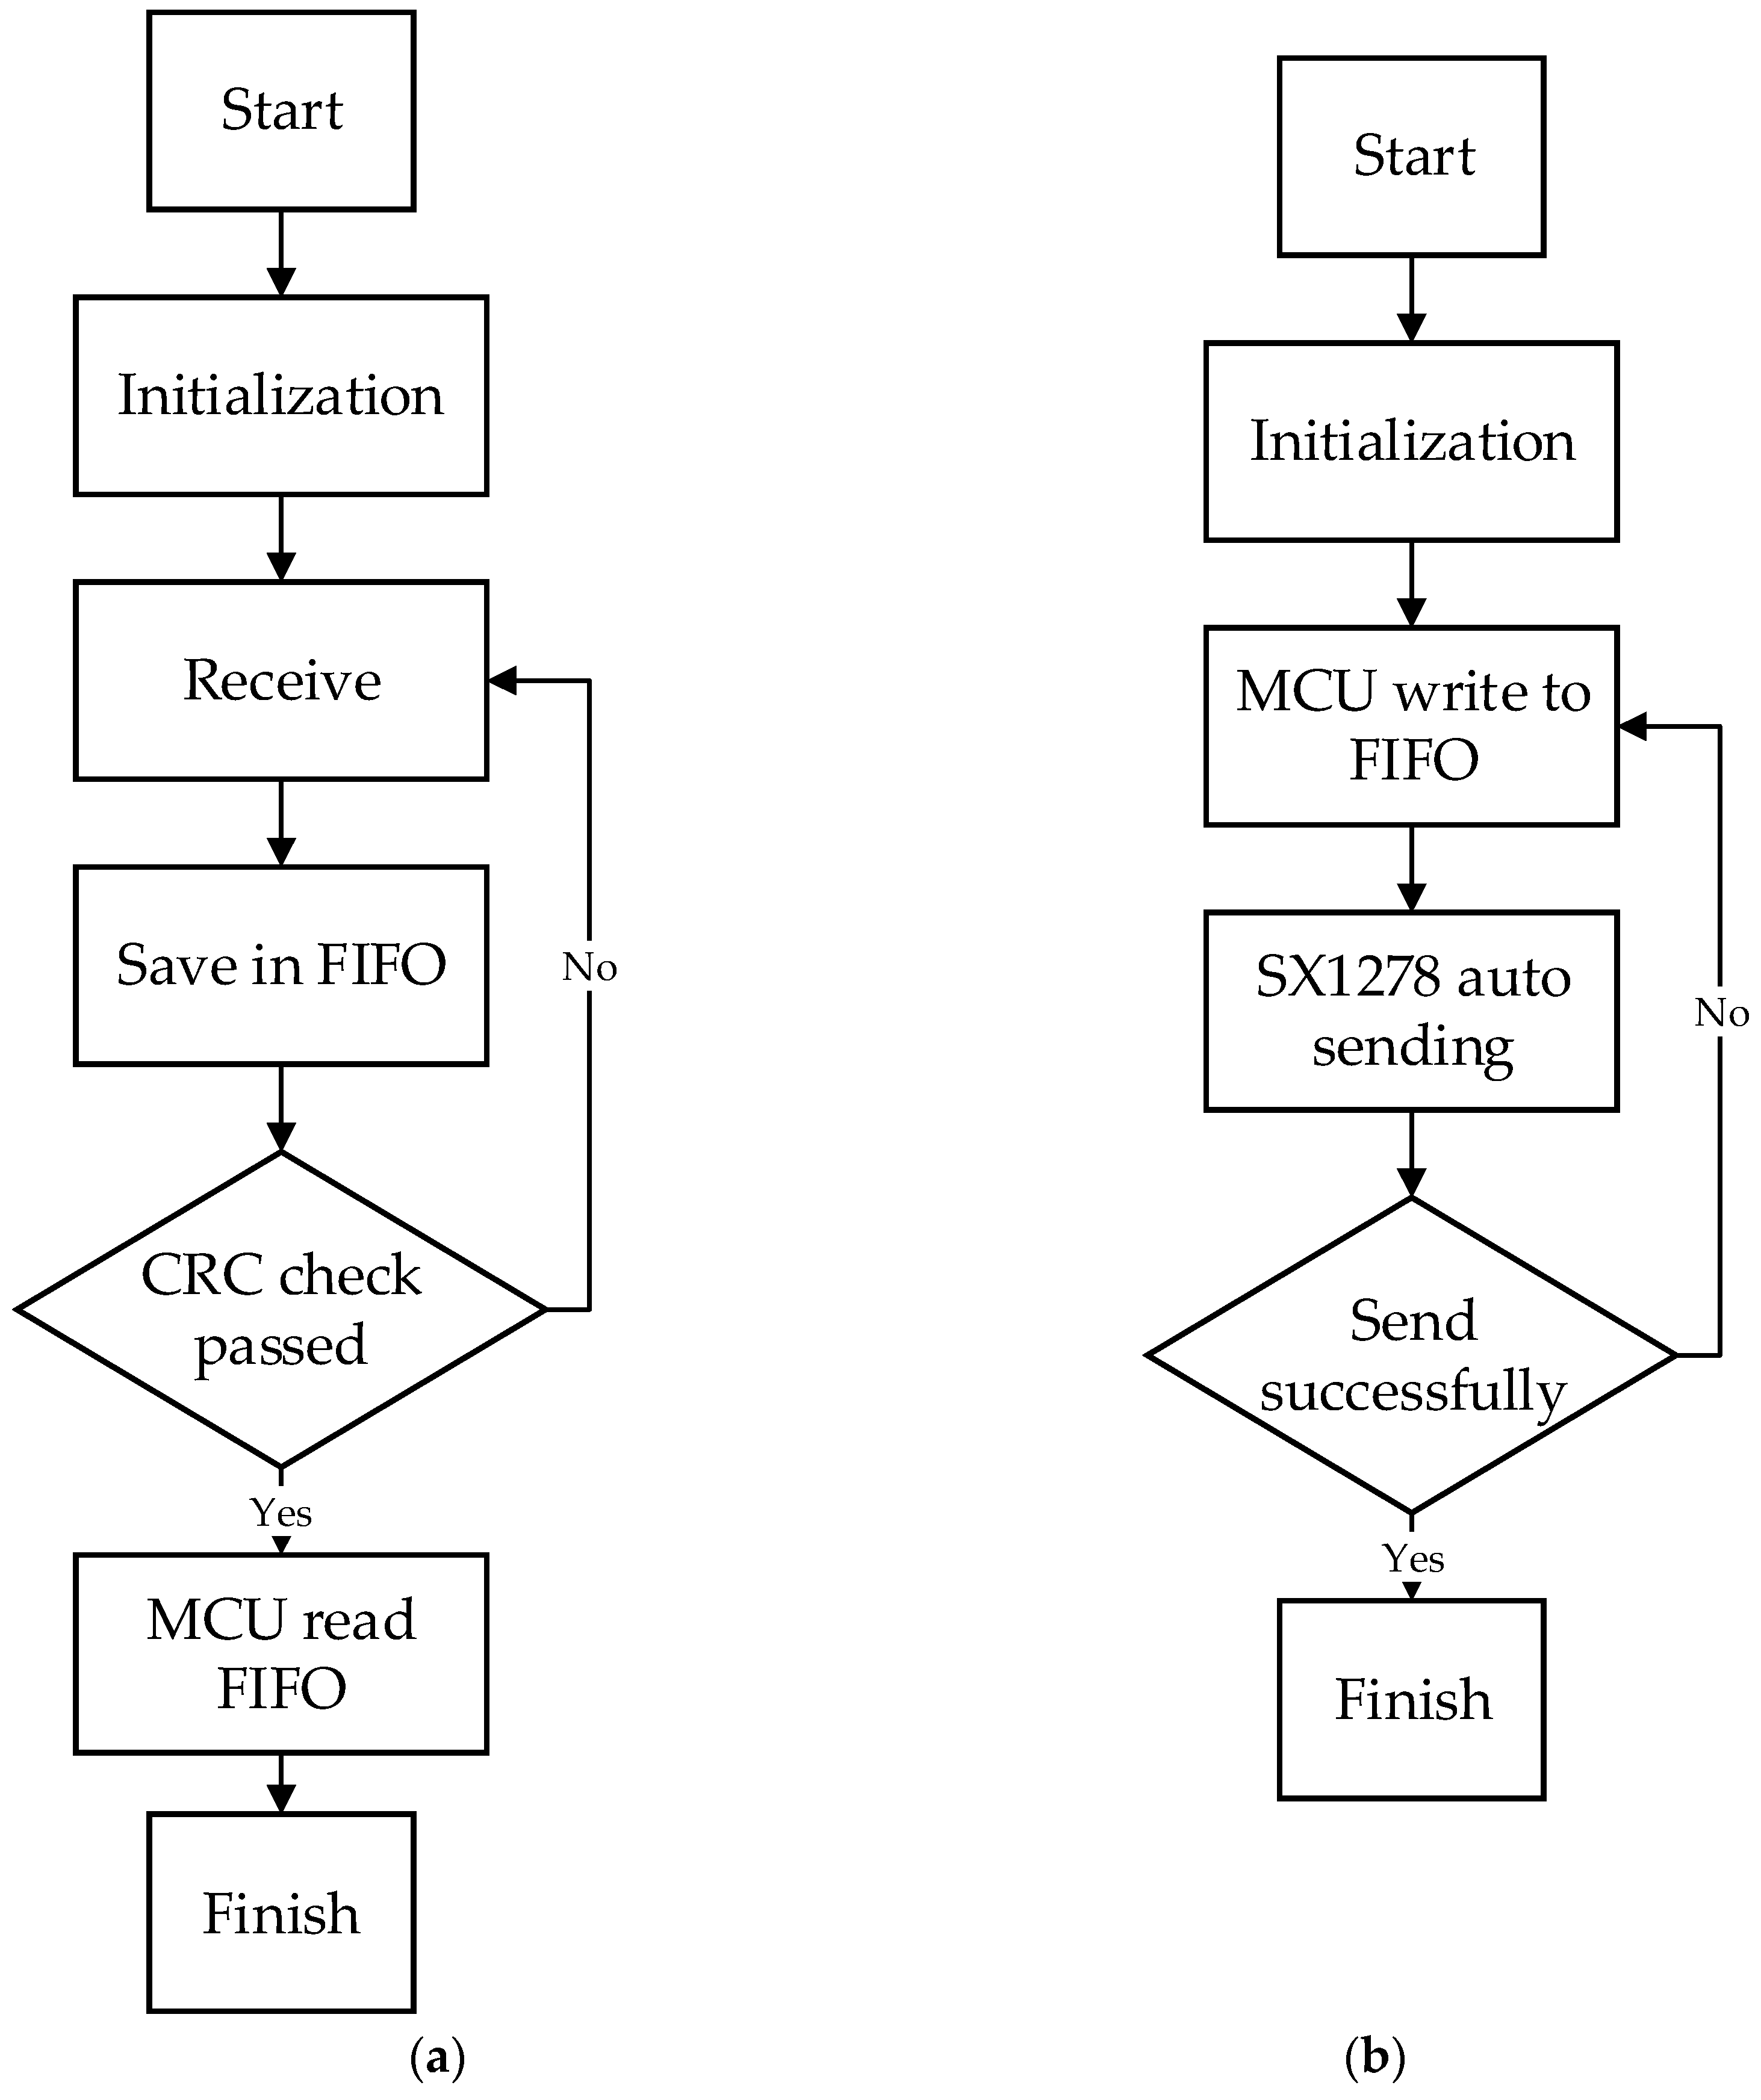
4.2. LoRa Communication Design
5. Application Analysis
5.1. Application Stability
5.2. Data Validity
5.3. Time Delay
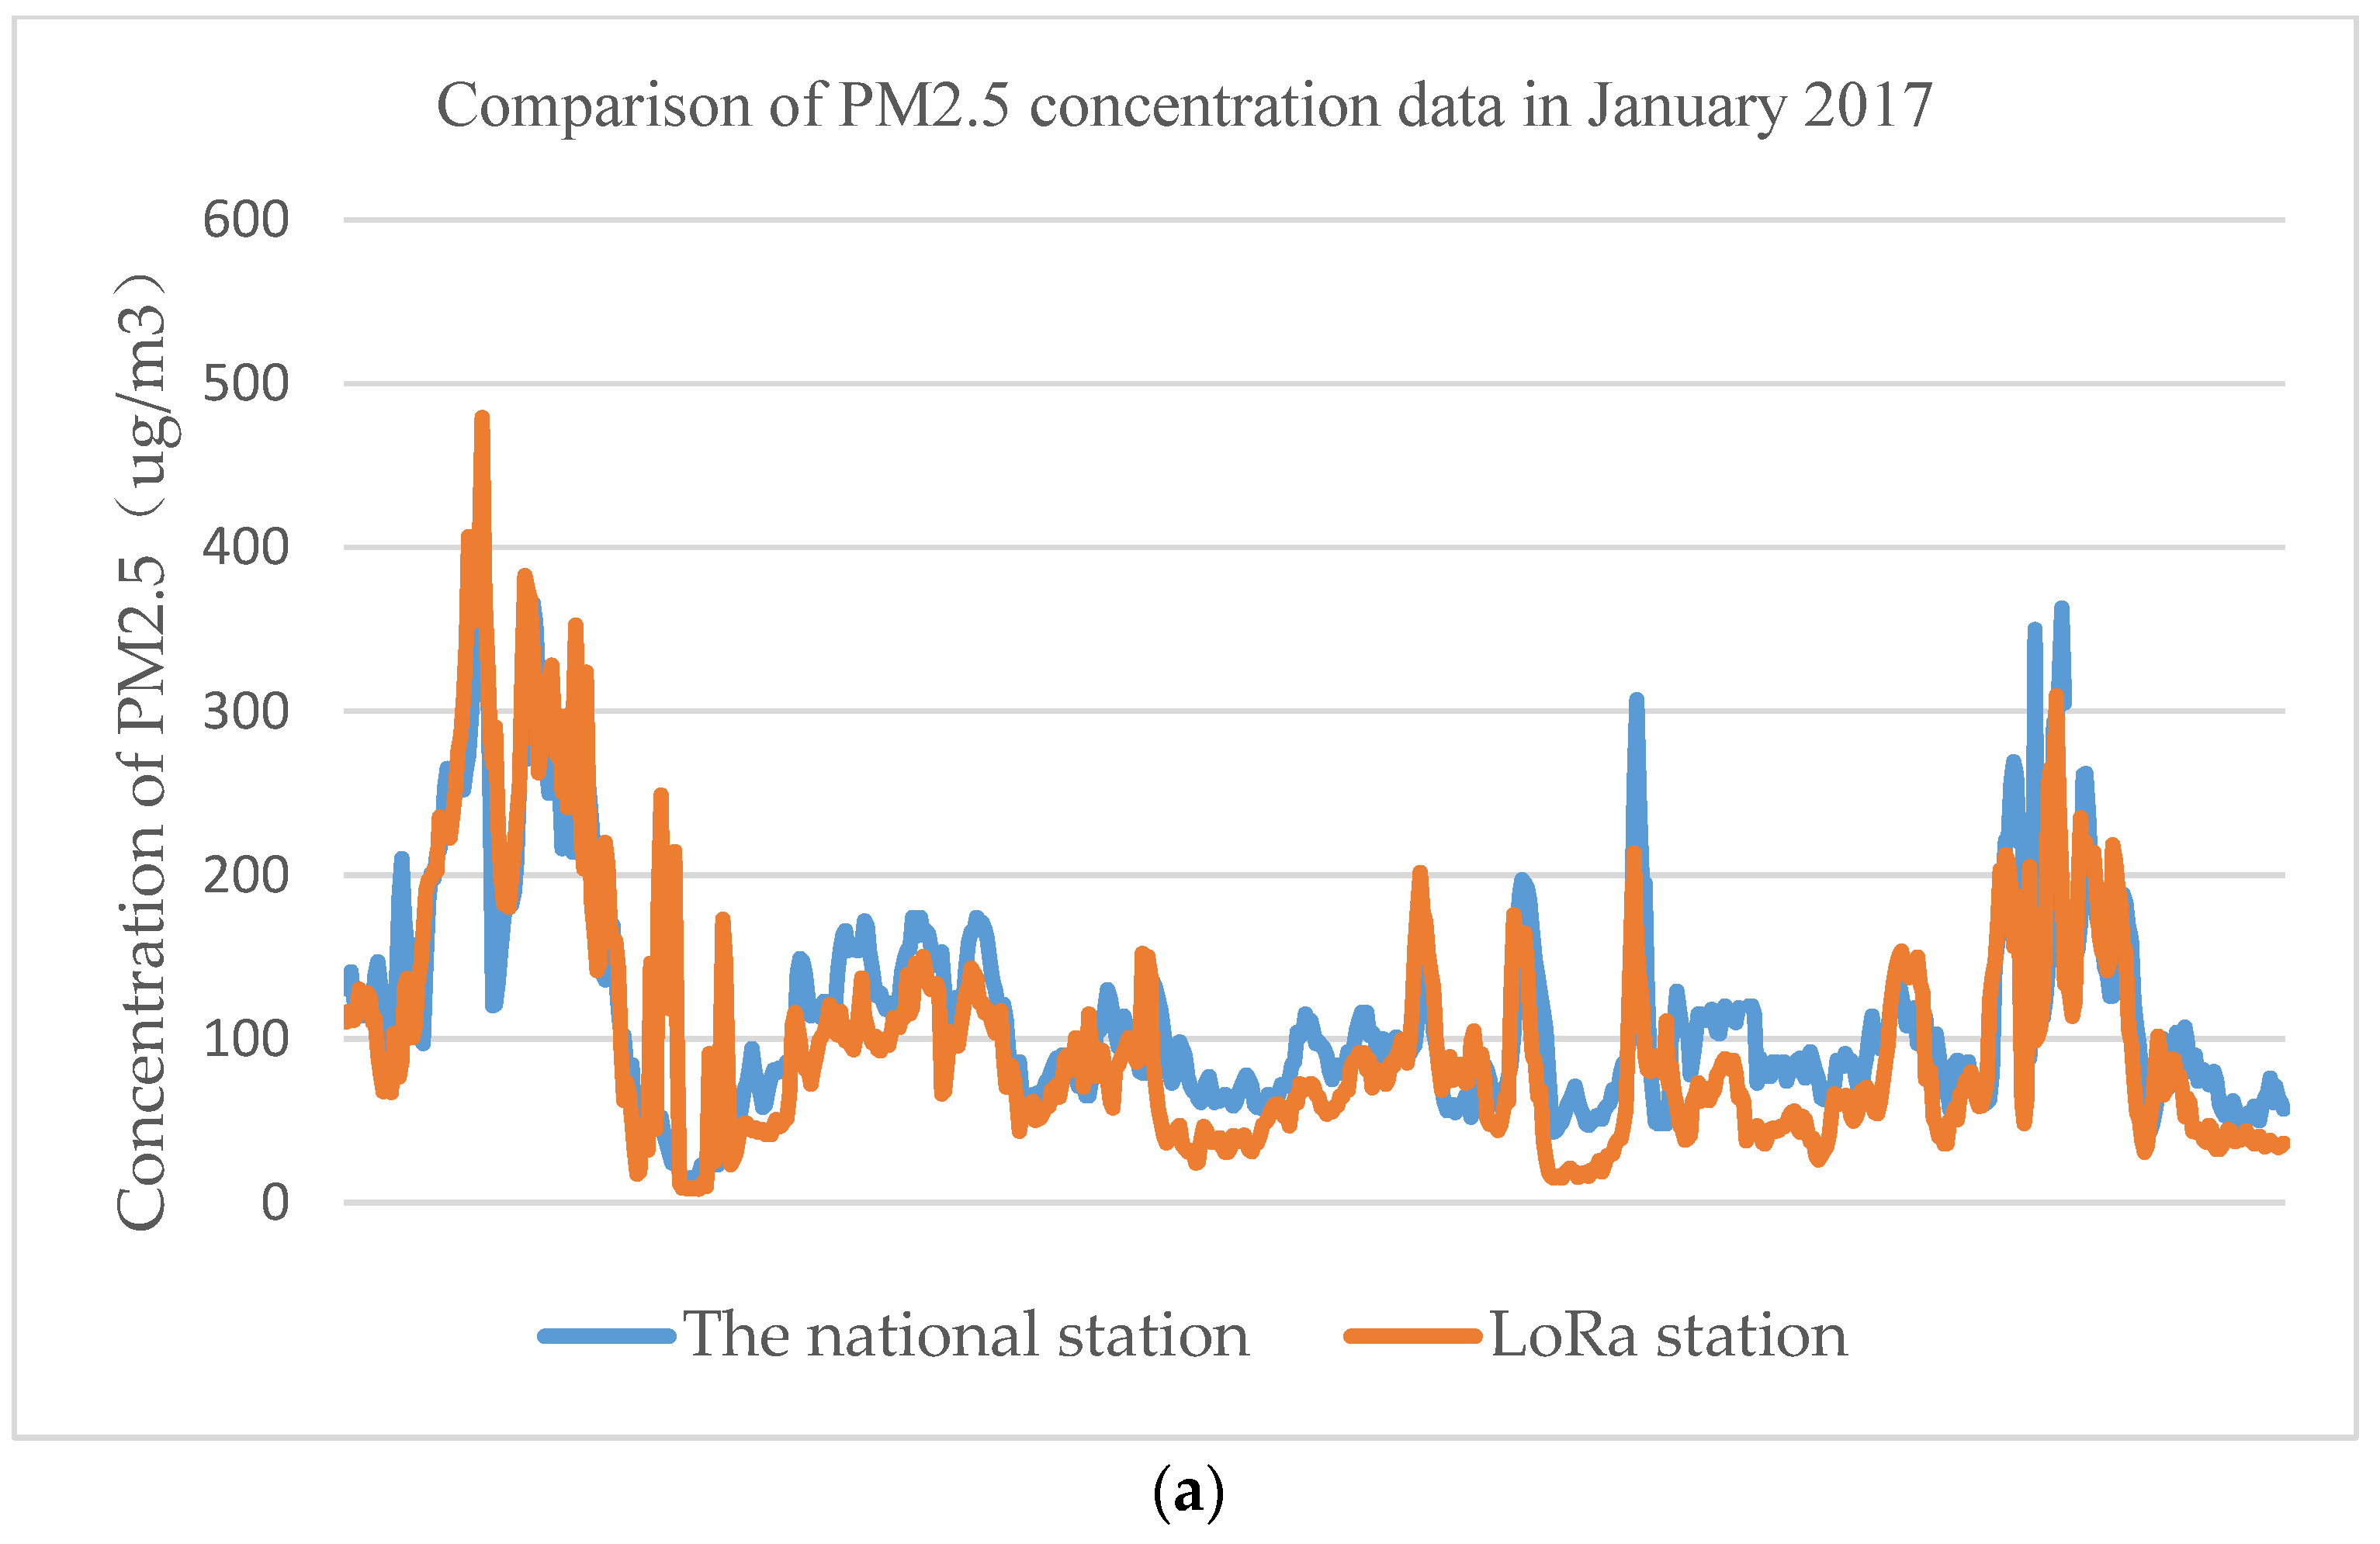
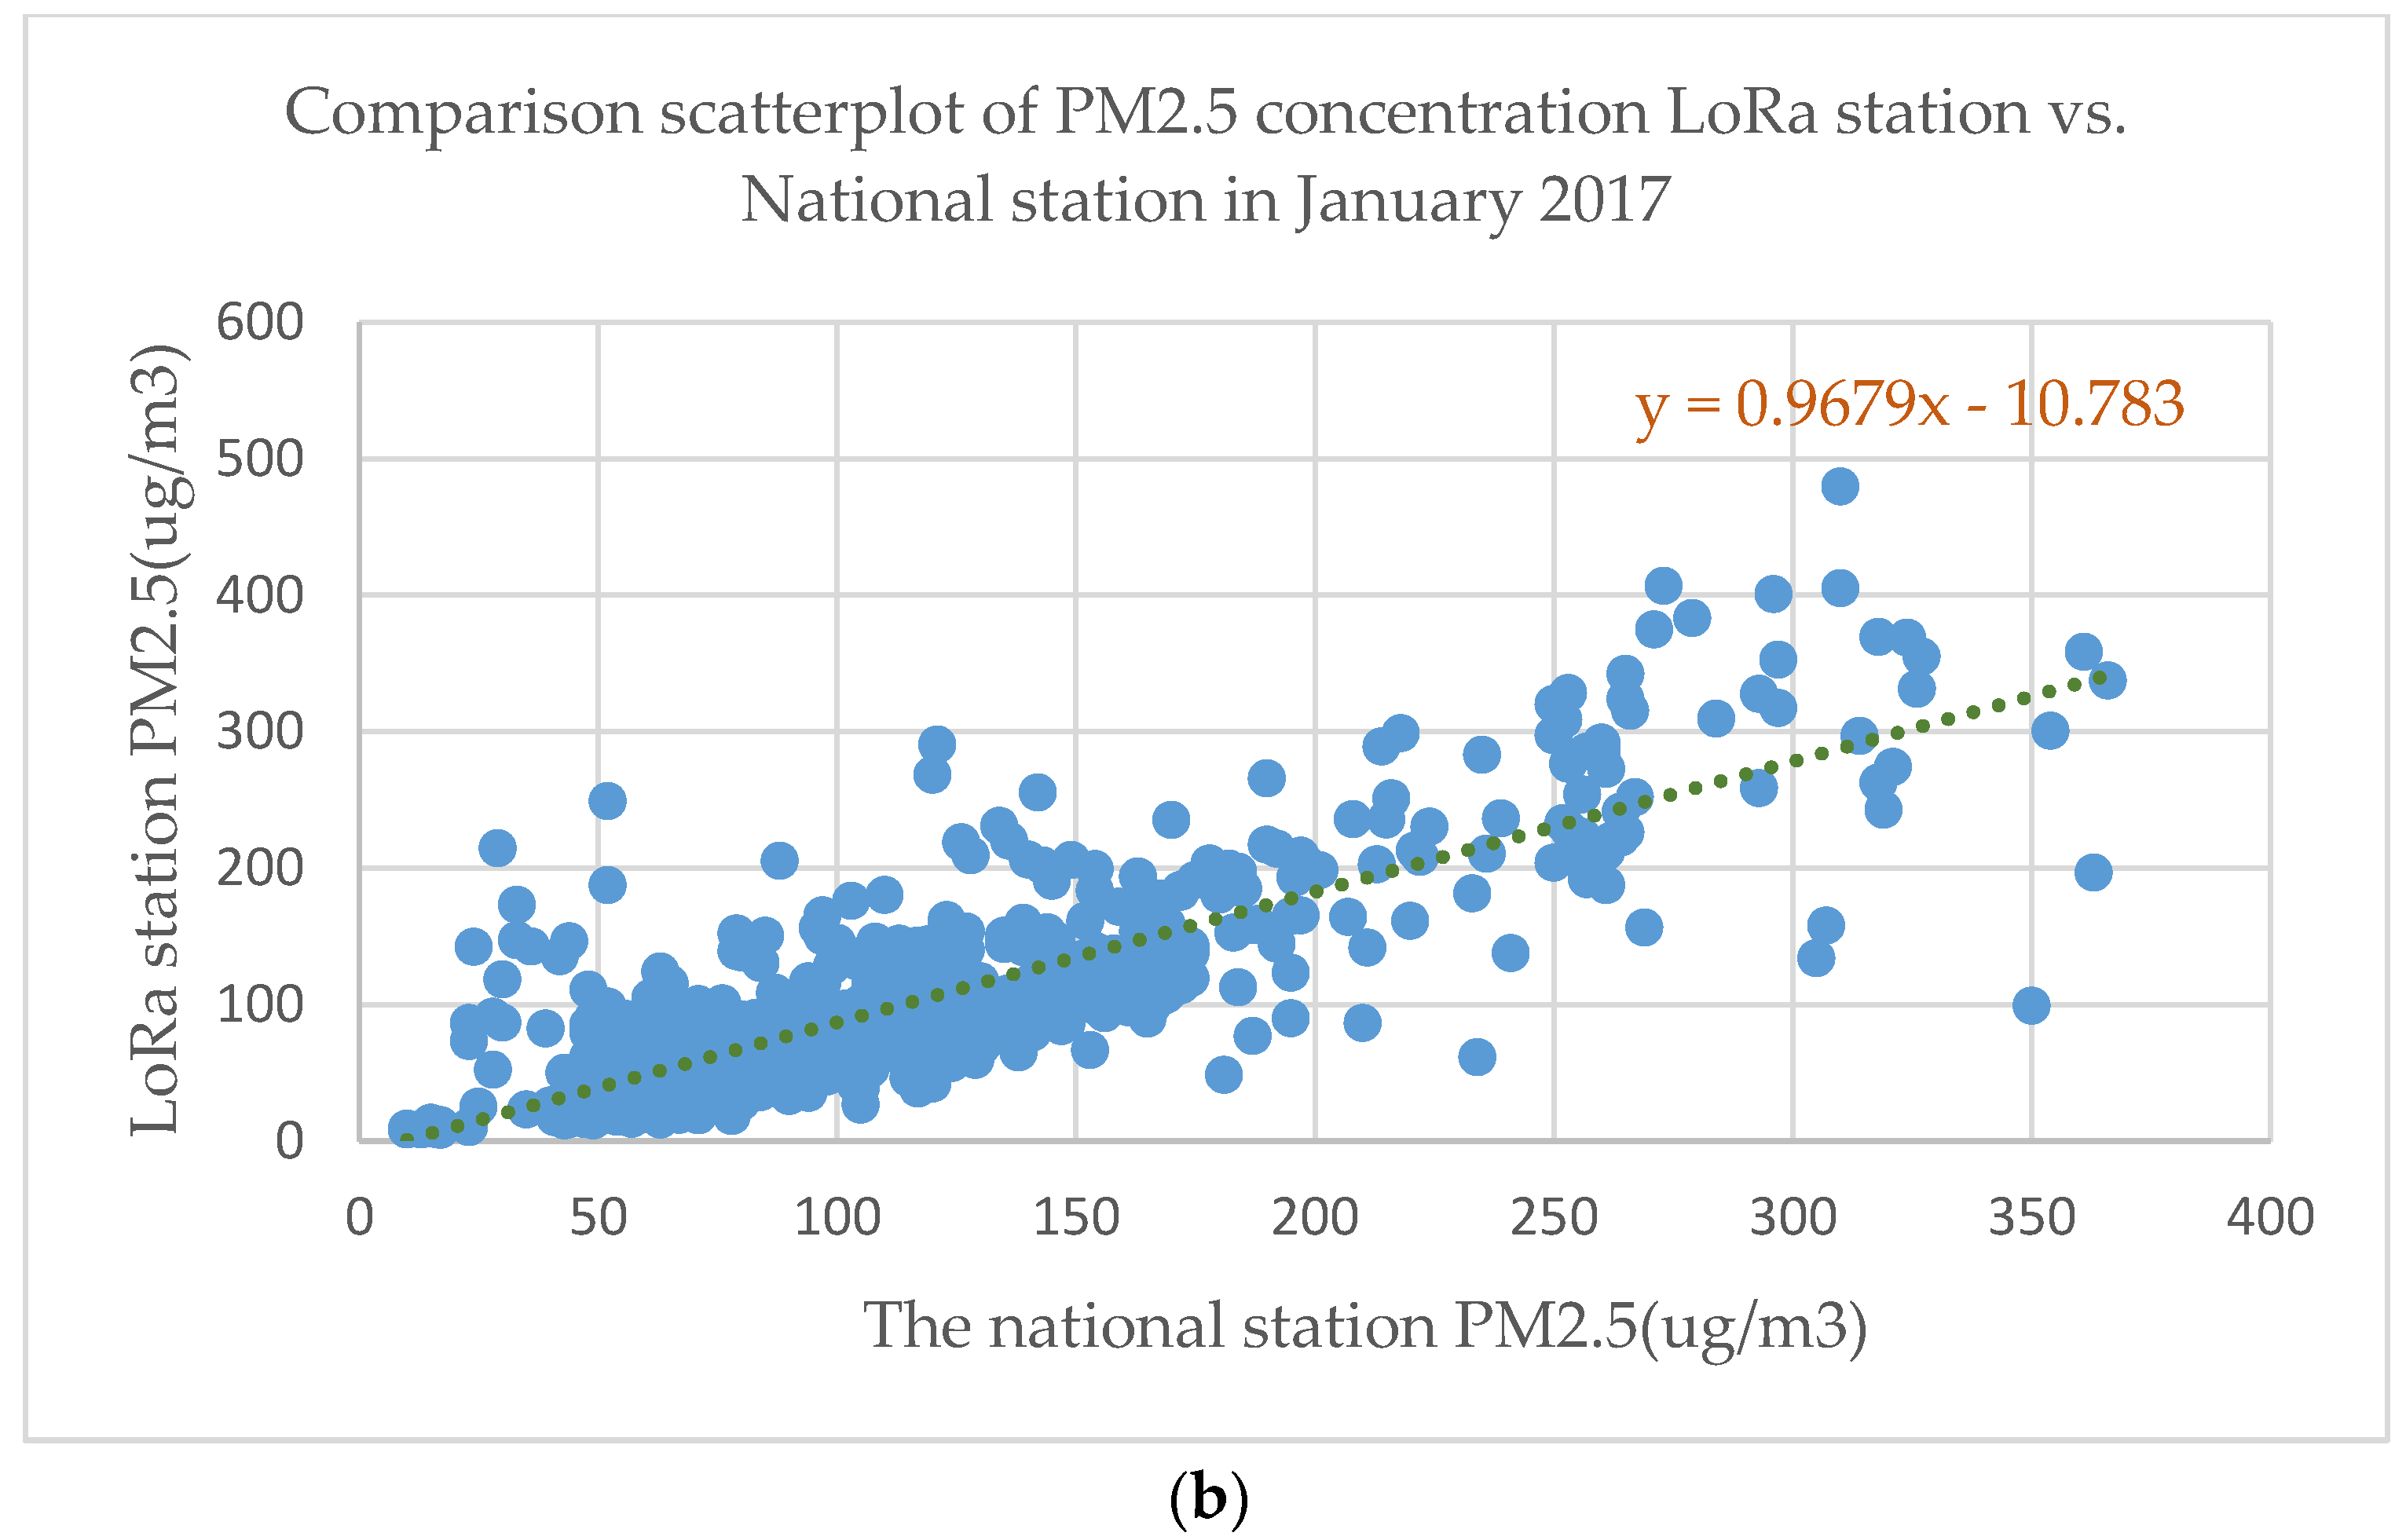
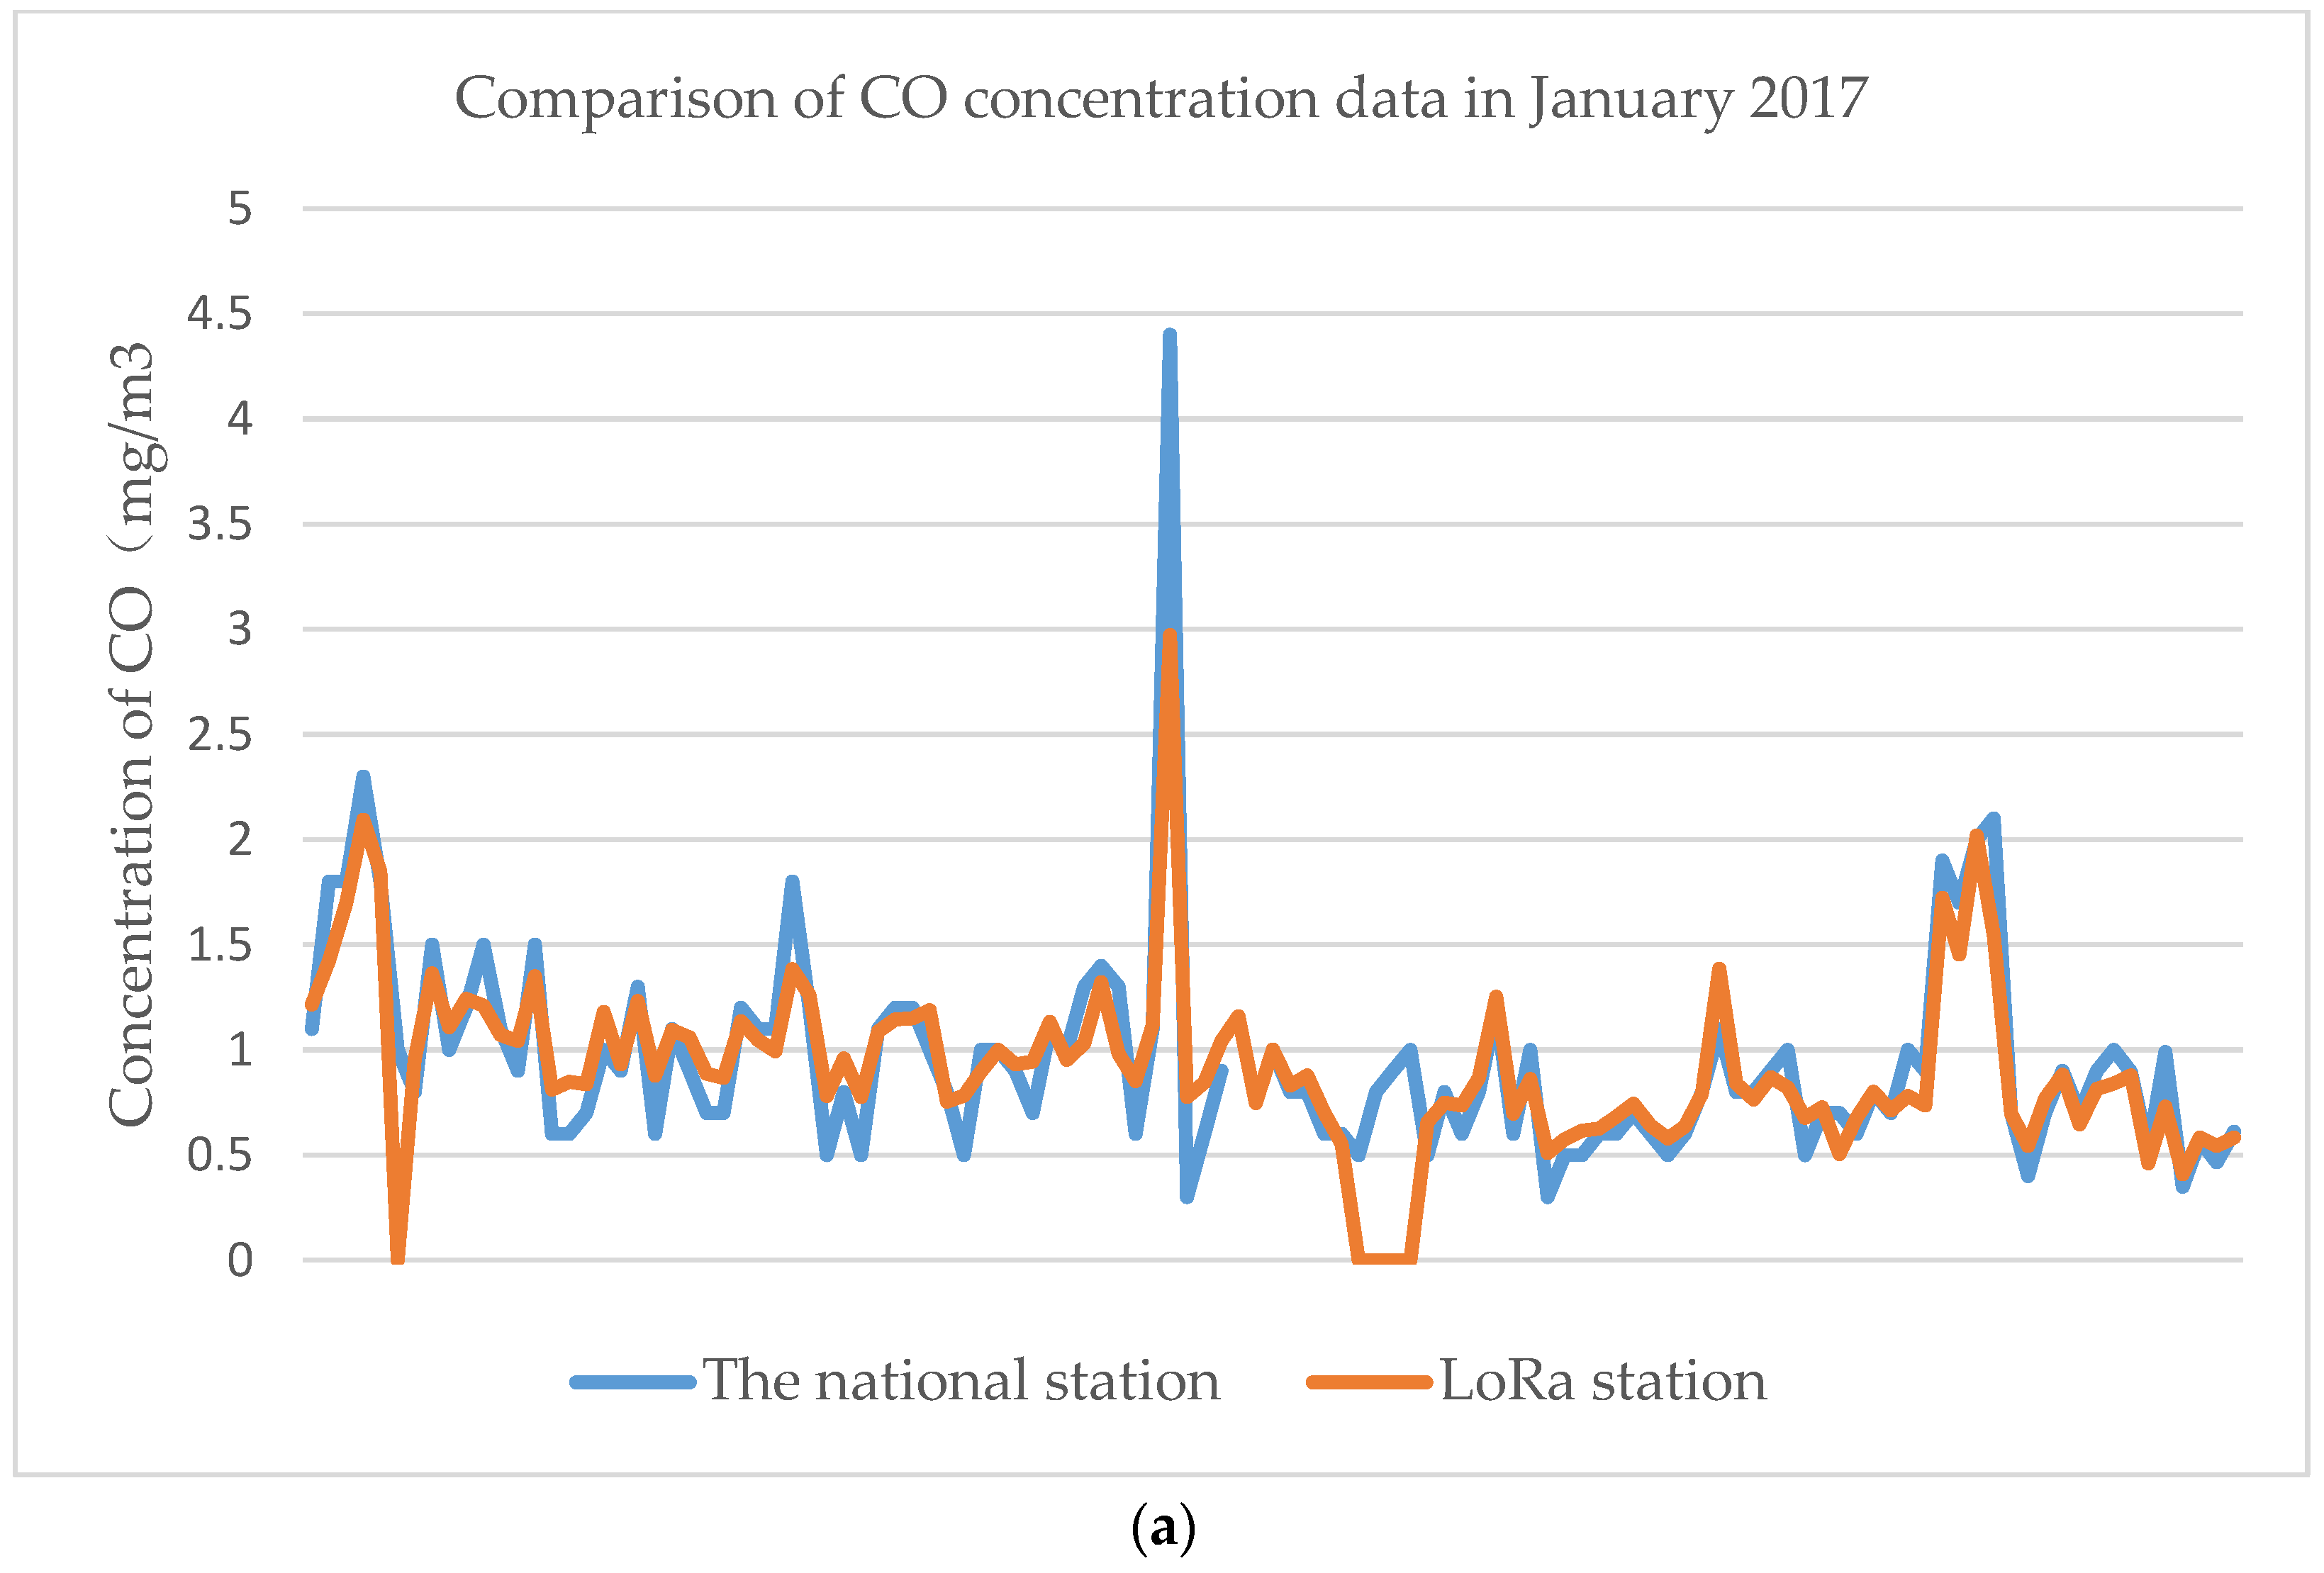
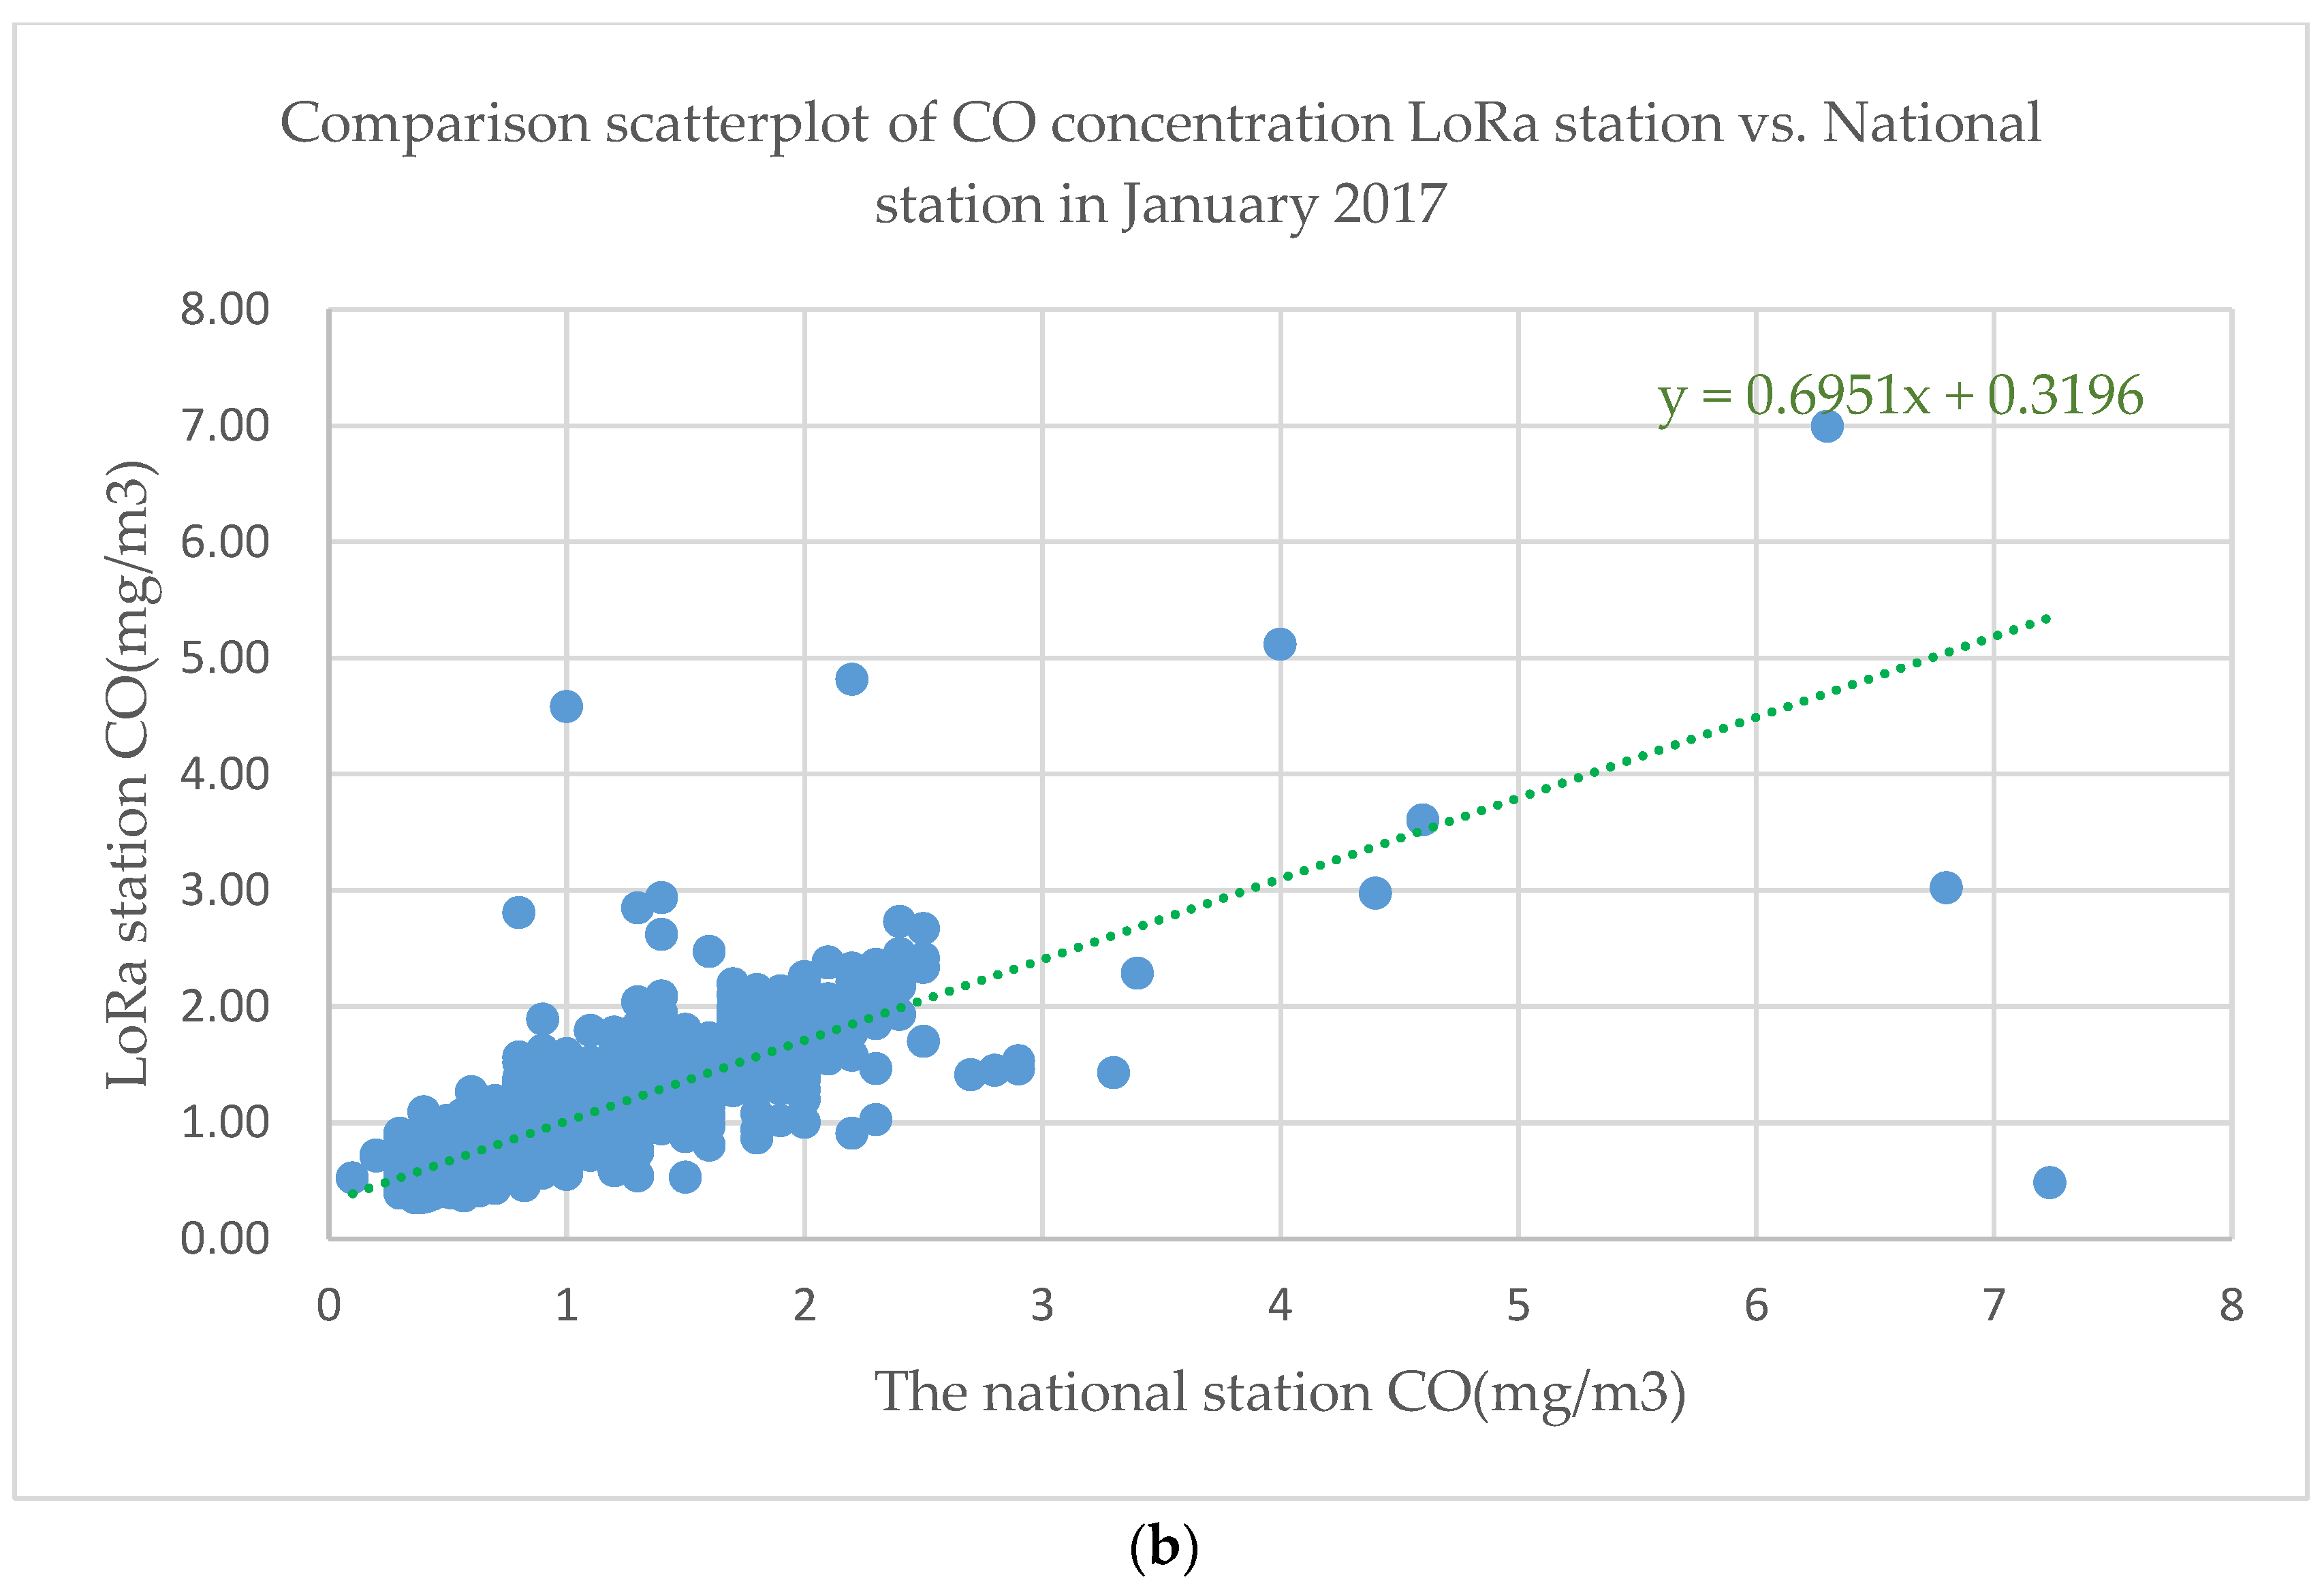
5.4. Precision
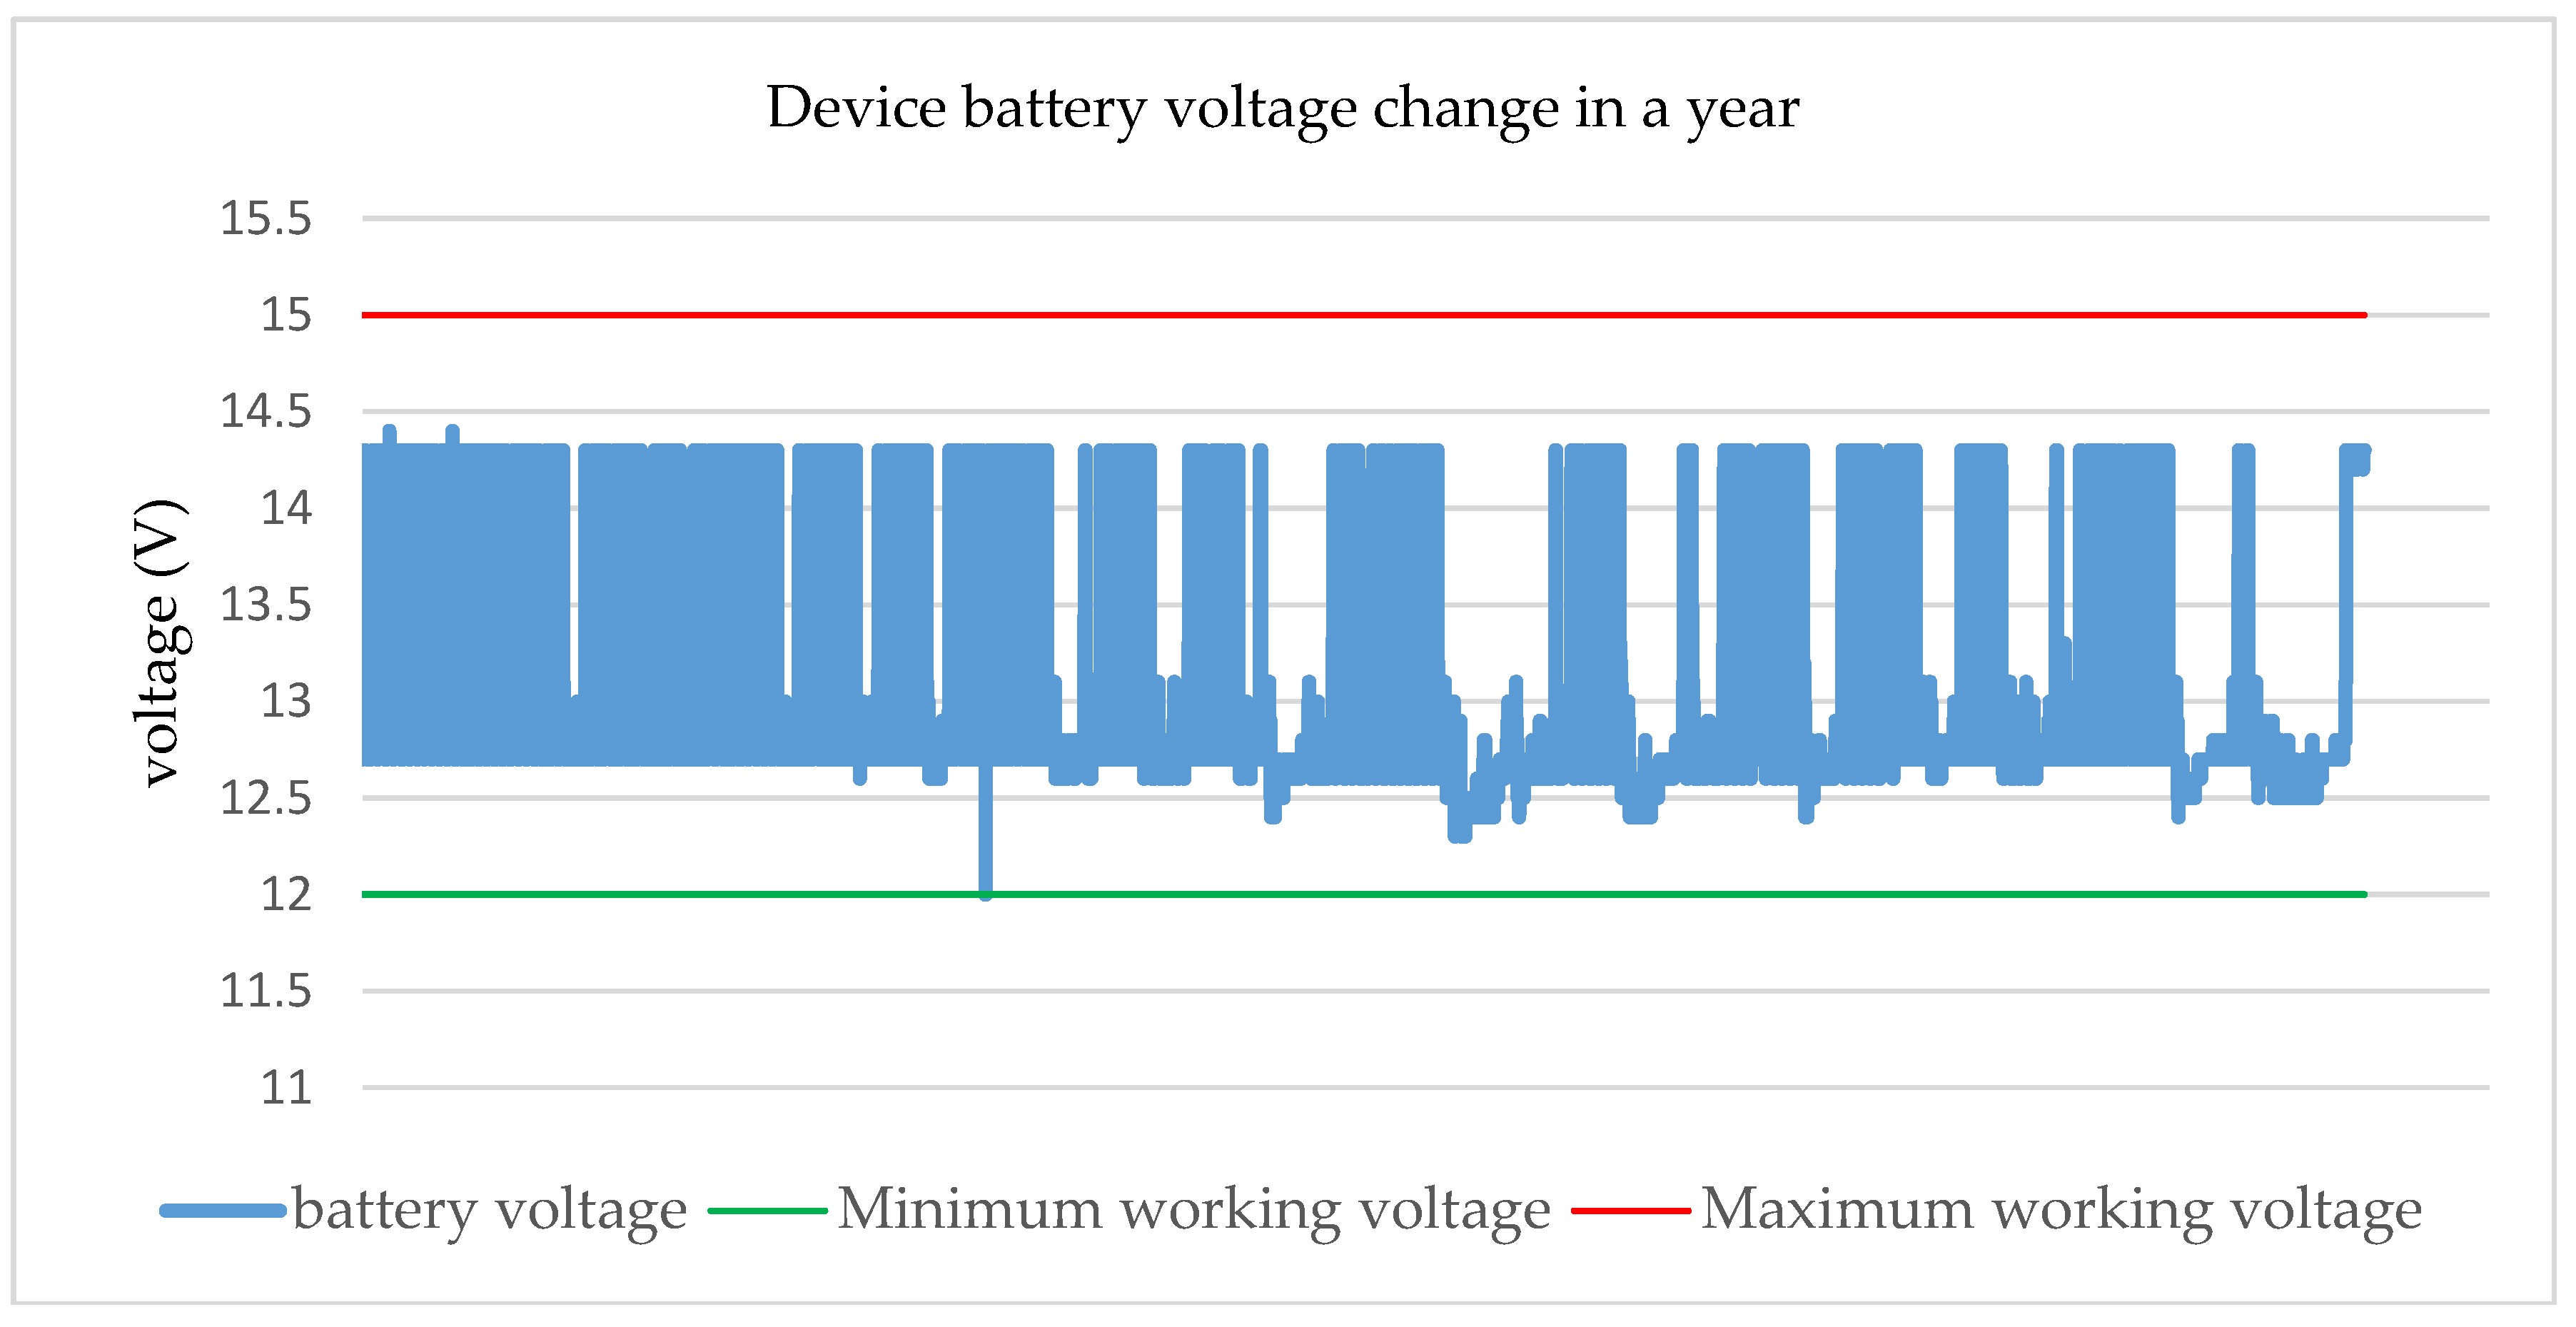
5.5. Power Consumption
6. Conclusions
Author Contributions
Funding
Conflicts of Interest
References
- Ge, X.; Zhu, T. Study on the Status Quo, Causes and Countermeasures of Urban Atmospheric Environmental Pollution. Environ. Dev. 2017, 29, 53–54. [Google Scholar]
- Thurston, G.D. Outdoor Air Pollution: Sources, Atmospheric Transport, and Human Health Effects; Elsevier Inc.: Amsterdam, The Netherlands, 2008. [Google Scholar]
- Hu, Y.; Hu, Y.; Yin, B. Internet of Things Information Awareness and Interaction Technology. J. Comput. 2012, 35, 1147–1163. [Google Scholar]
- LoRa Alliance. Available online: https://lora-alliance.org (accessed on 5 February 2018).
- Peng, W.; Liu, J.; Xin, Z. Research on LoRa Wireless Network Technology and Application Status. Inf. Commun. Technol. 2017, 11, 65–70. [Google Scholar]
- Wang, Y.; Yan, L.; Qin, L.; Li, S.; Wang, F. Research on Power Meter Reading Module Based on LoRa Technology. Foreign Electron. Meas. Technol. 2018, 37, 46–51. [Google Scholar]
- Sun, Y.; Hu, J.; Liu, Y.; Tian, Z. Research on Power Communication Network Based on LoRa. Inf. Commun. 2018, 02, 218–220. [Google Scholar]
- Tangzhou, Y.; Jiang, N. Research on Long Distance Indoor Positioning Based on LoRa. Comput. Appl. Softw. 2018, 35, 148–154. [Google Scholar]
- Pasolini, G.; Buratti, C.; Feltrin, L.; Zabini, F.; De Castro, C.; Verdone, R.; Andrisano, O. Smart City Pilot Projects Using LoRa and IEEE802.15.4 Technologies. Sensors 2018, 18, 1118. [Google Scholar]
- Cerchecci, M.; Luti, F.; Mecocci, A.; Parrino, S.; Peruzzi, G.; Pozzebon, A. A Low Power IoT Sensor Node Architecture for Waste Management Within Smart Cities Context. Sensors 2018, 18, 1282. [Google Scholar]
- Popoola, O.A.; Carruthers, D.; Lad, C.; Bright, V.B.; Mead, M.I.; Stettler, M.E.; Saffell, J.R.; Jones, R.L. Use of networks of low cost air quality sensors to quantify air quality in urban settings. Atmos. Environ. 2018, 194, 58–70. [Google Scholar] [CrossRef]
- Capezzuto, L.; Abbamonte, L.; De Vito, S.; Massera, E.; Formisano, F.; Fattoruso, G.; Di Francia, G.; Buonanno, A. A maker friendly mobile and social sensing approach to urban air quality monitoring. In Proceedings of the SENSORS, Valencia, Spain, 2–5 November 2014; pp. 12–16. [Google Scholar]
- Mead, M.I.; Popoola, O.A.M.; Stewart, G.B.; Landshoff, P.; Calleja, M.; Hayes, M.; Baldovi, J.J.; McLeod, M.W.; Hodgson, T.F.; Dicks, J.; et al. The use of electrochemical sensors for monitoring urban air quality in low-cost, high-density networks. Atmos. Environ. 2013, 70, 186–203. [Google Scholar] [CrossRef]
- Feng, Q.; Tao, F. Application of Wireless Sensor Network in Field Measurement. Electron. Technol. Appl. 2007, 09, 10–12. [Google Scholar]
- Sharma, H.; Pal, N.; Kumar, P.; Yadav, A. A control strategy of hybrid solar-wind energy generation system. Arch. Electr. Eng. 2017, 66, 241–251. [Google Scholar] [CrossRef] [Green Version]
- Roth, M.; Hasler, R.; Goblirsch, T.; Franczyk, B. Flexible and Modular Low Power Wireless Networks. Procedia Comput. Sci. 2015, 52, 695–699. [Google Scholar] [CrossRef]
- STMicroelectronics, stm32f107 Datasheet. Available online: https://www.st.com/resource/en/datasheet/stm32f107vc.pdf (accessed on 20 February 2018).
- Zhen, W.; Li, M.; Shu, J. Flash Storage Technology. Comput. Res. Dev. 2010, 47, 716–726. [Google Scholar]
- LoRa Alliance. LoRaWAN Specification, v1.1[E B/OL]. Available online: https://www.lora-alliance.org/Contact (accessed on 18 January 2018).
- Wang, S.; Han, C.; Liu, S.; Luo, Q. Establishment on Space Objects Database Management System Using Browser/Server Mode. Procedia Eng. 2012, 29, 1071–1074. [Google Scholar] [CrossRef]
- Xue, Y. Design and Implementation of Automatic Generation Module Based on Django Framework Management Interface; Harbin Institute of Technology: Harbin, China, 2014. [Google Scholar]
- Muhendra, R.; Rinaldi, A.; Budiman, M. Development of WiFi Mesh Infrastructure for Internet of Things Applications. Procedia Eng. 2017, 170, 332–337. [Google Scholar] [CrossRef]
- Youm, B.; Park, J. Tcp/Ip Protocol Over Ieee-1394 Network for Real-Time Control Applications. IFAC Proc. Vol. 2005, 38, 37–42. [Google Scholar] [CrossRef]
- Ruggieri, M.; Plaia, A. An aggregate AQI: Comparing different standardizations and introducing a variability index. Sci. Total Environ. 2012, 420, 263–272. [Google Scholar] [CrossRef] [PubMed]
- ClaaTek. Available online: http://www.claaiot.com/web/index.php/product/info/61 (accessed on 20 February 2018).
- Semtech. SX1278 137 MHz to 525 MHz Low Power Long Range Transceiver. Available online: Available: http://www.semtech.com/wireless-rf/rf-transceivers/sx1278/ (accessed on 19 September 2017).
- Liu, Y. Research on Suspension Particle Monitoring System Based on Laser Scattering Method; Harbin University of Science and Technology: Harbin, China, 2017. [Google Scholar]
- Pang, X.; Shaw, M.D.; Gillot, S.; Lewis, A.C. The impacts of water vapour and co-pollutants on the performance of electrochemical gas sensors used for air quality monitoring. Sens. Actuators B Chem. 2018, 266, 674–684. [Google Scholar] [CrossRef]


| Type | Model | Measuring Range | Measuring Principle | Resolution | Response Time (s) | Accuracy |
|---|---|---|---|---|---|---|
| O3 | 7NE/O3-5 | 0–2000 μg/m3 | Electrochemistry | 2.0 μg/m3 | <30 | ≤±5% |
| SO2 | 7NE/SO2-1000 | 0–2500 μg/m3 | Electrochemistry | 2.5 μg/m3 | <30 | ≤±5% |
| NO2 | 7NE/NO2-1000 | 0–2000 μg/m3 | Electrochemistry | 2.0 μg/m3 | <30 | ≤±5% |
| CO | 7NE/CO2-1000 | 0–200 mg/m3 | Electrochemistry | 0.2 mg/m3 | <30 | ≤±5% |
| PM2.5 | SDS011 | 0–2000 μg/m3 | Laser scattering | 0.1 μg/m3 | <10 | ≤±10% |
| PM10 | SDS012 | 0–2000 μg/m3 | Laser scattering | 0.1 μg/m3 | <10 | ≤±10% |
| Station | TDS | ADS | DAE |
|---|---|---|---|
| Station-1 | 2712 | 2712 | 100% |
| Station-2 | 2712 | 2559 | 94.36% |
| Station-3 | 2712 | 2563 | 94.51% |
| Station-4 | 2712 | 2694 | 99.34% |
| Station-5 | 2712 | 2692 | 99.26% |
| Station-6 | 2712 | 2404 | 88.57% |
| Station-7 | 2712 | 2596 | 95.72% |
© 2018 by the authors. Licensee MDPI, Basel, Switzerland. This article is an open access article distributed under the terms and conditions of the Creative Commons Attribution (CC BY) license (http://creativecommons.org/licenses/by/4.0/).
Share and Cite
Ma, Y.; Zhao, L.; Yang, R.; Li, X.; Song, Q.; Song, Z.; Zhang, Y. Development and Application of an Atmospheric Pollutant Monitoring System Based on LoRa—Part I: Design and Reliability Tests. Sensors 2018, 18, 3891. https://doi.org/10.3390/s18113891
Ma Y, Zhao L, Yang R, Li X, Song Q, Song Z, Zhang Y. Development and Application of an Atmospheric Pollutant Monitoring System Based on LoRa—Part I: Design and Reliability Tests. Sensors. 2018; 18(11):3891. https://doi.org/10.3390/s18113891
Chicago/Turabian StyleMa, Yushuang, Long Zhao, Rongjin Yang, Xiuhong Li, Qiao Song, Zhenwei Song, and Yi Zhang. 2018. "Development and Application of an Atmospheric Pollutant Monitoring System Based on LoRa—Part I: Design and Reliability Tests" Sensors 18, no. 11: 3891. https://doi.org/10.3390/s18113891