Development of a Multispectral Albedometer and Deployment on an Unmanned Aircraft for Evaluating Satellite Retrieved Surface Reflectance over Nevada’s Black Rock Desert

 ,
, 
Abstract
:1. Introduction
2. Instrument Design and Testing
2.1. Sensor Components
2.1.1. C12666MA Micro-Spectrometer
2.1.2. Teensy 3.6/3.2 Microcontroller
2.1.3. BME 280 Pressure, Temperature, and Humidity Sensor
2.1.4. BNO055 Absolute Orientation
2.1.5. VC0706 TTL Serial Camera
2.1.6. UBX-G7020 GPS
2.1.7. APC220 Radio
2.1.8. Nokia Screen
2.1.9. MLX90614 Infra-Red (IR) Sensor
2.1.10. SD Card
2.1.11. Real-Time Clock
2.2. System Calibration and Testing
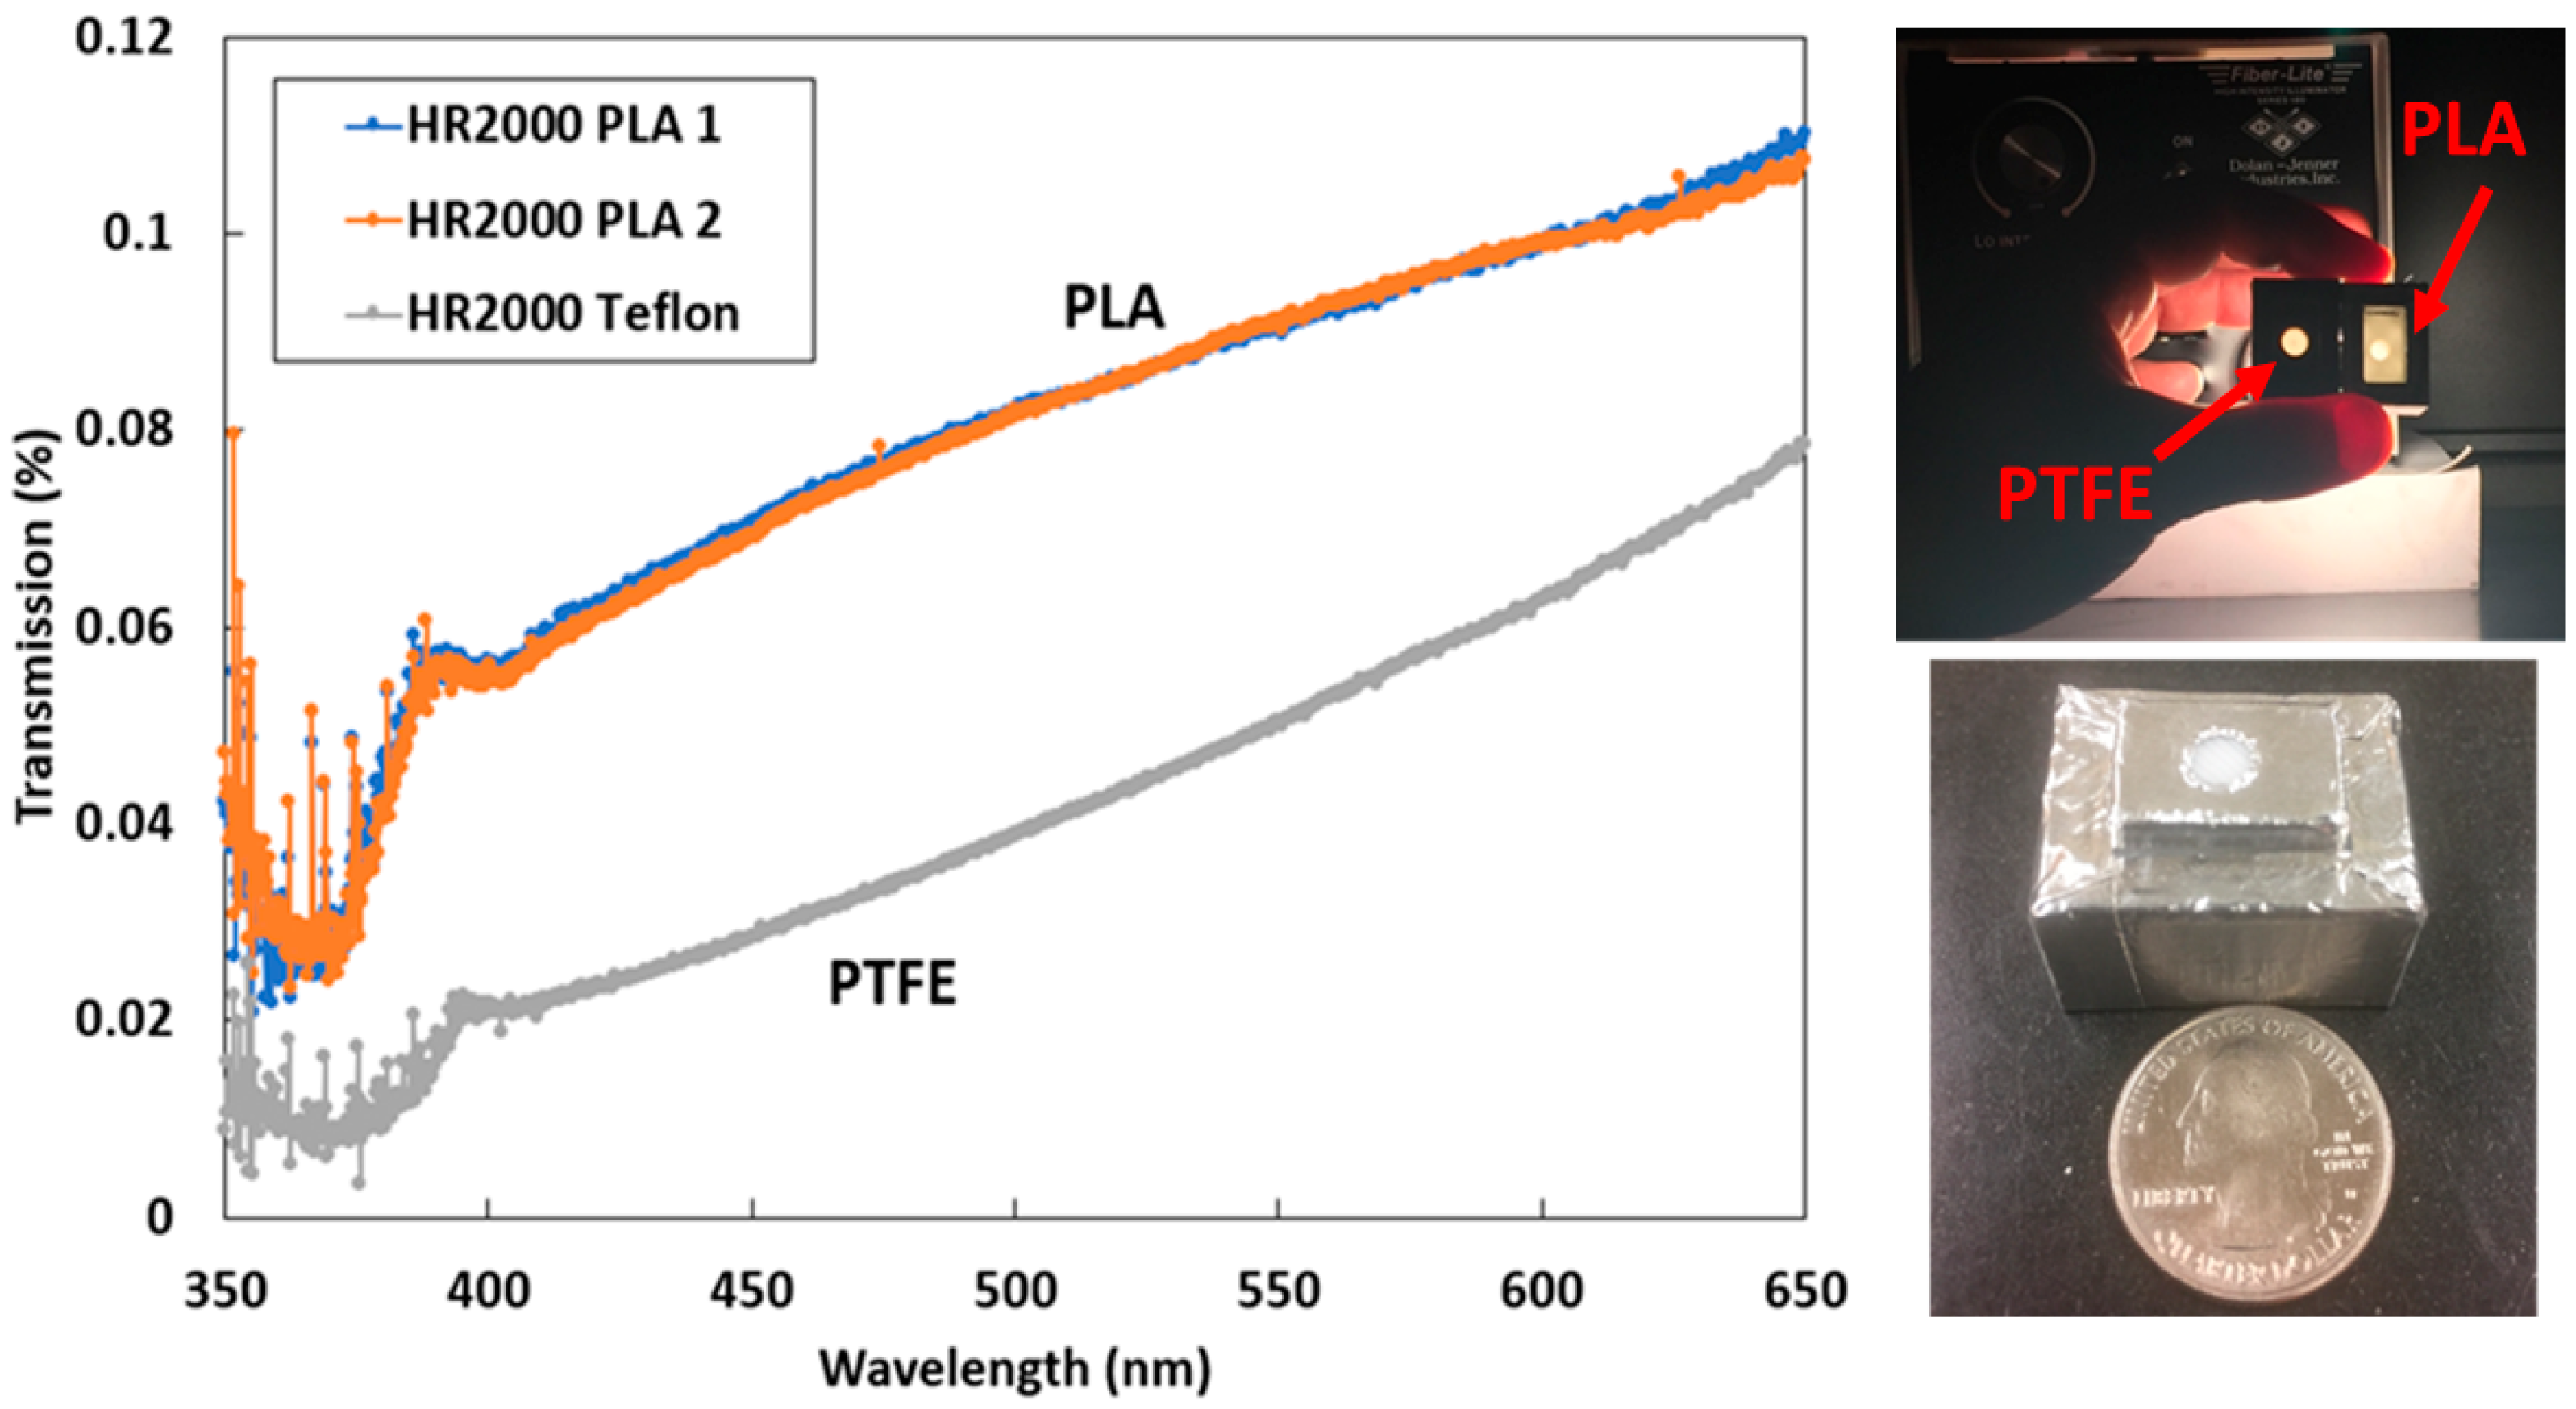
2.2.1. Diffuser Transmissivity
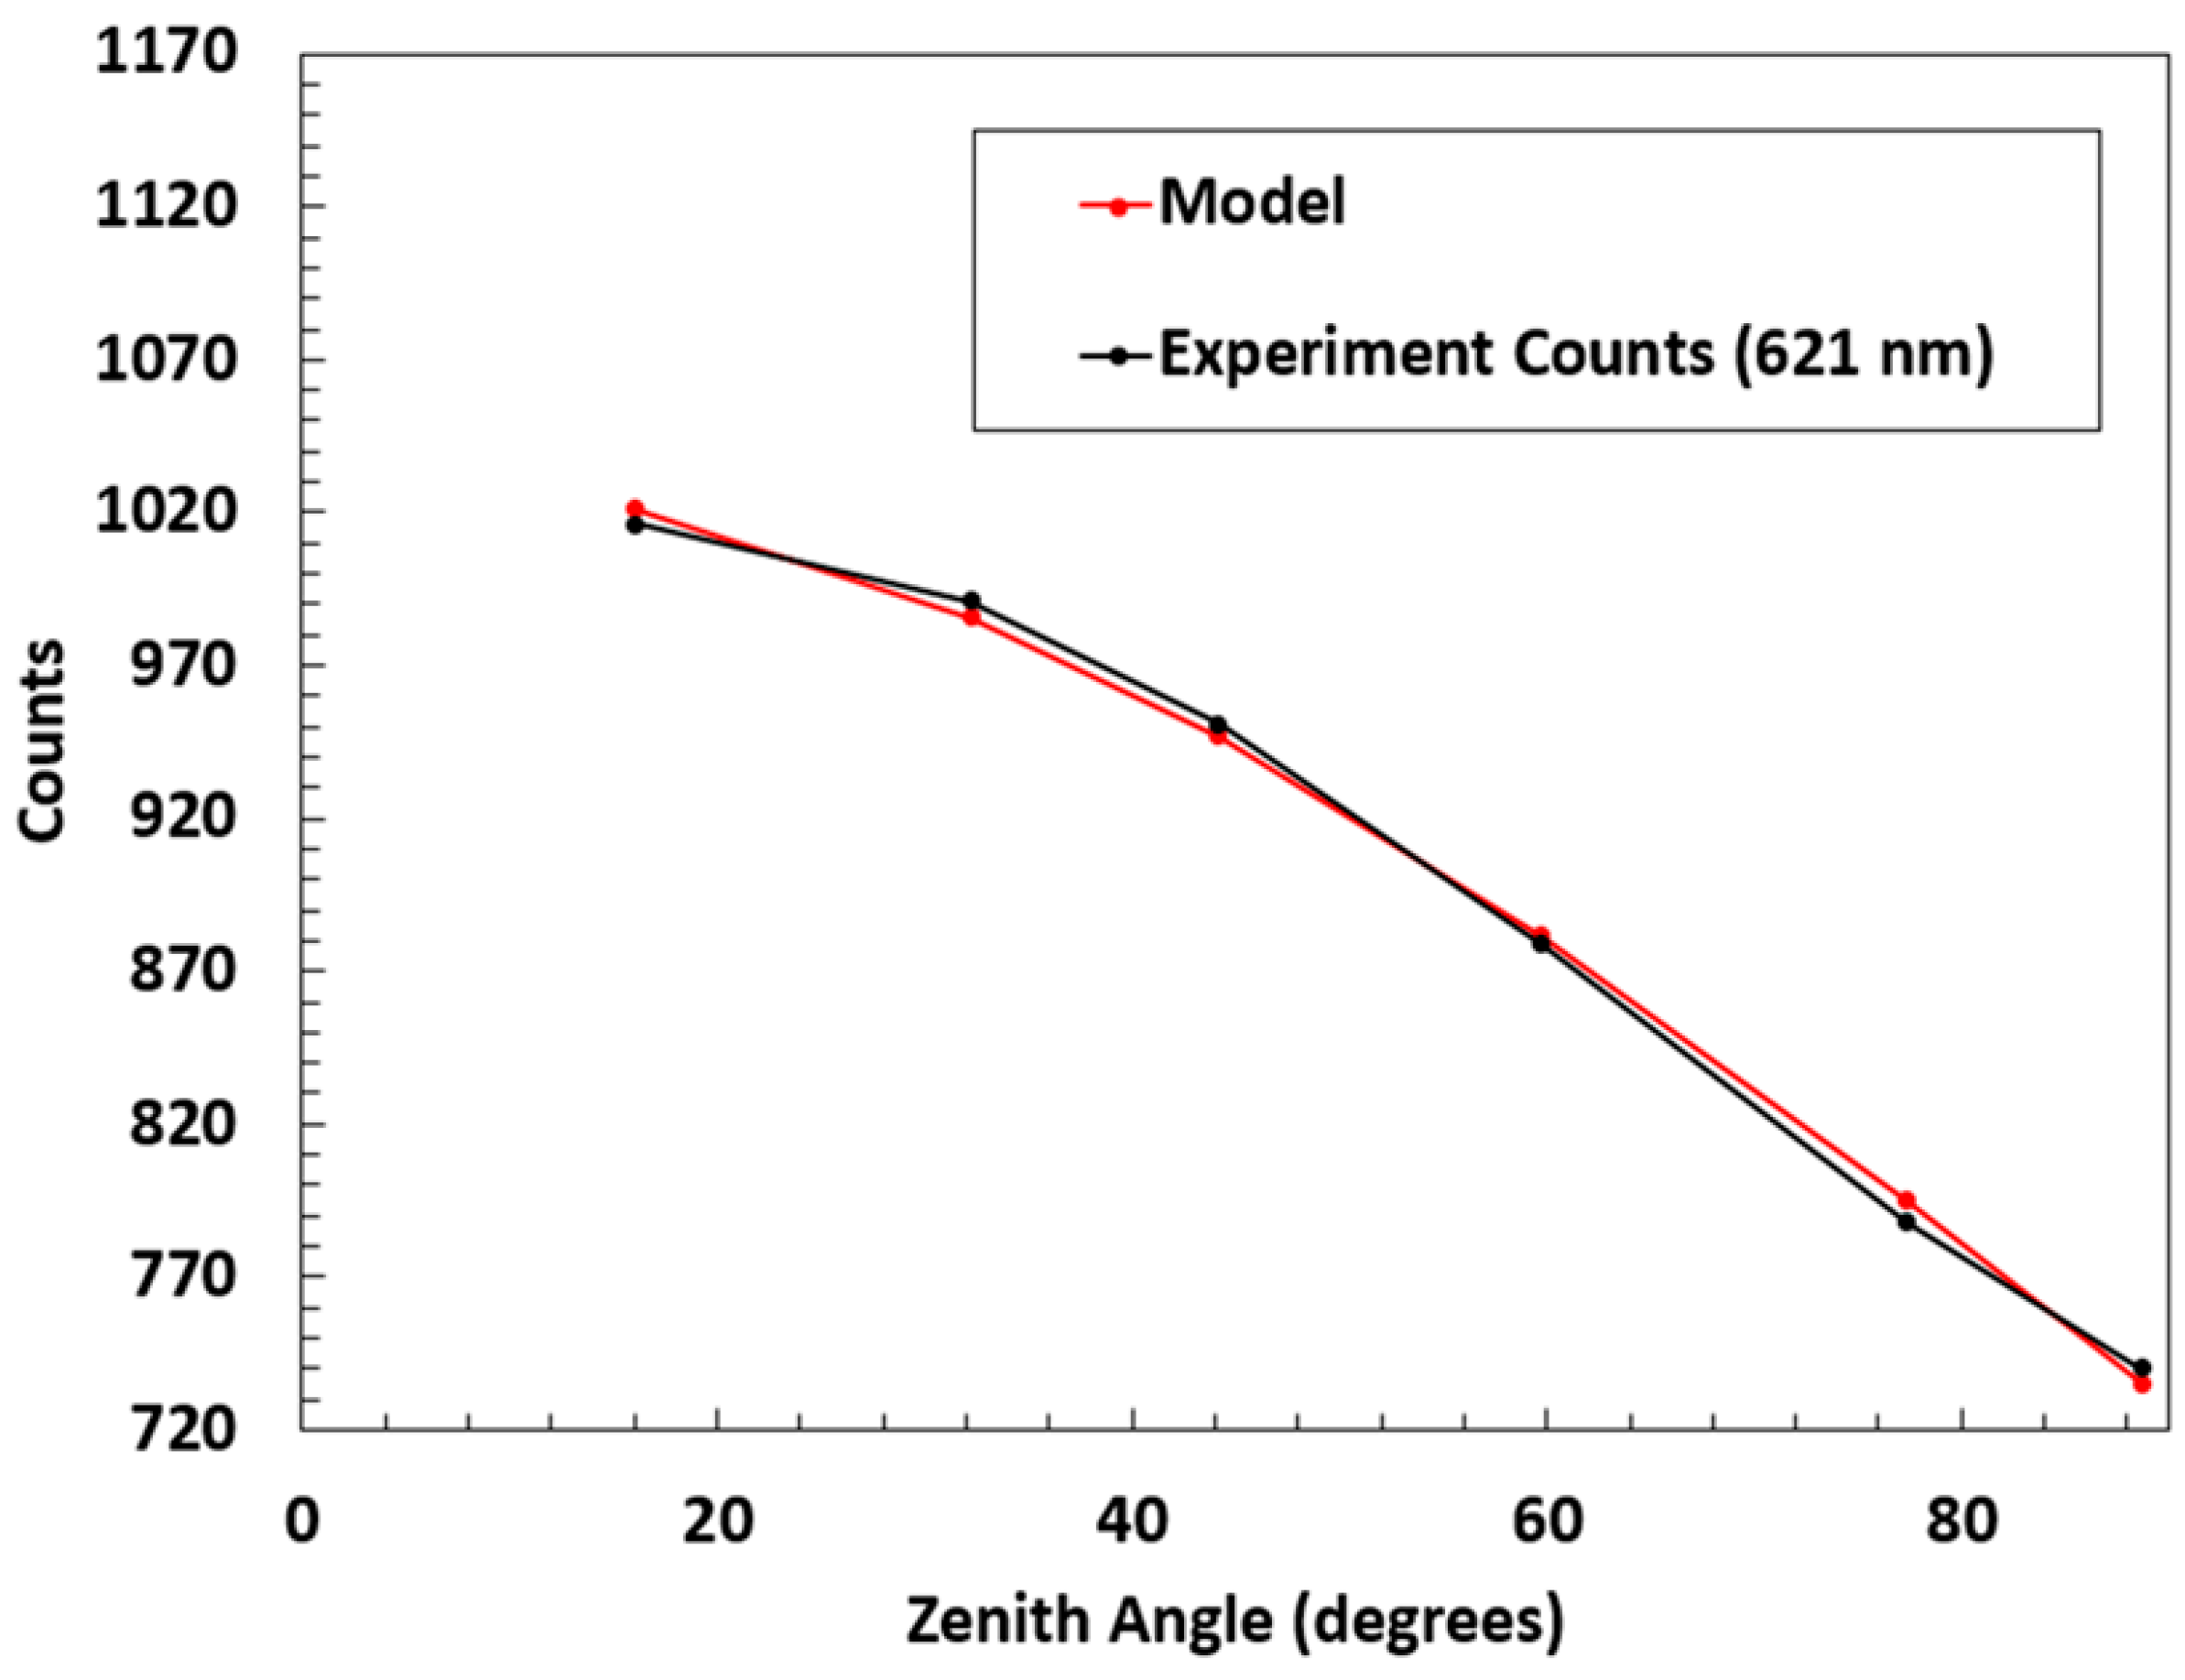
2.2.2. Angular Response
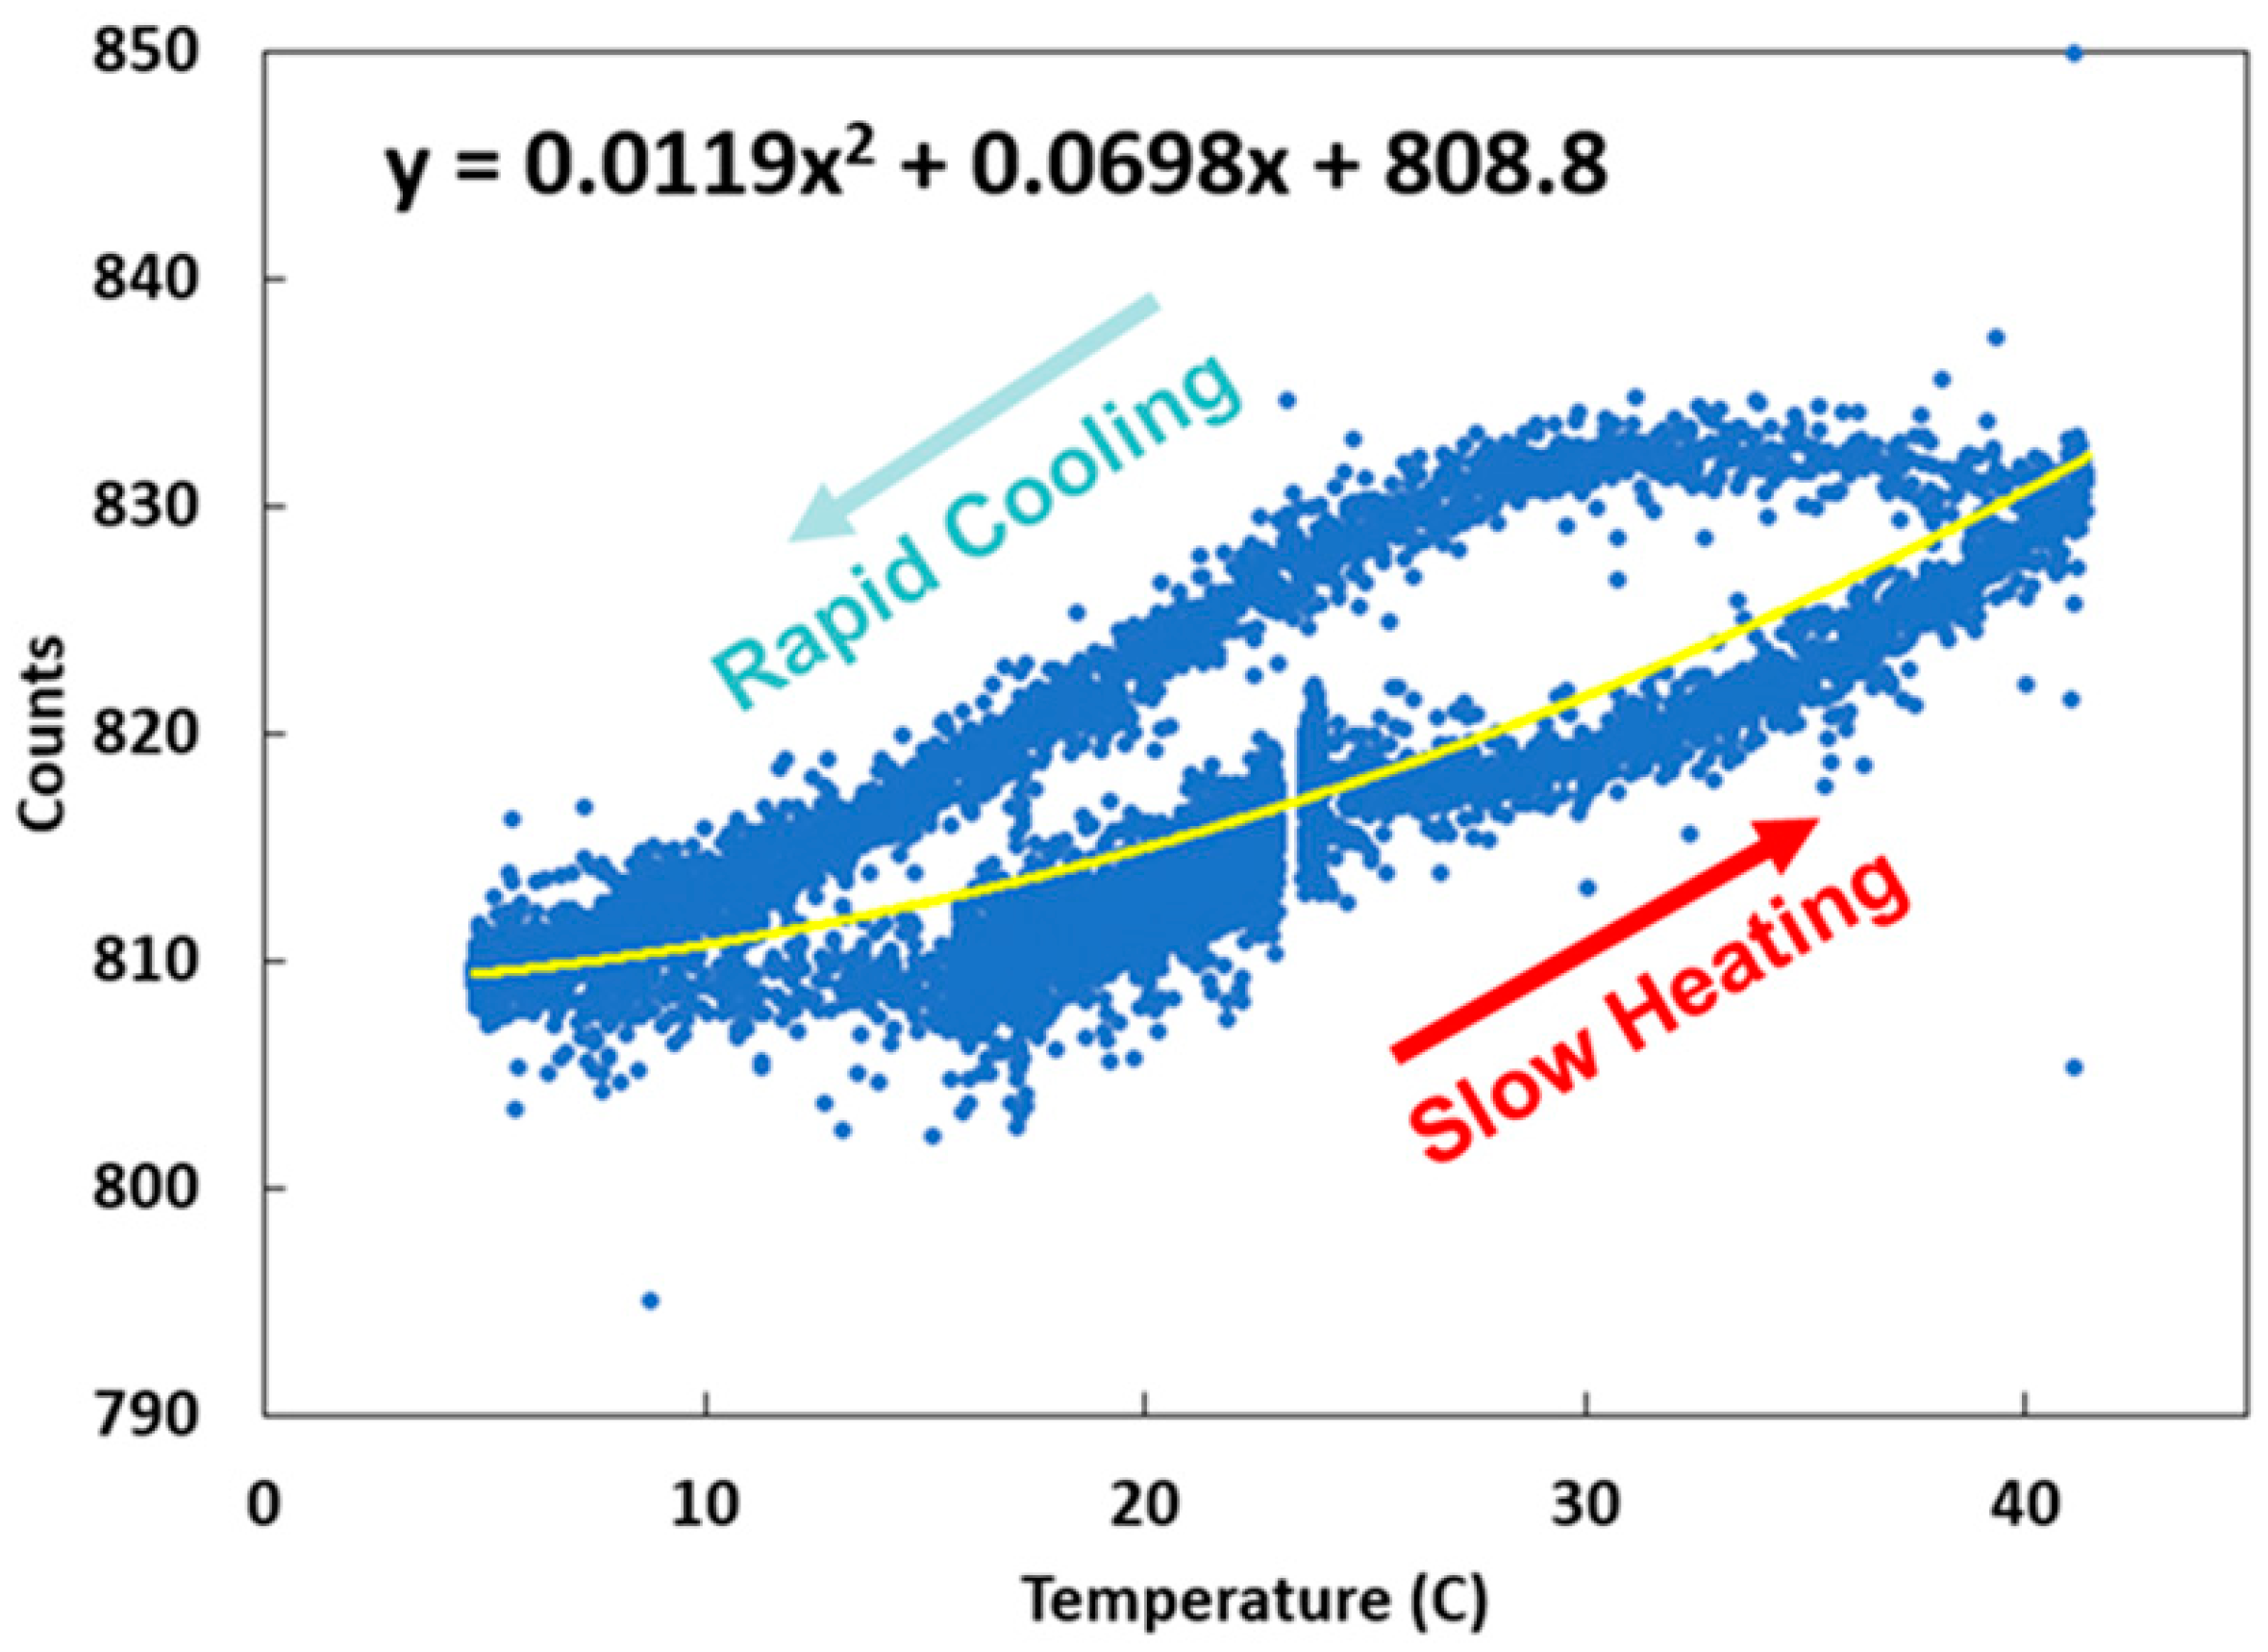
2.2.3. Temperature Compensation
2.2.4. Transfer Function
2.2.5. Preliminary Experiments
3. Methods
3.1. Nevada Black Rock Desert Experiment
3.2. Satellite Remote Sensing Products
4. Results
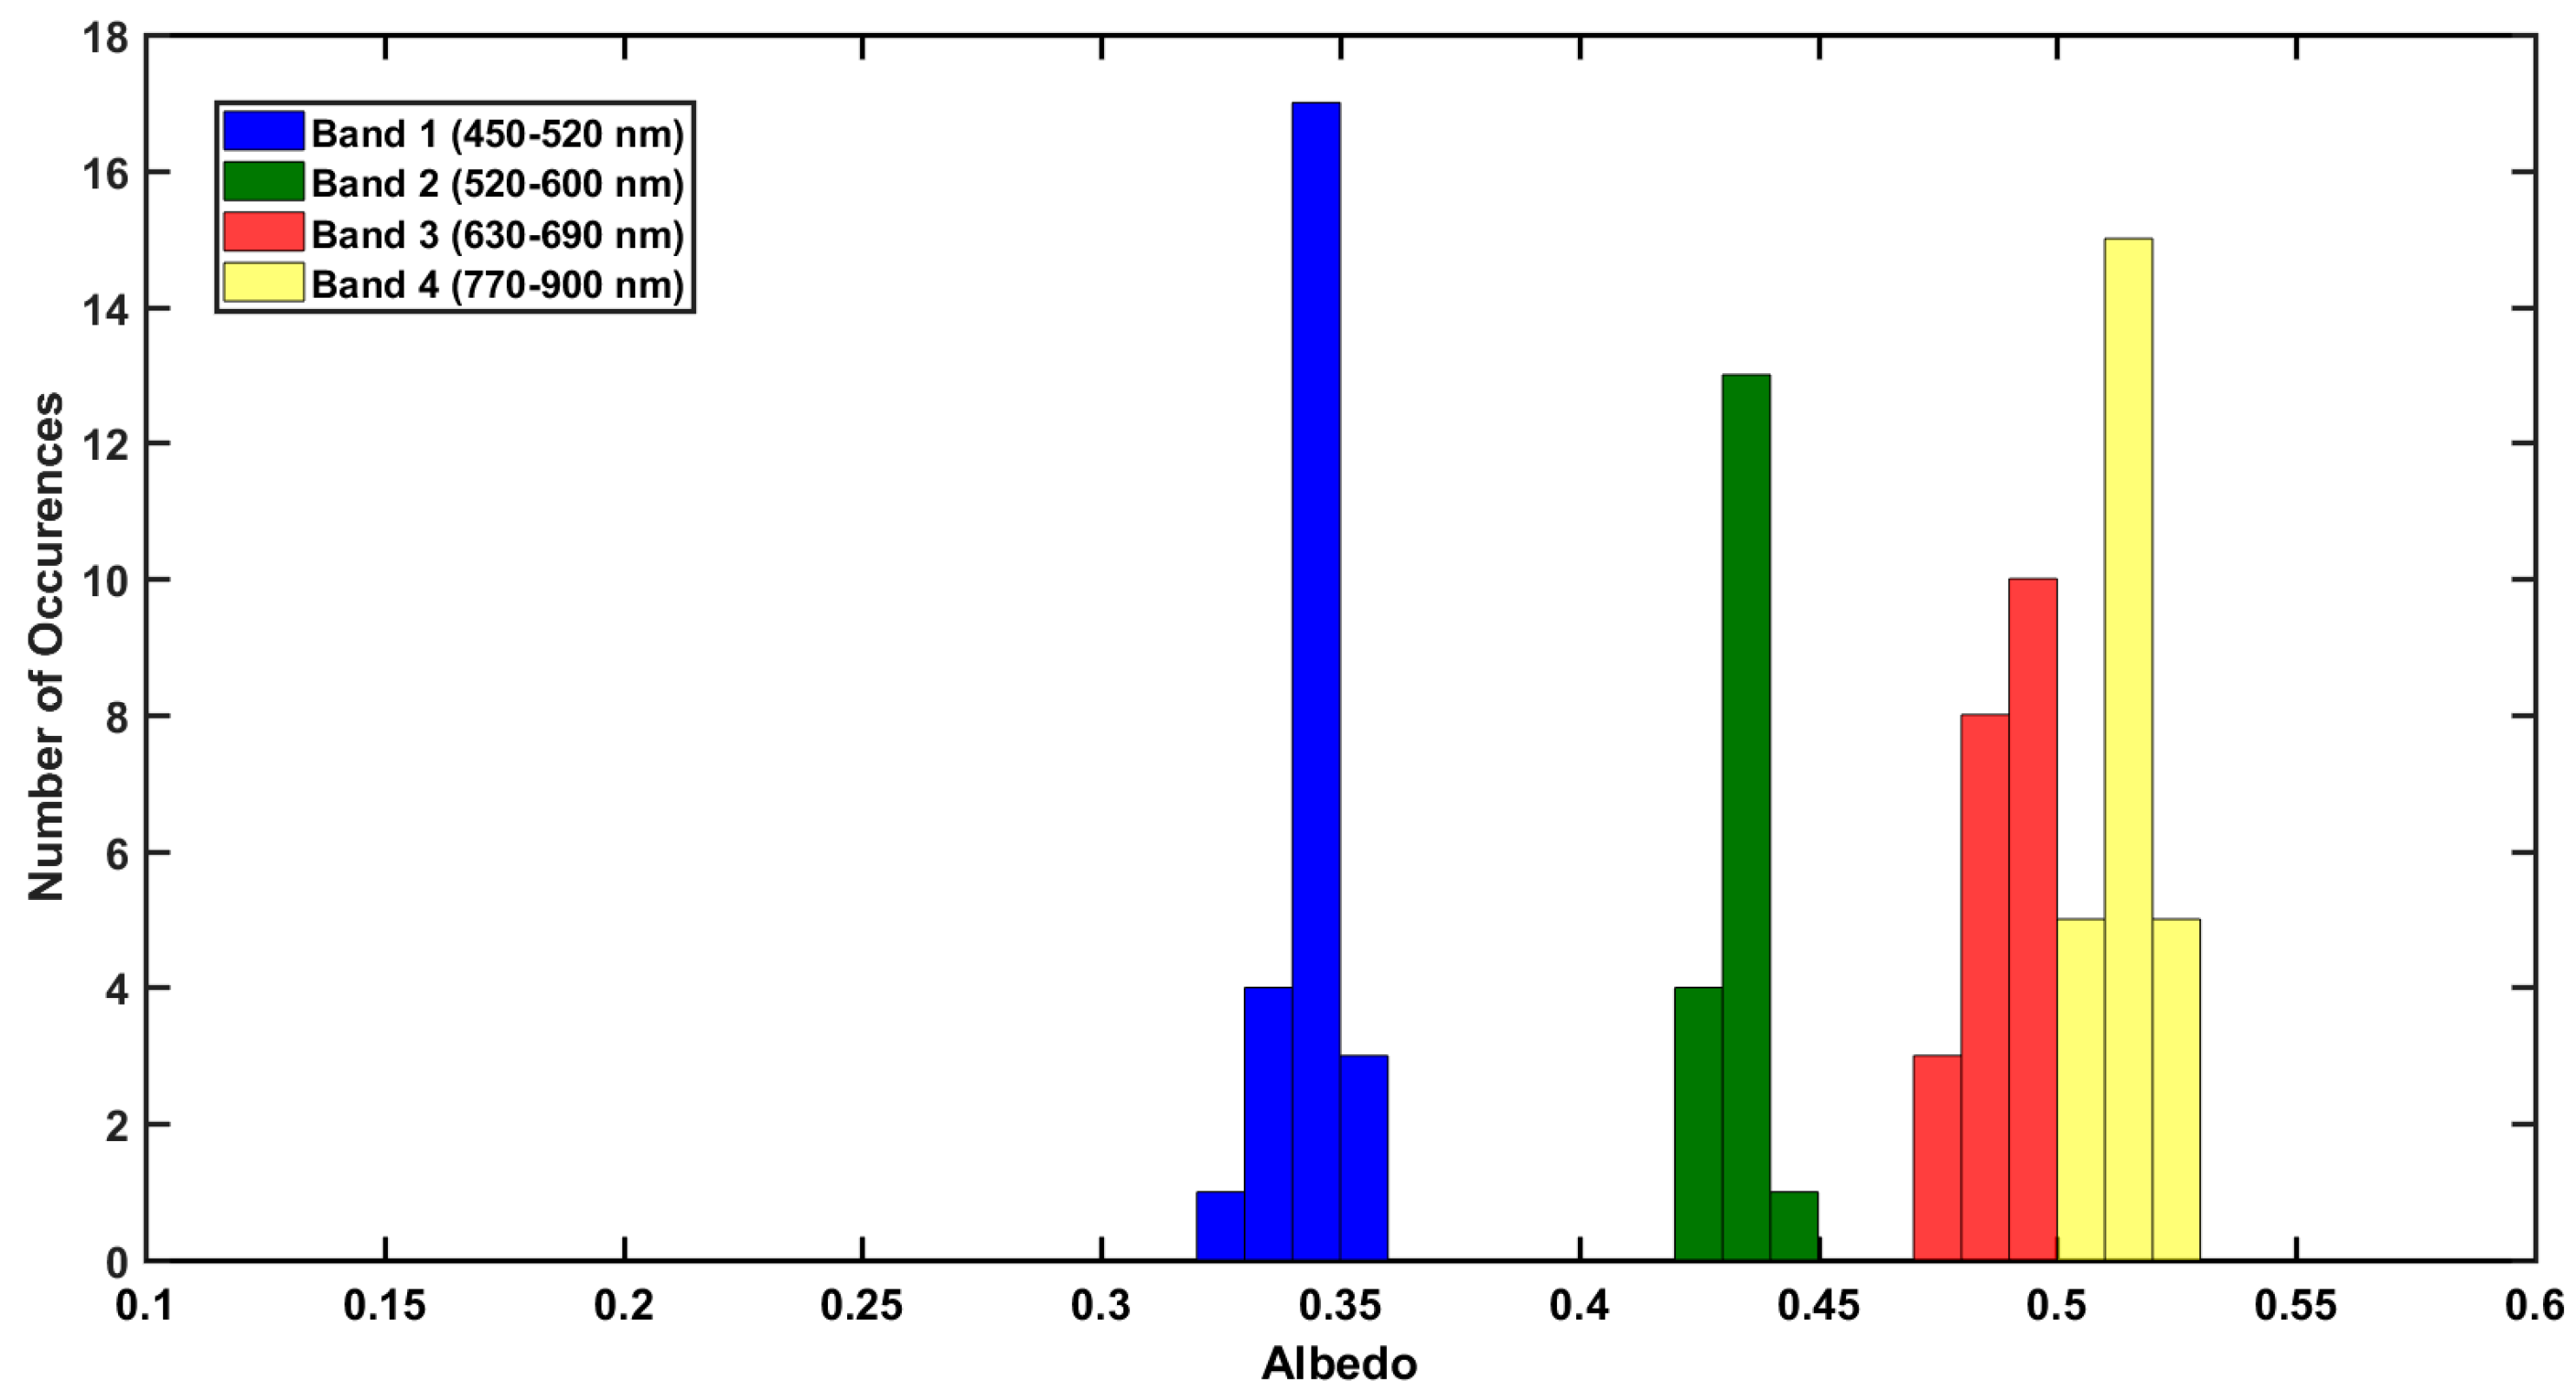
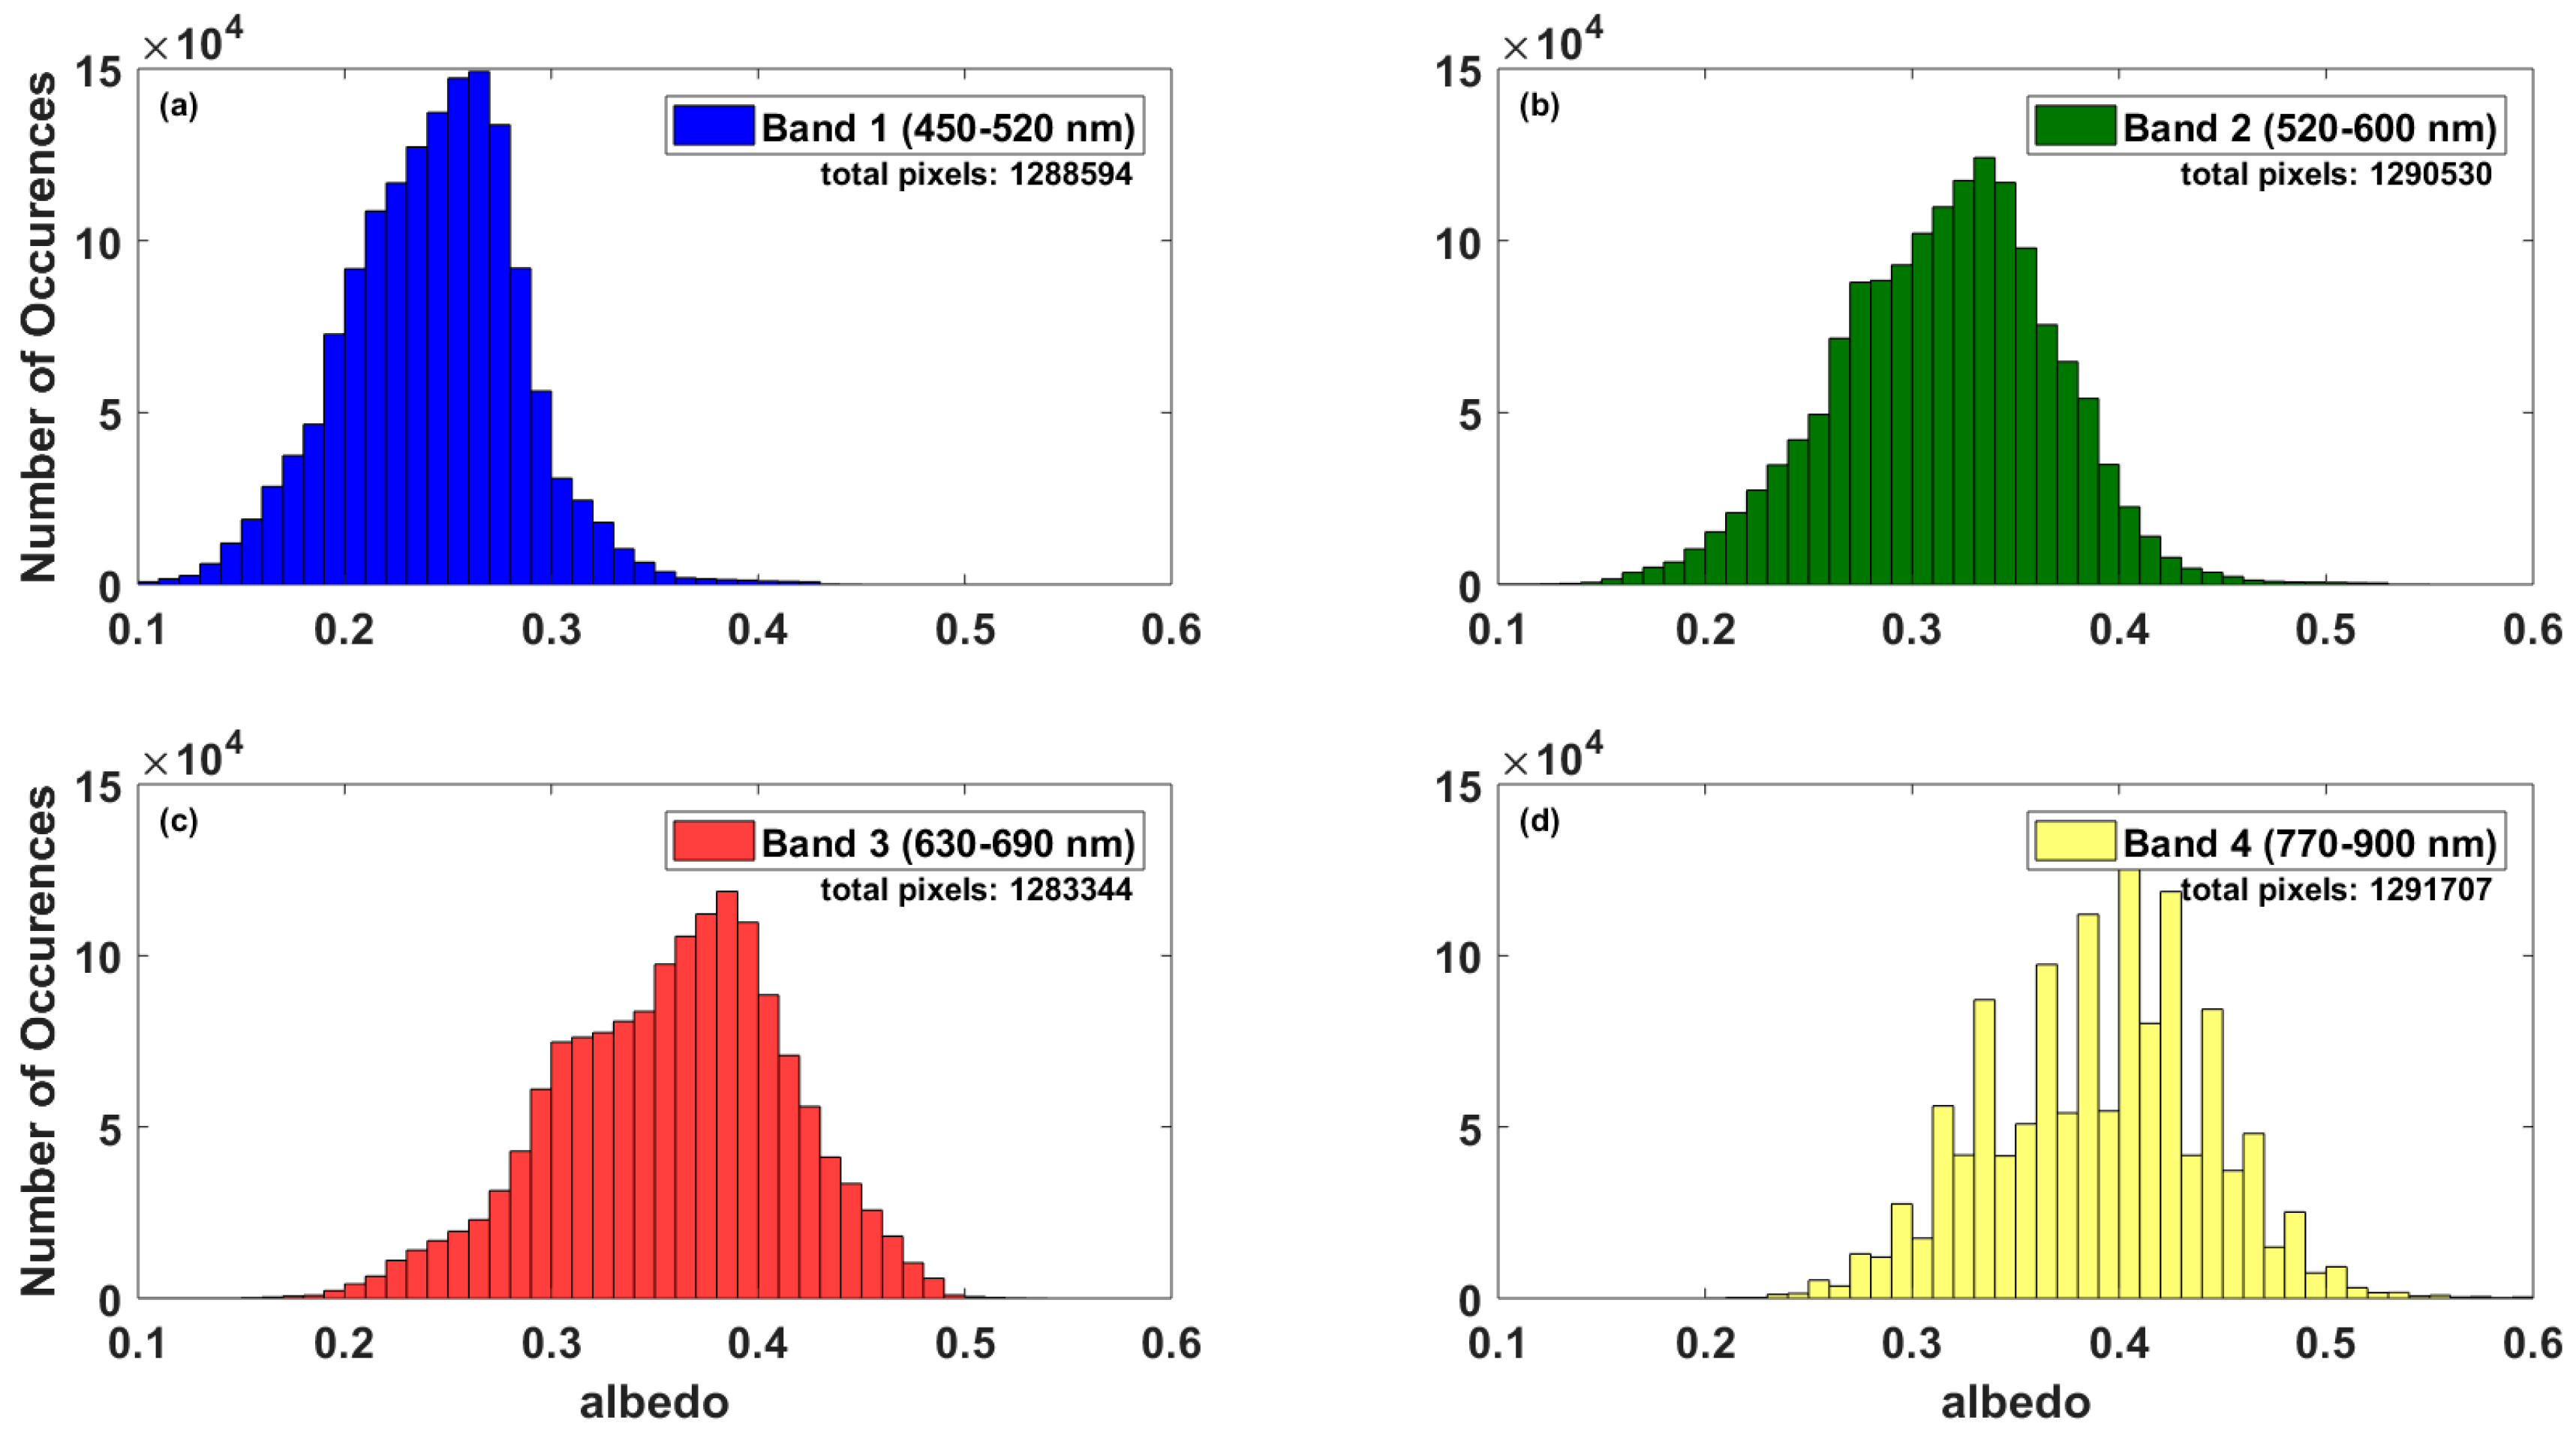
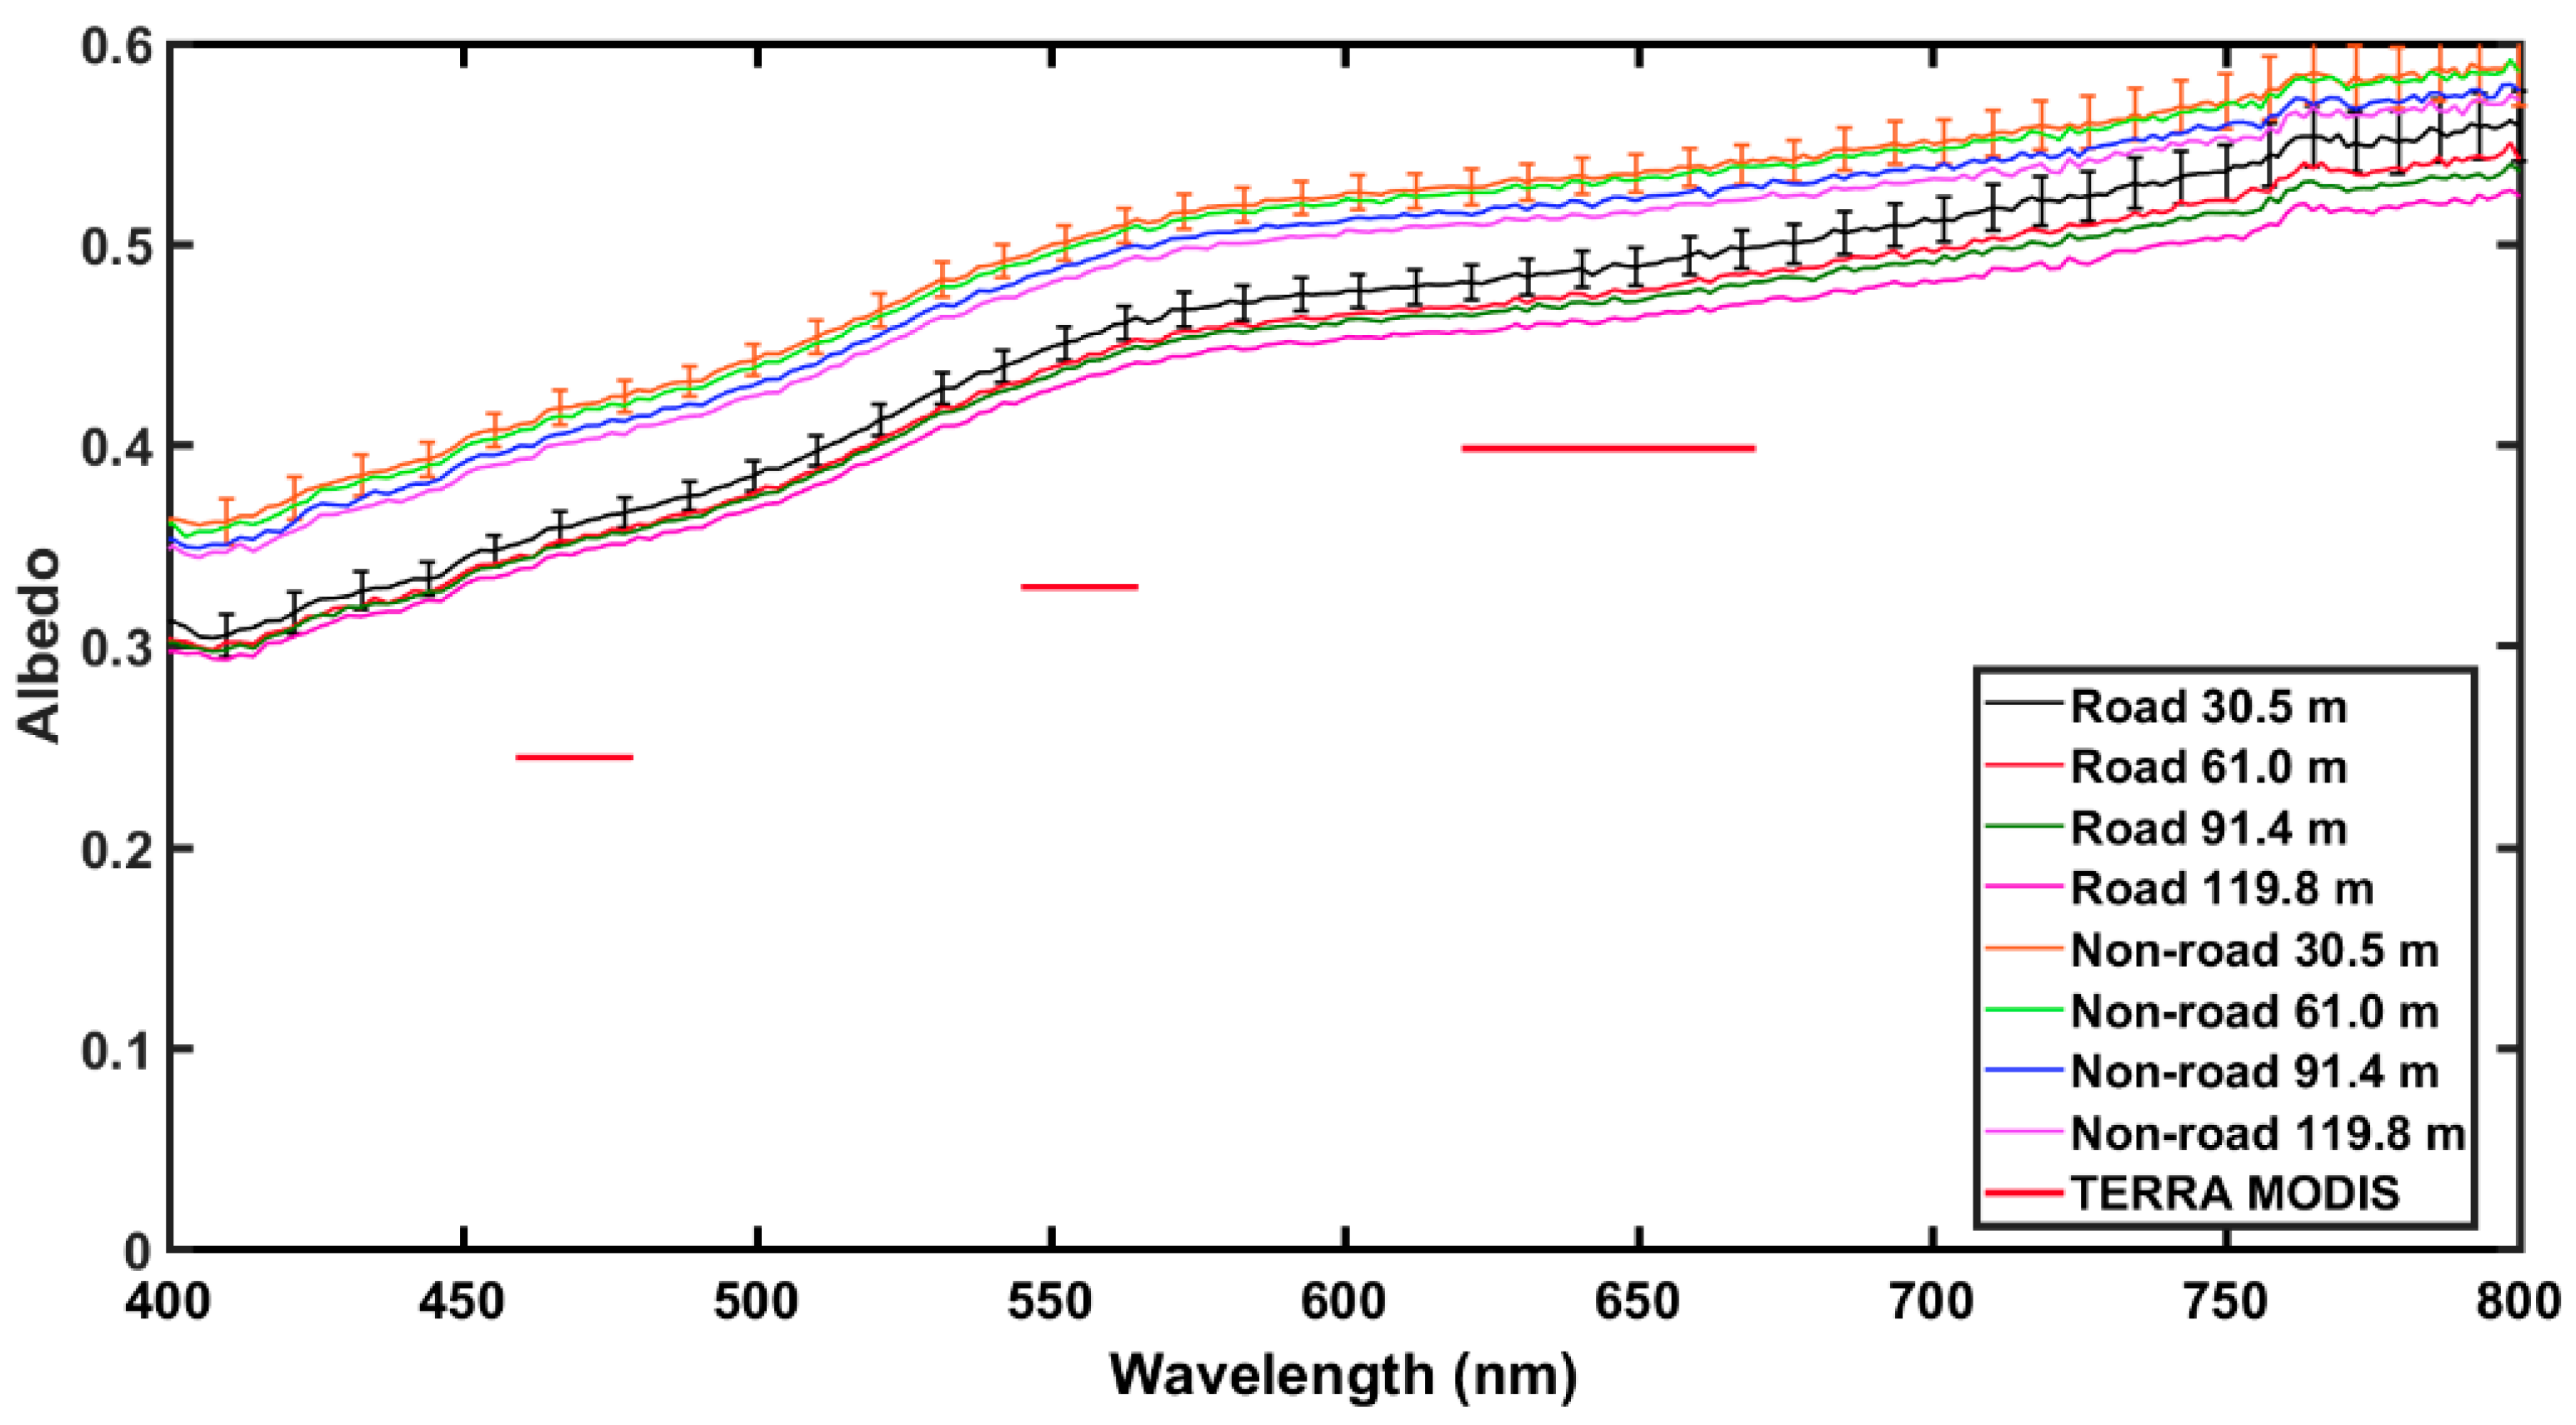
4.1. Albedo
4.2. Impact of Surface Albedo on Satellite AOD Retrievals
5. Discussion
Author Contributions
Funding
Acknowledgments
Conflicts of Interest
Abbreviations
| AGL | above ground level |
| AOD | aerosol optical depth |
| ARM | advanced reduced instruction set computer machine |
| BRD | Black Rock Desert |
| BRDF | Bidirectional Reflectance Distribution Function |
| CMOS | complementary metal-oxide-semiconductor |
| DB | deep-blue |
| DOE | Department of Energy |
| ETM+ | Enhanced Thematic Mapper Plus |
| FAA | Federal Aviation Administration |
| GIFOV | ground instantaneous field of view |
| GPS | Global Positioning System |
| I2C | inter-integrated circuit |
| IDE | Integrated Development Environment |
| IFOV | instantaneous field of view |
| IR | infra-red |
| LANDSAT7 | Land Satellite 7 |
| MODIS | Moderate Resolution Imaging Spectroradiometer |
| NASA | National Aeronautics and Space Administration |
| NOAA | National Oceanic and Atmospheric Administration |
| PLA | polylactic acid |
| PTFE | polytetrafluoroethylene |
| SD | secure digital |
| SSA | single scattering albedo |
| UAS | unmanned aircraft systems |
| UNR | University of Nevada, Reno |
| U.S. | United States |
| USGS | United States Geological Survey |
| UV | ultraviolet |
| VNIR | visible-near infrared |
Appendix A

Appendix B
References
- Schmitt, C.G.; All, J.D.; Schwarz, J.P.; Arnott, W.P.; Cole, R.J.; Lapham, E.; Celestian, A. Measurements of light-absorbing particles on the glaciers in the Cordillera Blanca, Peru. Cryosphere 2015, 9, 331–340. [Google Scholar] [CrossRef] [Green Version]
- Brovkin, V.; Boysen, L.; Raddatz, T.; Gayler, V.; Loew, A.; Claussen, M. Evaluation of vegetation cover and land-surface albedo in MPI-ESM CMIP5 simulations. J. Adv. Model. Earth Syst. 2013, 5, 48–57. [Google Scholar] [CrossRef] [Green Version]
- Zhang, H.; Kondragunta, S.; Laszlo, I.; Liu, H.; Remer, L.A.; Huang, J.; Superczynski, S.; Ciren, P. An enhanced VIIRS aerosol optical thickness (AOT) retrieval algorithm over land using a global surface reflectance ratio database. J. Geophys. Res. Atmos. 2016, 121. [Google Scholar] [CrossRef]
- Myhre, G.; Shindell, D.; Bréon, F.-M.; Collins, W.; Fuglestvedt, J.; Huang, J.; Koch, D.; Lamarque, J.F.; Lee, D.; Mendoza, B.; et al. Anthropogenic and Natural Radiative Forcing. Clim. Chang. 2013, 423, 658–740. [Google Scholar]
- Jonsell, U.; Hock, R.; Holmgren, B. Spatial and temporal variations in albedo on Storglaciären, Sweden. J. Glaciol. 2003, 49, 59–68. [Google Scholar] [CrossRef]
- He, T.; Liang, S.; Song, D.-X. Analysis of global land surface albedo climatology and spatial-temporal variation during 1981–2010 from multiple satellite products. J. Geophys. Res. Atmos. 2014. [Google Scholar] [CrossRef]
- Claverie, M.; Vermote, E.F.; Franch, B.; Masek, J.G. Evaluation of the Landsat-5 TM and Landsat-7 ETM + surface reflectance products. Remote Sens. Environ. 2015, 169, 390–403. [Google Scholar] [CrossRef]
- Liu, Y.; Wang, Z.; Sun, Q.; Erb, A.M.; Li, Z.; Schaaf, C.B.; Zhang, X.; Román, M.O.; Scott, R.L.; Zhang, Q.; et al. Evaluation of the VIIRS BRDF, Albedo and NBAR products suite and an assessment of continuity with the long term MODIS record. Remote Sens. Environ. 2017, 201, 256–274. [Google Scholar] [CrossRef]
- Pinty, B.; Taberner, M.; Haemmerle, V.R.; Paradise, S.R.; Vermote, E.; Verstraete, M.M.; Gobron, N.; Widlowski, J.-L. Global-Scale Comparison of MISR and MODIS Land Surface Albedos. J. Clim. 2011, 24, 732–749. [Google Scholar] [CrossRef] [Green Version]
- Heikkinen, P.; Pulliainen, J.; Kyro, E.; Sukuvaara, T.; Suokanerva, H.; Kontu, A. Comparison of MODIS surface reflectance with mast-based spectrometer observations using CORINE20001and cover database. In Proceedings of the 2007 IEEE International Geoscience and Remote Sensing Symposium, Barcelona, Spain, 23–28 July 2007; pp. 4117–4119. [Google Scholar]
- Maiersperger, T.K.; Scaramuzza, P.L.; Leigh, L.; Shrestha, S.; Gallo, K.P.; Jenkerson, C.B.; Dwyer, J.L. Characterizing LEDAPS surface reflectance products by comparisons with AERONET, field spectrometer, and MODIS data. Remote Sens. Environ. 2013, 136, 1–13. [Google Scholar] [CrossRef] [Green Version]
- Mira, M.; Weiss, M.; Baret, F.; Courault, D.; Hagolle, O.; Gallego-Elvira, B.; Olioso, A. The MODIS (collection V006) BRDF/albedo product MCD43D: Temporal course evaluated over agricultural landscape. Remote Sens. Environ. 2015, 170, 216–228. [Google Scholar] [CrossRef] [Green Version]
- Li, Z.; Zhao, X.; Kahn, R.; Mishchenko, M.; Remer, L.; Lee, K.-H.; Wang, M.; Laszlo, I.; Nakajima, T.; Maring, H. Uncertainties in satellite remote sensing of aerosols and impact on monitoring its long-term trend: A review and perspective. Ann. Geophys. 2009, 27, 2755–2770. [Google Scholar] [CrossRef]
- Loría-Salazar, S.M.; Holmes, H.A.; Patrick Arnott, W.; Barnard, J.C.; Moosmüller, H. Evaluation of MODIS columnar aerosol retrievals using AERONET in semi-arid Nevada and California, U.S.A., during the summer of 2012. Atmos. Environ. 2016, 144, 345–360. [Google Scholar] [CrossRef]
- Sorek-Hamer, M.; Kloog, I.; Koutrakis, P.; Strawa, A.W.; Chatfield, R.; Cohen, A.; Ridgway, W.L.; Broday, D.M. Assessment of PM2.5 concentrations over bright surfaces using MODIS satellite observations. Remote Sens. Environ. 2015, 163, 180–185. [Google Scholar] [CrossRef]
- Hsu, N.C. Changes to MODIS Deep Blue Aerosol Products between Collection 6 and Collection 6.1. 2017. Available online: https://modis-atmos.gsfc.nasa.gov/sites/default/files/ModAtmo/modis_deep_blue_c61_changes.pdf (accessed on 4 October 2018).
- Uto, K.; Seki, H.; Saito, G.; Kosugi, Y.; Komatsu, T. Development of a Low-Cost Hyperspectral Whiskbroom Imager Using an Optical Fiber Bundle, a Swing Mirror, and Compact Spectrometers. IEEE J. Sel. Top. Appl. Earth Obs. Remote Sens. 2016, 9, 3909–3925. [Google Scholar] [CrossRef]
- Coddington, O.; Schmidt, K.S.; Pilewskie, P.; Gore, W.J.; Bergstrom, R.W.; Roman, M.; Redemann, J.; Russell, P.B.; Liu, J.; Schaaf, C.C. Aircraft measurements of spectral surface albedo and its consistency with ground-based and space-borne observations. J. Geophys. Res. Atmos. 2008, 113, D17209. [Google Scholar] [CrossRef]
- Wendisch, M.; Müller, D.; Schell, D.; Heintzenberg, J. An Airborne Spectral Albedometer with Active Horizontal Stabilization. J. Atmos. Ocean. Technol. 2001, 18, 1856–1866. [Google Scholar] [CrossRef]
- Van der Hage, J.C.H. Interpretation of Field Measurements Made with a Portable Albedometer. J. Atmos. Ocean. Technol. 1992, 9, 420–425. [Google Scholar] [CrossRef] [Green Version]
- Teensy USB Development Board. Available online: https://www.pjrc.com/teensy/ (accessed on 29 April 2018).
- Micro-Spectrometer C12666MA, Photonics. 2017. Available online: https://www.hamamatsu.com/us/en/product/type/C12666MA/index.html (accessed on 10 October 2018).
- Arduino—Software. Available online: https://www.arduino.cc/en/Main/Software (accessed on 2 October 2018).
- Taha, H. Urban climates and heat islands: Albedo, evapotranspiration, and anthropogenic heat. Energy Build. 1997, 25, 99–103. [Google Scholar] [CrossRef]
- Levy, R.C.; Remer, L.A.; Mattoo, S.; Vermote, E.F.; Kaufman, Y.J. Second-generation operational algorithm: Retrieval of aerosol properties over land from inversion of Moderate Resolution Imaging Spectroradiometer spectral reflectance. J. Geophys. Res. Atmos. 2007, 112, D13211. [Google Scholar] [CrossRef]
- Remer, L.A.; Kaufman, Y.J.; Tanré, D.; Mattoo, S.; Chu, D.A.; Martins, J.V.; Li, R.-R.; Ichoku, C.; Levy, R.C.; Kleidman, R.G.; et al. The MODIS Aerosol Algorithm, Products, and Validation. J. Atmos. Sci. 2005, 62, 947–973. [Google Scholar] [CrossRef] [Green Version]
- Vermote, E.F.; Roger, J.C.; Ray, J.P. MODIS Surface Reflectance User’s Guide Version 1.4. Available online: http://modis-sr.ltdri.org/guide/MOD09_UserGuide_v1.4.pdf (accessed on 29 August 2018).
- Barsi, J.; Lee, K.; Kvaran, G.; Markham, B.; Pedelty, J. The Spectral Response of the Landsat-8 Operational Land Imager. Remote Sens. 2014, 6, 10232–10251. [Google Scholar] [CrossRef] [Green Version]
- Hsu, N.C.; Jeong, M.-J.; Bettenhausen, C.; Sayer, A.M.; Hansell, R.; Seftor, C.S.; Huang, J.; Tsay, S.-C. Enhanced Deep Blue aerosol retrieval algorithm: The second generation. J. Geophys. Res. Atmos. 2013, 118, 9296–9315. [Google Scholar] [CrossRef] [Green Version]
- Hsu, N.C.; Tsay, S.-C.; King, M.D.; Herman, J.R. Aerosol properties over bright-reflecting source regions. IEEE Trans. Geosci. Remote Sens. 2004, 42, 557–569. [Google Scholar] [CrossRef]
- Shi, Y.; Zhang, J.; Reid, J.S.; Hyer, E.J.; Hsu, N.C. Critical evaluation of the MODIS Deep Blue aerosol optical depth product for data assimilation over North Africa. Atmos. Meas. Tech. 2013, 6, 949–969. [Google Scholar] [CrossRef]
- Sayer, A.M.; Munchak, L.A.; Hsu, N.C.; Levy, R.C.; Bettenhausen, C.; Jeong, M.-J. MODIS Collection 6 aerosol products: Comparison between Aqua’s e-Deep Blue, Dark Target, and “merged” data sets, and usage recommendations. J. Geophys. Res. Atmos. 2014, 119. [Google Scholar] [CrossRef]
- Levy, R.C.; Mattoo, S.; Munchak, L.A.; Remer, L.A.; Sayer, A.M.; Patadia, F.; Hsu, N.C. The Collection 6 MODIS aerosol products over land and ocean. Atmos. Meas. Tech. 2013, 6, 2989–3034. [Google Scholar] [CrossRef] [Green Version]
- Loría-Salazar, S.M.; University of Nevada, Reno, NV, USA; Sayer, A.M.; NASA Goddard Space Flight Center, Greenbelt, MD, USA. Personal communication, 2017.
- Sayer, A.M.; Hsu, N.C.; Bettenhausen, C.; Lee, J.; Redemann, J.; Schmid, B.; Shinozuka, Y. Extending “Deep Blue” aerosol retrieval coverage to cases of absorbing aerosols above clouds: Sensitivity analysis and first case studies. J. Geophys. Res. Atmos. 2016, 121, 4830–4854. [Google Scholar] [CrossRef]
- Crowley, J. Visible and Near-Infrared (0.4-2.5 Mu-M) Reflectance Spectra of Playa Evaporite Minerals. J. Geophys. Res.-Solid Earth 1991, 96, 16231–16240. [Google Scholar] [CrossRef]
- Bilal, M.; Nichol, J.E.; Nazeer, M. Validation of Aqua-MODIS C051 and C006 Operational Aerosol Products Using AERONET Measurements Over Pakistan. IEEE J. Sel. Top. Appl. Earth Obs. Remote Sens. 2016, 9, 2074–2080. [Google Scholar] [CrossRef]
- Sioris, C.E.; McLinden, C.A.; Shephard, M.W.; Fioletov, V.E.; Abboud, I. Assessment of the aerosol optical depths measured by satellite-based passive remote sensors in the Alberta oil sands region. Atmos. Chem. Phys. 2017, 17, 1931–1943. [Google Scholar] [CrossRef] [Green Version]
- Arras, K.O. An Introduction to Error Propagation: Derivation, Meaning and Examples of Equation Cy = Fx Cx FxT; Technical Report: EPFL-ASL-TR-98-01 R3; École Polytechnique Fédérale de Lausanne (EPFL): Lausanne, Switzerland, 1998. [Google Scholar]
- Seidel, F.C.; Popp, C. Critical surface albedo and its implications to aerosol remote sensing. Atmos. Meas. Tech. 2012, 5, 1653–1665. [Google Scholar] [CrossRef] [Green Version]


© 2018 by the authors. Licensee MDPI, Basel, Switzerland. This article is an open access article distributed under the terms and conditions of the Creative Commons Attribution (CC BY) license (http://creativecommons.org/licenses/by/4.0/).
Share and Cite
Boehmler, J.M.; Loría-Salazar, S.M.; Stevens, C.; Long, J.D.; Watts, A.C.; Holmes, H.A.; Barnard, J.C.; Arnott, W.P. Development of a Multispectral Albedometer and Deployment on an Unmanned Aircraft for Evaluating Satellite Retrieved Surface Reflectance over Nevada’s Black Rock Desert. Sensors 2018, 18, 3504. https://doi.org/10.3390/s18103504
Boehmler JM, Loría-Salazar SM, Stevens C, Long JD, Watts AC, Holmes HA, Barnard JC, Arnott WP. Development of a Multispectral Albedometer and Deployment on an Unmanned Aircraft for Evaluating Satellite Retrieved Surface Reflectance over Nevada’s Black Rock Desert. Sensors. 2018; 18(10):3504. https://doi.org/10.3390/s18103504
Chicago/Turabian StyleBoehmler, Jayne M., S. Marcela Loría-Salazar, Chris Stevens, James D. Long, Adam C. Watts, Heather A. Holmes, James C. Barnard, and W. Patrick Arnott. 2018. "Development of a Multispectral Albedometer and Deployment on an Unmanned Aircraft for Evaluating Satellite Retrieved Surface Reflectance over Nevada’s Black Rock Desert" Sensors 18, no. 10: 3504. https://doi.org/10.3390/s18103504