
The Development of an Open Hardware and Software System Onboard Unmanned Aerial Vehicles to Monitor Concentrated Solar Power Plants

 ,
,
Abstract
:1. Introduction
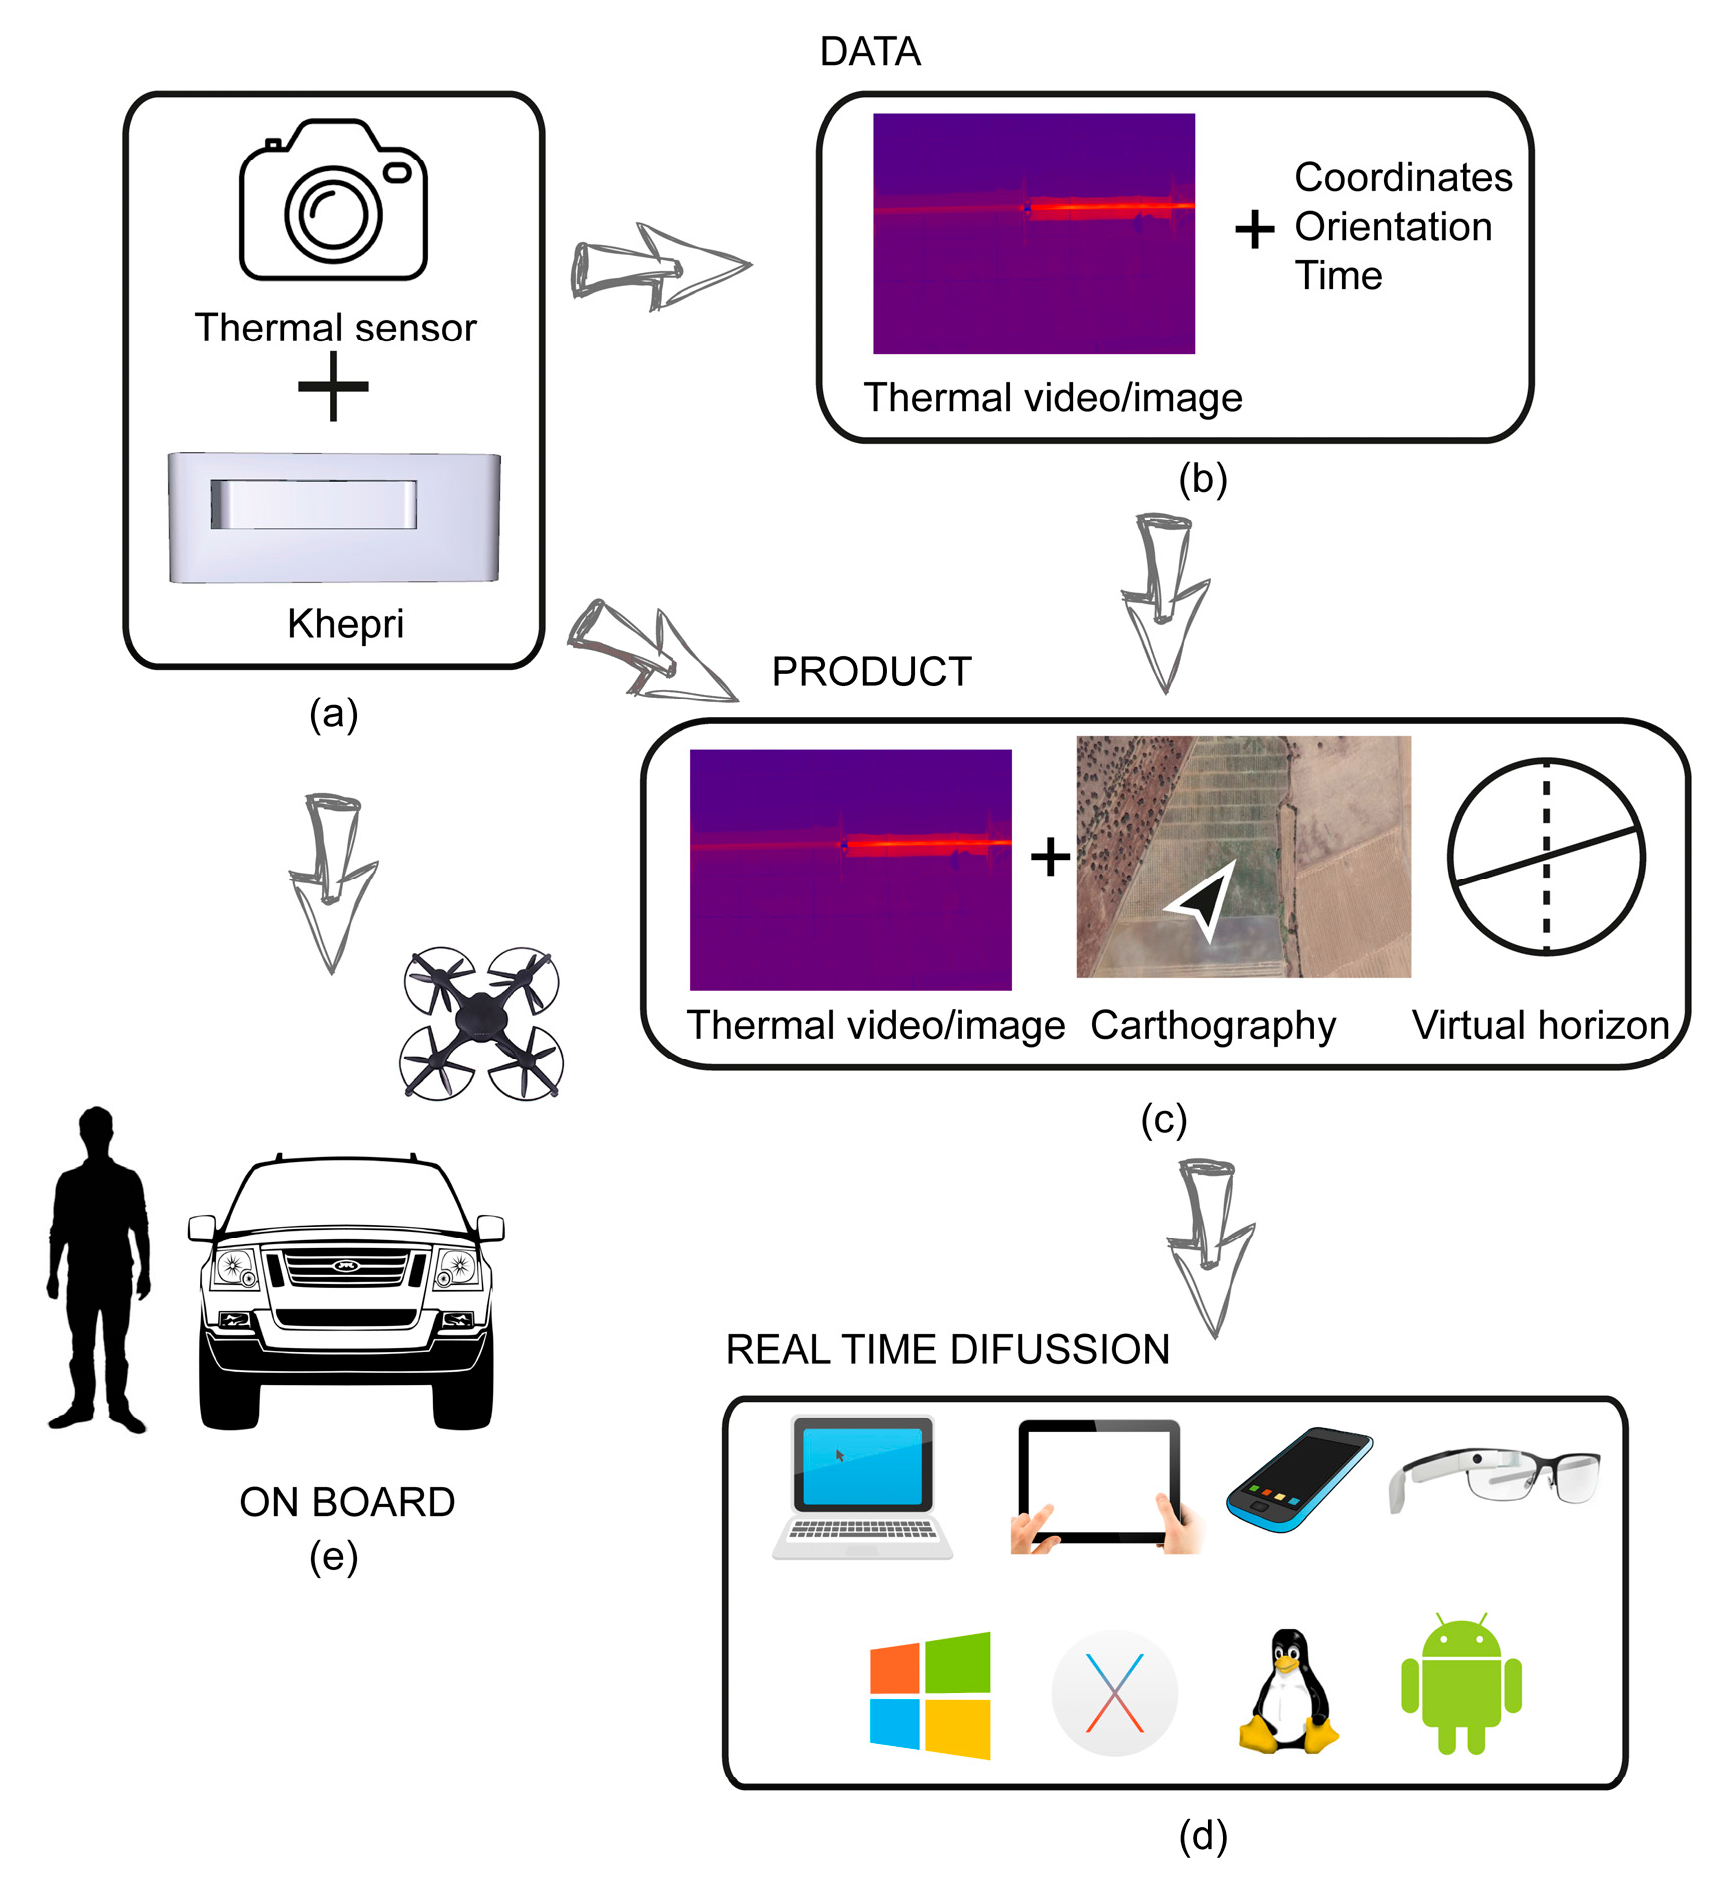
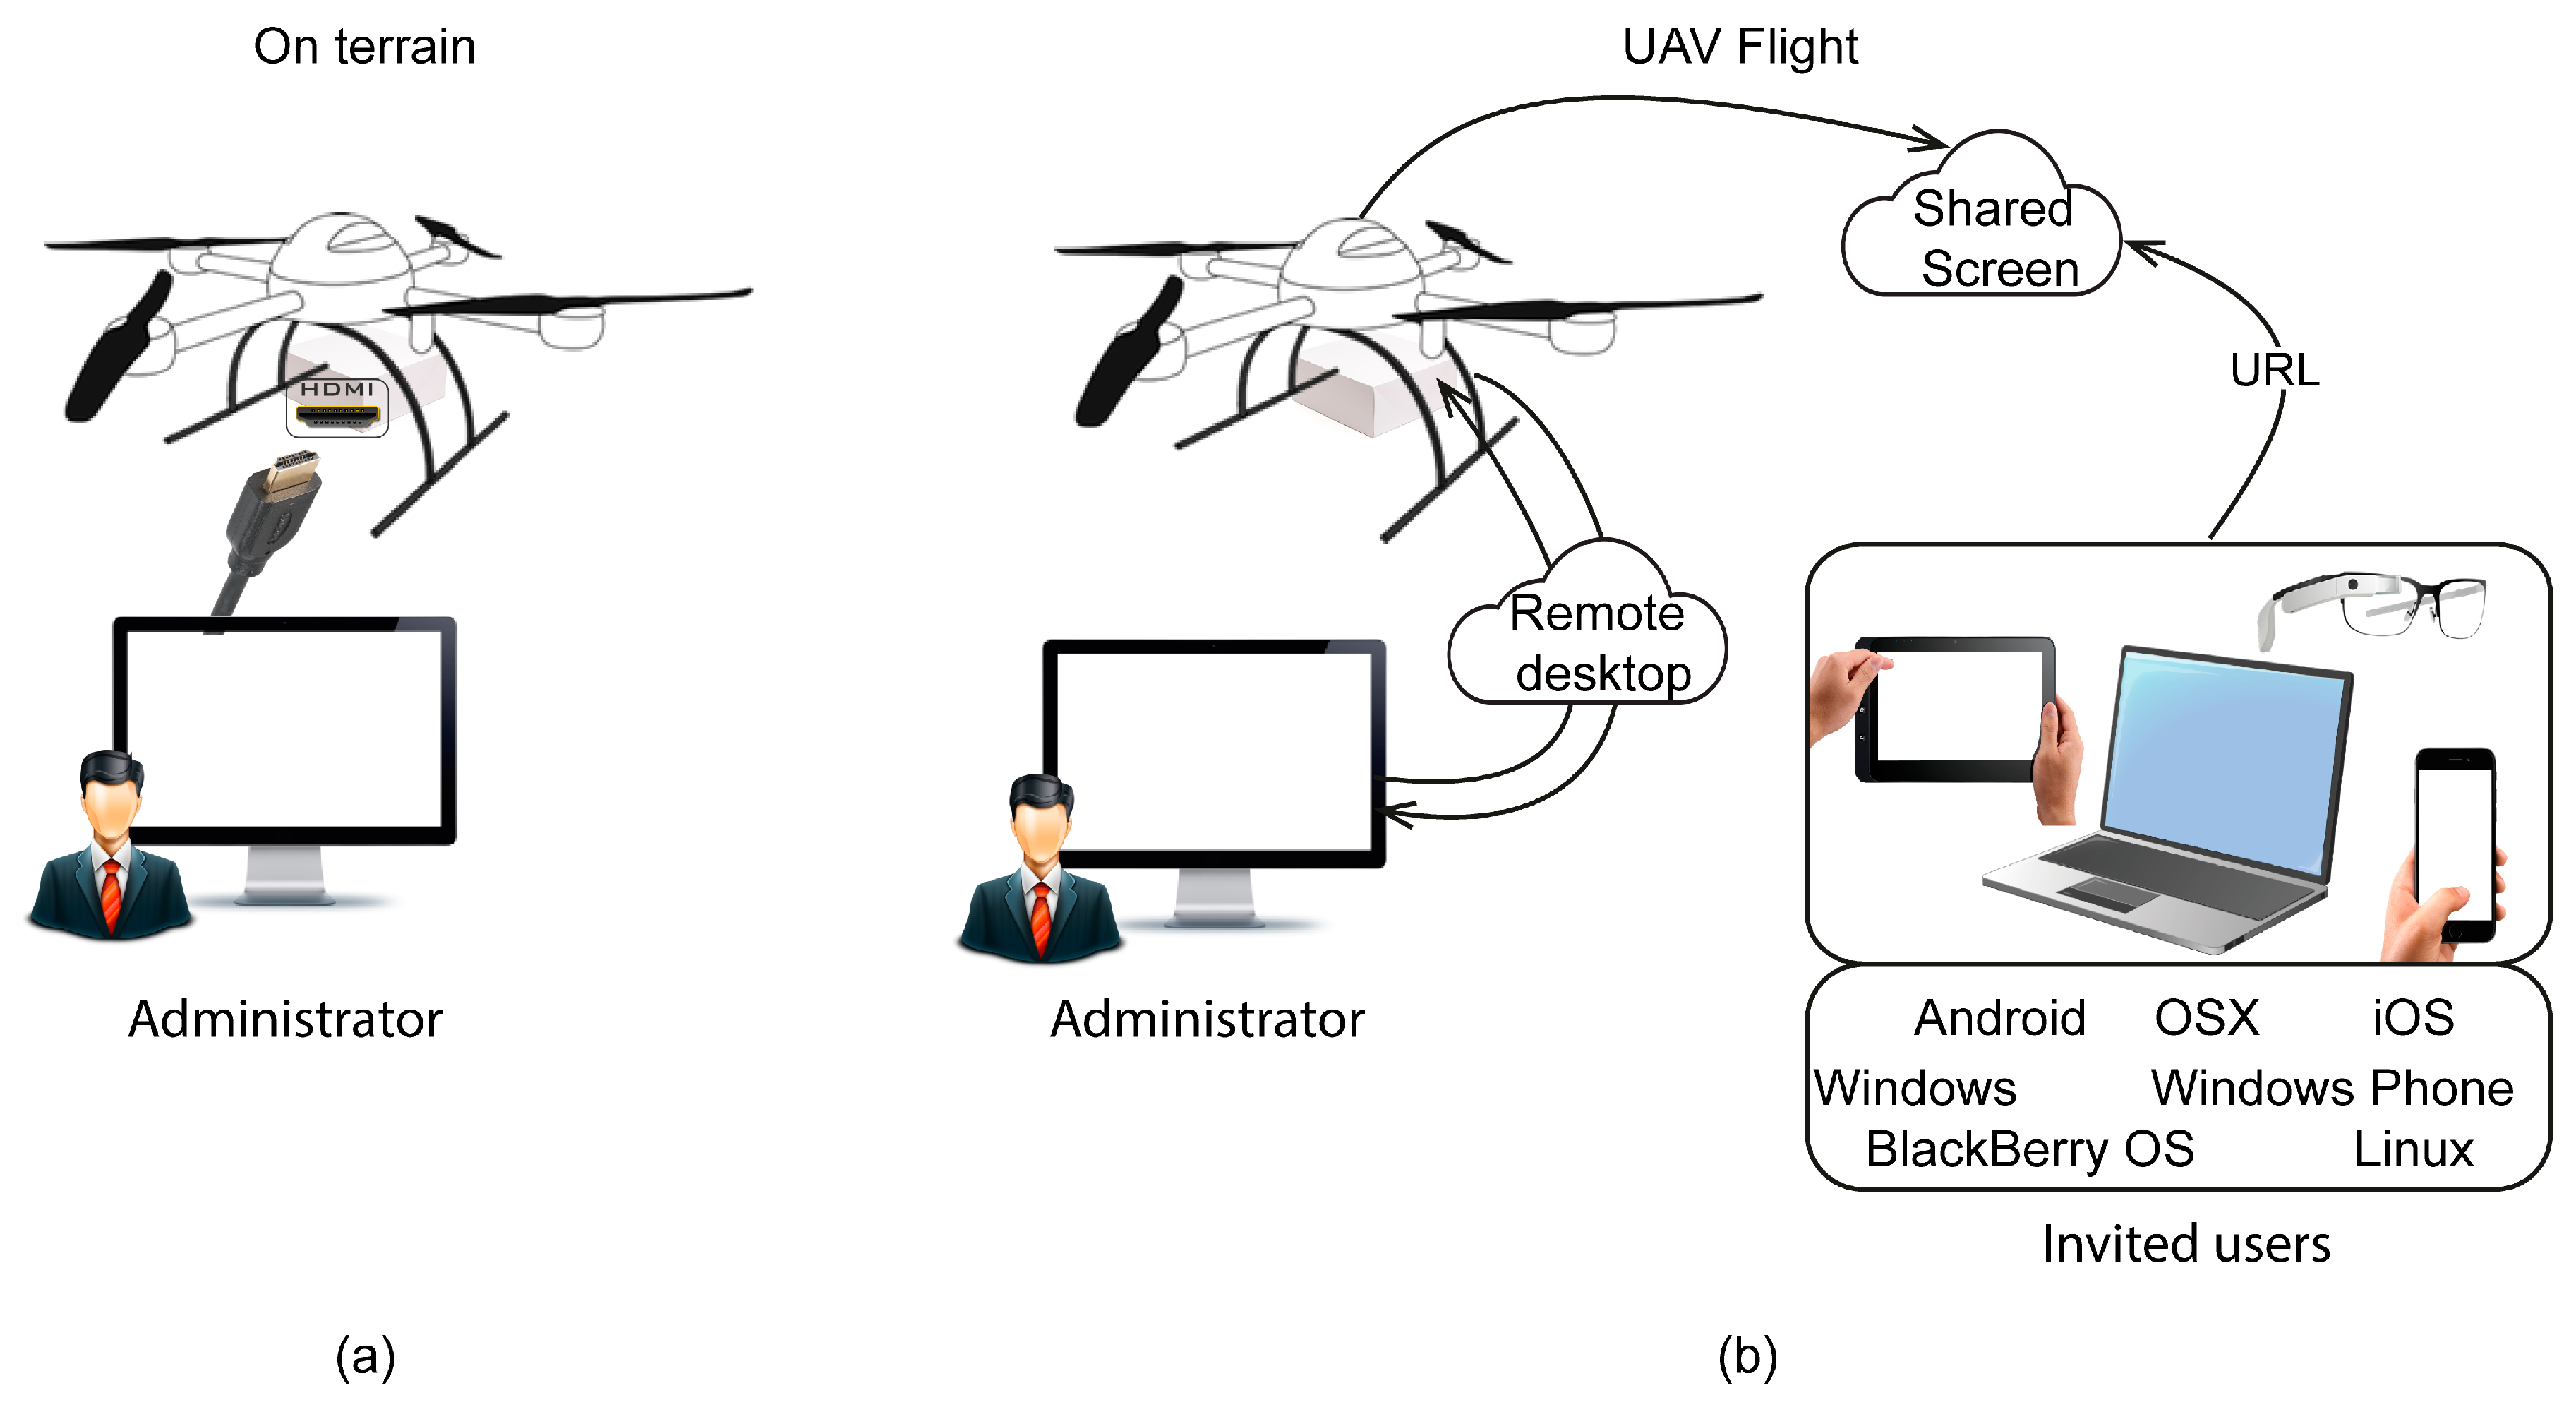
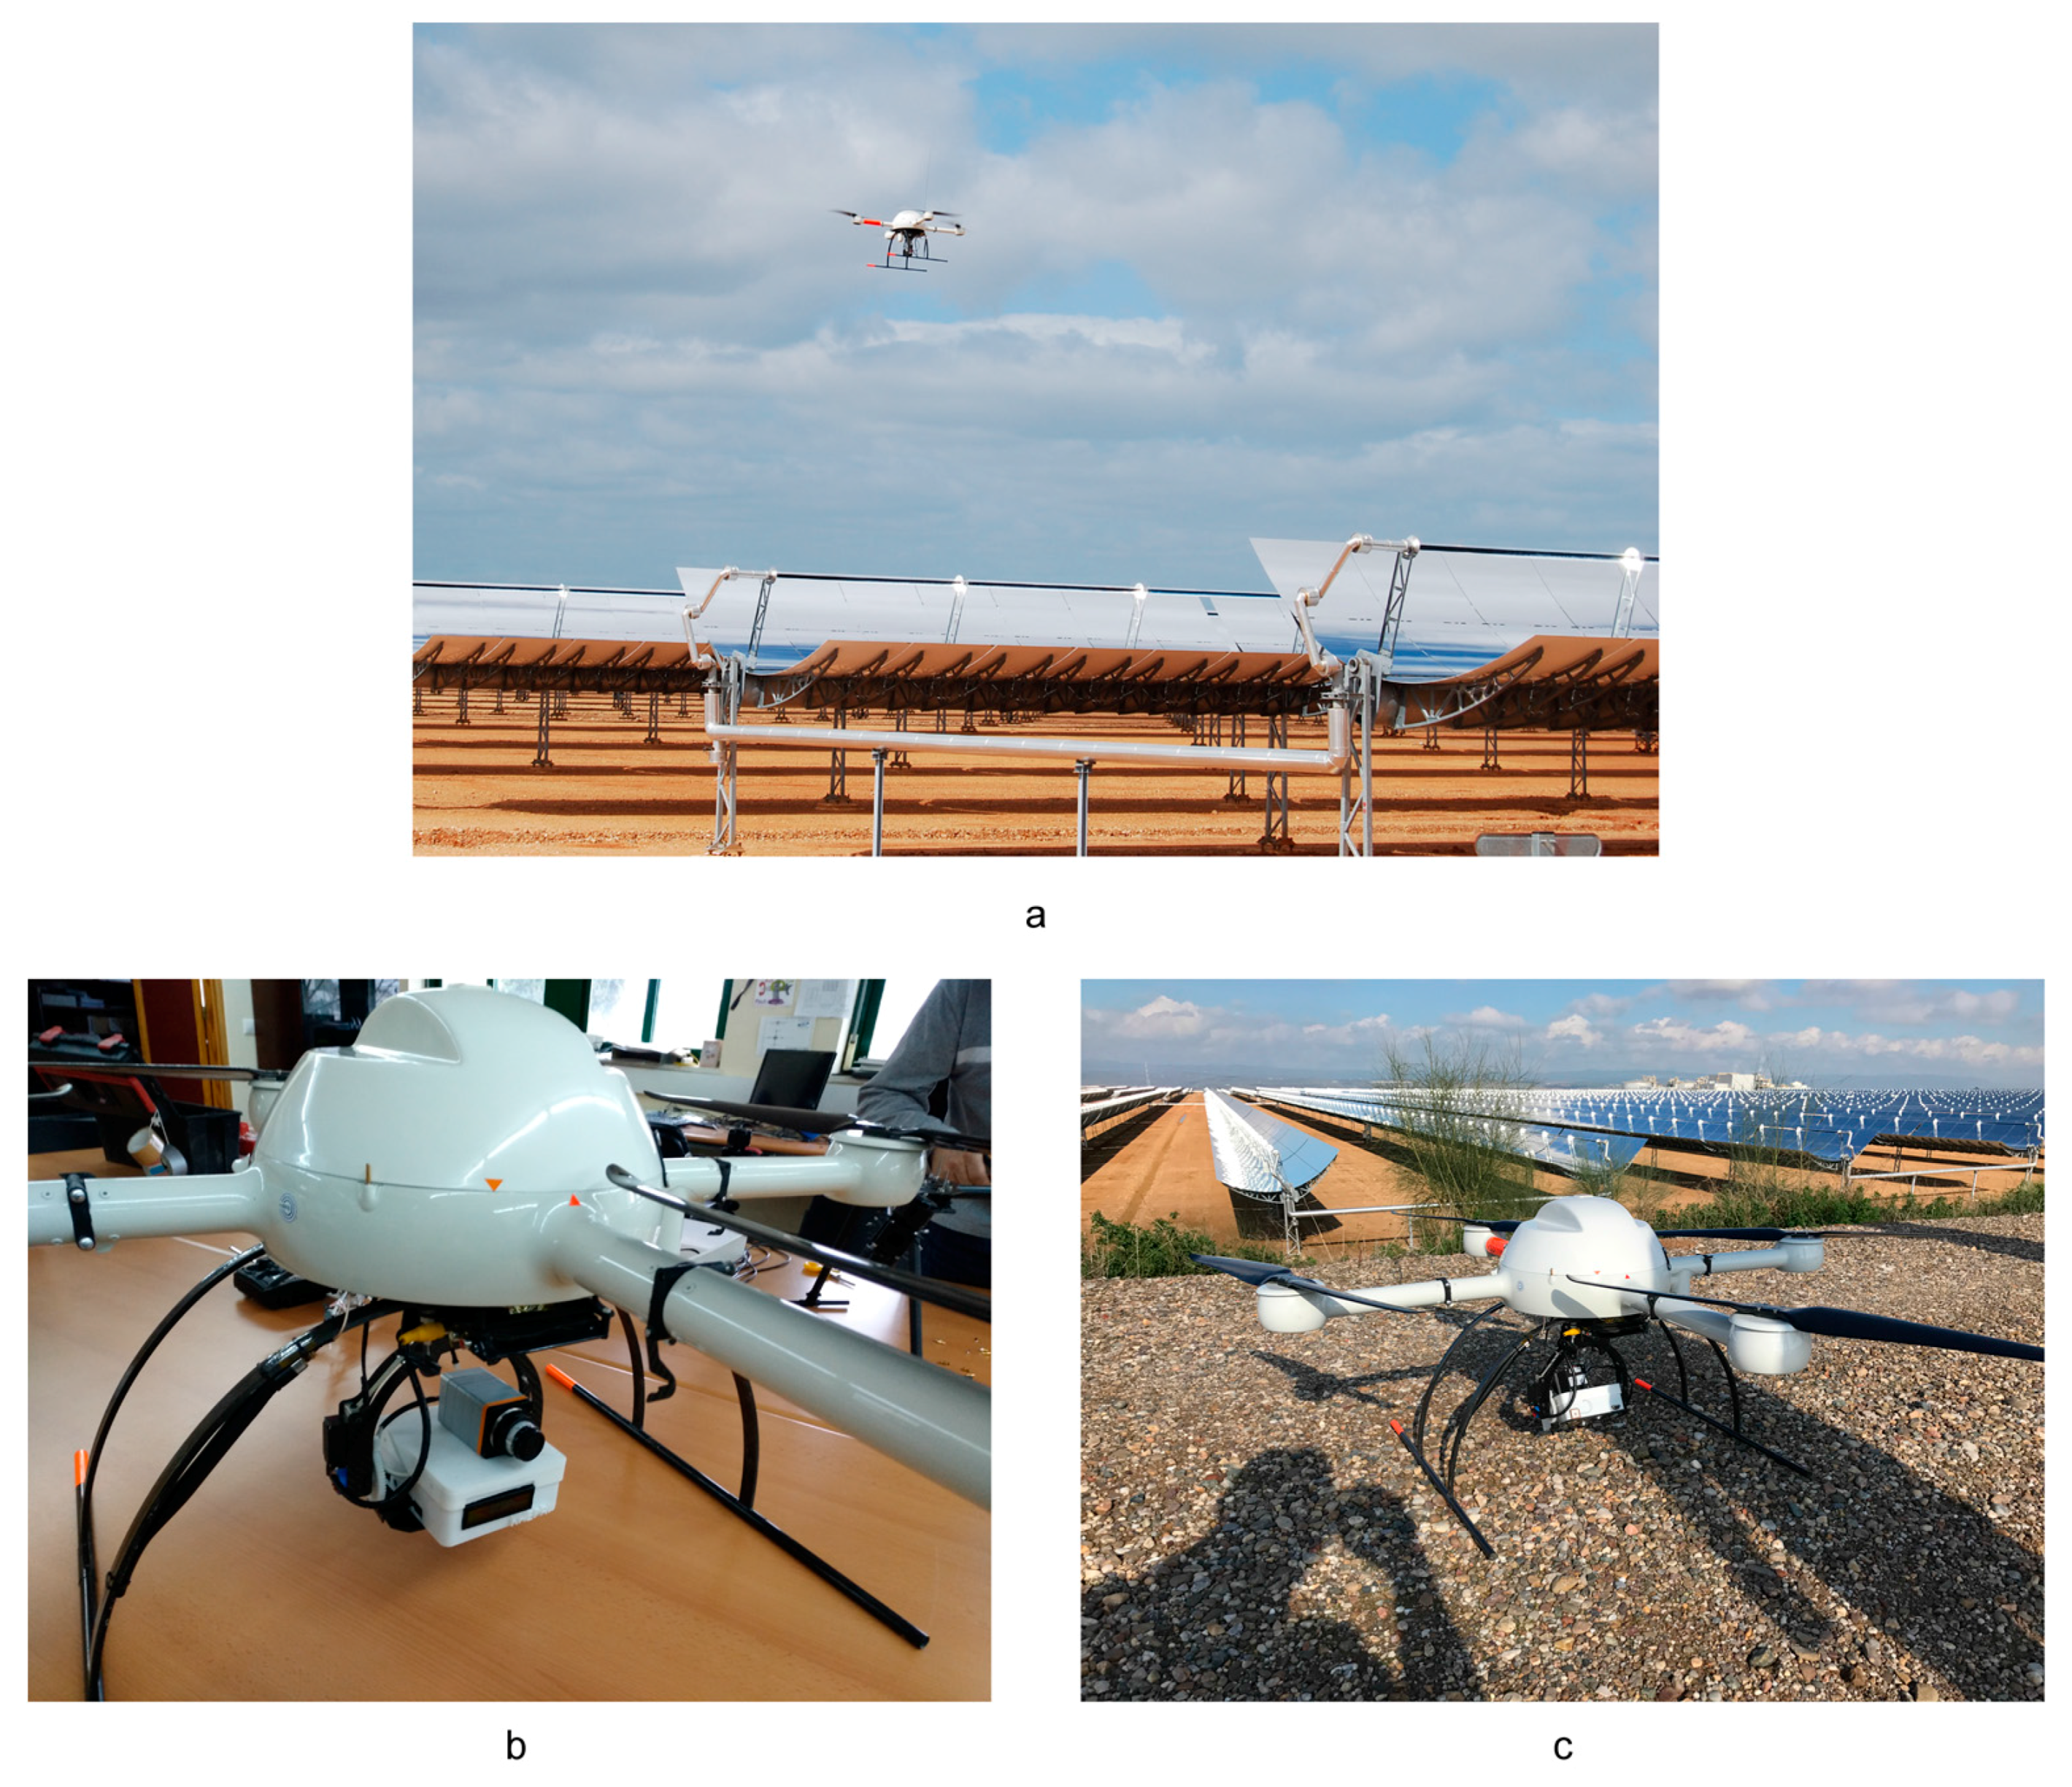
2. System Overview
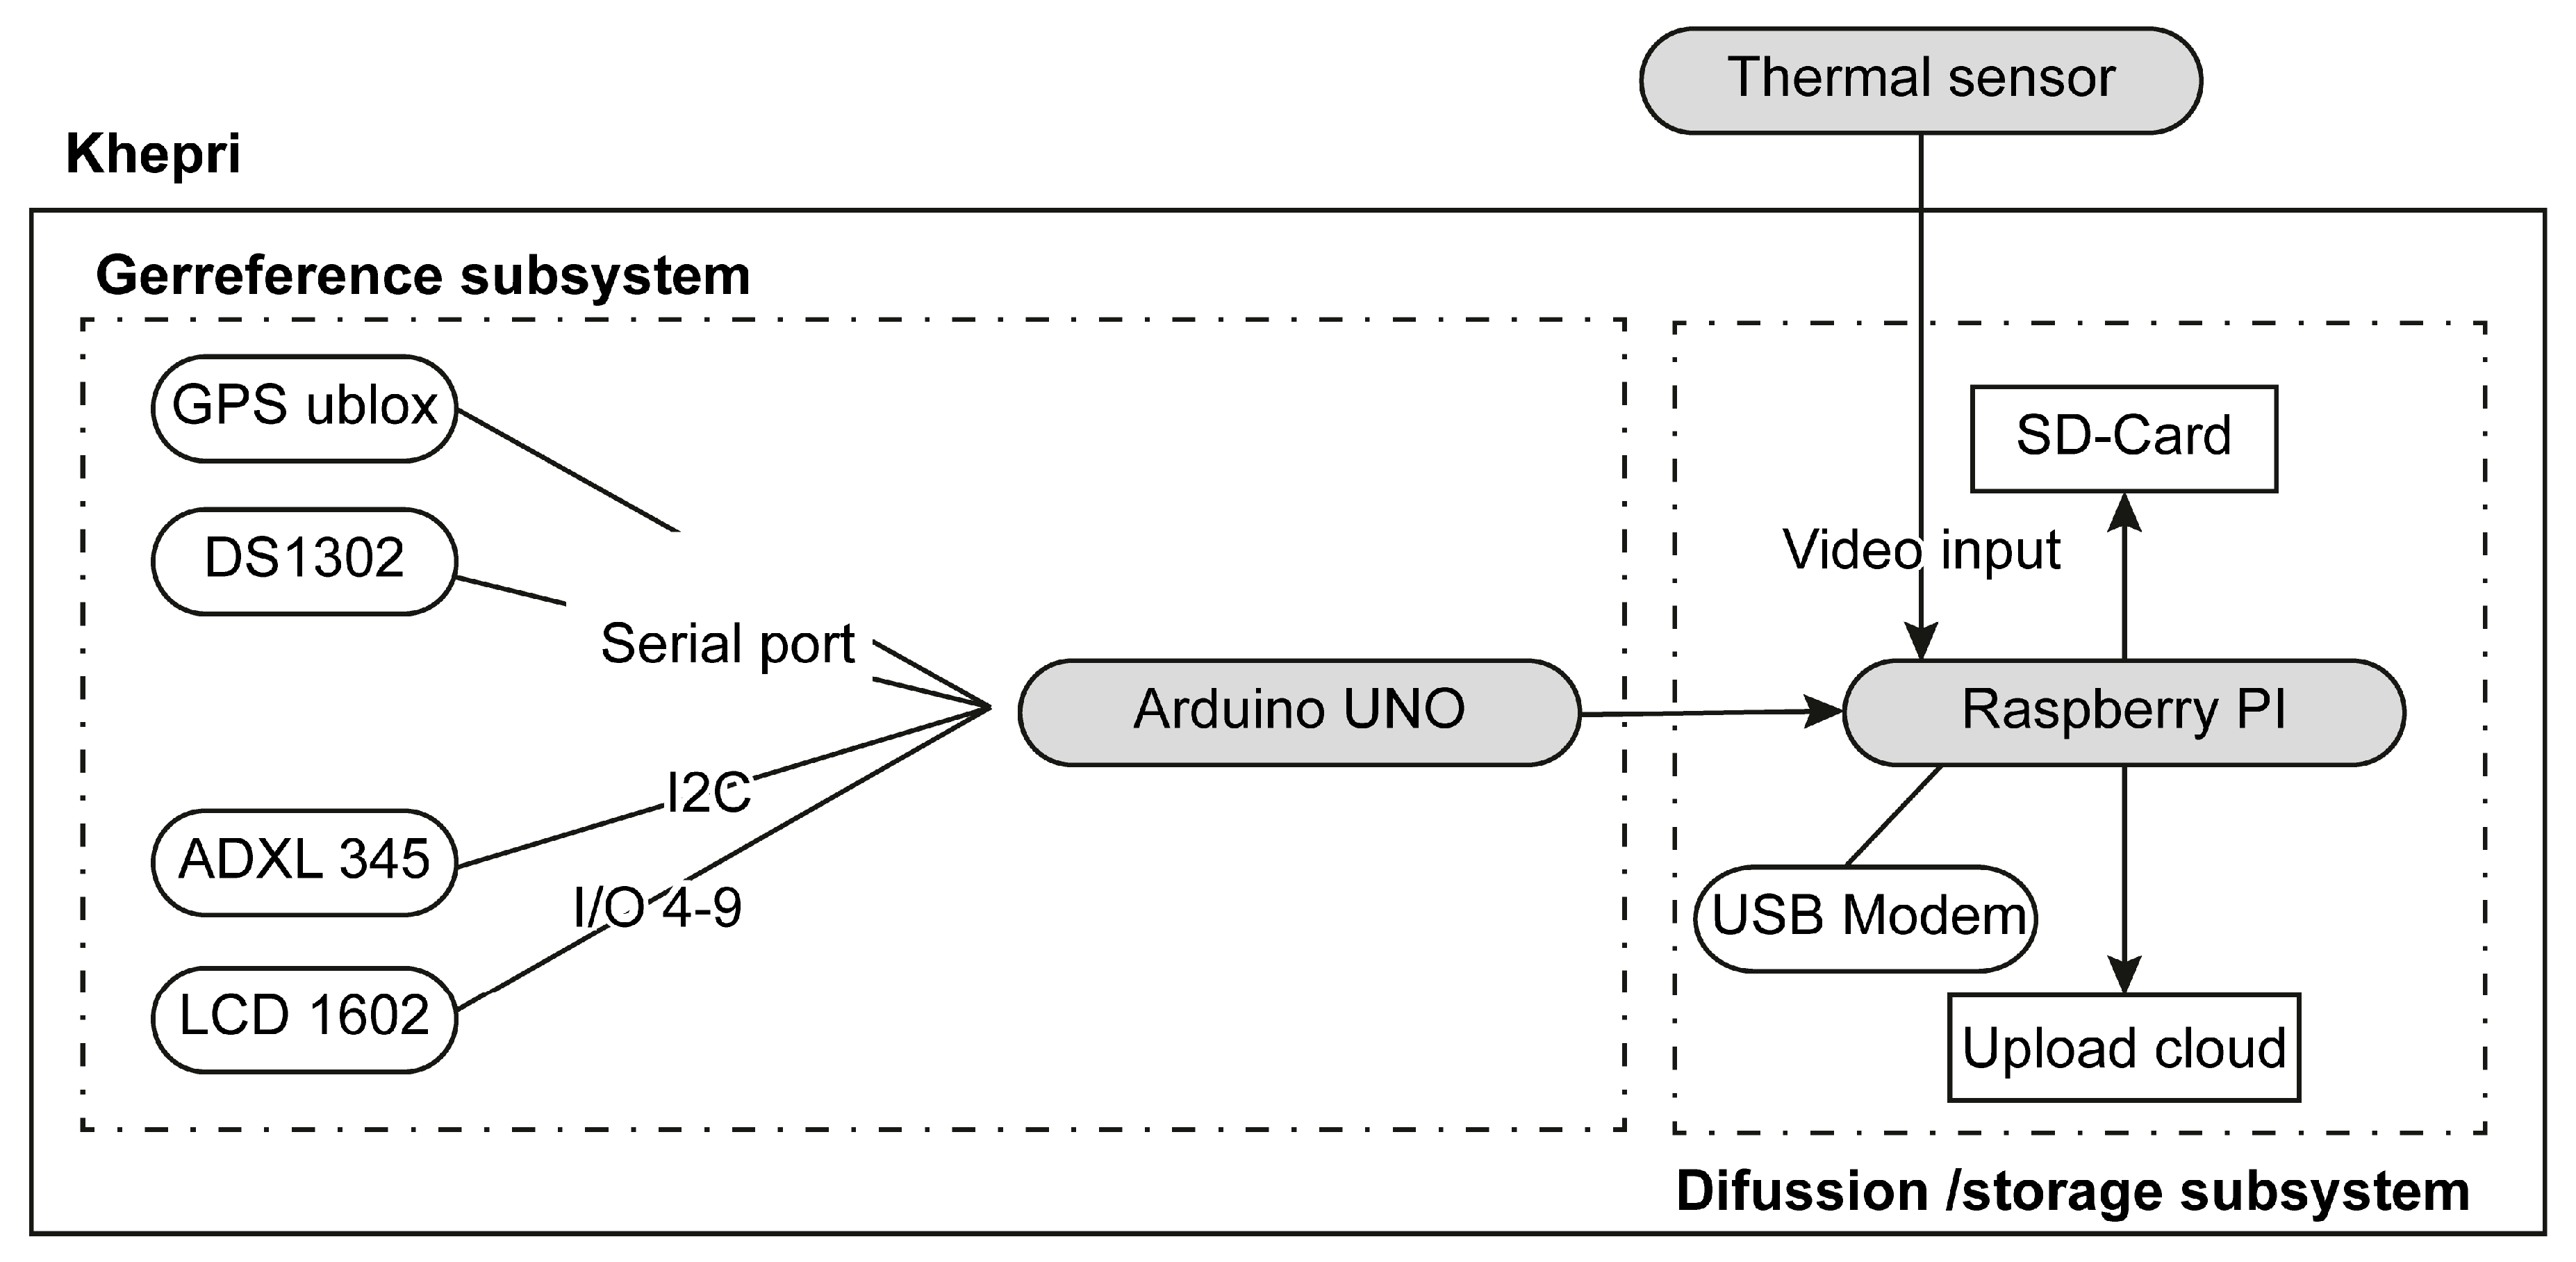
2.1. Selection of Sensors
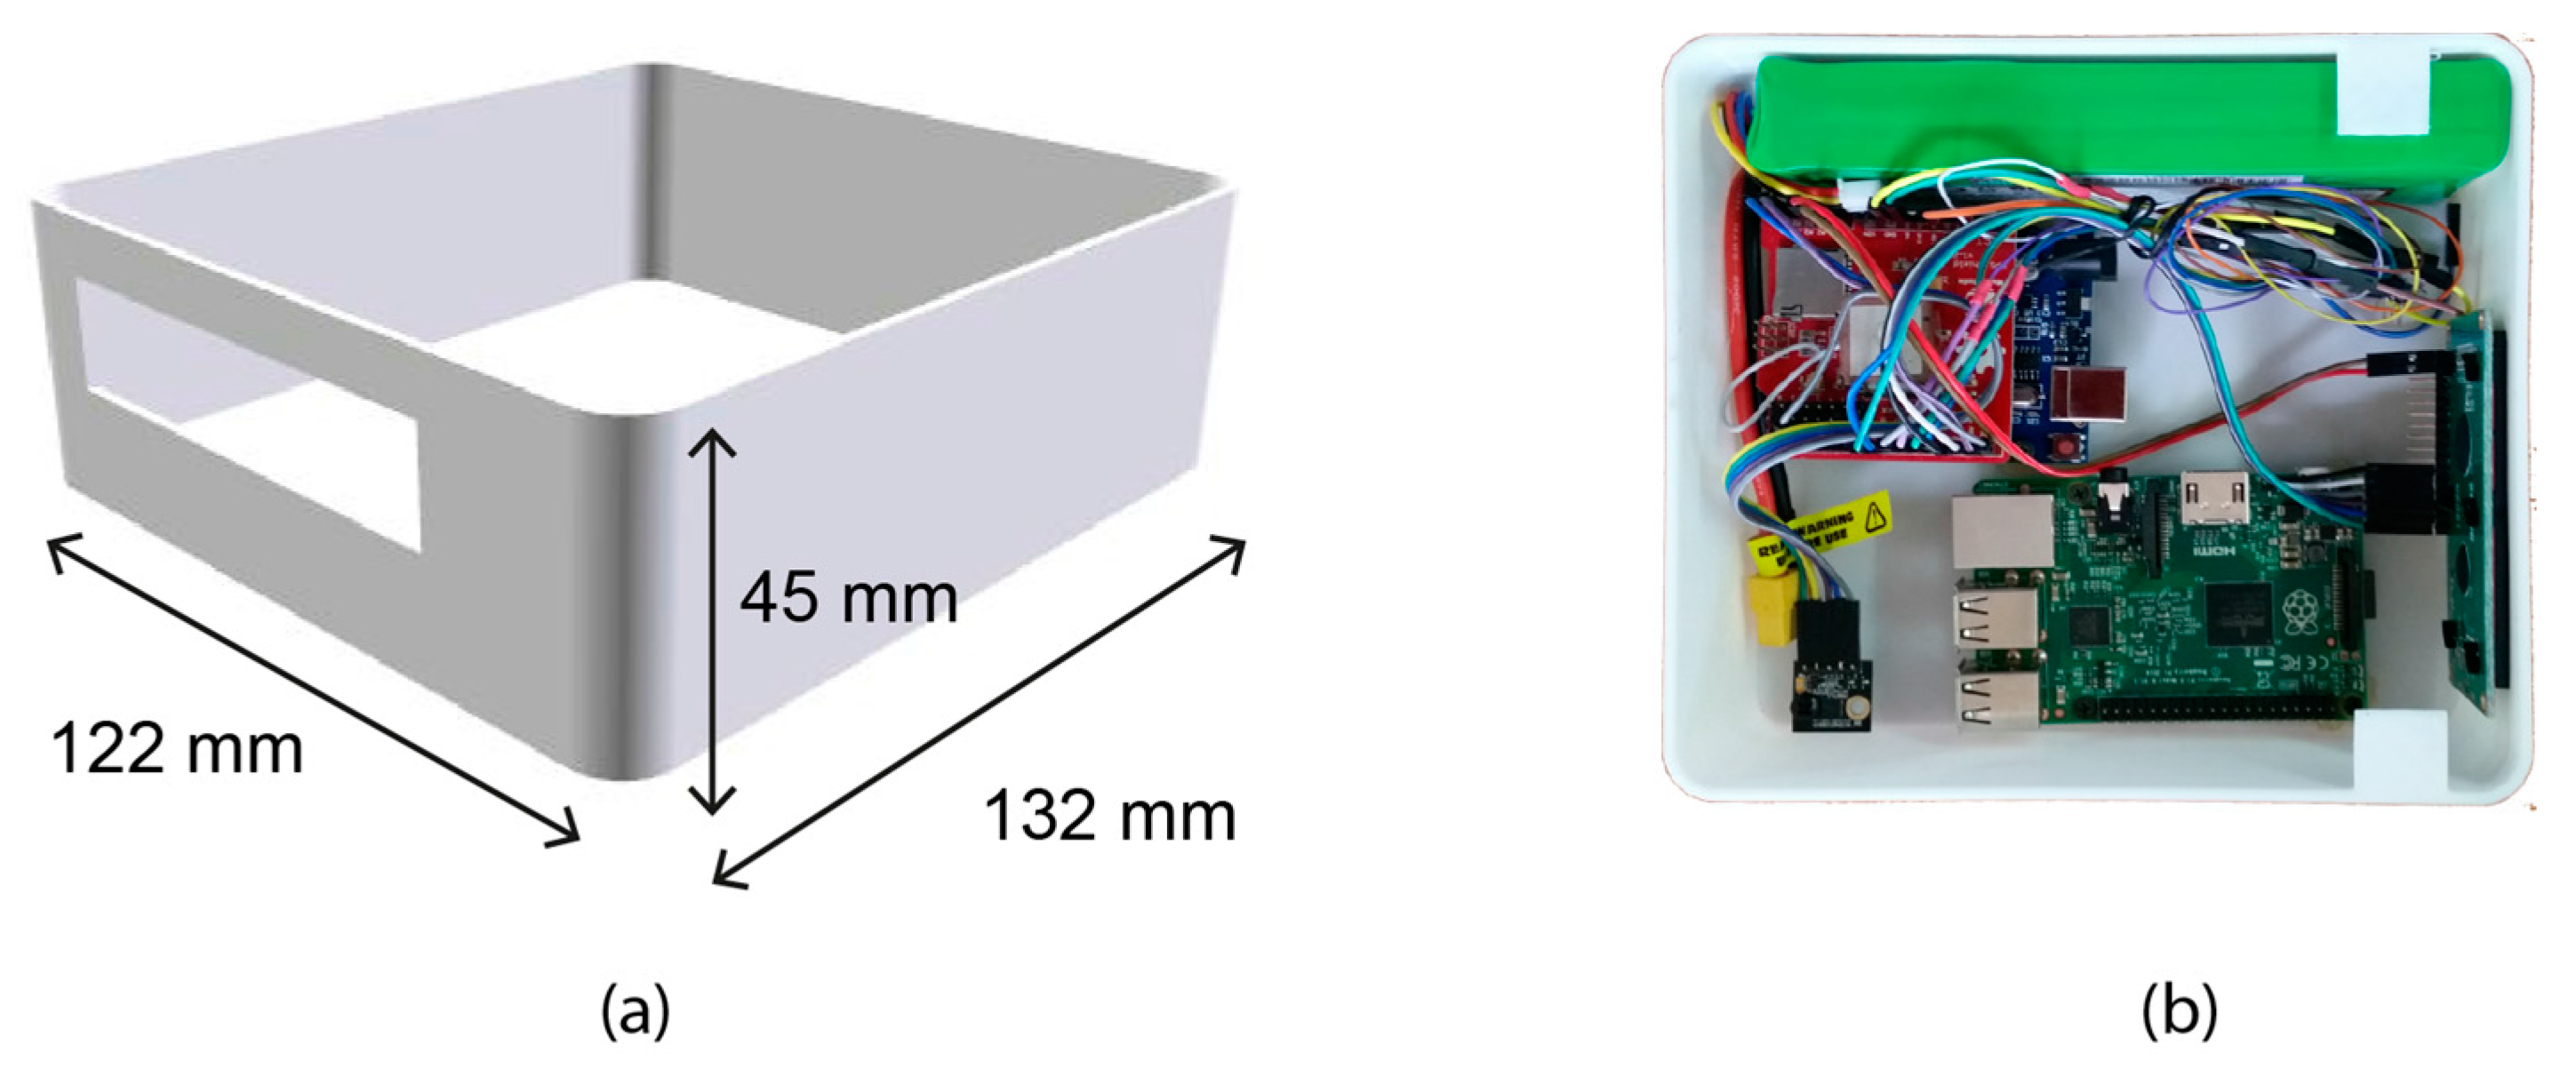
2.2. Technical Implementation
3. Results
4. Conclusions
Acknowledgments
Author Contributions
Conflicts of Interest
References
- Lewis, N.S.; Nocera, D.G. Powering the planet: Chemical challenges in solar energy utilization. Proc. Natl. Acad. Sci. USA 2006, 103, 15729–15735. [Google Scholar] [CrossRef] [PubMed]
- Devabhaktuni, V.; Alam, M.; Depuru, S.S.R.; Green II, R.C.; Nims, D.; Near, C. Solar energy: Trends and enabling technologies. Renew. Sustain. Energy Rev. 2013, 19, 555–564. [Google Scholar] [CrossRef]
- Bialasiewicz, J.T. Renewable energy systems with photovoltaic power generators: Operation and modeling. IEEE Trans. Ind. Electron. 2008, 55, 2752–2758. [Google Scholar] [CrossRef]
- Zhang, H.L.; Baeyens, J.; Degrève, J.; Cacères, G. Concentrated solar power plants: Review and design methodology. Renew. Sustain. Energy Rev. 2013, 22, 466–481. [Google Scholar] [CrossRef]
- Ho, C.K. A review of high-temperature particle receivers for concentrating solar power. Appl. Therm. Eng. 2016, 109, 958–969. [Google Scholar] [CrossRef]
- Papaelias, M.; Cheng, L.; Kogia, M.; Mohimi, A.; Kappatos, V.; Selcuk, C.; Constantinou, L.; Muñoz, C.Q.G.; Marquez, F.P.G.; Gan, T.-H. Inspection and structural health monitoring techniques for concentrated solar power plants. Renew. Energy 2016, 85, 1178–1191. [Google Scholar] [CrossRef]
- Morin, G.; Dersch, J.; Platzer, W.; Eck, M.; Häberle, A. Comparison of linear fresnel and parabolic trough collector power plants. Solar Energy 2012, 86, 1–12. [Google Scholar] [CrossRef]
- Fernández-García, A.; Zarza, E.; Valenzuela, L.; Pérez, M. Parabolic-trough solar collectors and their applications. Renew. Sustain. Energy Rev. 2010, 14, 1695–1721. [Google Scholar] [CrossRef]
- Almanza, R.; Lentz, A.; Jiménez, G. Receiver behavior in direct steam generation with parabolic troughs. Solar Energy 1997, 61, 275–278. [Google Scholar] [CrossRef]
- Reddy, K.S.; Kumar, K.R.; Satyanarayana, G.V. Numerical investigation of energy-efficient receiver for solar parabolic trough concentrator. Heat Transf. Eng. 2008, 29, 961–972. [Google Scholar] [CrossRef]
- Price, H.; Forristall, R.; Wendelin, T.; Lewandowski, A.; Moss, T.; Gummo, C. Field survey of parabolic trough receiver thermal performance. In Proceedings of the ASME 2006 International Solar Energy Conference, Denver, CO, USA, 8–13 June 2006; pp. 109–116. [Google Scholar]
- Yaghoubi, M.; Ahmadi, F.; Bandehee, M. Analysis of heat losses of absorber tubes of parabolic through collector of shiraz (iran) solar power plant. J. Clean Energy Technol. 2013, 1, 33–37. [Google Scholar] [CrossRef]
- Maurtua, I.; Susperregi, L.; Fernández, A.; Tubío, C.; Perez, C.; Rodríguez, J.; Felsch, T.; Ghrissi, M. Mainbot—Mobile robots for inspection and maintenance in extensive industrial plants. Energy Procedia 2014, 49, 1810–1819. [Google Scholar] [CrossRef]
- García-Cortés, S.; Bello-García, A.; Ordóñez, C. Estimating intercept factor of a parabolic solar trough collector with new supporting structure using off-the-shelf photogrammetric equipment. Appl. Energy 2012, 92, 815–821. [Google Scholar] [CrossRef]
- Pottler, K.; Ulmer, S.; Lüpfert, E.; Landmann, M.; Röger, M.; Prahl, C. Ensuring performance by geometric quality control and specifications for parabolic trough solar fields. Energy Procedia 2014, 49, 2170–2179. [Google Scholar] [CrossRef]
- Ibarguren, A.; Molina, J.; Susperregi, L.; Maurtua, I. Thermal tracking in mobile robots for leak inspection activities. Sensors 2013, 13, 13560–13574. [Google Scholar] [CrossRef] [PubMed]
- Abedini-Sanigy, M.H.; Ahmadi, F.; Goshtasbirad, E.; Yaghoubi, M. Thermal stress analysis of absorber tube for a parabolic collector under quasi-steady state condition. Energy Procedia 2015, 69, 3–13. [Google Scholar] [CrossRef]
- Van Blyenburgh, P. UAVs: An overview. Air Space Eur. 1999, 1, 43–47. [Google Scholar] [CrossRef]
- Zhang, C.; Kovacs, J.M. The application of small unmanned aerial systems for precision agriculture: A review. Precis. Agric. 2012, 13, 693–712. [Google Scholar] [CrossRef]
- Mesas-Carrascosa, F.-J.; Torres-Sánchez, J.; Clavero-Rumbao, I.; García-Ferrer, A.; Peña, J.-M.; Borra-Serrano, I.; López-Granados, F. Assessing optimal flight parameters for generating accurate multispectral orthomosaicks by UAV to support site-specific crop management. Remote Sens. 2015, 7, 12793–12814. [Google Scholar] [CrossRef]
- Mohammed, F.; Idries, A.; Mohamed, N.; Al-Jaroodi, J.; Jawhar, I. UAVs for smart cities: Opportunities and challenges. In Proceedings of the 2014 International Conference on Unmanned Aircraft Systems (ICUAS), Orlando, FL, USA, 27–30 May 2014; pp. 267–273. [Google Scholar]
- Xu, Z.; Wu, L.; Shen, Y.; Li, F.; Wang, Q.; Wang, R. Tridimensional reconstruction applied to cultural heritage with the use of camera-equipped UAV and terrestrial laser scanner. Remote Sens. 2014, 6, 10413–10434. [Google Scholar] [CrossRef]
- Mesas-Carrascosa, F.-J.; Notario García, M.D.; Meroño de Larriva, J.E.; García-Ferrer, A. An analysis of the influence of flight parameters in the generation of unmanned aerial vehicle (UAV) orthomosaicks to survey archaeological areas. Sensors 2016, 16, 1838. [Google Scholar] [CrossRef] [PubMed]
- Puri, A.; Valavanis, K.P.; Kontitsis, M. Statistical profile generation for traffic monitoring using real-time UAV based video data. In Proceedings of the 2007 Mediterranean Conference on Control & Automation, Athens, Greece, 27–29 June 2007; pp. 1–6. [Google Scholar]
- Kanistras, K.; Martins, G.; Rutherford, M.J.; Valavanis, K.P. Survey of unmanned aerial vehicles (UAVs) for traffic monitoring. In Handbook of Unmanned Aerial Vehicles; Valavanis, K.P., Vachtsevanos, G.J., Eds.; Springer: Dordrecht, The Netherlands, 2015; pp. 2643–2666. [Google Scholar]
- Máthé, K.; Buşoniu, L. Vision and control for UAVs: A survey of general methods and of inexpensive platforms for infrastructure inspection. Sensors 2015, 15, 14887–14916. [Google Scholar] [CrossRef] [PubMed]
- Montambault, S.; Beaudry, J.; Toussaint, K.; Pouliot, N. On the application of vtol UAVs to the inspection of power utility assets. In Proceedings of the 2010 1st International Conference on Applied Robotics for the Power Industry, Montreal, QC, Canada, 5–7 October 2010; pp. 1–7. [Google Scholar]
- Jones, D. Power line inspection—A UAV concept. In Proceedings of the 2005 The IEE Forum on Autonomous Systems, London, UK, 28–28 November 2005; p. 8. [Google Scholar]
- Hausamann, D.; Zirnig, W.; Schreier, G.; Strobl, P. Monitoring of gas pipelines—A civil UAV application. Aircr. Eng. Aerosp. Technol. 2005, 77, 352–360. [Google Scholar] [CrossRef]
- Grimaccia, F.; Aghaei, M.; Mussetta, M.; Leva, S.; Quater, P.B. Planning for PV plant performance monitoring by means of unmanned aerial systems (UAS). Int. J. Energy Environ. Eng. 2015, 6, 47–54. [Google Scholar] [CrossRef]
- Rossi, M.; Brunelli, D.; Adami, A.; Lorenzelli, L.; Menna, F.; Remondino, F. Gas-drone: Portable gas sensing system on UAVs for gas leakage localization. In Proceedings of the IEEE SENSORS 2014 Proceedings, Valencia, Spain, 2–5 November 2014; pp. 1431–1434. [Google Scholar]
- Mesas-Carrascosa, F.J.; Verdú Santano, D.; Meroño, J.E.; Sánchez de la Orden, M.; García-Ferrer, A. Open source hardware to monitor environmental parameters in precision agriculture. Biosyst. Eng. 2015, 137, 73–83. [Google Scholar] [CrossRef]
- Leira, F.S.; Trnka, K.; Fossen, T.I.; Johansen, T.A. A ligth-weight thermal camera payload with georeferencing capabilities for small fixed-wing UAVs. In Proceedings of the 2015 International Conference on Unmanned Aircraft Systems (ICUAS), Denver, CO, USA, 9–12 June 2015; pp. 485–494. [Google Scholar]
- Bologna, F.; Mahatho, N.; Hoch, D.A. Infra-red and ultra-violet imaging techniques applied to the inspection of outdoor transmission voltage insulators. In Proceedings of the IEEE AFRICON. 6th Africon Conference in Africa, George, South Africa, 2–4 October 2002; Volume 592, pp. 593–598. [Google Scholar]
- Kockara, S.; Halic, T.; Hudson, C.; Loney, A.; Crawford, A. Portable malignant lesion detection with low cost mobile infrared thermography. In Proceedings of the 2014 IEEE Innovations in Technology Conference, Warwick, RI, USA, 16–16 May 2014; pp. 1–5. [Google Scholar]
- Faugel, H.; Bobkov, V. Open source hard- and software: Using Arduino boards to keep old hardware running. Fusion Eng. Des. 2013, 88, 1276–1279. [Google Scholar] [CrossRef]
- Bitella, G.; Rossi, R.; Bochicchio, R.; Perniola, M.; Amato, M. A novel low-cost open-hardware platform for monitoring soil water content and multiple soil-air-vegetation parameters. Sensors 2014, 14, 19639–19659. [Google Scholar] [CrossRef] [PubMed]
- Di Gennaro, S.F.; Matese, A.; Mancin, M.; Primicerio, J.; Palliotti, A. An open-source and low-cost monitoring system for precision enology. Sensors 2014, 14, 23388–23397. [Google Scholar] [CrossRef] [PubMed]
- Mesas-Carrascosa, F.J.; Verdú Santano, D.; Meroño de Larriva, J.E.; Ortíz Cordero, R.; Hidalgo Fernández, R.E.; García-Ferrer, A. Monitoring heritage buildings with open source hardware sensors: A case study of the mosque-cathedral of córdoba. Sensors 2016, 16, 1620. [Google Scholar] [CrossRef] [PubMed]
- Grinias, J.P.; Whitfield, J.T.; Guetschow, E.D.; Kennedy, R.T. An inexpensive, open-source usb arduino data acquisition device for chemical instrumentation. J. Chem. Educ. 2016, 93, 1316–1319. [Google Scholar] [CrossRef] [PubMed]
- Doneus, M.; Wieser, M.; Verhoeven, G.; Karel, W.; Fera, M.; Pfeifer, N. Automated archiving of archaeological aerial images. Remote Sens. 2016, 8, 209. [Google Scholar] [CrossRef]
- Sun, J.; Li, B.; Jiang, Y.; Wen, C.-Y. A camera-based target detection and positioning UAV system for search and rescue (SAR) purposes. Sensors 2016, 16, 1778. [Google Scholar] [CrossRef] [PubMed]
- Sørensen, L.Y.; Jacobsen, L.T.; Hansen, J.P. Low cost and flexible UAV deployment of sensors. Sensors 2017, 17, 154. [Google Scholar] [CrossRef] [PubMed]
- Raspberry Pi 2 Model B Datasheet. Available online: https://www.raspberrypi.org/products/raspberry-pi-2-model-b/ (accessed on 16 February 2017).
- Arduino Uno R3 Datasheet. Available online: https://www.arduino.cc/en/Main/ArduinoBoardUno (accessed on 16 February 2017).
- Ublox Neo-6m Datasheet. Available online: https://www.u-blox.com/sites/default/files/products/documents/NEO-6_DataSheet_%28GPS.G6-HW-09005%29.pdf?utm_source=en%2Fimages%2Fdownloads%2FProduct_Docs%2FNEO-6_DataSheet_%28GPS.G6-HW-09005%29.pdf (accessed on 16 February 2017).
- Accelerometer Adxl 345 Datasheet. Available online: http://www.analog.com/media/en/technical-documentation/data-sheets/ADXL345.pdf (accessed 17 February 2017).
- Ds1302 Clock Datasheet. Available online: https://datasheets.maximintegrated.com/en/ds/DS1302.pdf (accessed on 17 February 2017).
- Lcd Screen 1602 Datasheet. Available online: https://cdn-shop.adafruit.com/datasheets/TC1602A-01T.pdf (accessed on 17 February 2017).
- Udell, J. Beginning Google Maps Mashups with Mapplets, KML, and Georss: From Novice to Professional; Apress: New York, NY, USA, 2008. [Google Scholar]
- Crickard, P. Leaflet.js Essentials; Packt Publishing Ltd.: Birmingham, UK, 2014; p. 165. [Google Scholar]
- Iacovella, S. Geoserver Cookbook; Packt Publishing Ltd.: Birmingham, UK, 2014. [Google Scholar]
- Taro, S.; Daichi, M.; Jun-ichi, M.; Yoshiharu, A.; Takumi, H.; Koich, S.; Jun-ich, T. Real-time hazard map generation using small unmanned aerial vehicle. In Proceedings of the 2008 SICE Annual Conference, Tokyo, Japan, 20–22 August 2008; pp. 443–446. [Google Scholar]
- Chen, Y.M.; Dong, L.; Oh, J.S. Real-time video relay for UAV traffic surveillance systems through available communication networks. In Proceedings of the 2007 IEEE Wireless Communications and Networking Conference, Kowloon, China, 11–15 March 2007; pp. 2608–2612. [Google Scholar]
- Chen, J.; Fei, Q.; Geng, Q. The design of data link for multi-UAVs. In Proceedings of the 2012 4th International Conference on Intelligent Human-Machine Systems and Cybernetics, Nanchang, China, 26–27 August 2012; pp. 106–109. [Google Scholar]
- Barcia, L.A.; Peón Menéndez, R.; Martínez Esteban, J.Á.; José Prieto, M.A.; Martín Ramos, J.A.; de Cos Juez, F.J.; Nevado Reviriego, A. Dynamic modeling of the solar field in parabolic trough solar power plants. Energies 2015, 8, 13361–13377. [Google Scholar] [CrossRef]


| Title 1 | Weight (gr) | Dimension (mm) |
|---|---|---|
| Raspberry Pi 2 Model B | 45 | 85.6 × 56.5 |
| Arduino UNO R3 | 25 | 68.6 × 53.4 |
| GPS Shield ublox NEO-6M | 32 | 61.4 × 53.3 × 16 |
| Accelerometer ADXL 345 | 5 | 3 × 5 × 1 |
| DS1302 clock | 10 | 9.91 × 7.87 × 4.45 |
| Modem USB | 24 | 88 × 28 × 10 |
| LCD Screen 1602 | 50 | 80 × 36 × 13.5 |
| Lipo Battery | 79 | 125 × 7 × 21 |
| UAV Inspection Time (Hours) | ||||
|---|---|---|---|---|
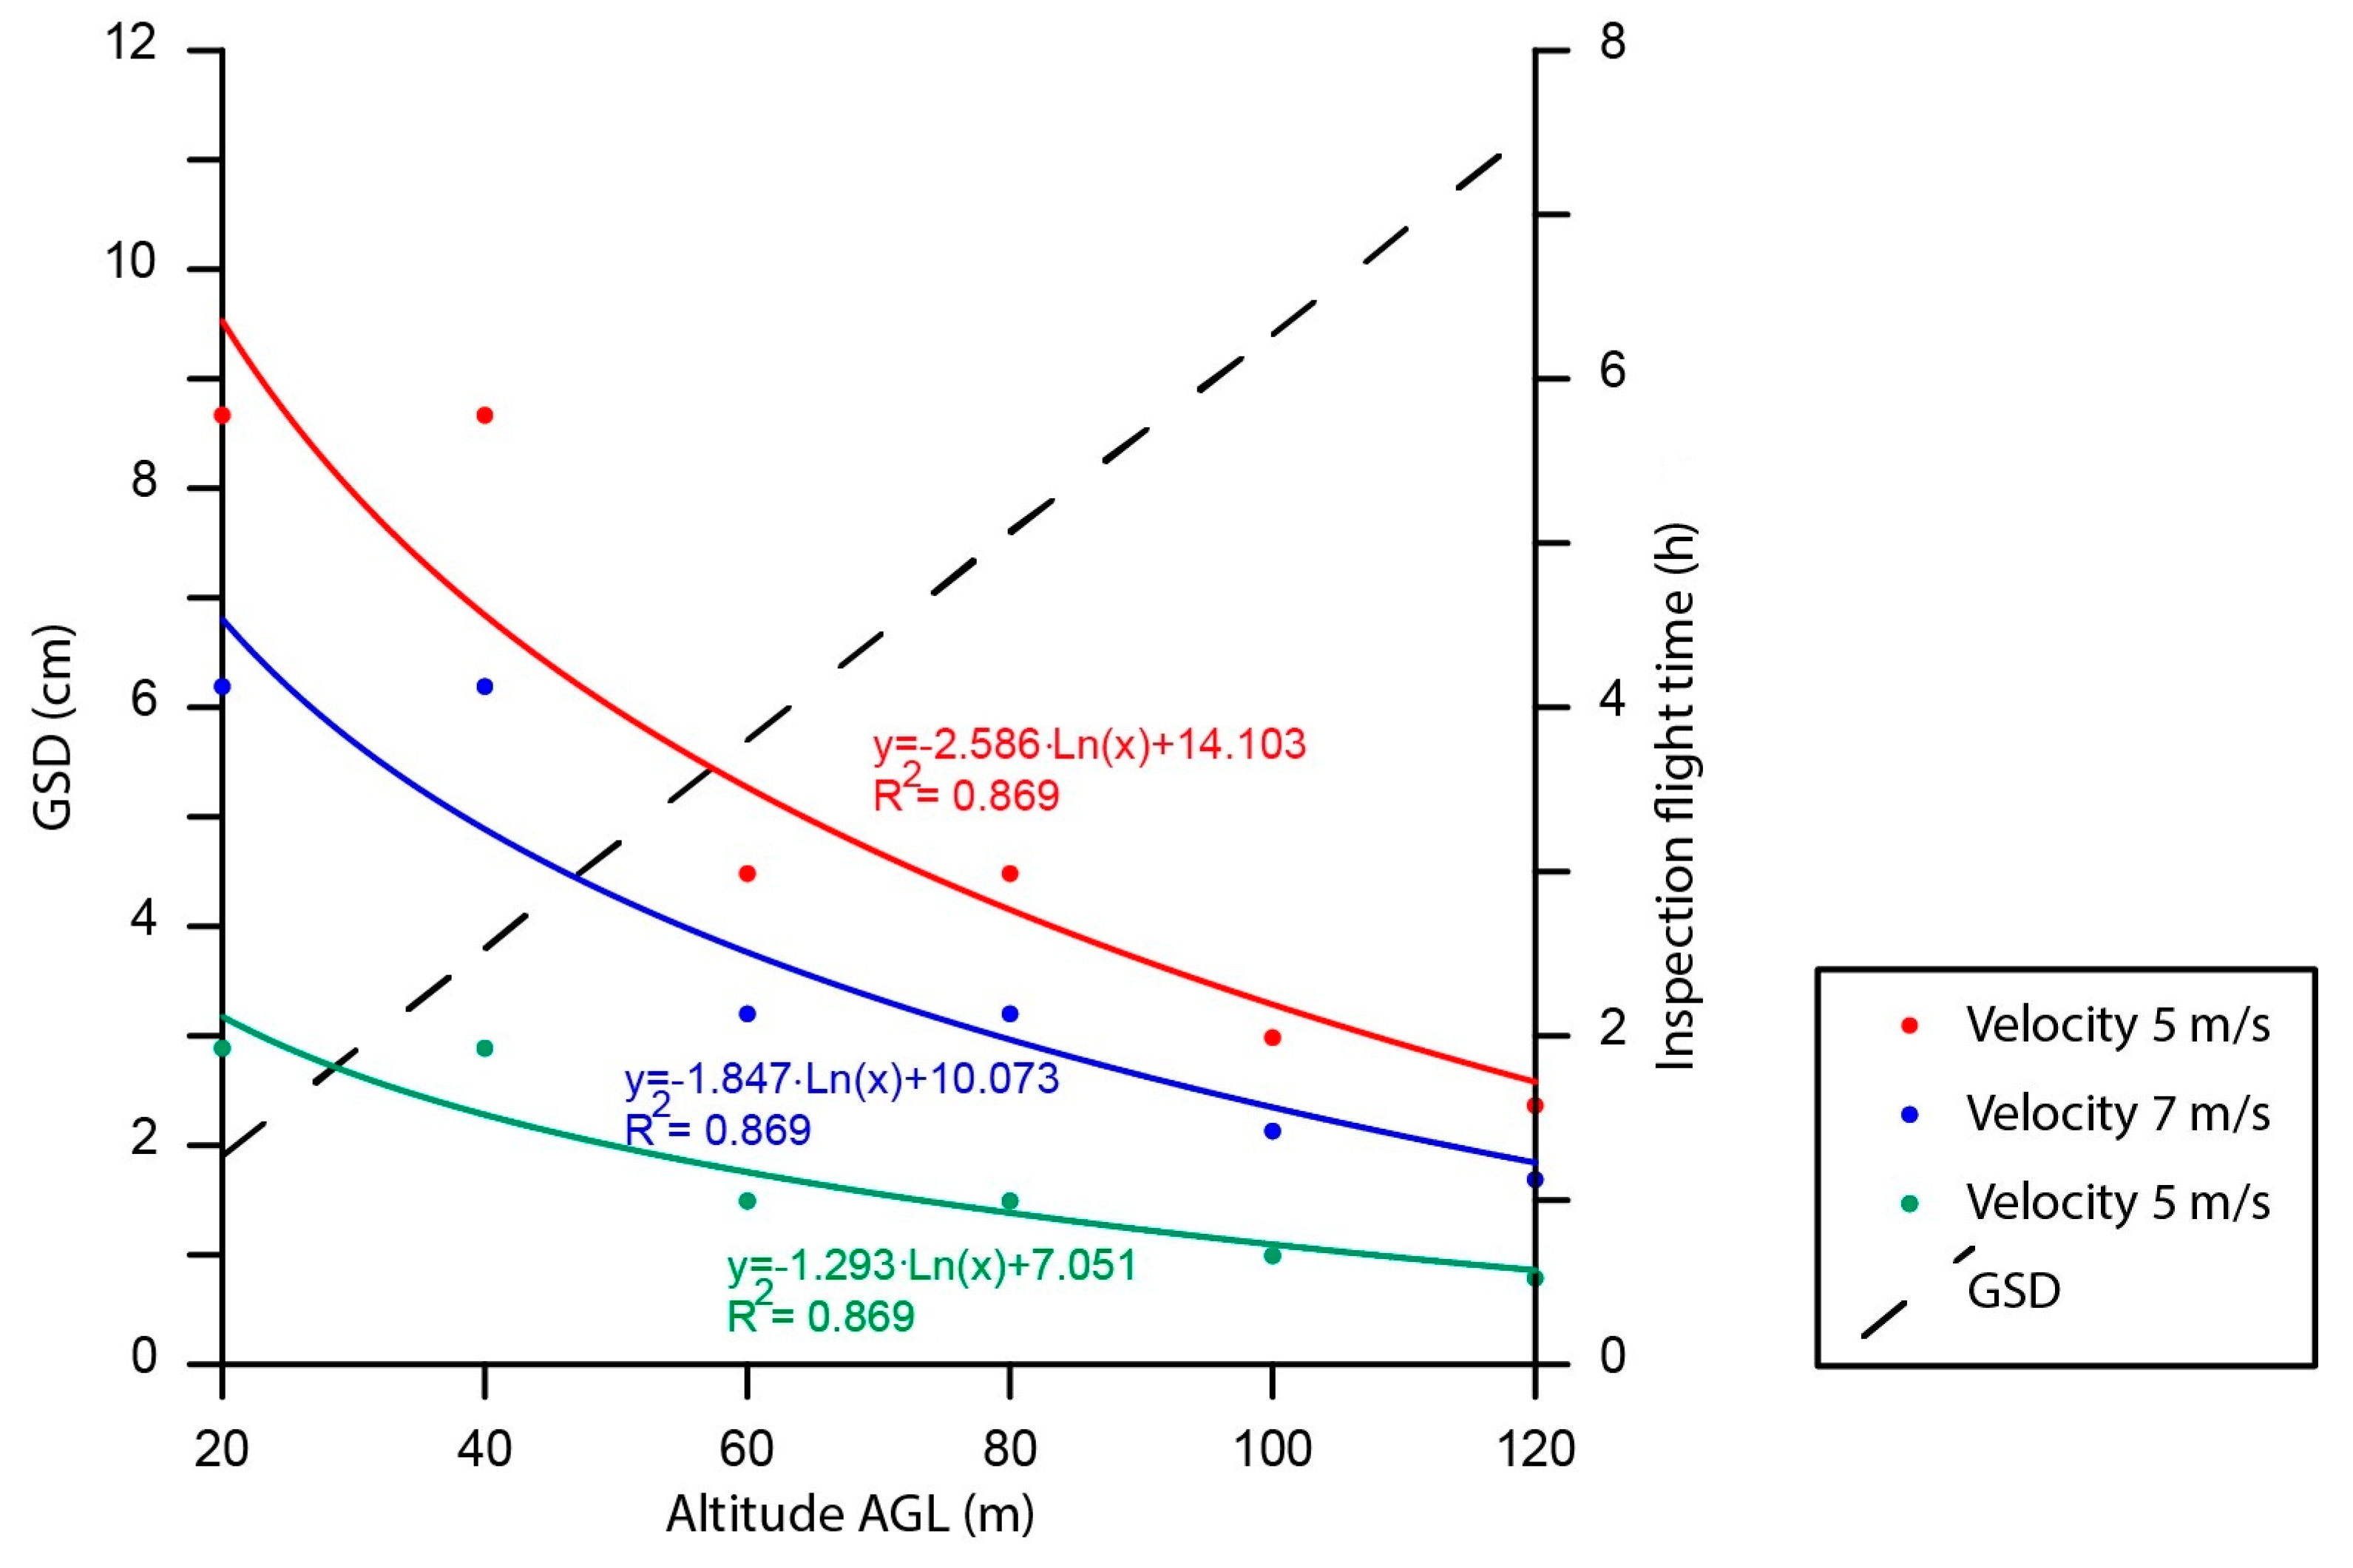
| Altitude AGL 1 (m) | GSD 2 (cm) | 5 m/s | 7 m/s | 10 m/s |
| 20 | 1.9 | 5.8 | 4.1 | 2.9 |
| 40 | 3.8 | 5.8 | 4.1 | 2.9 |
| 60 | 5.7 | 3.0 | 2.1 | 1.5 |
| 80 | 7.6 | 3.0 | 2.1 | 1.5 |
| 100 | 9.4 | 2.0 | 1.4 | 1.0 |
| 120 | 11.3 | 1.6 | 1.1 | 0.8 |
| Altitude AGL (m) | 5 m/s (%) | 7 m/s (%) | 10 m/s (%) |
|---|---|---|---|
| 20 | 85.6 | 89.7 | 92.8 |
| 40 | 85.6 | 89.7 | 92.8 |
| 60 | 92.5 | 94.7 | 96.3 |
| 80 | 92.5 | 94.7 | 96.3 |
| 100 | 95.0 | 96.4 | 97.5 |
| 120 | 96.1 | 97.2 | 98.0 |
© 2017 by the authors. Licensee MDPI, Basel, Switzerland. This article is an open access article distributed under the terms and conditions of the Creative Commons Attribution (CC BY) license (http://creativecommons.org/licenses/by/4.0/).
Share and Cite
Mesas-Carrascosa, F.J.; Verdú Santano, D.; Pérez Porras, F.; Meroño-Larriva, J.E.; García-Ferrer, A. The Development of an Open Hardware and Software System Onboard Unmanned Aerial Vehicles to Monitor Concentrated Solar Power Plants. Sensors 2017, 17, 1329. https://doi.org/10.3390/s17061329
Mesas-Carrascosa FJ, Verdú Santano D, Pérez Porras F, Meroño-Larriva JE, García-Ferrer A. The Development of an Open Hardware and Software System Onboard Unmanned Aerial Vehicles to Monitor Concentrated Solar Power Plants. Sensors. 2017; 17(6):1329. https://doi.org/10.3390/s17061329
Chicago/Turabian StyleMesas-Carrascosa, Francisco Javier, Daniel Verdú Santano, Fernando Pérez Porras, José Emilio Meroño-Larriva, and Alfonso García-Ferrer. 2017. "The Development of an Open Hardware and Software System Onboard Unmanned Aerial Vehicles to Monitor Concentrated Solar Power Plants" Sensors 17, no. 6: 1329. https://doi.org/10.3390/s17061329