1. Introduction
Nowadays, with the advancement of modern communication technology, the demand for spectrum resources is growing heavily. Authorized users are suffering from heavy interference caused by other users sharing the same spectrum. Cognitive radio (CR) is regarded as a promising technology which can fully use the spectrum by dynamically accessing the currently unused licensed spectrum [
1]. In this technology, obviously, spectrum sensing is a crucial task, which requires not only high reliability and short sensing time but also the ability to sense a wide bandwidth. Customarily, there are three common spectrum sensing techniques [
2,
3,
4]. The first approach is called matched filter which requires a prior knowledge of the primary users signaling features such as bandwidth, operating frequency, modulation type, pulse shaping and so on. However, these are usually infeasible to acquire in practice. The second is energy detector, it is the most common way of spectrum sensing owing to its low computation and implementation complexities. However, its sensing accuracy is highly susceptible to noise uncertainty and becomes unacceptable when the signal-to-noise-ratio (SNR) is pretty low. The third one is cyclostationary feature detector. Although this way is quite robust to both noise uncertainty and strong noise, it still takes a long time due to high computational complexities. Besides, all the approaches mentioned above apply to the narrow band signals or low frequency field.
When it comes to wideband spectrum, in [
5], two possible ways are discussed. One is to divide the whole wideband spectrum into lots of narrow band channels and then we can carry out the above sensing approaches channel-by-channel. Similarly, this approach introduces a big time delay and a significant amount of bandpass filters because of its serial process. Another approach is to directly sample the entire wideband spectrum using a high-rate analog-to-digital converter (ADC). However, under Nyquist sampling framework, such high sampling rate may exceed today’s best ADCs performance. What is more, this will generate a large number of samples to process, affecting speed and power consumption.
Many studies have been performed to overcome this bottleneck. In [
6], Landau developed a minimal sampling rate requirement that allows perfect reconstruction as early as 1967. Unfortunately, the article did not point out a feasible method of implementation when the carrier frequencies are unknown. The recent theory of compressed sensing (CS) [
7,
8], indicates that if the signal has a sparse representation in some space, we can linearly transform the signal to a lower-dimension space from which the signals can be recovered without any distortion. In this strategy, the sampling rate is no longer determined by the highest frequency of the signal, but decided by its valid information. Based on this, a number of CS structures have been proposed for sub-Nyquist sampling of continuous-time signals in recent years. Such as random demodulation (RD), Multi-coset sampling, modulated wideband converter (MWC) and so on [
9,
10,
11,
12]. However, the RD system can only treat the multi-tone signal model. In reality, the analog signals require a extremely large number of harmonics to approximate them well within the discrete model, which may cause the reconstruction computationally infeasible. Multi-coset sampling system has a good performance of the multiband signal. However, this scheme is fairly hard to implement because maintaining accurate time shifts, on the order of the Nyquist interval, is extremely difficult to design and realize. Lately, Mishali et al. proposed MWC sampling structure. Through a series of processing steps on a special analog front-end, the signal can be reconstructed from low rate samples, using the known relation between samples and the original signal. It is the most striking structure and can be realized by commercial components. Whereas, the amount of sampling channels can become very large when the sparsity is great [
13]. Its high hardware complexity is unacceptable for a single node the in the application of CR. Besides, the synchronization of each parallel channel is difficult to guarantee.
However, considering our ultimate goal is spectrum sensing and detection, there is no need to reconstruct the original signal. Consistent with the idea presented in [
5,
14], we plan to sense the power spectrum of the interested bandwidth from sub-Nyquist samples. Meanwhile, in order to simplify the hardware complexity, we intend to explore a more succinct architecture. In our previous work [
15], we first proposed a single channel modulated wideband converter for power spectrum sensing and reconstruction with some expressions and simulations. However, in order to apply in CR system, parament selections, prototype design as well as algorithm modification need further research.
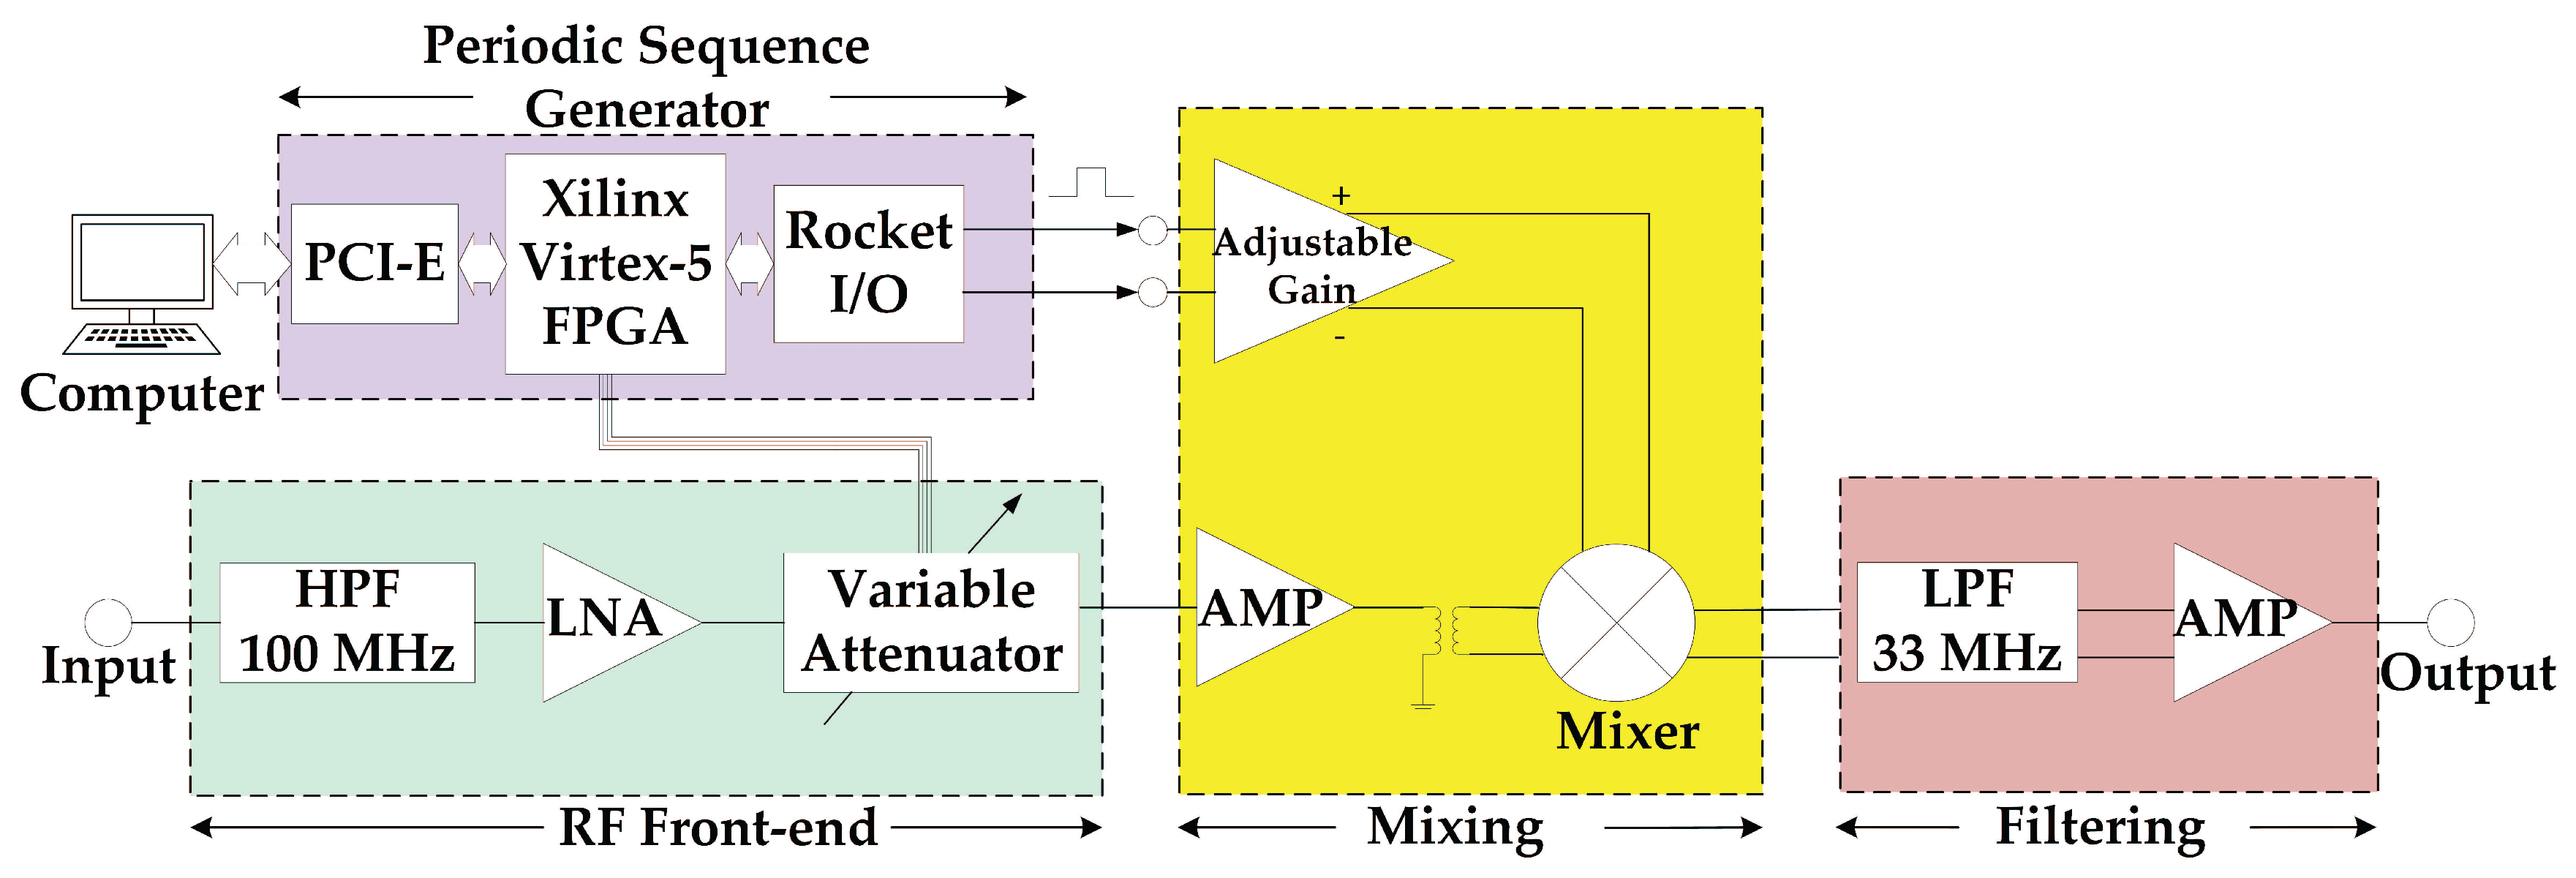
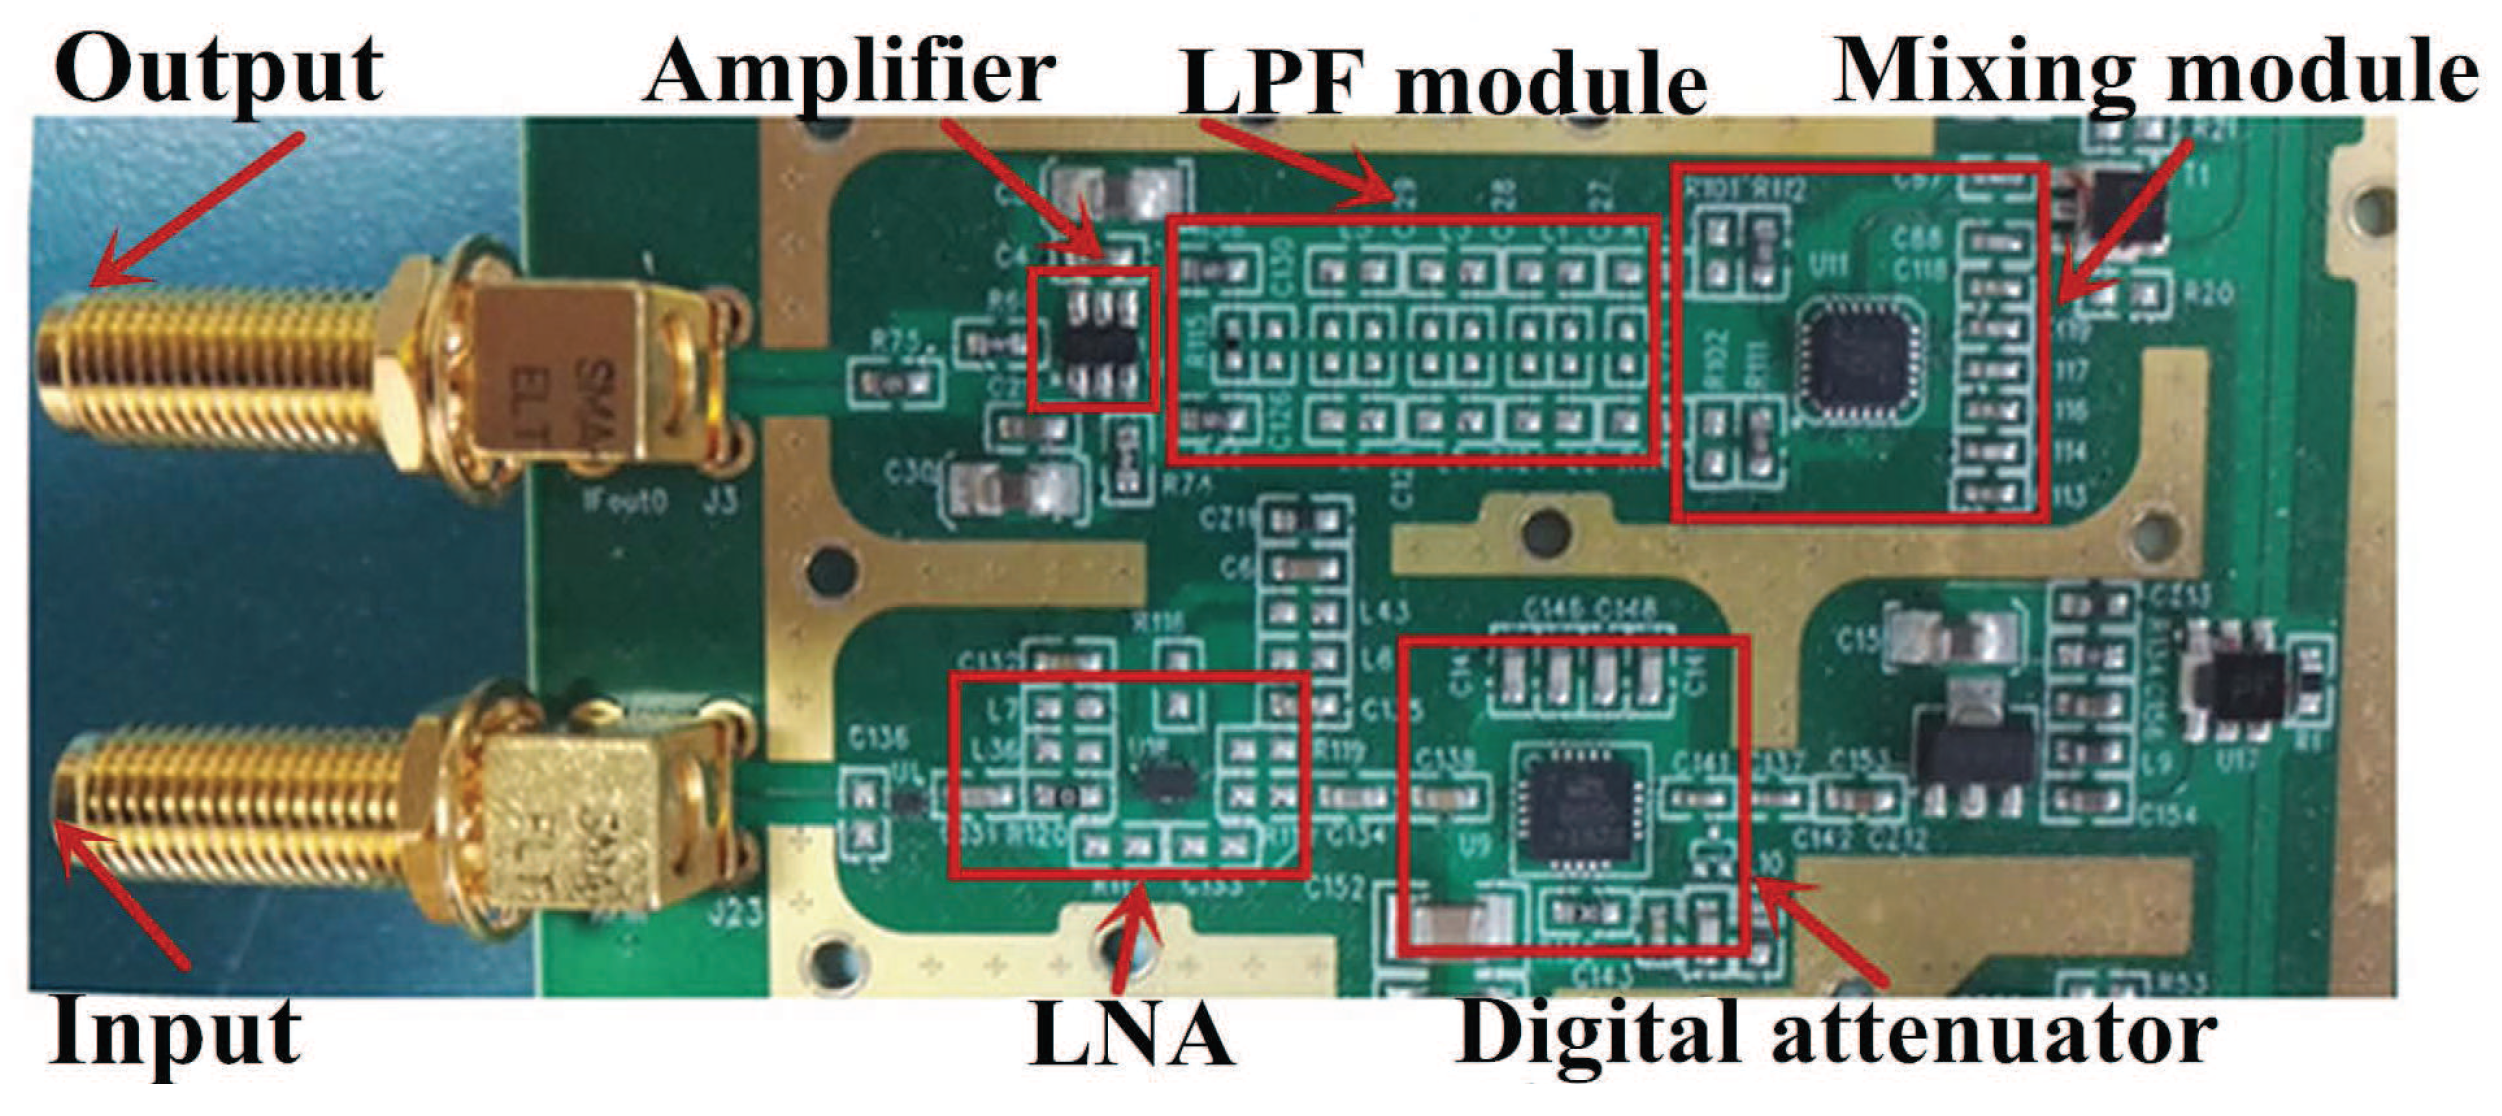
In this paper, a new spectrum sensing hardware prototype based on single channel modulated wideband converter (SCMWC) was designed and tested by actual circuits. It has the ability to treat analog multiband models as well as MWC. More importantly, practical implementation, low hardware complexity and low computational load make it possible to be used for CR system. Our main contribution of this paper is in proving feasibility of the SCMWC strategy using commercial devices. In detail, it can be divided into two parts. The first one is that we design and implement a hardware prototype based on SCMWC scheme. The proposed SCMWC hardware prototype only consists of one modulator, low-pass filter (LPF) and low rate ADC. Particularly, we introduce Rocket I/O on FPGA to generate high speed periodic sequences. By using this, the implementing process is simplified. The second one is that a series of simulations and experiments are conducted to acquire the proper parameters as well as evaluate the performance of the hardware prototype. Results show that our design can treat 2 GHz Nyquist-rate input signals with spectrum occupancy up to 15 MHz. And the total equivalent sampling rate is only 70 MHz, which is only of the Nyquist rate. Besides, the high dynamic range and low complexity make it more suitable for being applied to CR system.
The rest of this paper is organized as follows.
Section 2 describes the spectrum sensing model. Then the architecture of SCMWC is presented and analyzed in
Section 3. This leads to a parameter selection which guarantees successful sensing from the digital samples.
Section 4 detailed describes the design methods and exact specs of the proposed circuit board. In
Section 5, we present the some simulations and experiments based on our prototype. Besides, comparisons with related work are discussed. Finally,
Section 6 concludes the paper.
2. Spectrum Sensing Model
Now we consider a CR system which is in a hot-spot area, several studies [
14,
16] have shown that across a wide spectrum range, the spectrum can be expressed as a union of some narrow-band transmissions. Our main ambition is to find out the signal support, which means the bands of the signal sources reside. In other words, we intend to sense the spectrum of the current situation at sub-Nyquist rates.
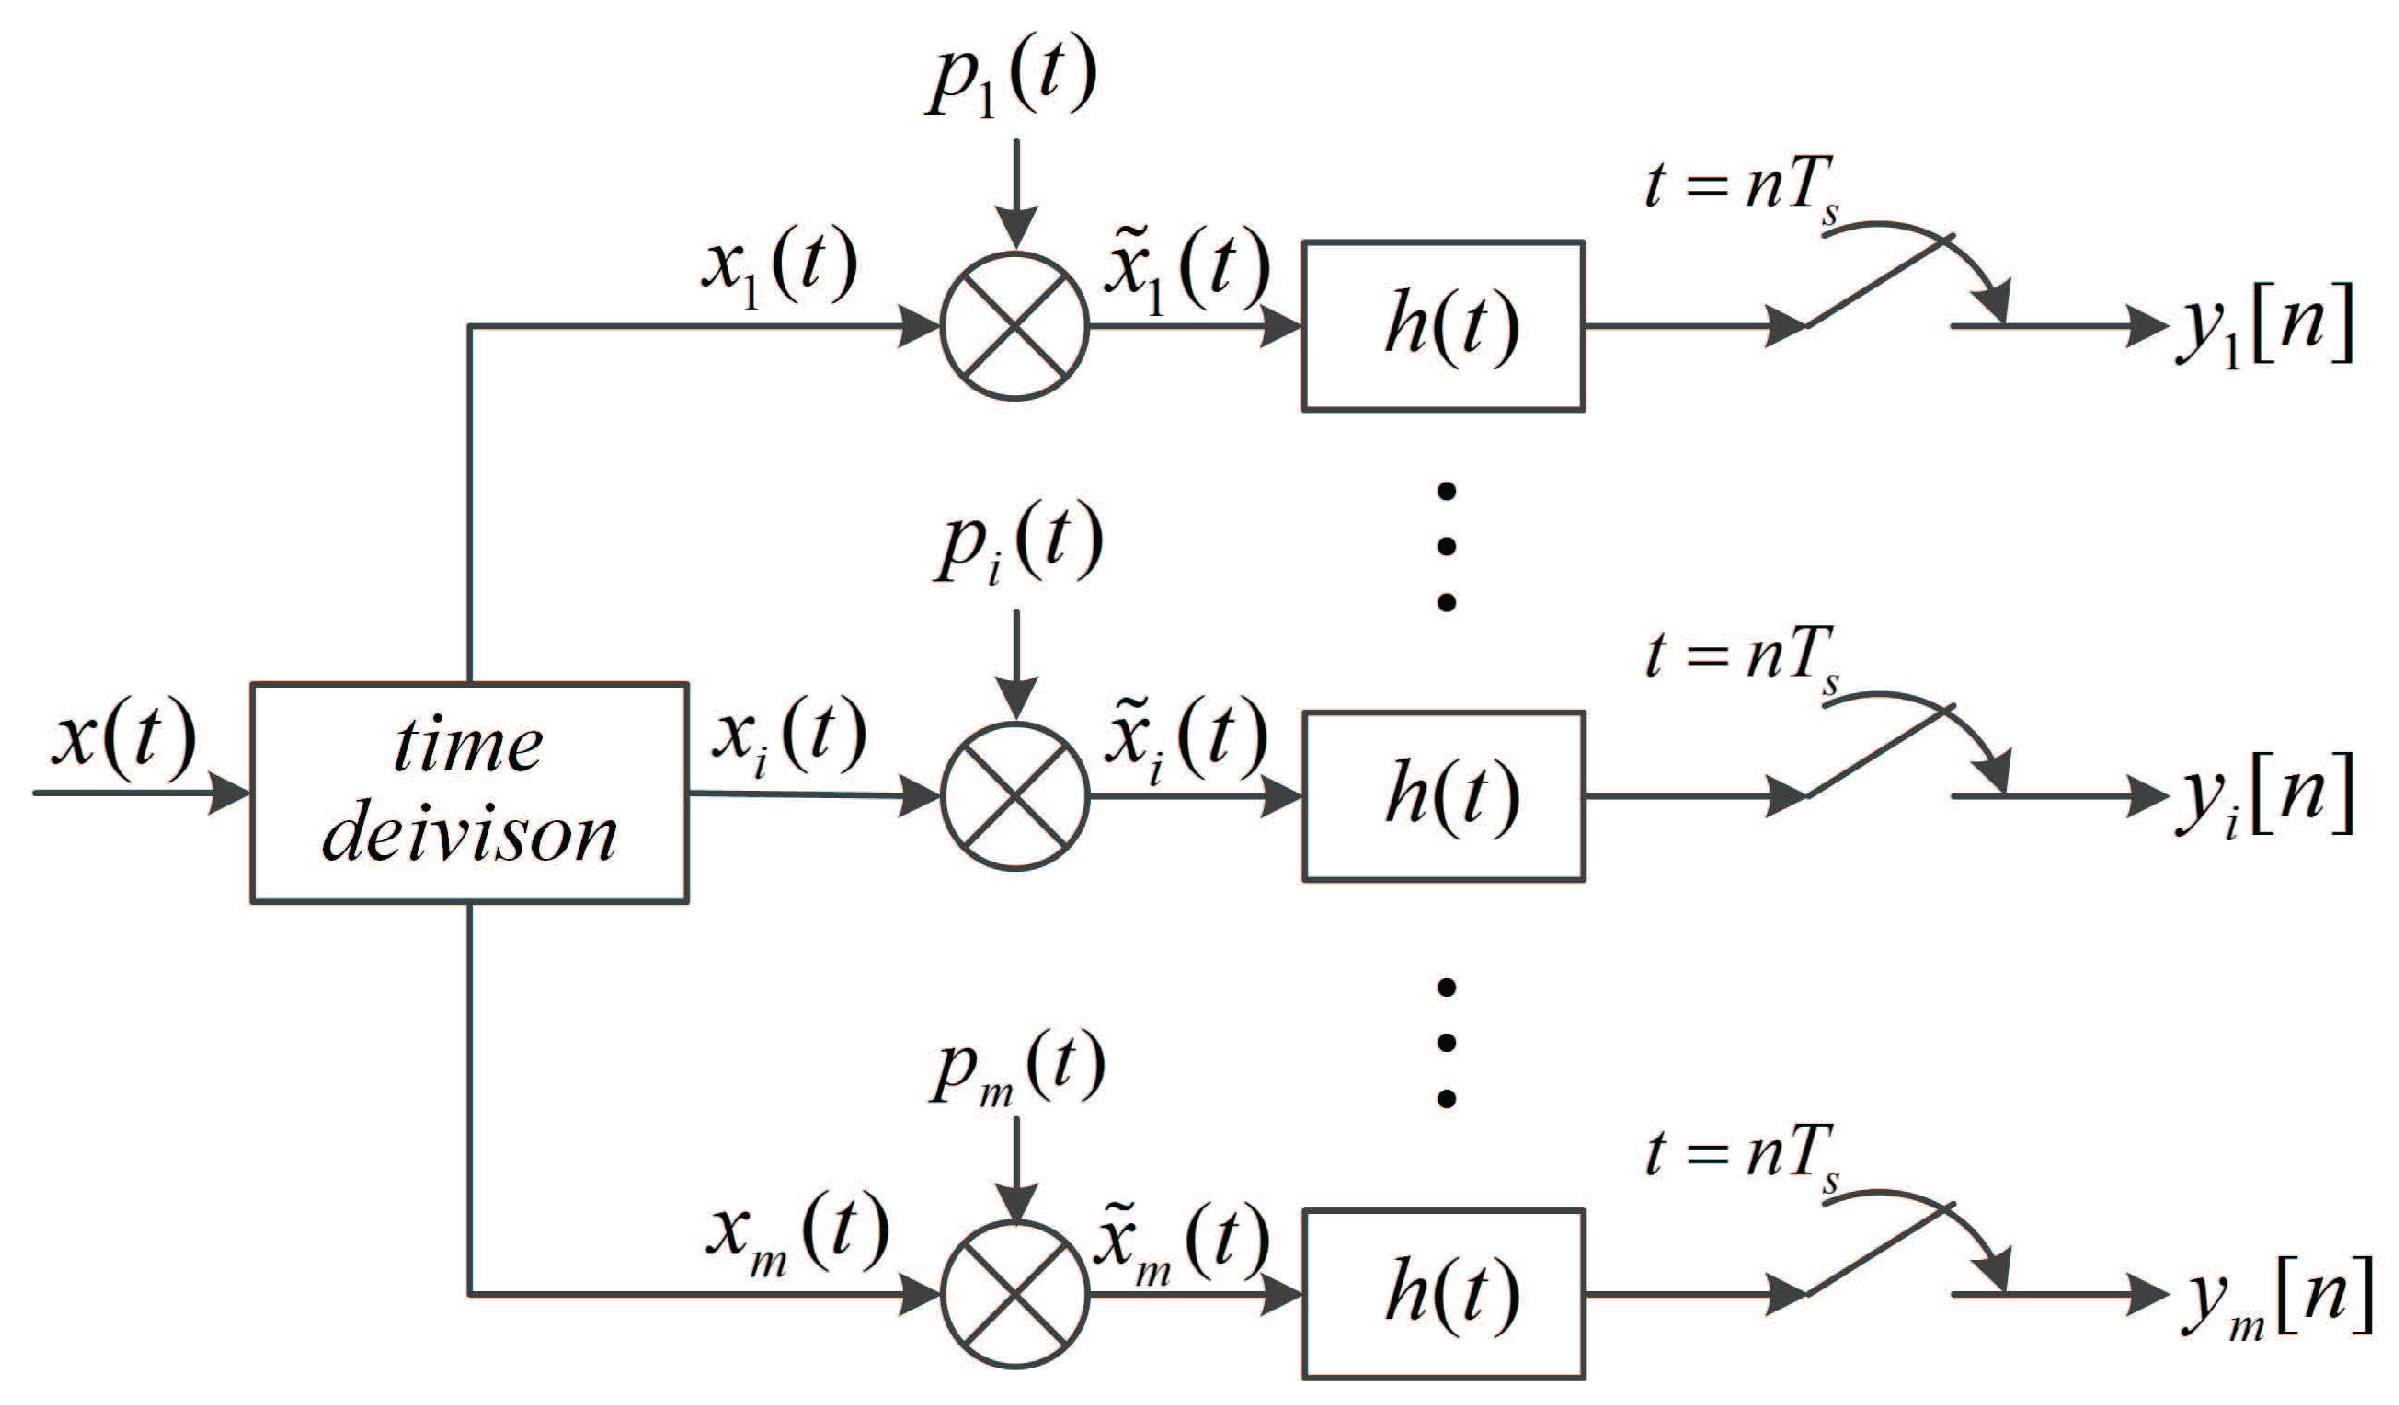
Suppose that the received signal from one spectrum sensor
consists of
uncorrelated stationary transmissions, which can be formulated like this
Here, is a zero-mean bandlimited wide-sense stationary (WSS) signal, and indicates that whether the ith signal is active or not.
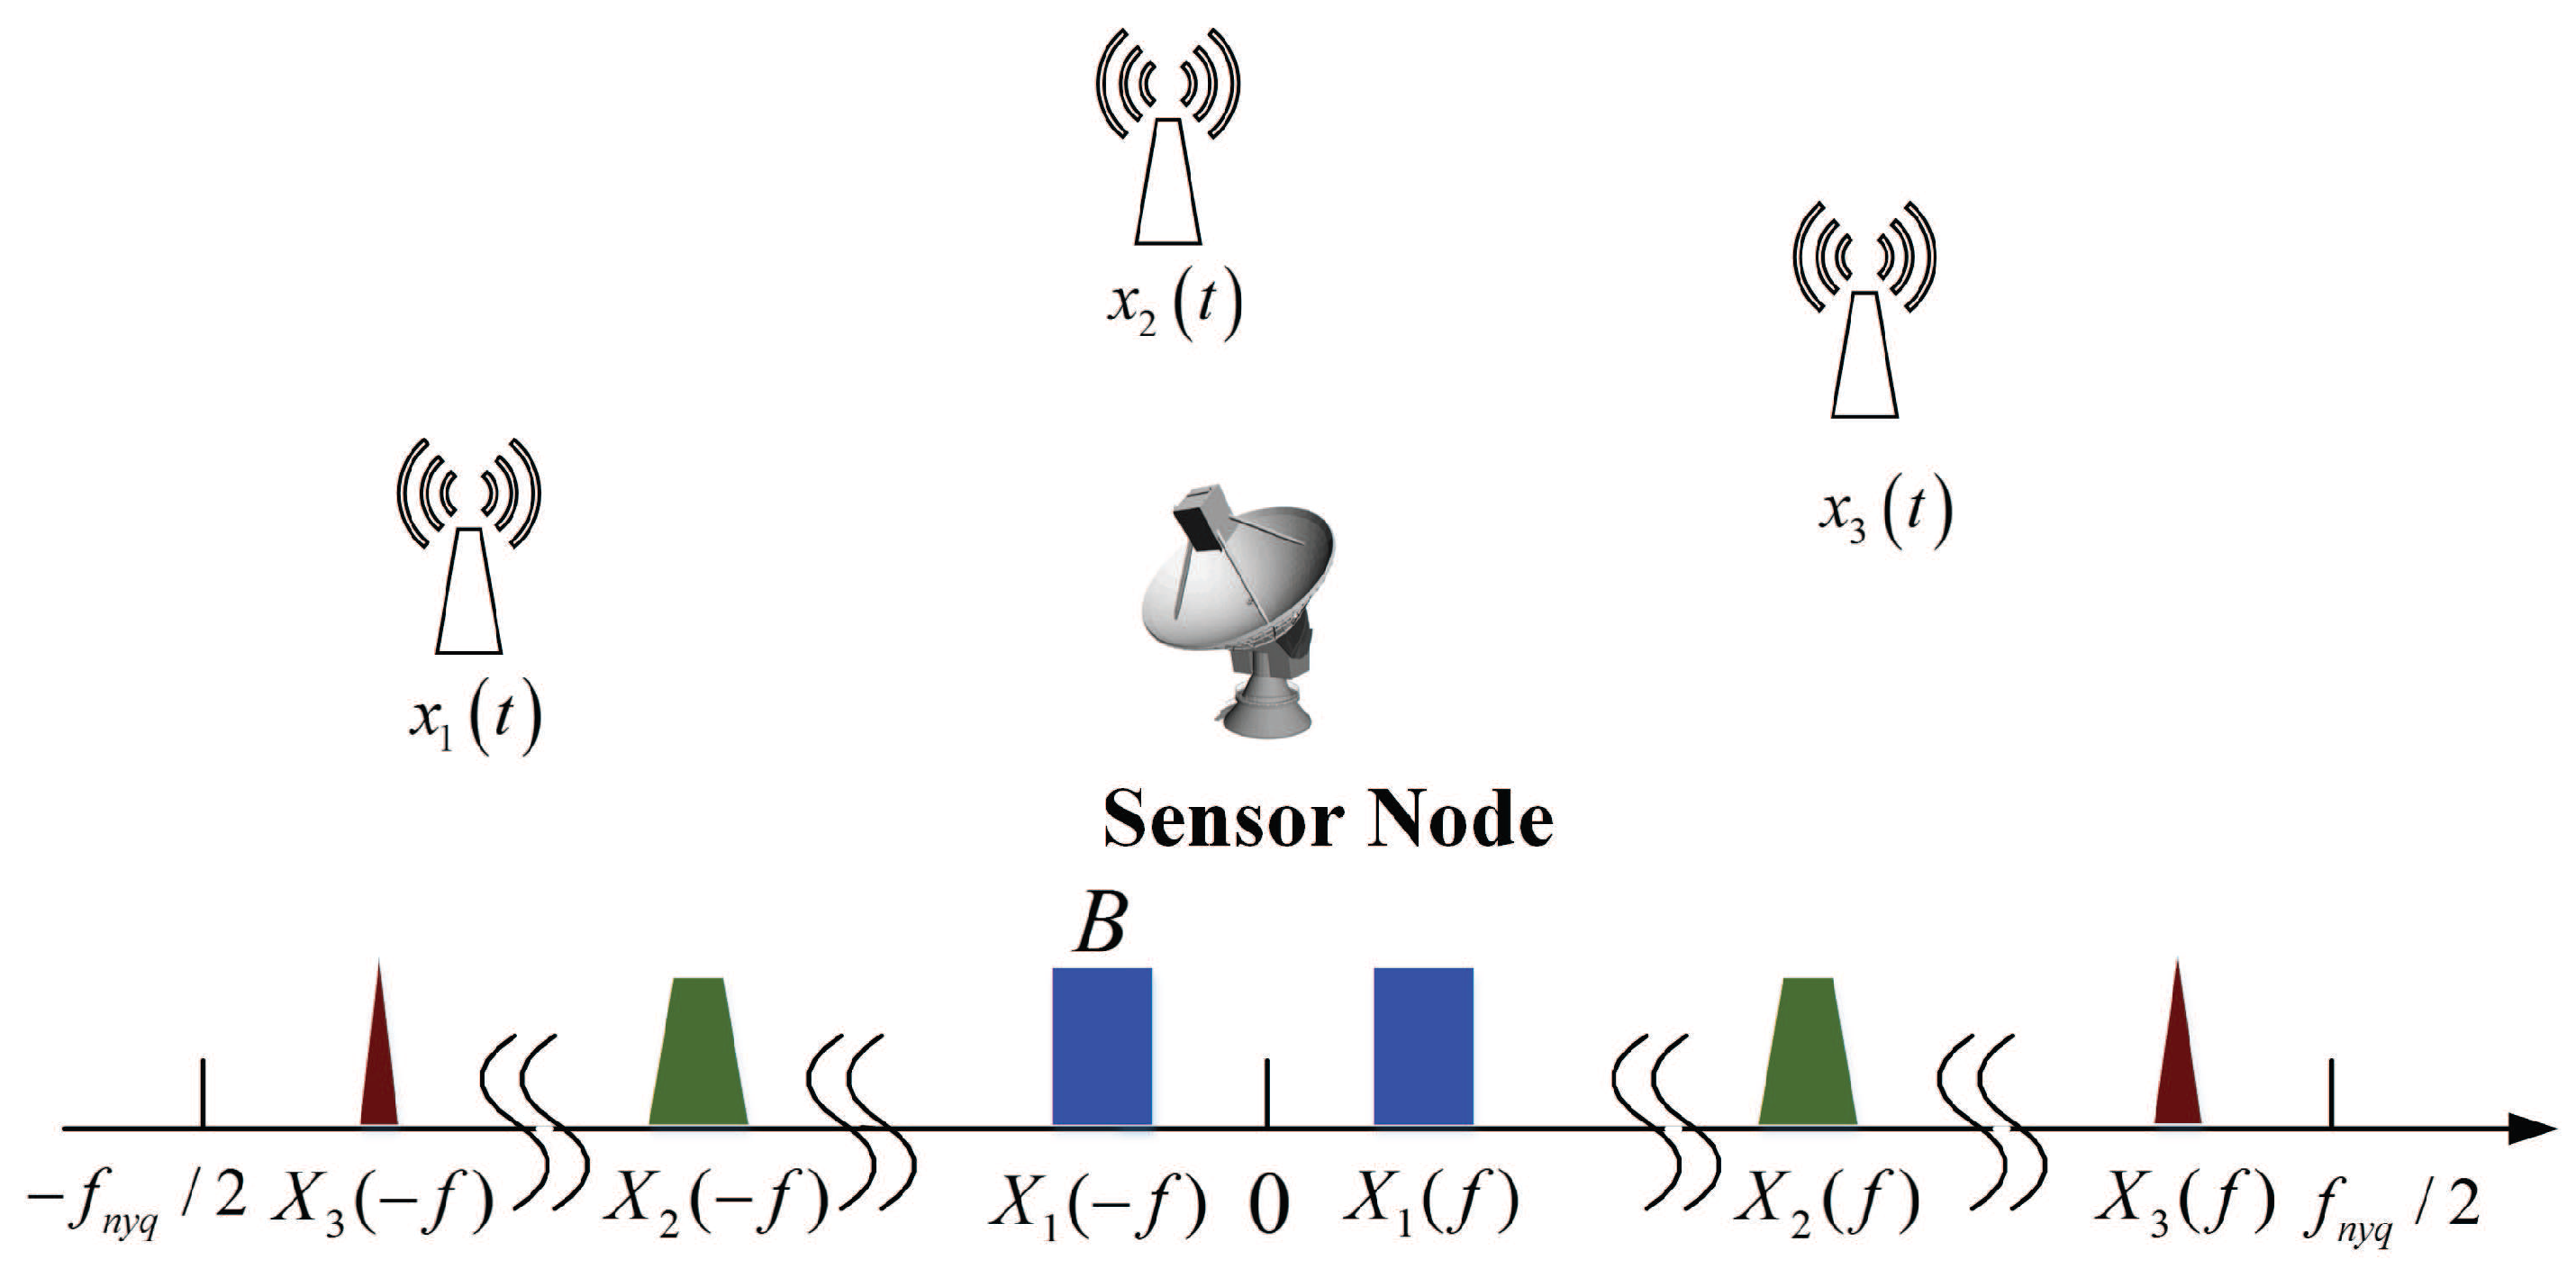
Figure 1 depicts a typical single node spectrum sensing model and spectrum support of a multiband signal. There are three RF transmissions with different carriers
over the whole spectrum. The Fourier transform of
is expressed by
.
denotes the Nyquist rate of
and
is the support of the Fourier transform
. As is assumed in [
11], we consider the same scenario: we have no prior knowledge on the carrier frequencies of the spectrally sparse continuous-time signal
of finite support on
, and we suppose that the maximal number of signals is
with maximal bandwidth
B. We can see that the support
is contained within a union of
disjoint bands in
.
It is well known that the power spectrum of
is given by
where
represents the autocorrelation function of
and
denotes the expectation operation. From Equation (
2), we can see that estimating the power spectrum equals to estimating the autocorrelation function
. Obviously,
has the same support with
. So sensing the spectrum changes into estimating the power spectrum.
5. Experiments and Discussions
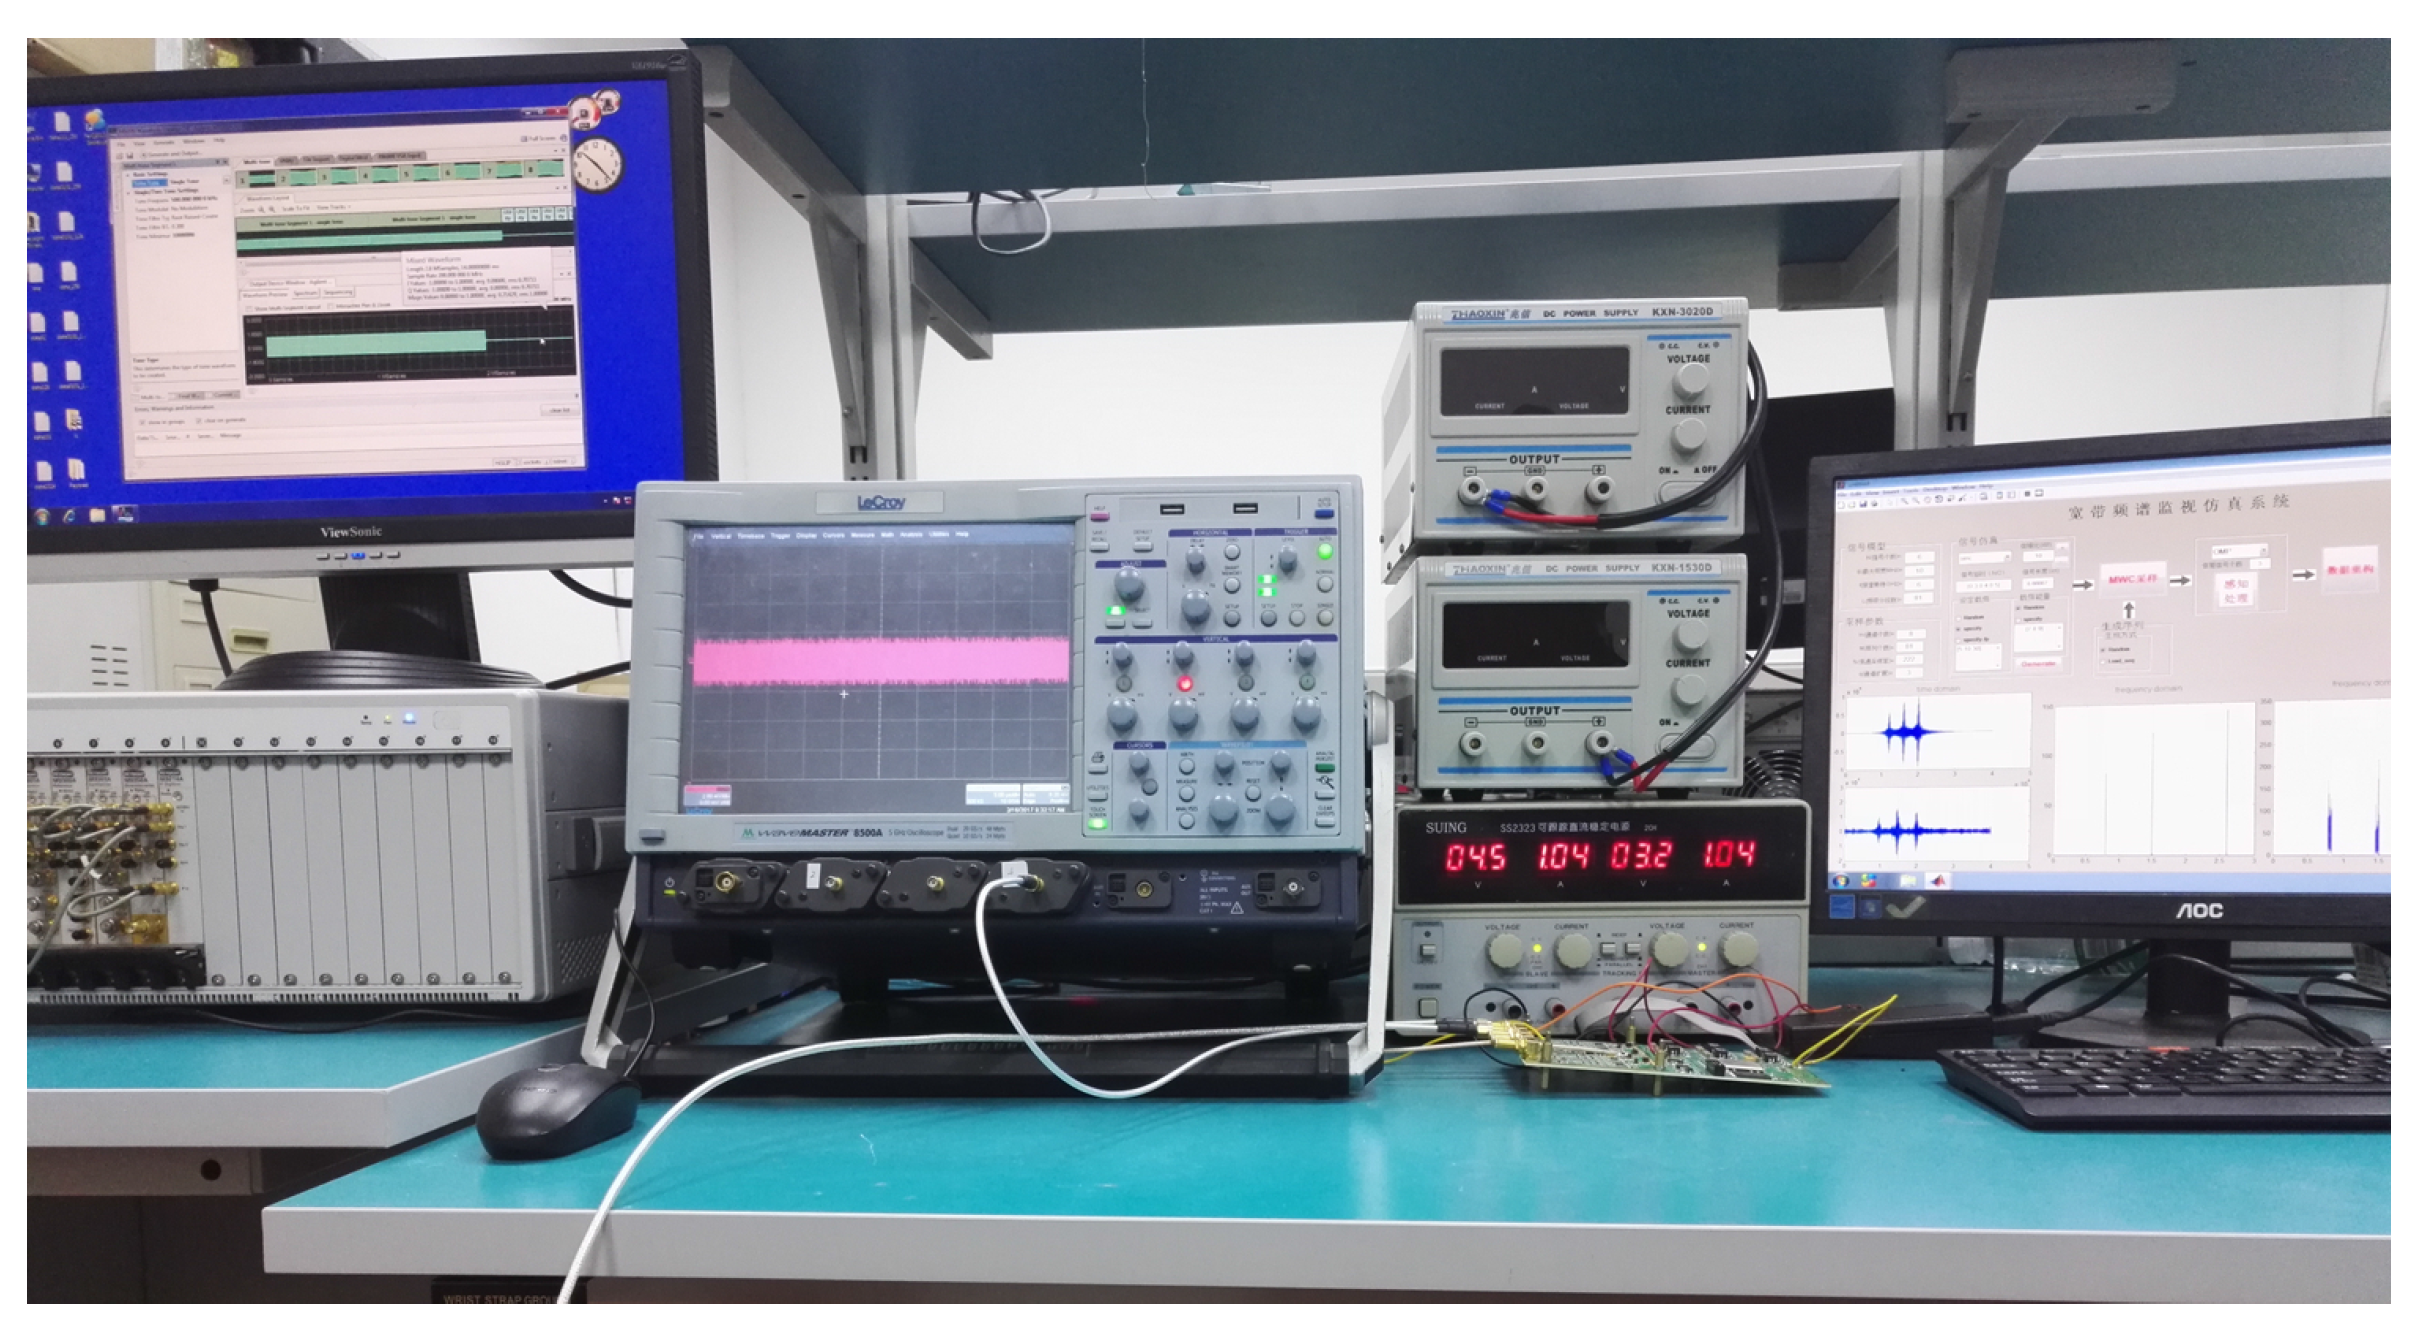
In this section, we demonstrate the SCMWC sensing strategy using our designed system. We first explain the data-processing software, and then describe the software simulations for the system. Finally some hardware experiments we conducted to prove the performance of our circuit board. Throughout the experiments, we use several lab equipments, that include: Arbitrary Wave Generator (AWG)-Keysight M8190A (Keysight Technologies, Santa Rosa, FL, USA), Agilent N9936A (Keysight Technologies), LeCroy 8500A oscilloscope (Teledyne LeCroy, Chestnut Ridge, NY, USA) and a desktop computer, etc.
Figure 10 shows the main elements in our experiment setup.
5.1. Background: Software Design
To get the samples, for convenience, we used the above oscilloscope instead of commercial ADCs. Firstly, according to the Nyquist sampling theory, we set the sampling rate at 100 MHz, which is the minimal appropriate sampling rate of the oscilloscope. As soon as the waveform is stored, it is transfered to the back-end computer for software processing. In designing the software, we divided the whole process into several steps as follows:
Calibration. This step is essential, because the relation between the samples and the original signal becomes unknown in real hardware implementation. Physical effects have a considerable impact on the sampling process, which may lead to detection failure [
24]. However in [
25], an automated calibration algorithm is presented applying to MWC. Similarly, in SCMWC, same process is adopted and implemented in our software. Generally, once the circuit board is fixed, the relation becomes a constant matrix. So the calibration process only need once.
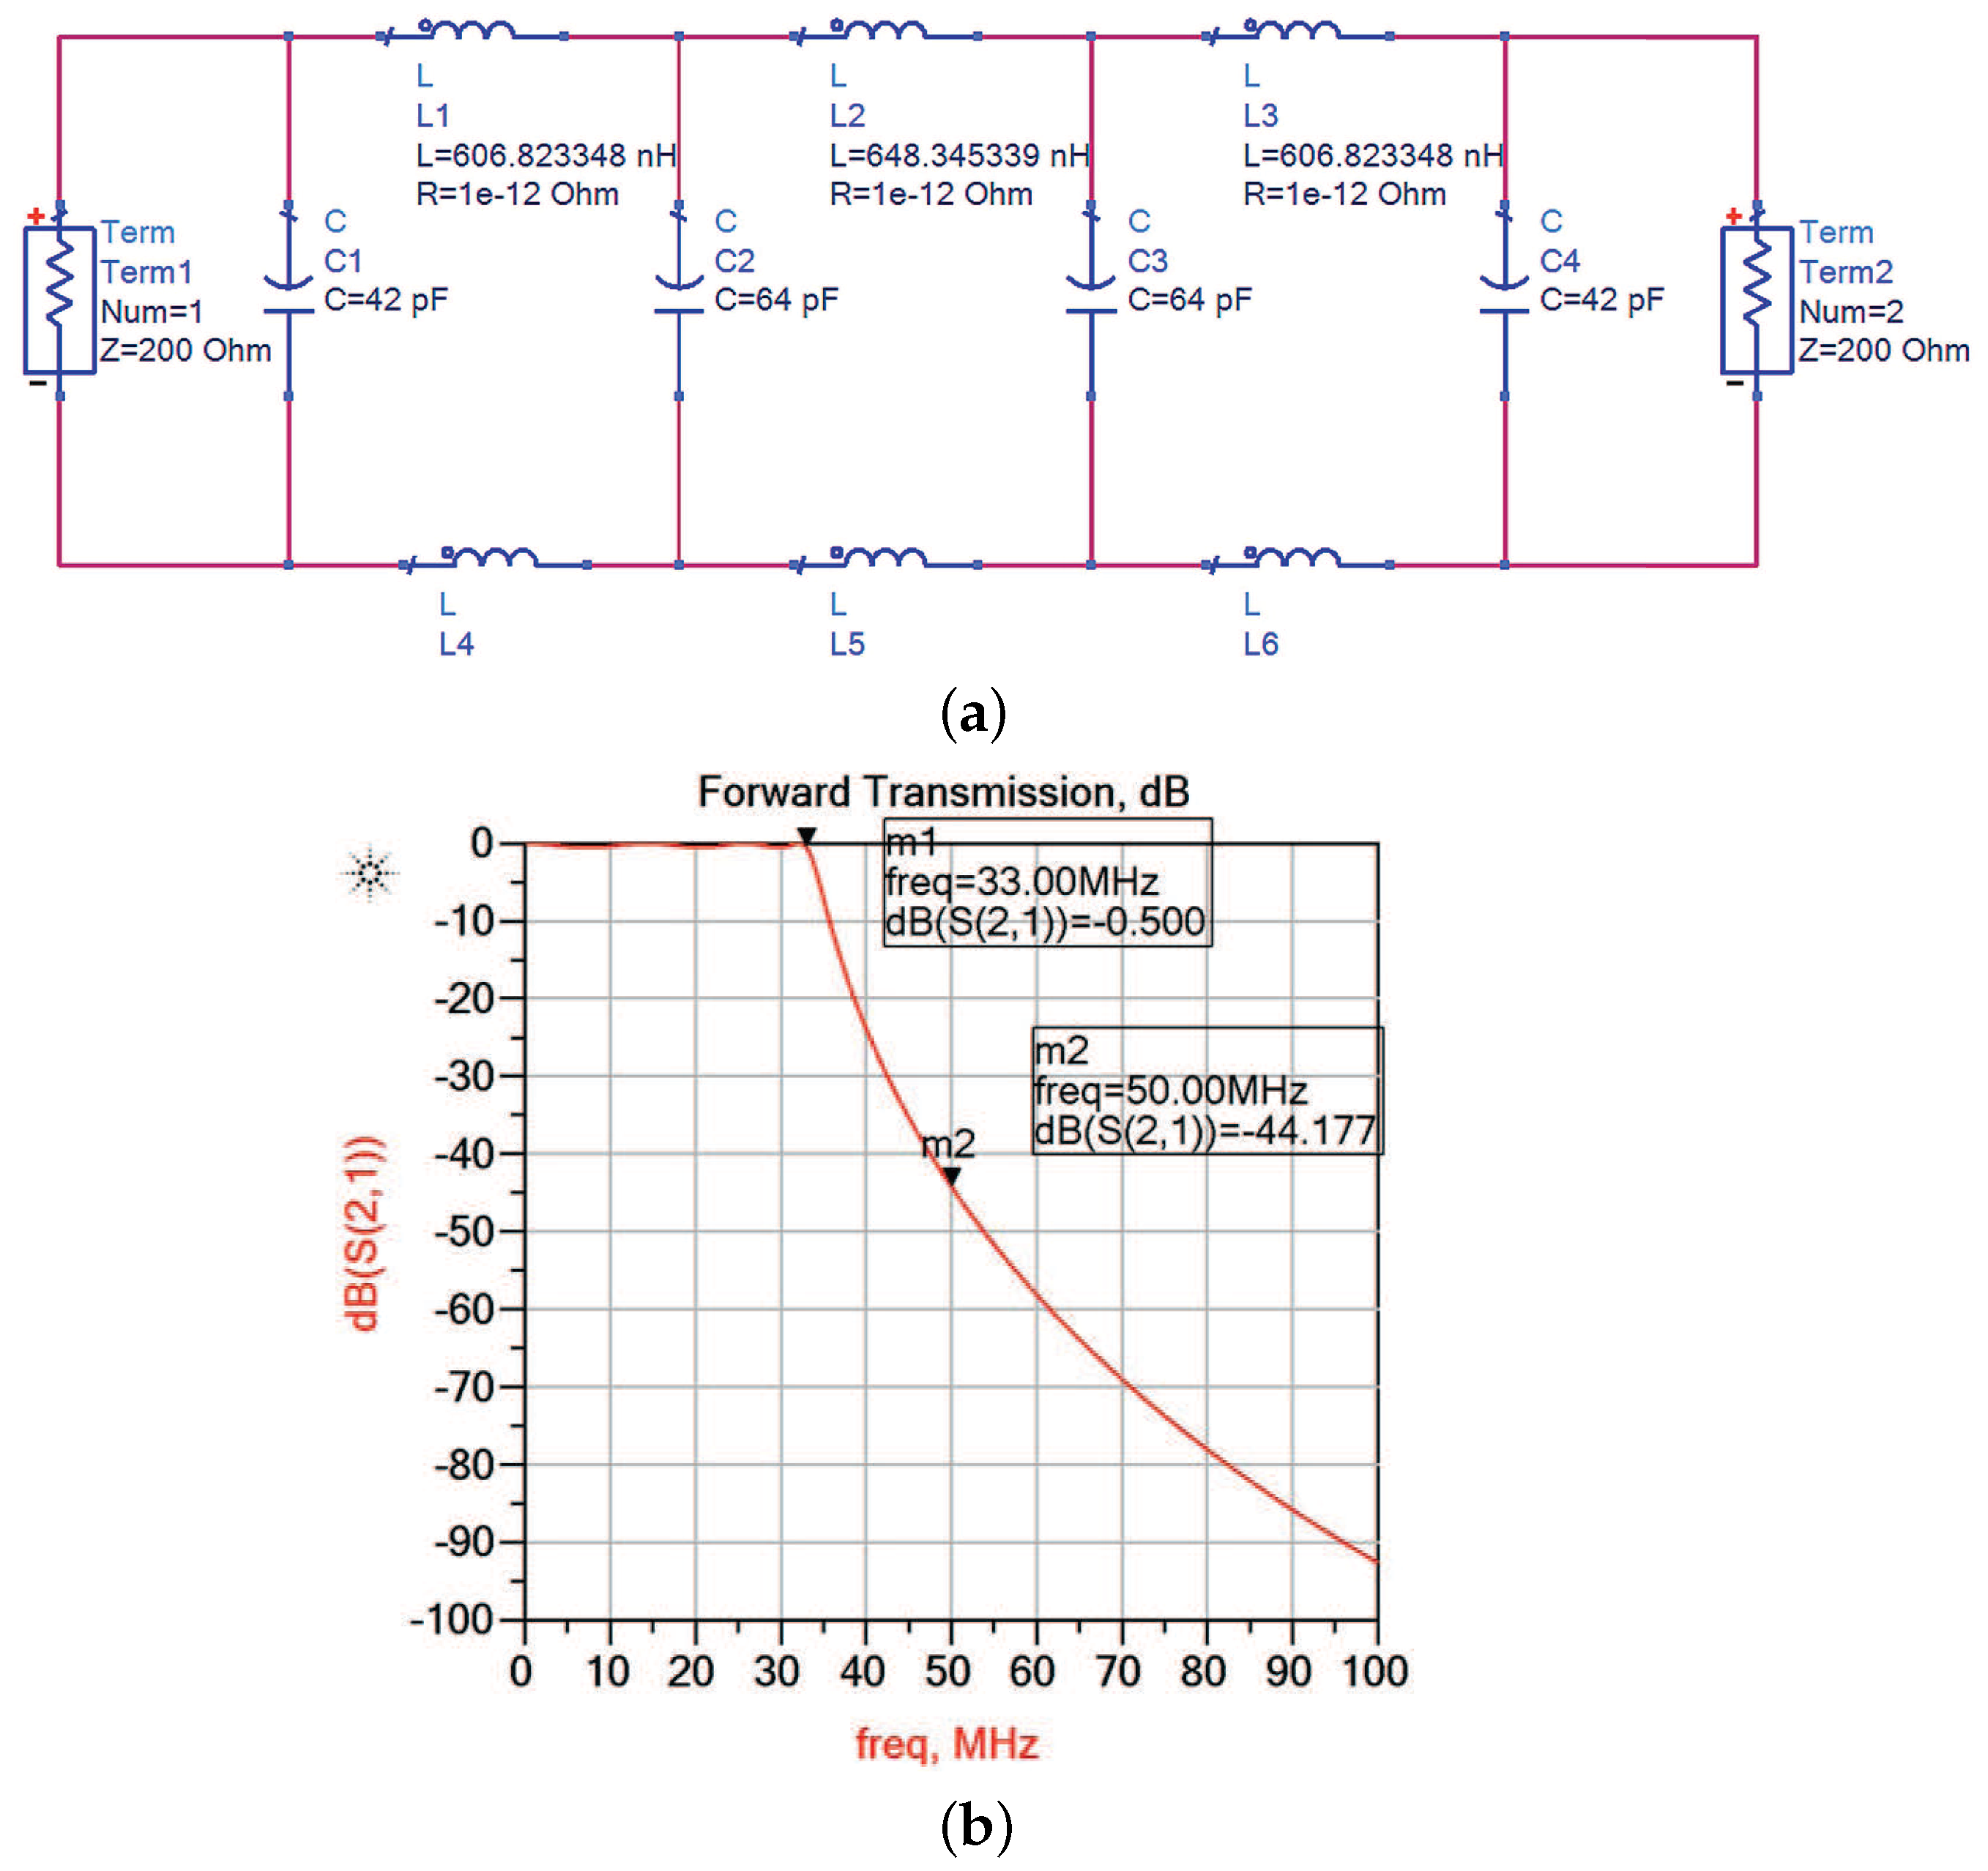
Digital Finite Impulse Response filtering. Actually, the SCMWC requires ideal analog low pass filters to accomplish the detection process. however, in practice, implementing ideal filters is generally difficult. Usually, people use digital filters to compensate for the analog filters. It is proved in [
26] that with only a moderate amount of oversampling, the imperfections caused by non-ideal filters can be effectively corrected in the digital domain. In our software, the samples from the oscilloscope are firstly put through a digital Finite Impulse Response (FIR) filter with cutoff frequency
MHz (
). Then, we resample the output data, to ensure the actual sampling rate is a little higher than
. At this point, the preprocessing of the data is complete.
Power spectrum sensing. Every piece of the data is then processed automatically by the software. As described in
Section 3.3, we divide the sensing algorithm into several steps shown in
Figure 11. Firstly, we get the autocorrelation matrix
from samples
. The frame
is then calculated. Next we perform eigenvalue decomposition to get
which has the same column space as
, and the rank of the two matrixes are the same. Finally, we use some common CS algorithms to solve the frequency support. When the support
is known, the signal frequency position is certain.
where submatrix
contains the columns of
indexed by
and the
is the Moore-Penrose pseudoinverse of
5.2. Software Simulations
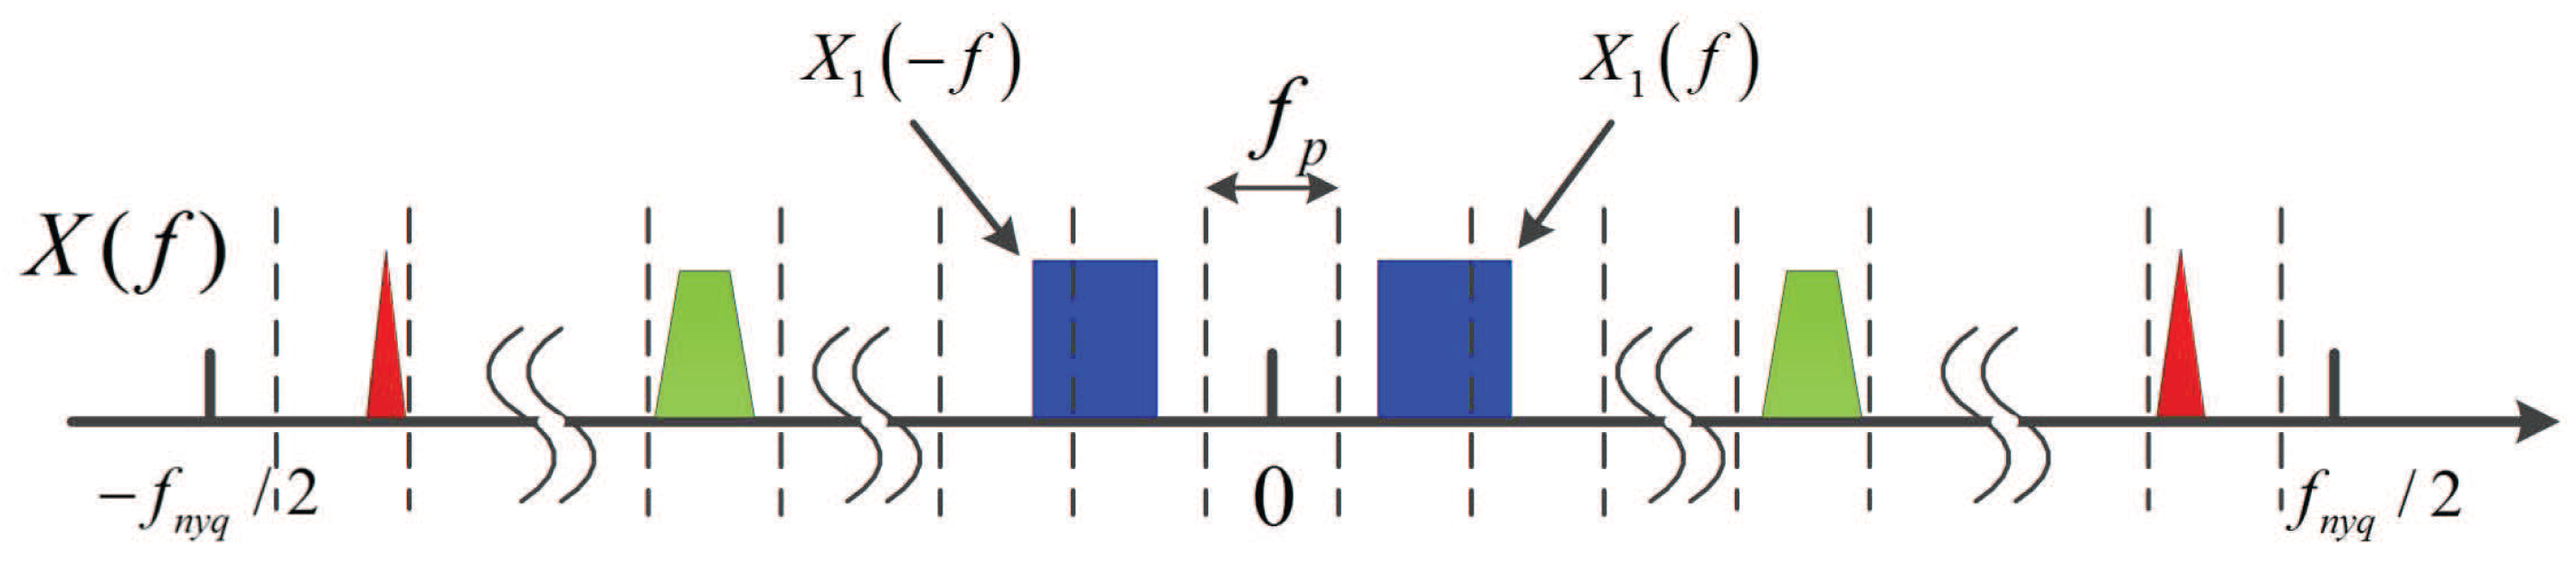
Before simulations, we have to define the successful detection as
rather than
, where
is the the detected support. Because that if the band-limited signal occupies two bands like
as shown in
Figure 12, this signal will have two neighboring supports after calculating. In general, before the CS algorithms solving the Equation (
18), we need to know the largest possible sparsity. In order to avoid missing alarm, we set the sparsity two times of
N. So estimating the success detection equals to deciding whether
is included in
.
However, acquiring the solution
is NP-hard. Using some known CS algorithms can not promise 100% correct solution. However, the detection performance can be improved by increasing the sensing time. A straightforward way is to increase the parameter
m. From [
11], for practical applications, the value of
m is roughly
To evaluate the performance of the specifications we choose in
Table 1 for the proposed prototype, we did some simulations on Matlab. The bandwidth we plan to sense is 1 GHz, and it is so wide that we can not generate a such wideband noise for hardware experiment. The signal to noise ratio is defined as
, where
is the wideband signal and
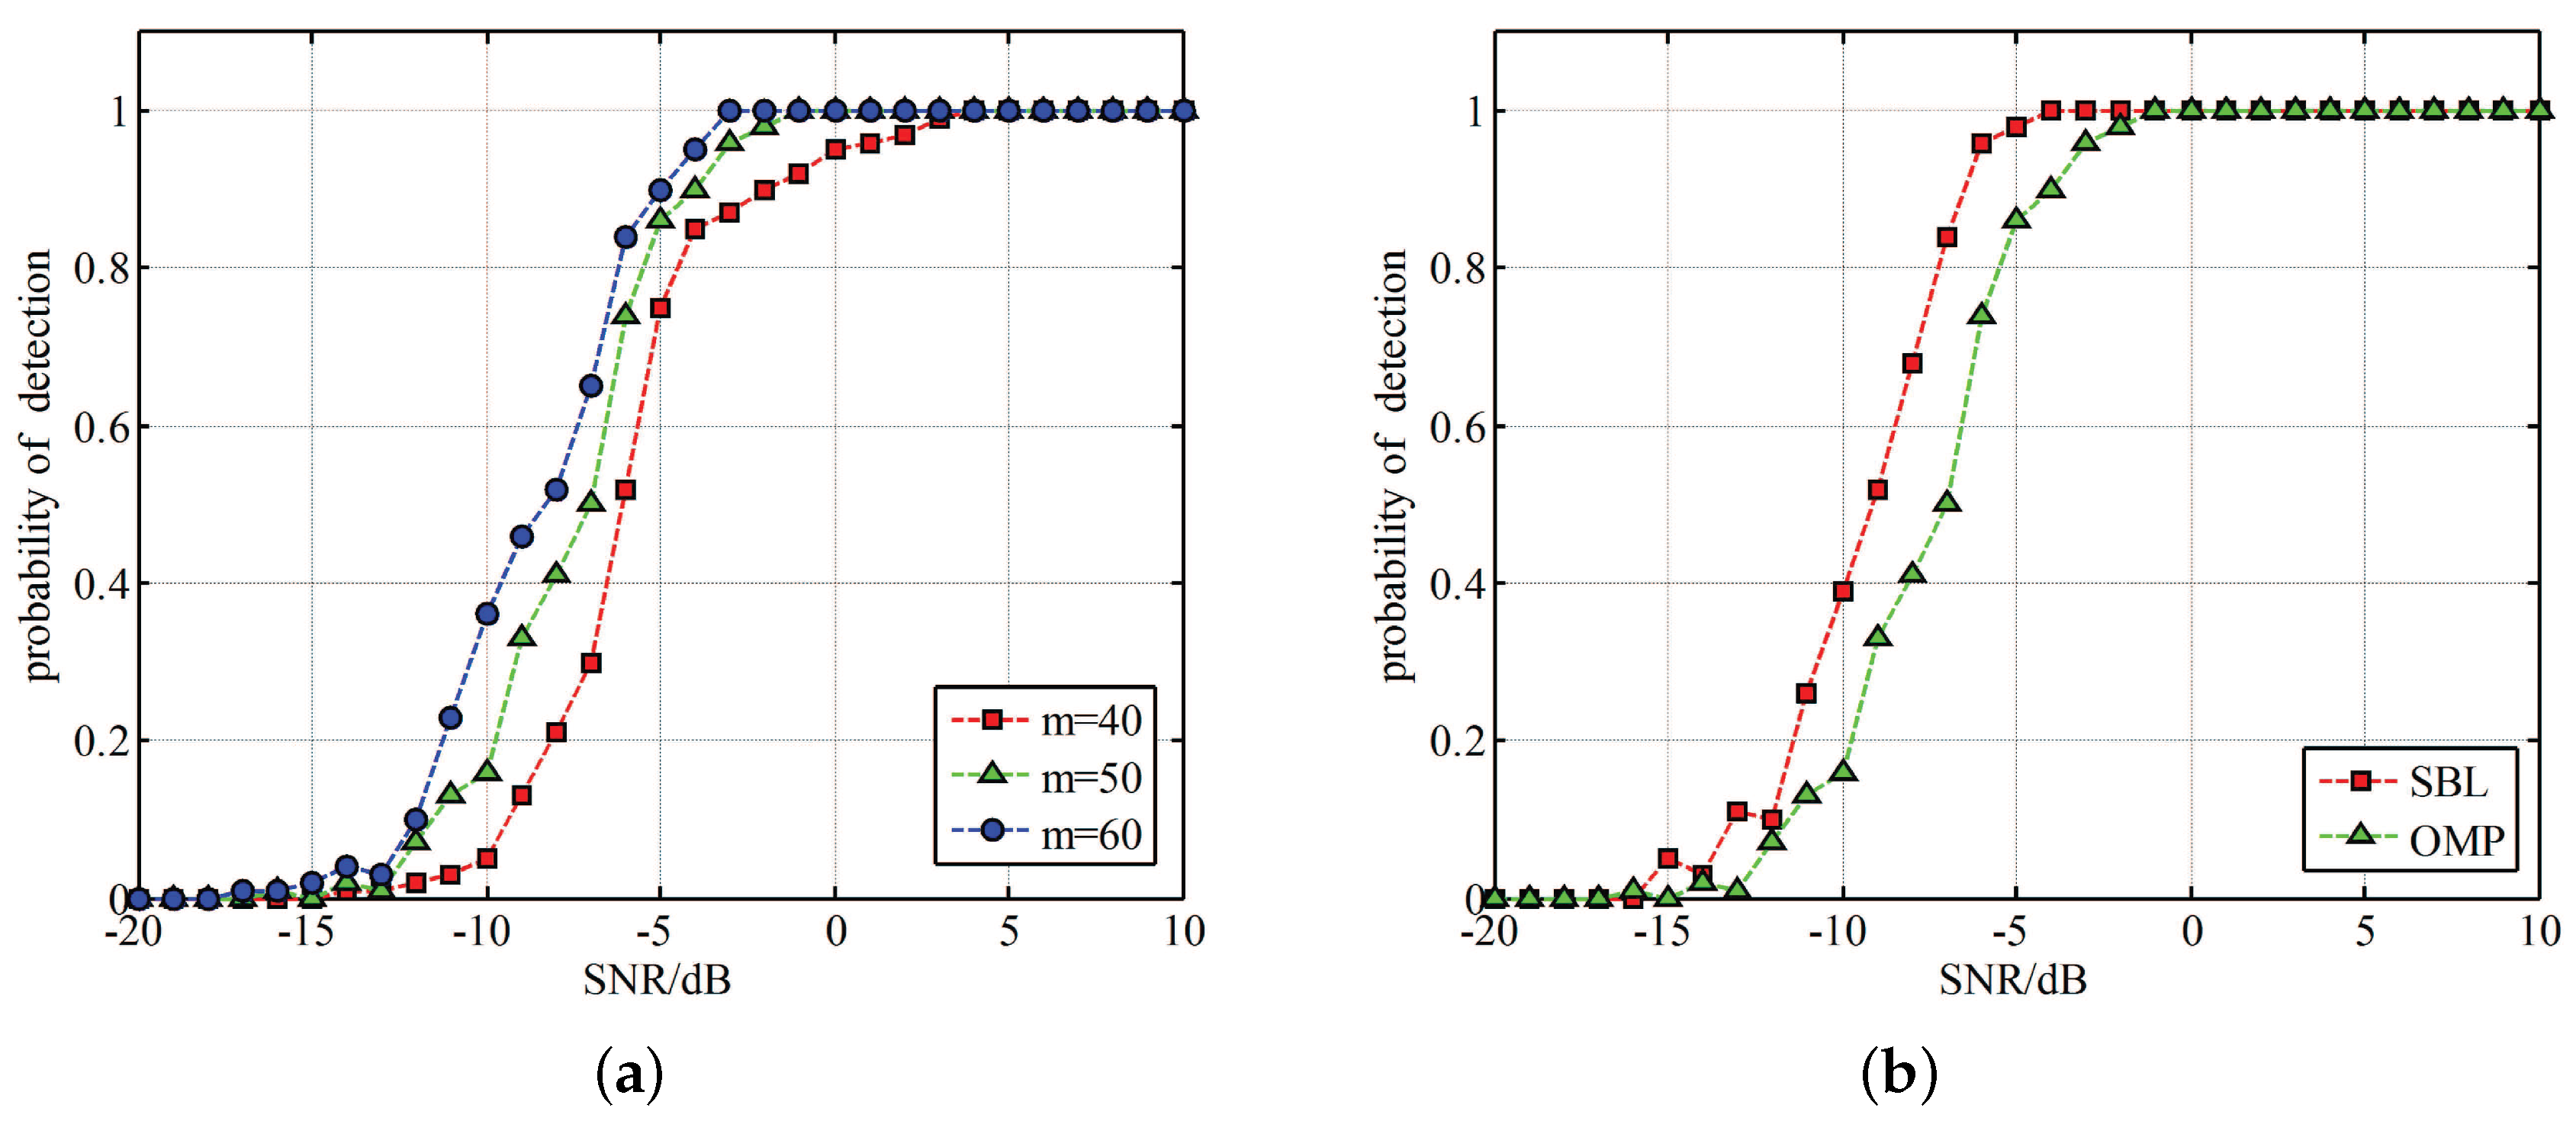
is the wideband additive white Gaussian noise. We conducted two simulations, and each experiment is repeated over 500 realizations. The first one is to find the relationship between detection performance and SNR. As shown in
Figure 13a, we choose three different empirical values of
m according to Equation (
21). We can see that the detection performance becomes better with SNR increasing. When the SNR is up to
dB, the successful detection rate is more than
. Besides, we can also find the detection probability can improve a lot with
m increasing when the SNR is between
dB and
dB. In other SNR intervals, this effect is not significant.
As for another simulation, we introduced to use Sparse Bayesian Learning (SBL) [
27] owning to its adaptation to number of signals. SBL-based method takes advantage of the probability density distribution of the data to achieve a best matching between the calculational results and the samples, which means that SBL techniques do not depend on the information maximum number of signals. This property of SBL-based techniques is suitable in our situation. we intend to apply SBL algorithm to solve the problem in SCMWC.
Figure 13b depicts the probability of detection between OMP and SBL algorithm in different SNR. We set
in this situation. We can see that SBL-based method has better performance, it can increase around
between
dB and
dB. However, SBL algorithm takes up more time than OMP, which is not appropriate in real time detection. Above all, these two simulations proves the feasibility of our prototype, and indicate the performance of the proposed specifications.
5.3. Hardware Experiments and Analyses
In this section, we describe several experiments based on our circuit board. The first one is showing the waveform of the period sequences generator. Then some typical parameters are analysed. At last, several spectrum sensing experiments are conducted and analysed.
5.3.1. Periodic Sign Waveforms
This experiment mainly focuses on checking the performance of periodic sequences generated by GTX.
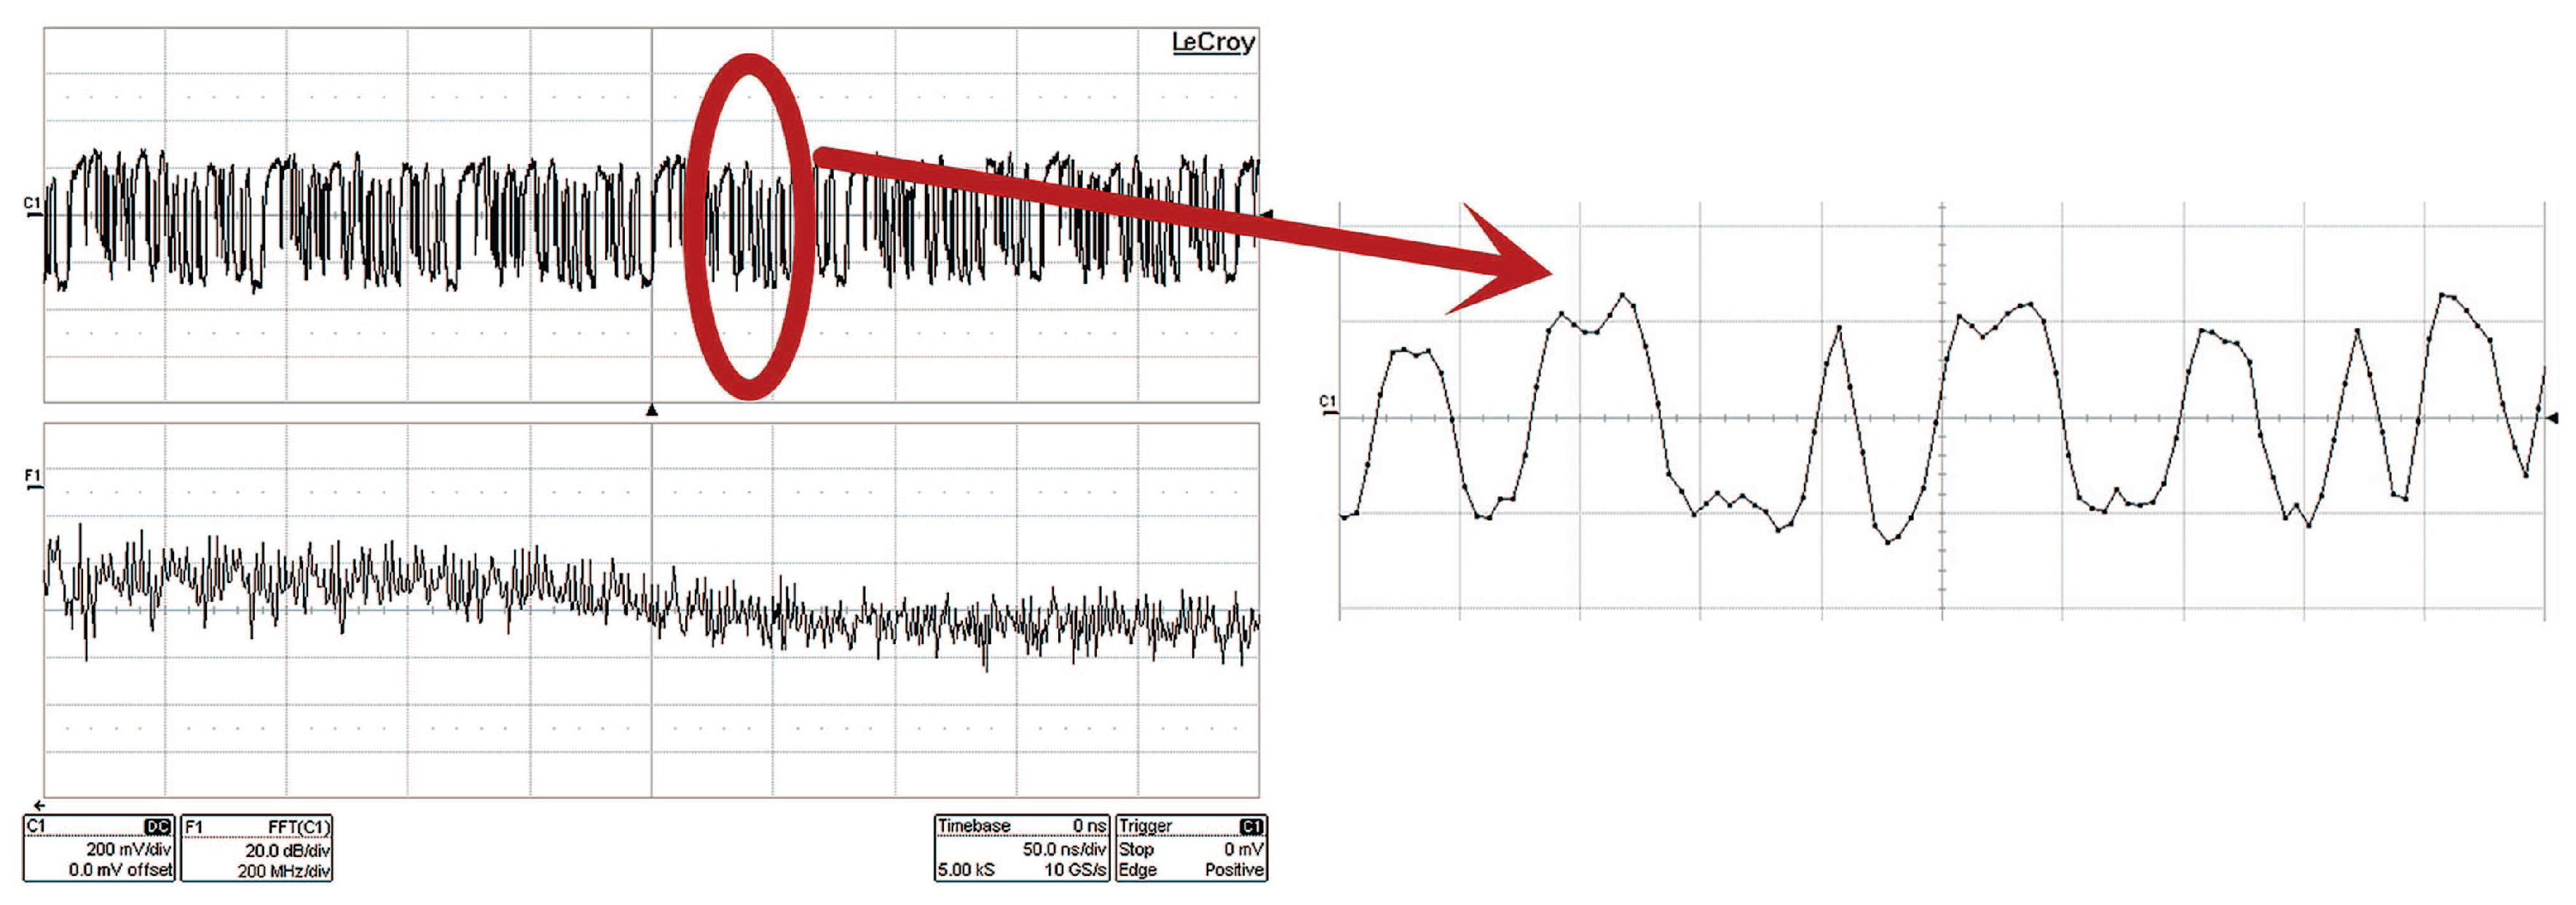
Figure 14 shows the time-domain appearance and the spectrum of
. From the time-domain, we can see the waveform is not actually square. However, its spectrum consists of concentrated energy peaks which we call Dirac functions. Corresponding to the Equation (
6), we can see that the role of the periodic sequences is to move all the signal residing in different frequency bands to baseband. And this make it possible for our system to sample at a low rate and then sense it.
5.3.2. Dynamic Range
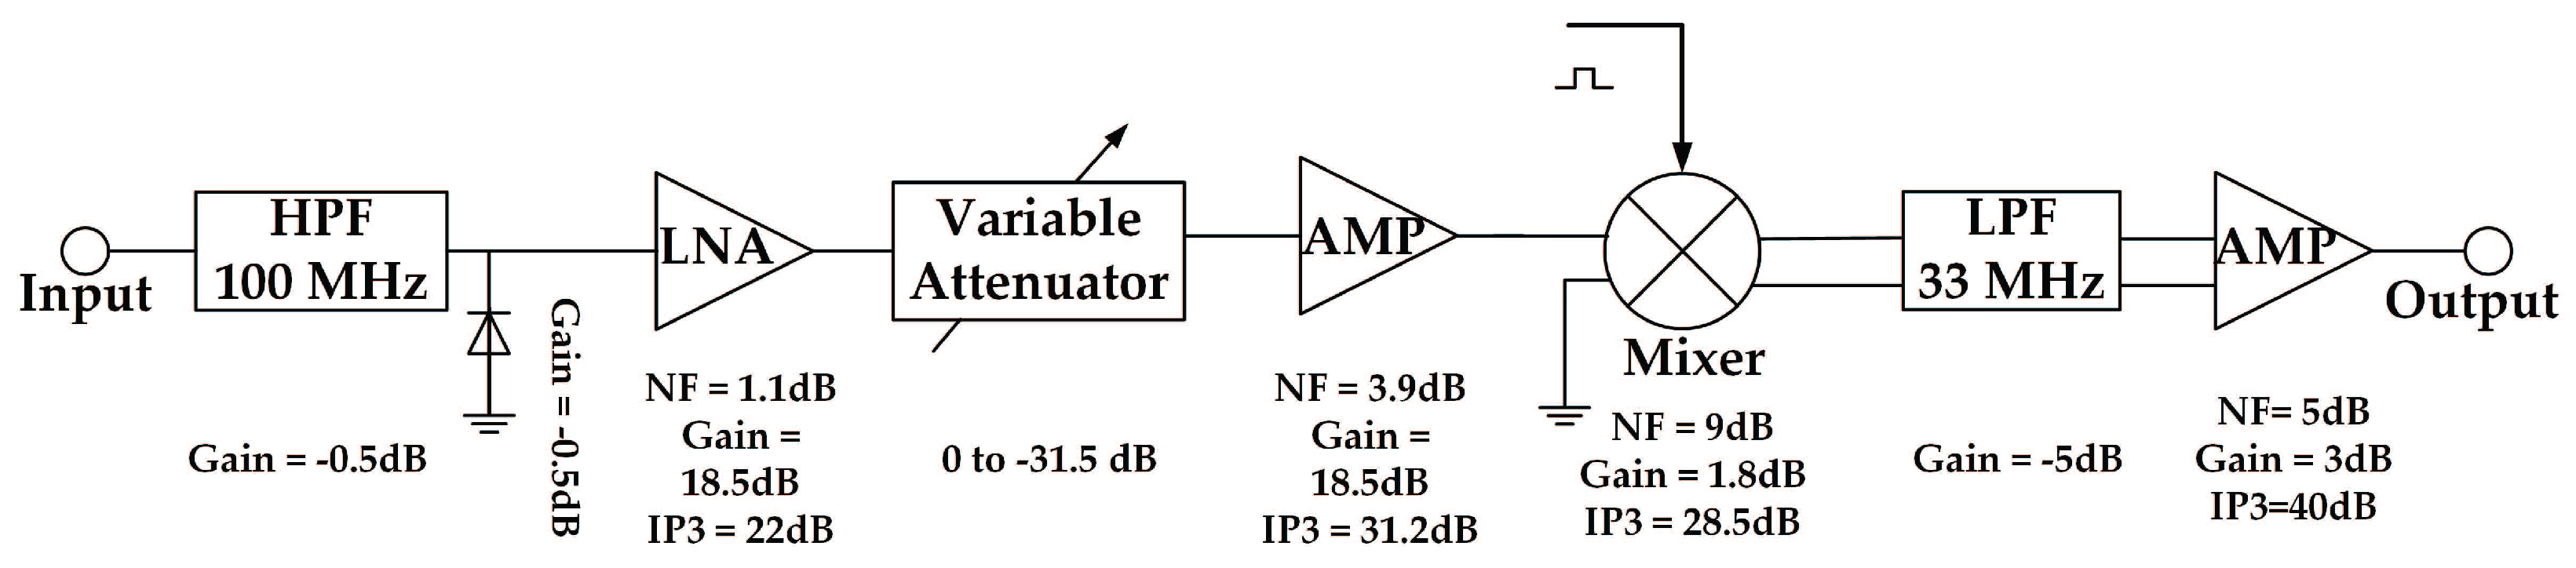
As a spectrum sensor, some basic technical indicators have to be calculated, such as dynamic range and noise figure, etc.
Figure 15 depicts the link budget calculation of the hardware system. To satisfy the sampling interface of oscilloscope, we set the minimal output amplitude level at 100 millivolts peak-to-peak (
). It is easily to be formulated as
From the simulation results in
Figure 13, the SNR is at least
that can ensure 100% correct detection. So
which means the required signal to noise-and-distortion ratio. Then the minimal input power can be expressed as
where
represents the gain of each device, and the attenuator is set to 0 dB.
As for maximal input, the variable attenuator is set to the maximal level of
dB as well with the purpose of reducing enormous gain of the frontend. In order to acquire the maximal input power, we have to calculate noise figure and IP3 of the device chain first. The noise figure is formulated as
After calculation, the equivalent NF of the system is around
dB. And the equivalent IP3 of the entire system is counted by [
28]
According to [
20], the
From Equation (
24) and (
27), the dynamic range of our system is finally derived as
dB.
5.3.3. Sensing Experiments and Results
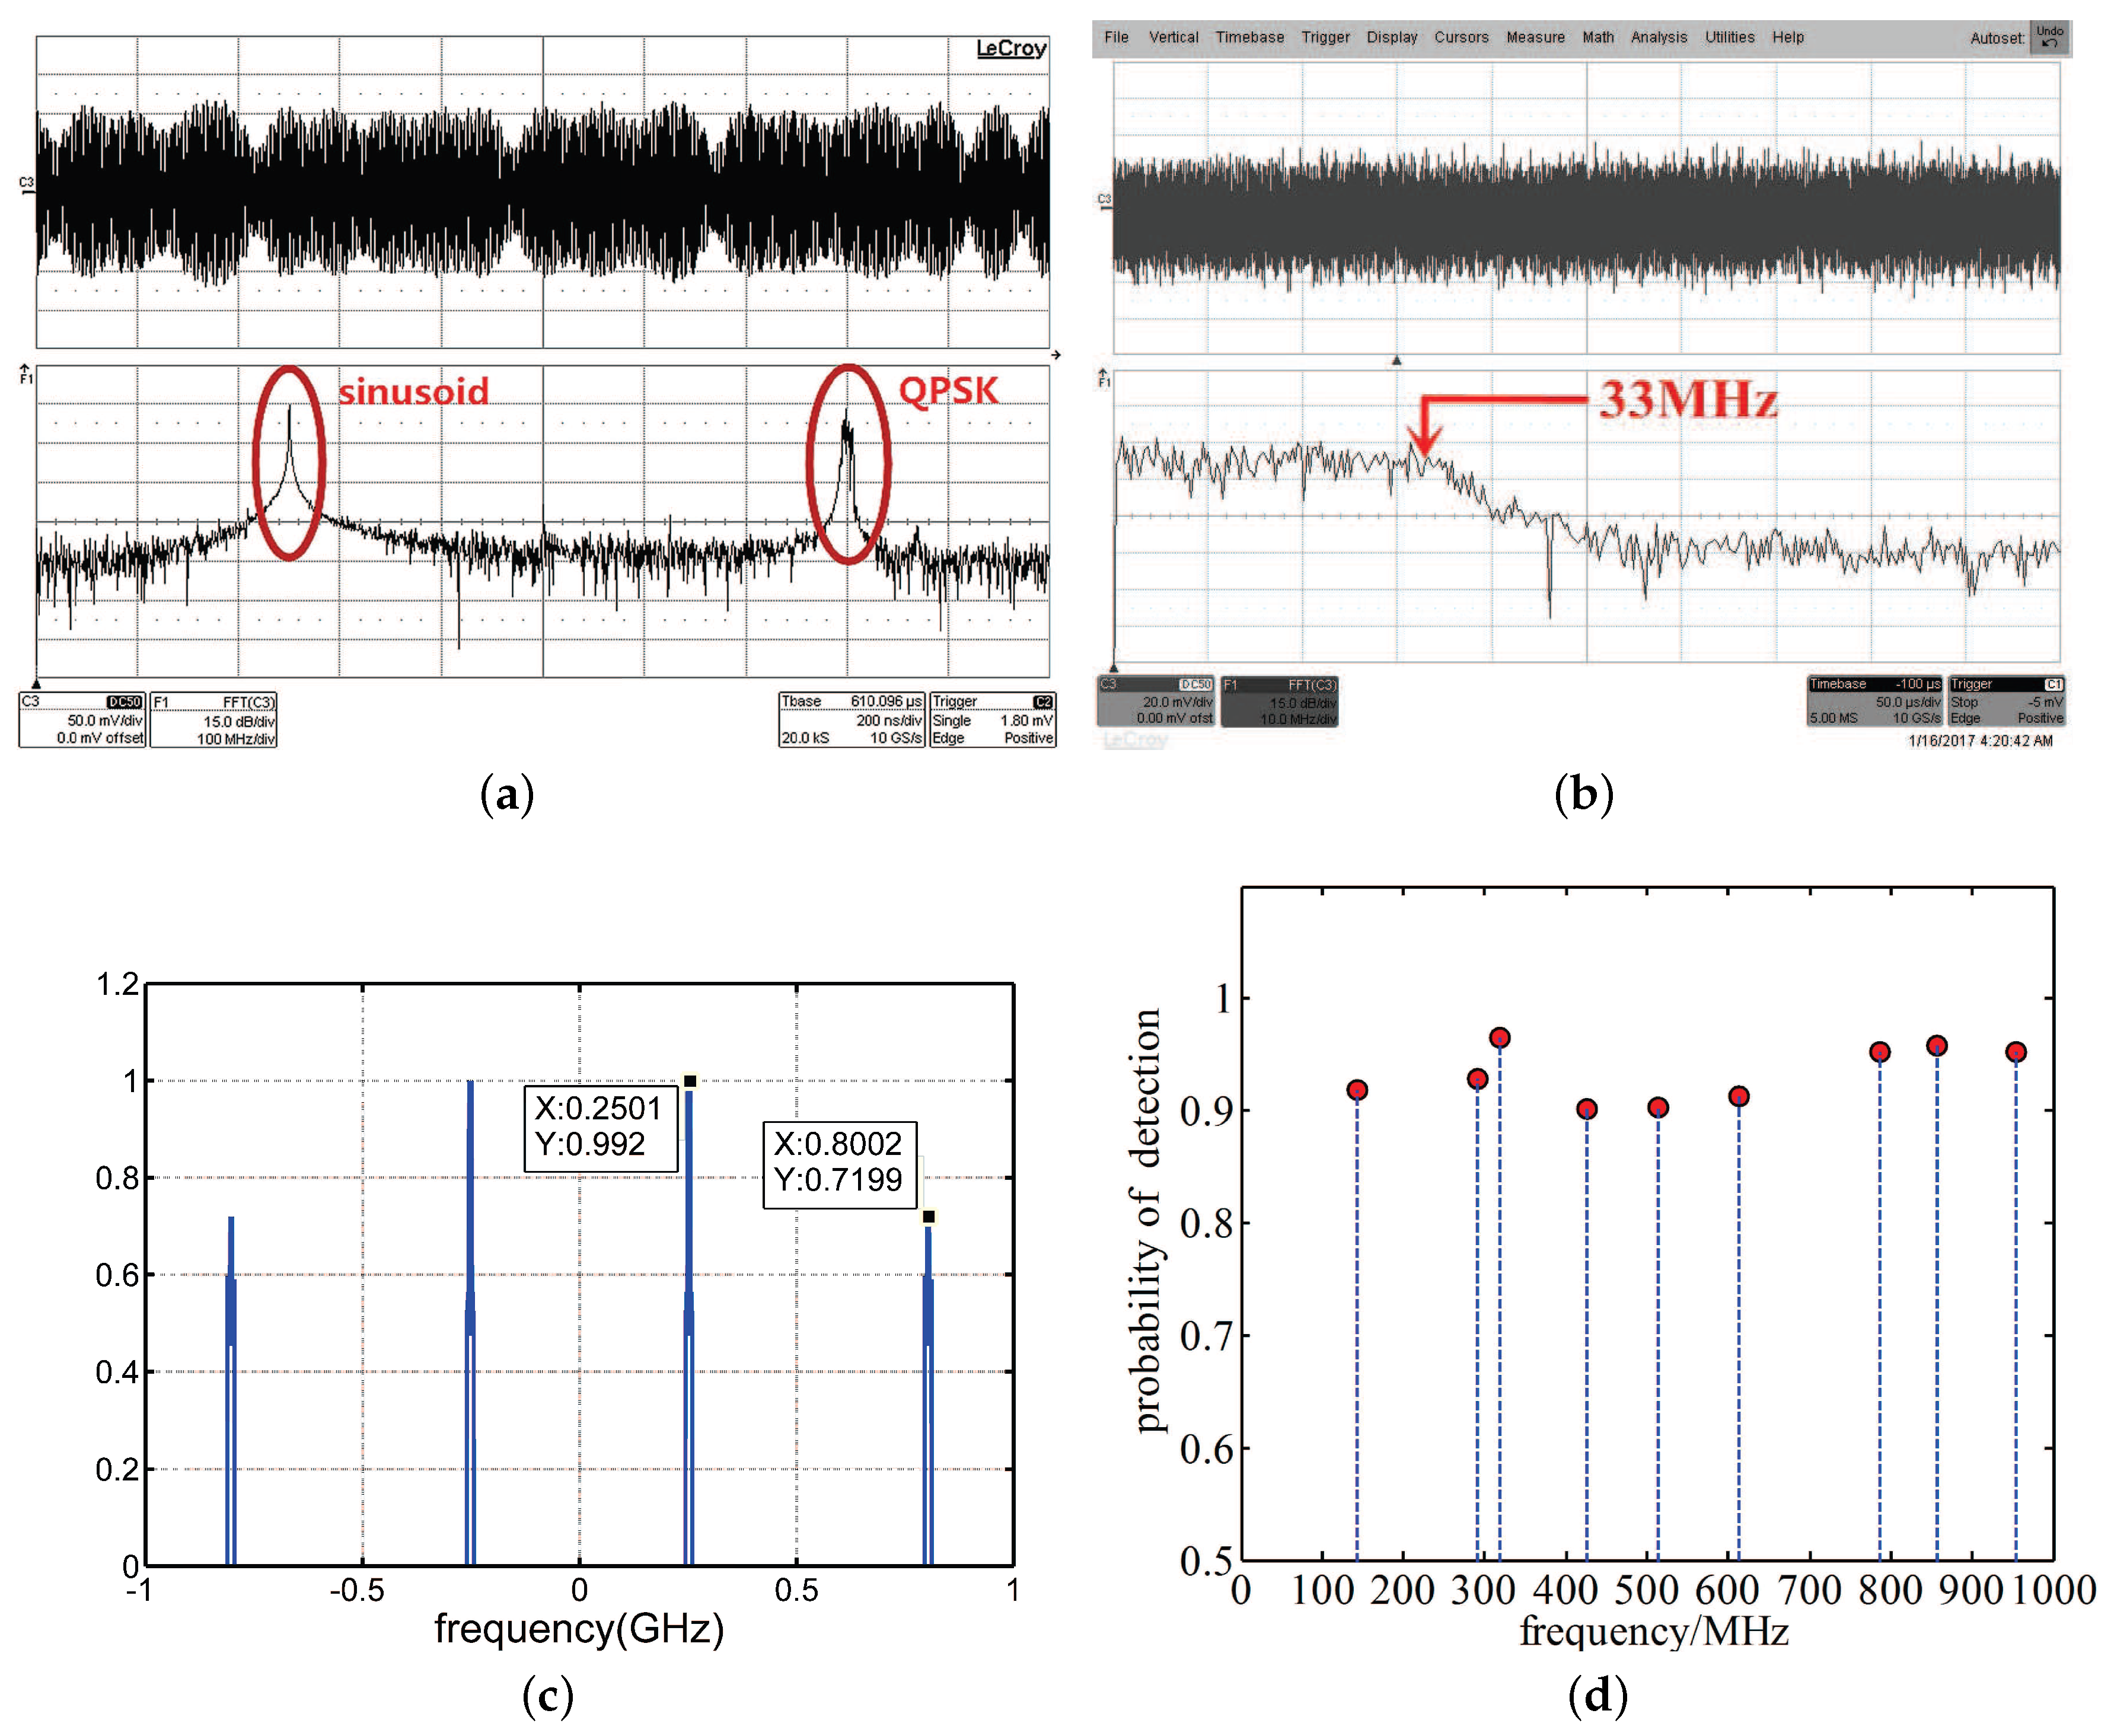
To test the actual performance of the SCMWC prototype, we conducted a series of experiments. At first, we use the Keysight M8190A Arbitrary Wave Generator and Agilent N9936A to produce a signal consists of two discrete frequency bands: a pure sine waveform at 250 MHz and a quadrature phase shift keying (QPSK) signal at 800 MHz with 5 MHz bandwidth. And both amplitude is around
.
Figure 16a,b depicts the time-domain and spectrum of both input signal and low rate samples. In
Figure 16c, the detected power spectrum is presented. From the three figures above, we can see the accuracy of detected power spectrum is pretty high, which indicates our system can sense two bandlimited signals at 250 MHz and 800 MHz precisely.
Then, to test the stability, we conducted the following experiments. First using Matlab to generate nine carrier frequencies randomly in every 100 MHz. The frequency support is
(MHz). Then, we randomly choose two frequencies among
to carry out same experiment as above. The total number of times running the experiments is 500. Correct detection is defined as
similarly. The result is shown in
Figure 16d. As can be seen, during these experiments, the detection accuracy is pretty stable around 90% percent. This demonstrates the possibilities of the proposed SCMWC prototype to be used in actual CR system.
5.4. Comparisons with Related Work
In this section, we make some comparisons with other compressed wideband spectrum sensing hardware, mainly focusing on the performance and actual hardware complexity. As for performance, we compare with the first reported practical hardware that performs sub-Nyquist sampling based on MWC in [
20]. From
Table 2, we can see the most significant difference is compression ratio, that means we make it possible to use one low rate ADC to detect the whole sensing bandwidth. Also, the signal bandwidth is a little lower than that of MWC, which means the estimation accuracy improves a little to some extent.
Another comparison is concerned about hardware complexity in actual design. As shown in
Table 3, SCMWC has a big advantage over MWC. In detail, SCMWC only needs one frond-end and most importantly, in designing the periodic sequences generator, we introduced to use GTX, which can highly reduce the complexity and size of the hardware. However, in MWC, two boards is used. One is called digital board aiming to produce sequences with a lot of shift registers (SR) on it. Another one is called analog board with the purpose of power allocation, mixing, low-pass-filtering and so on. It is apparent that SCMWC based spectrum sensing hardware has a simpler structure which makes it more suit for CR systems.


