
A Novel High-Performance Beam-Supported Membrane Structure with Enhanced Design Flexibility for Partial Discharge Detection


Abstract
:1. Introduction
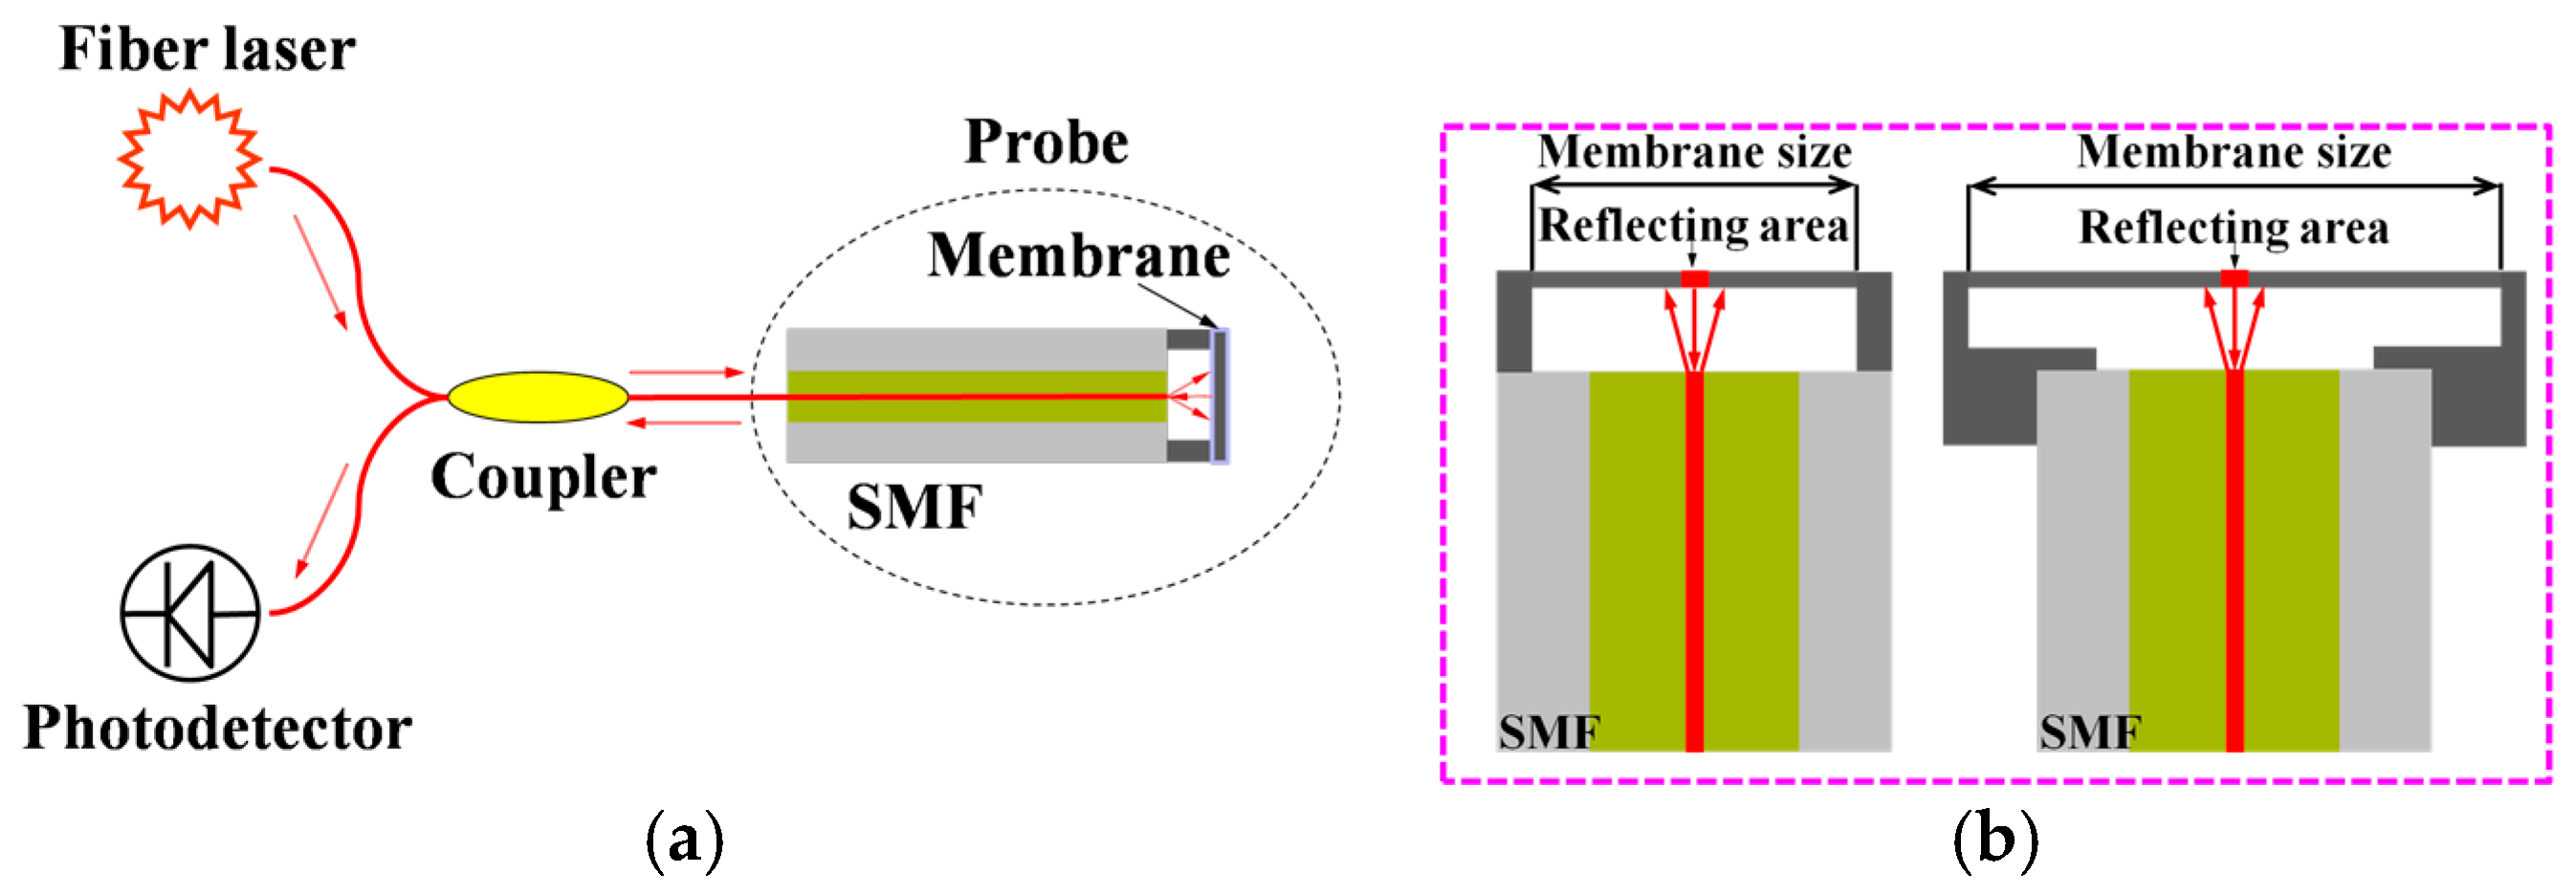
2. Sensor Design
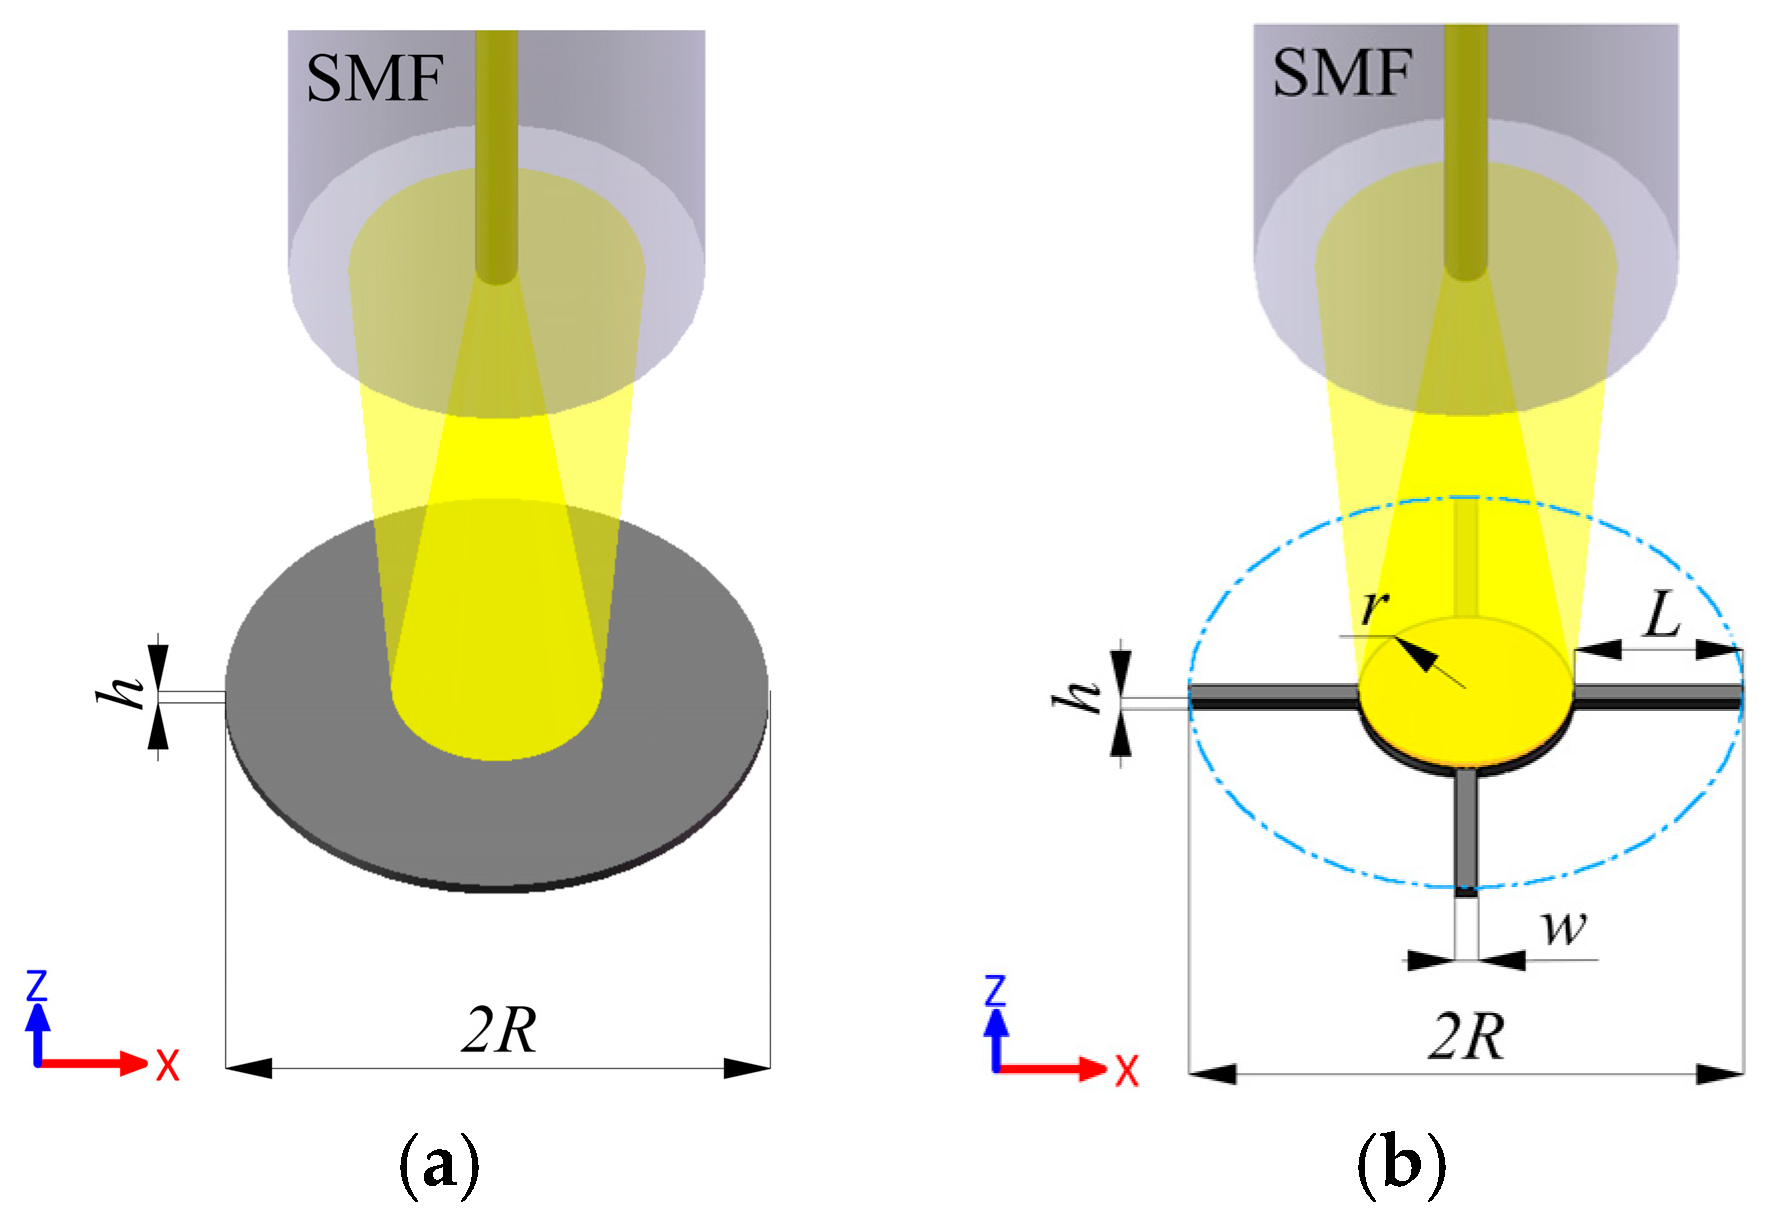
2.1. IM Structure
2.2. BSM Structure
3. Results and Discussions
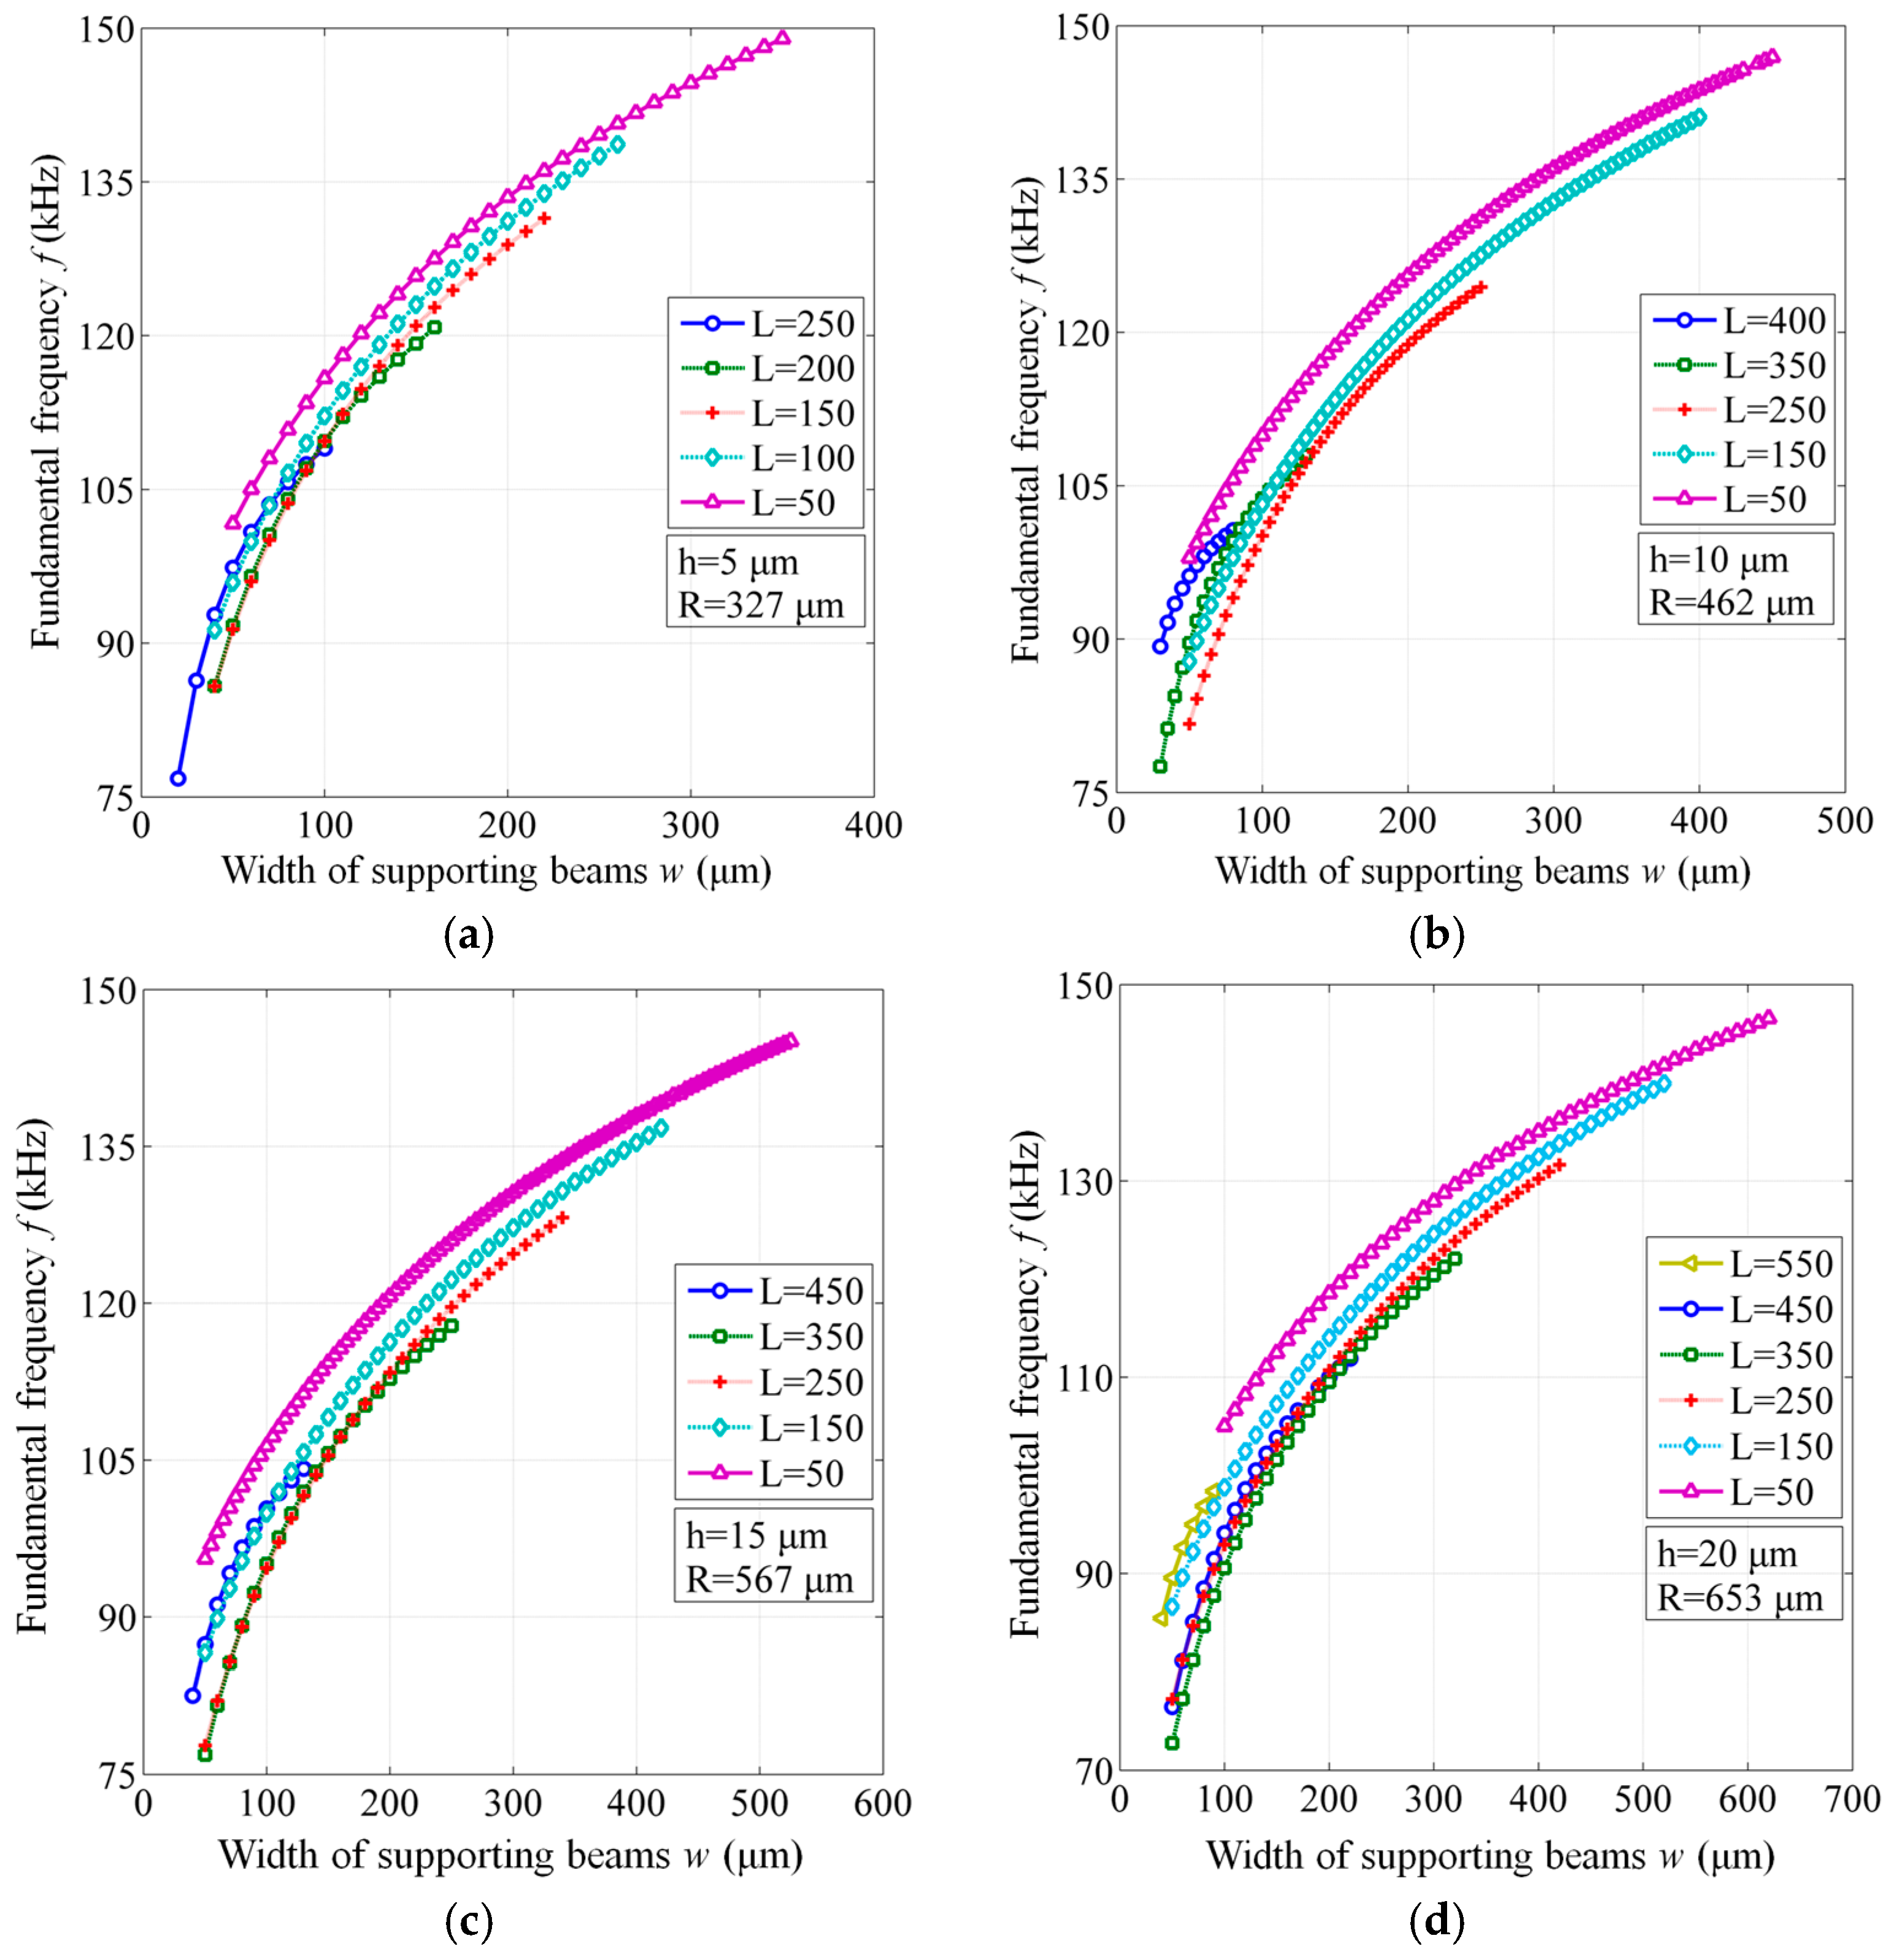
3.1. Frequency Response
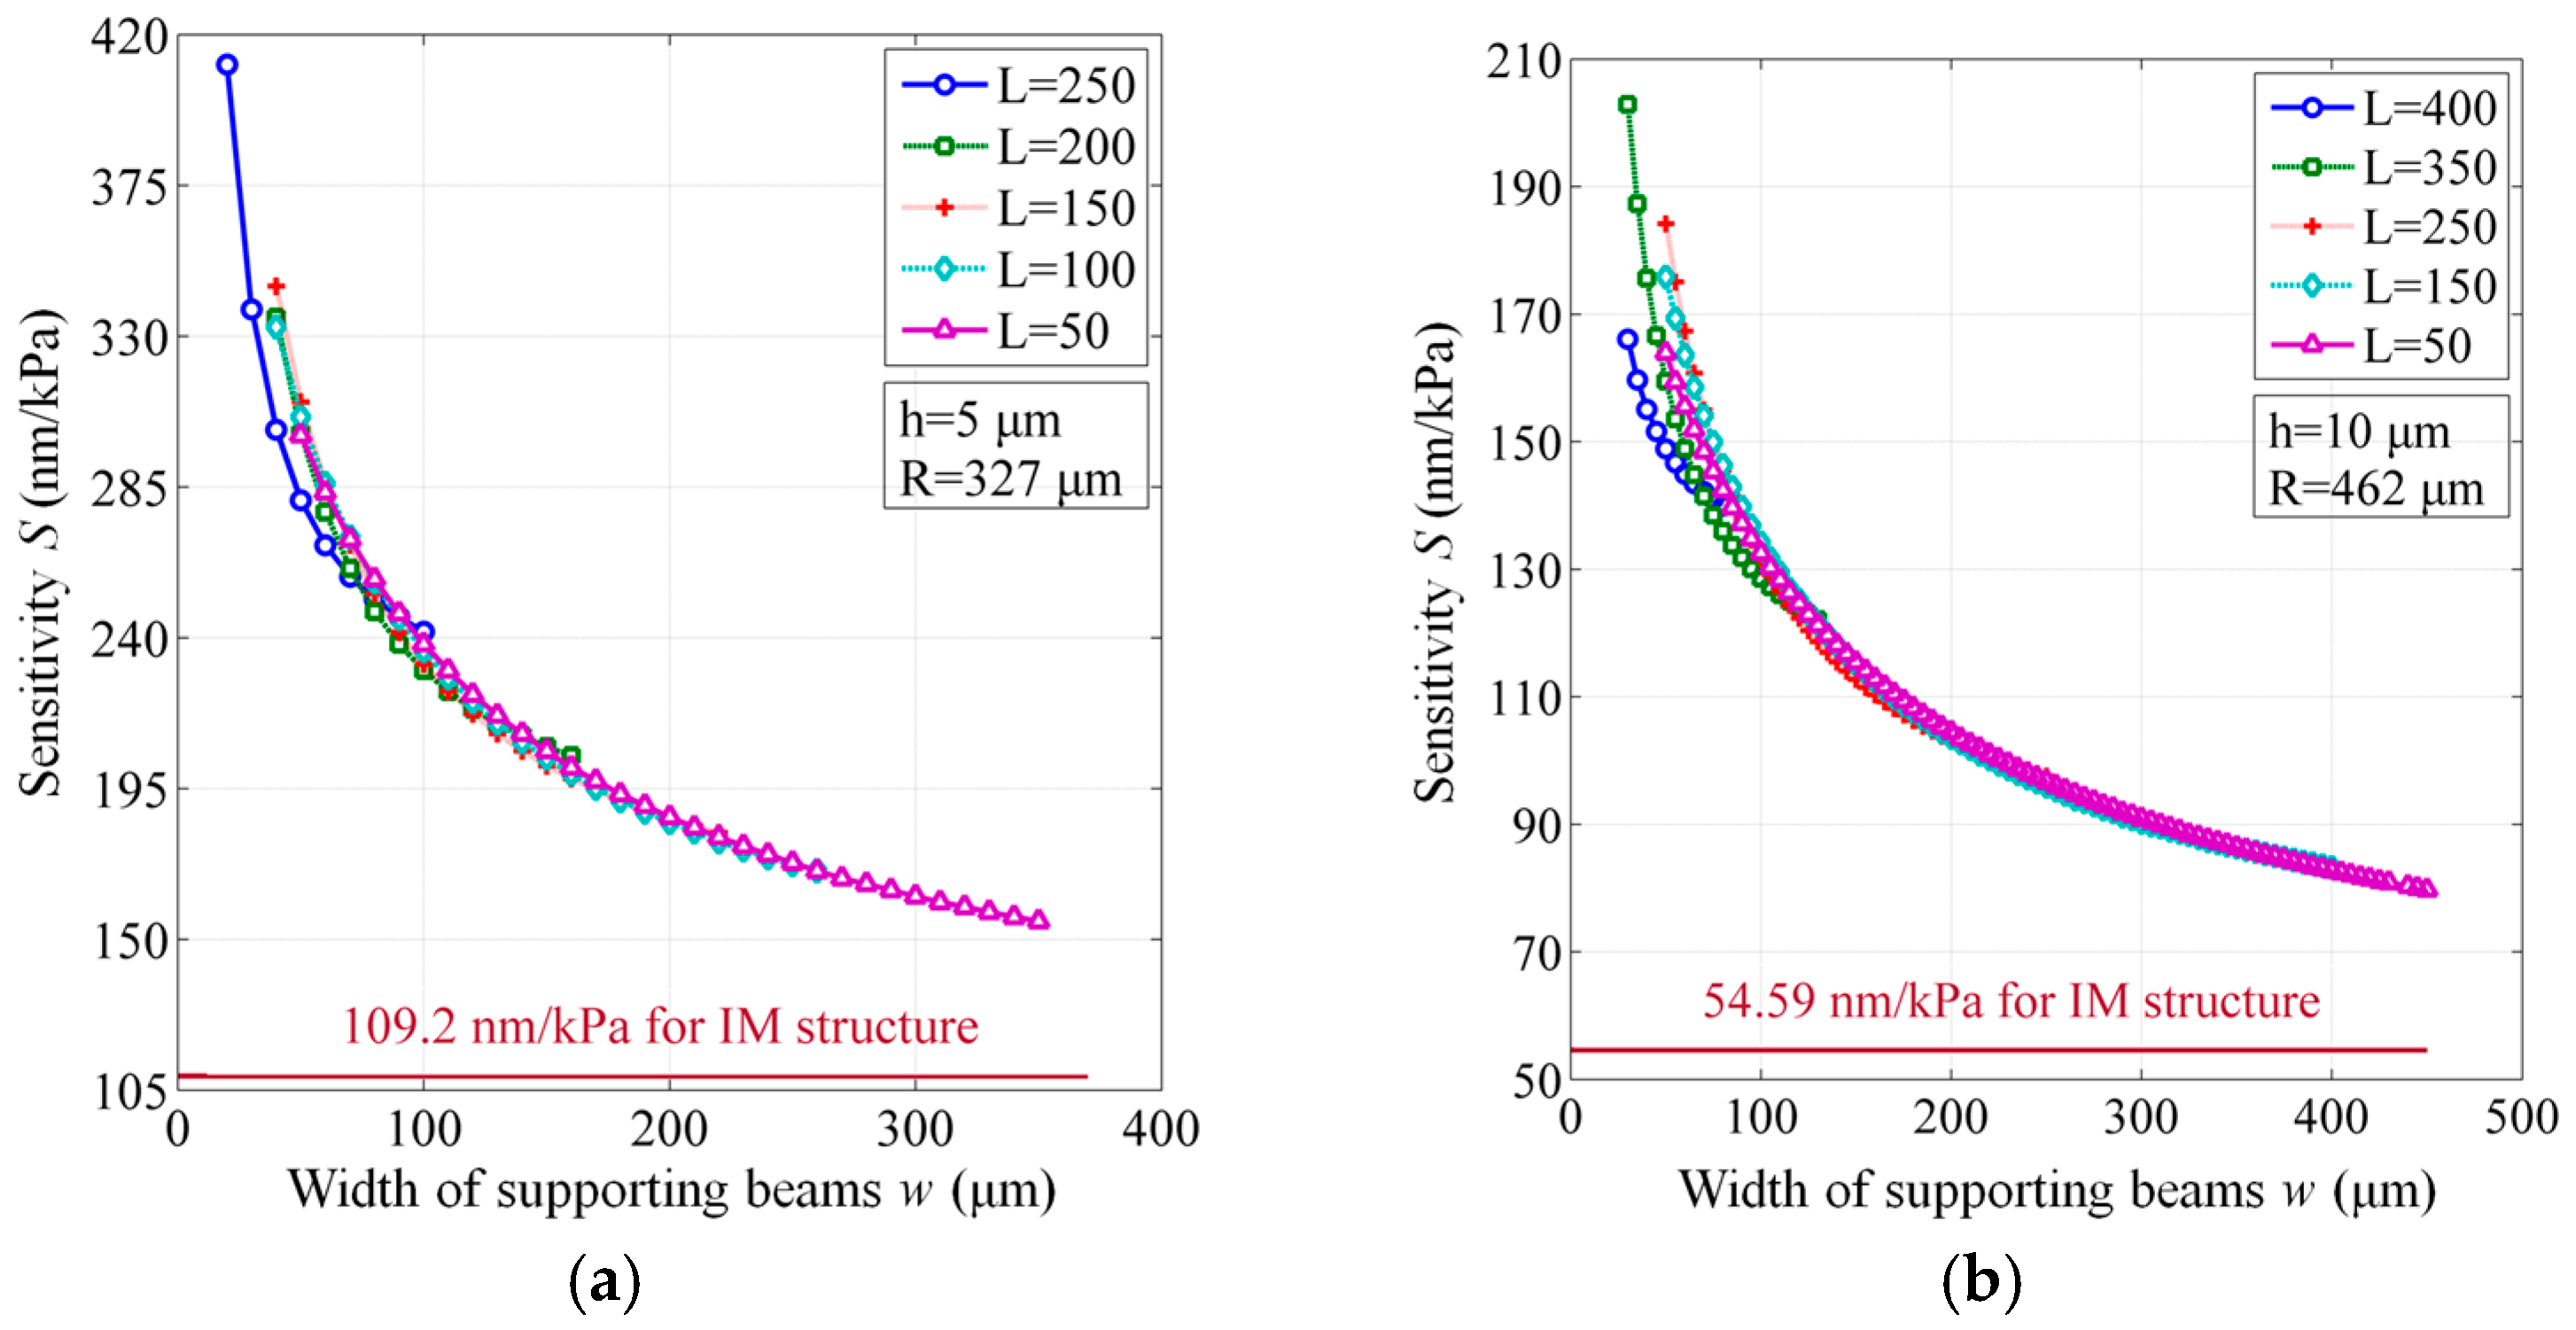
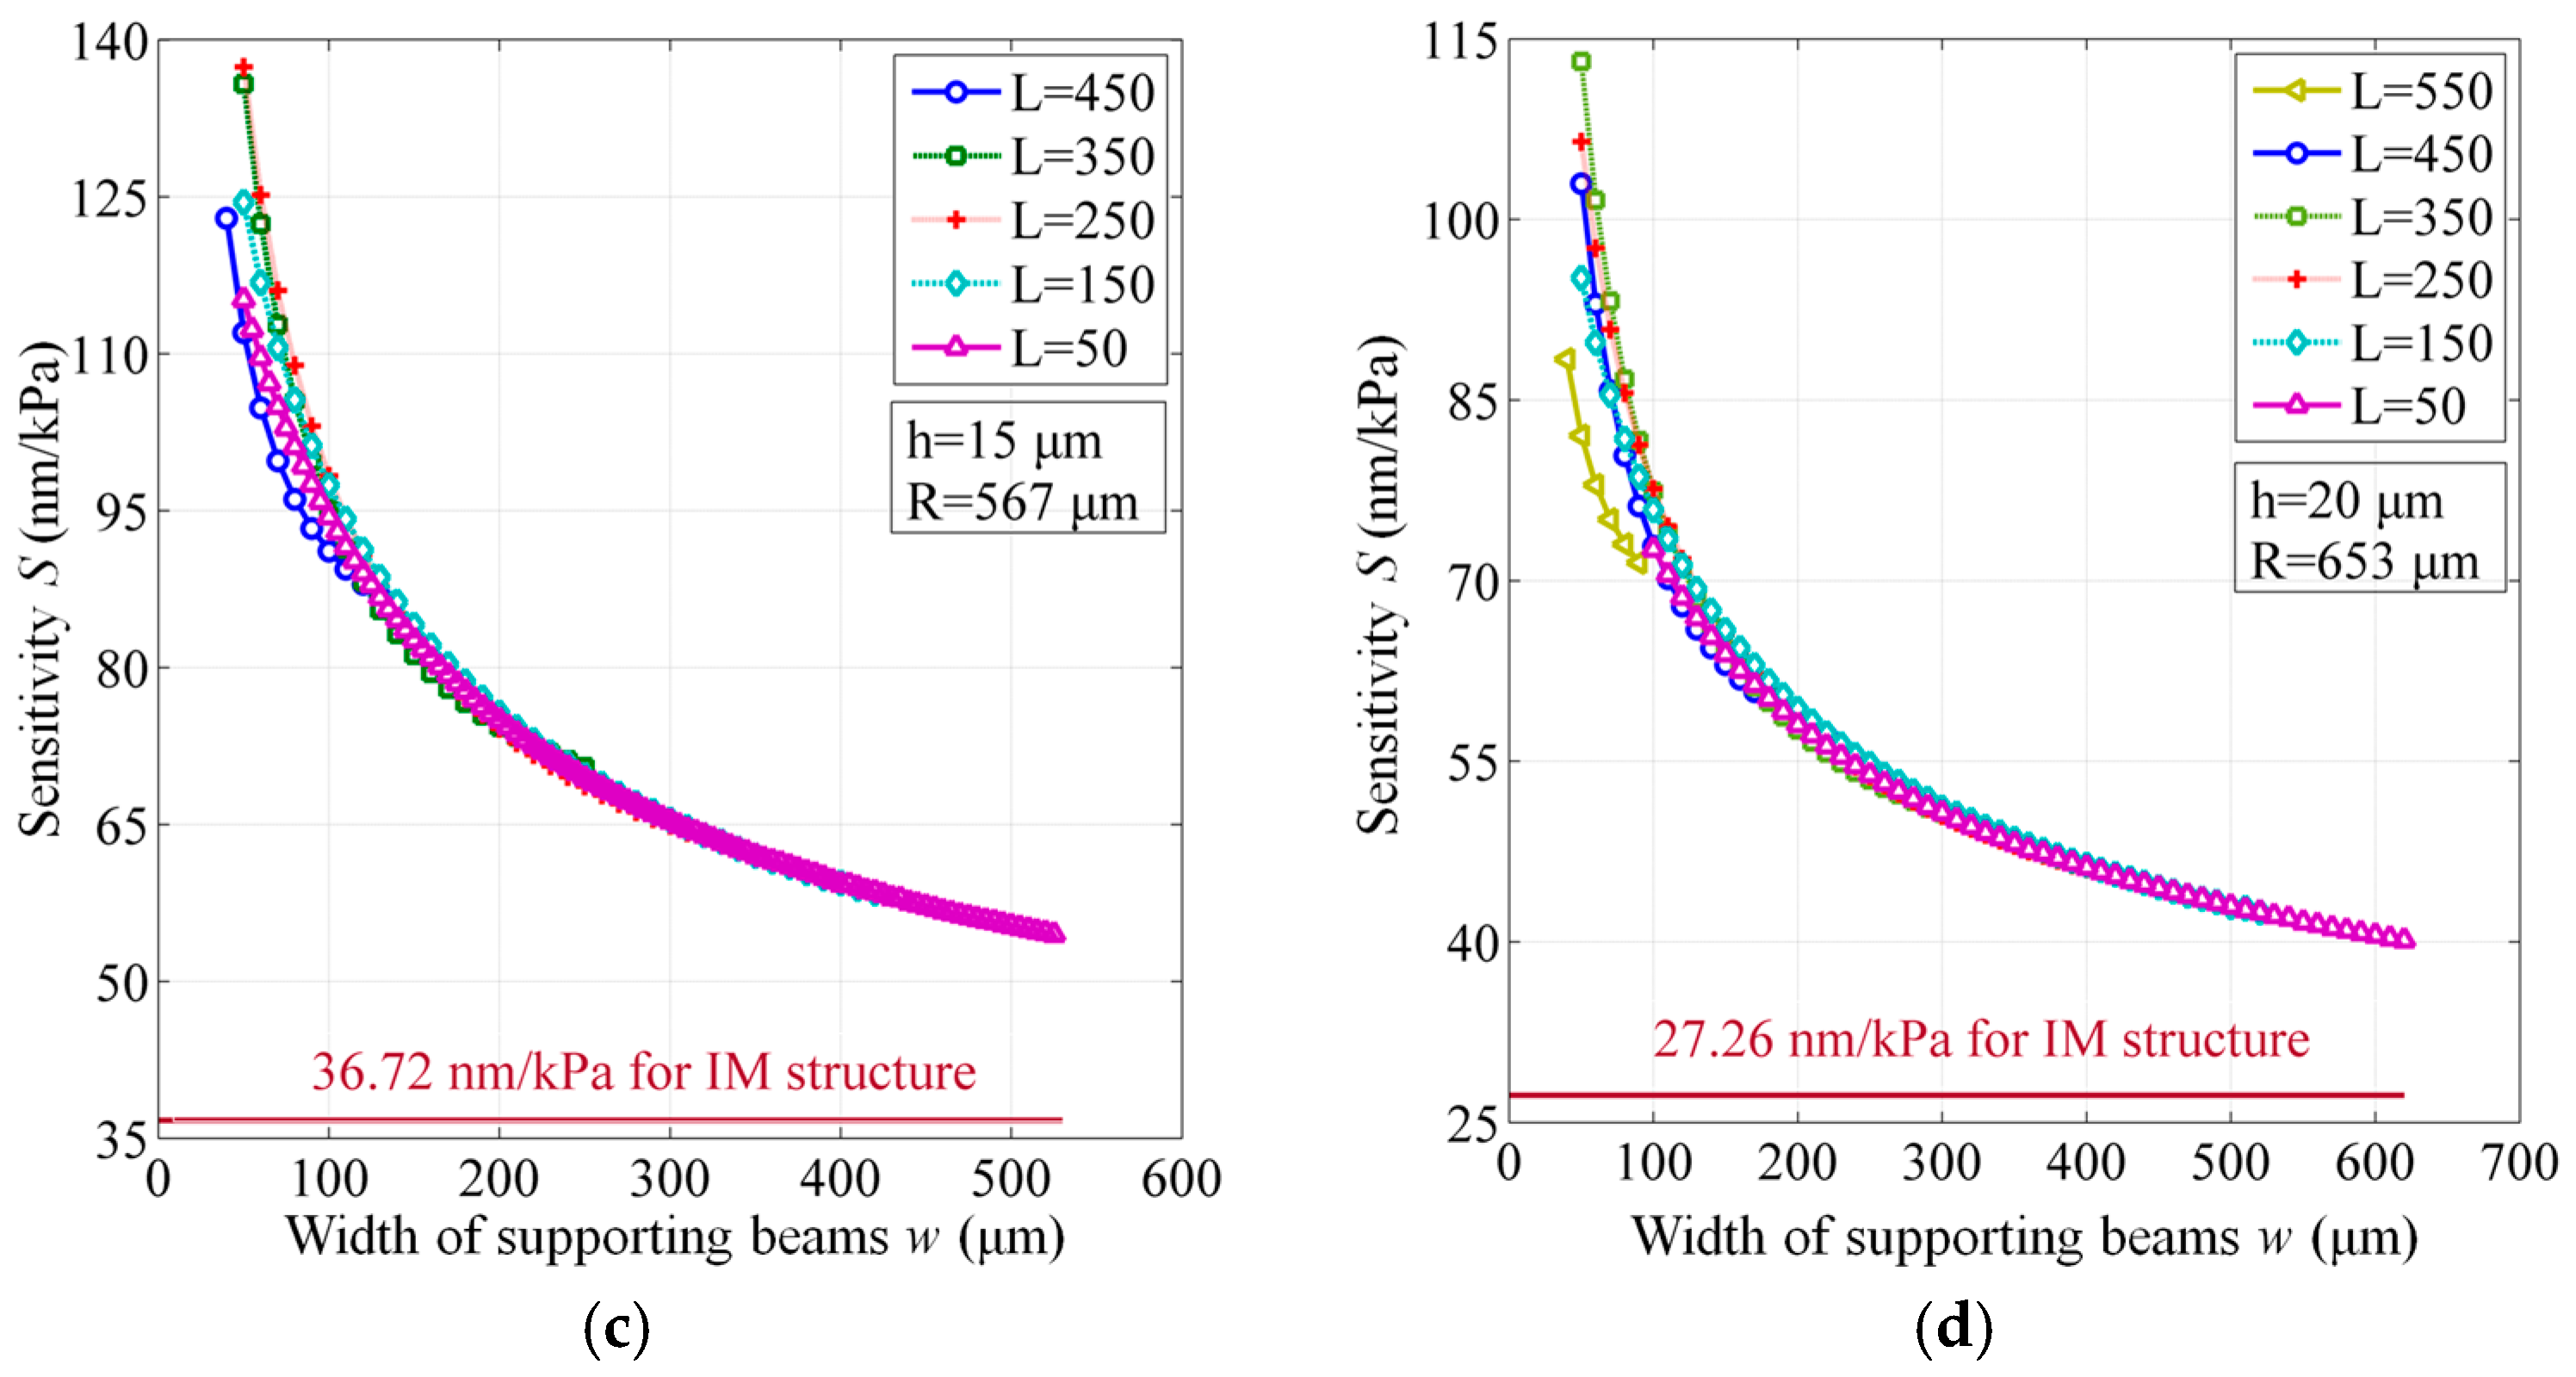
3.2. Sensitivity
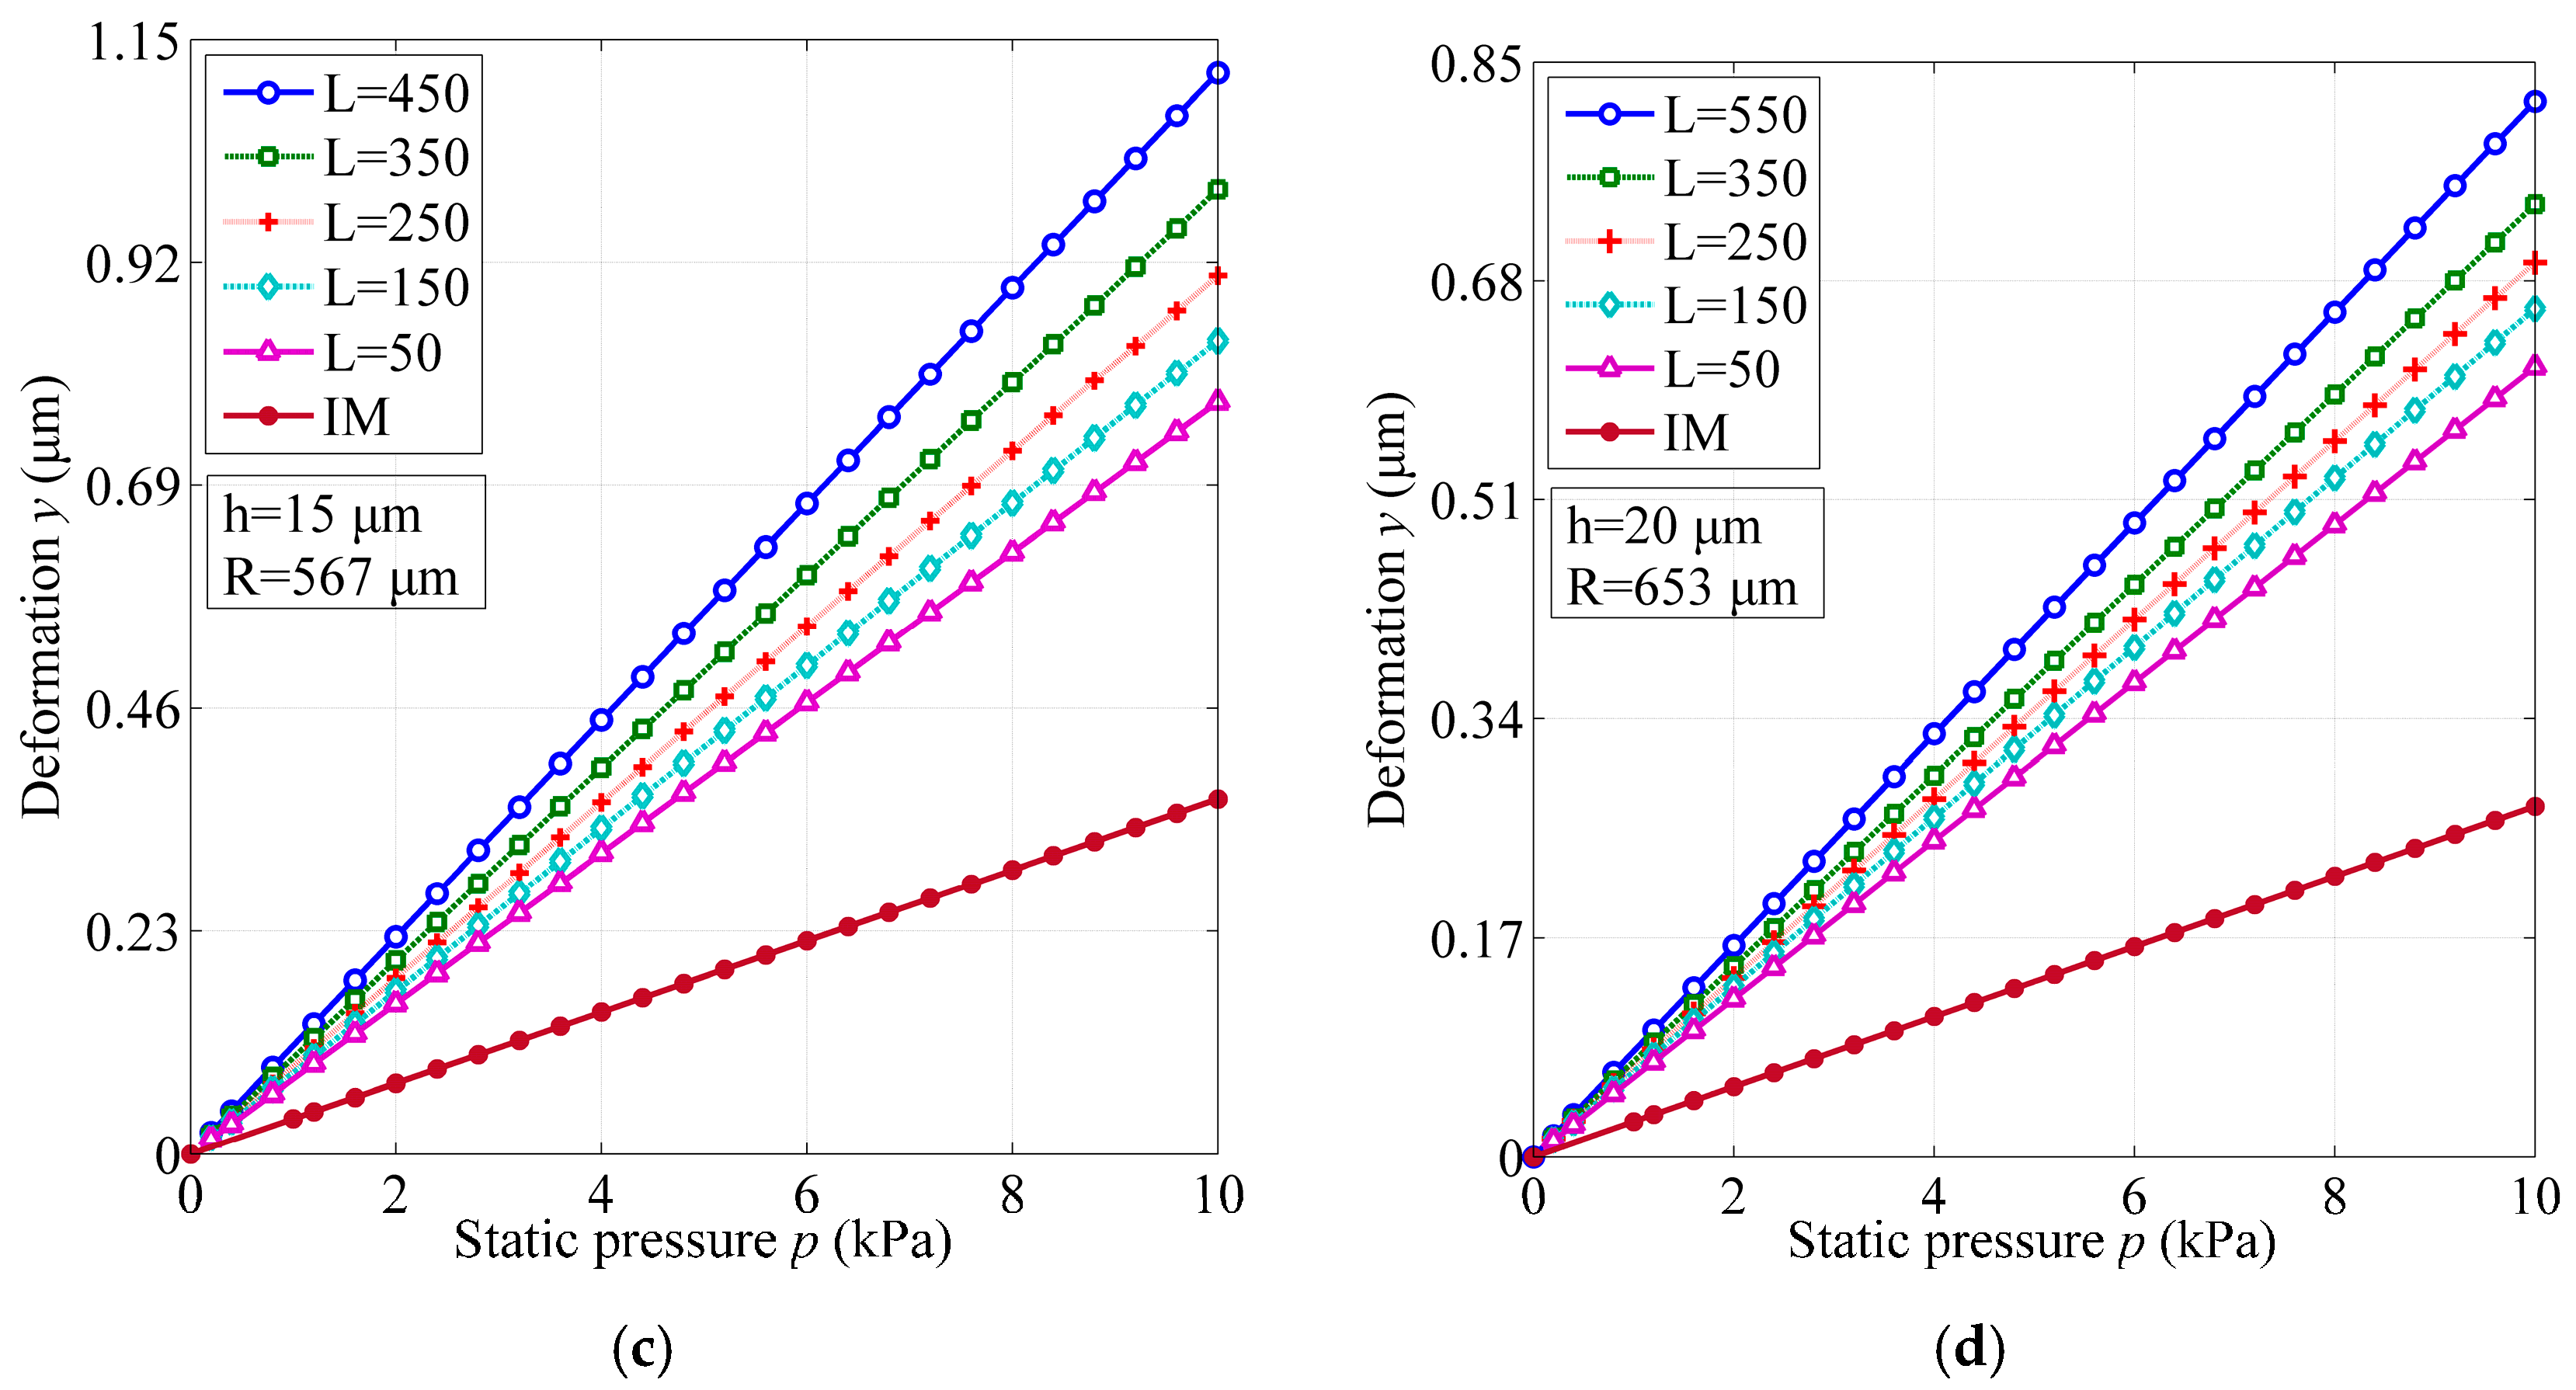
3.3. Linear Range
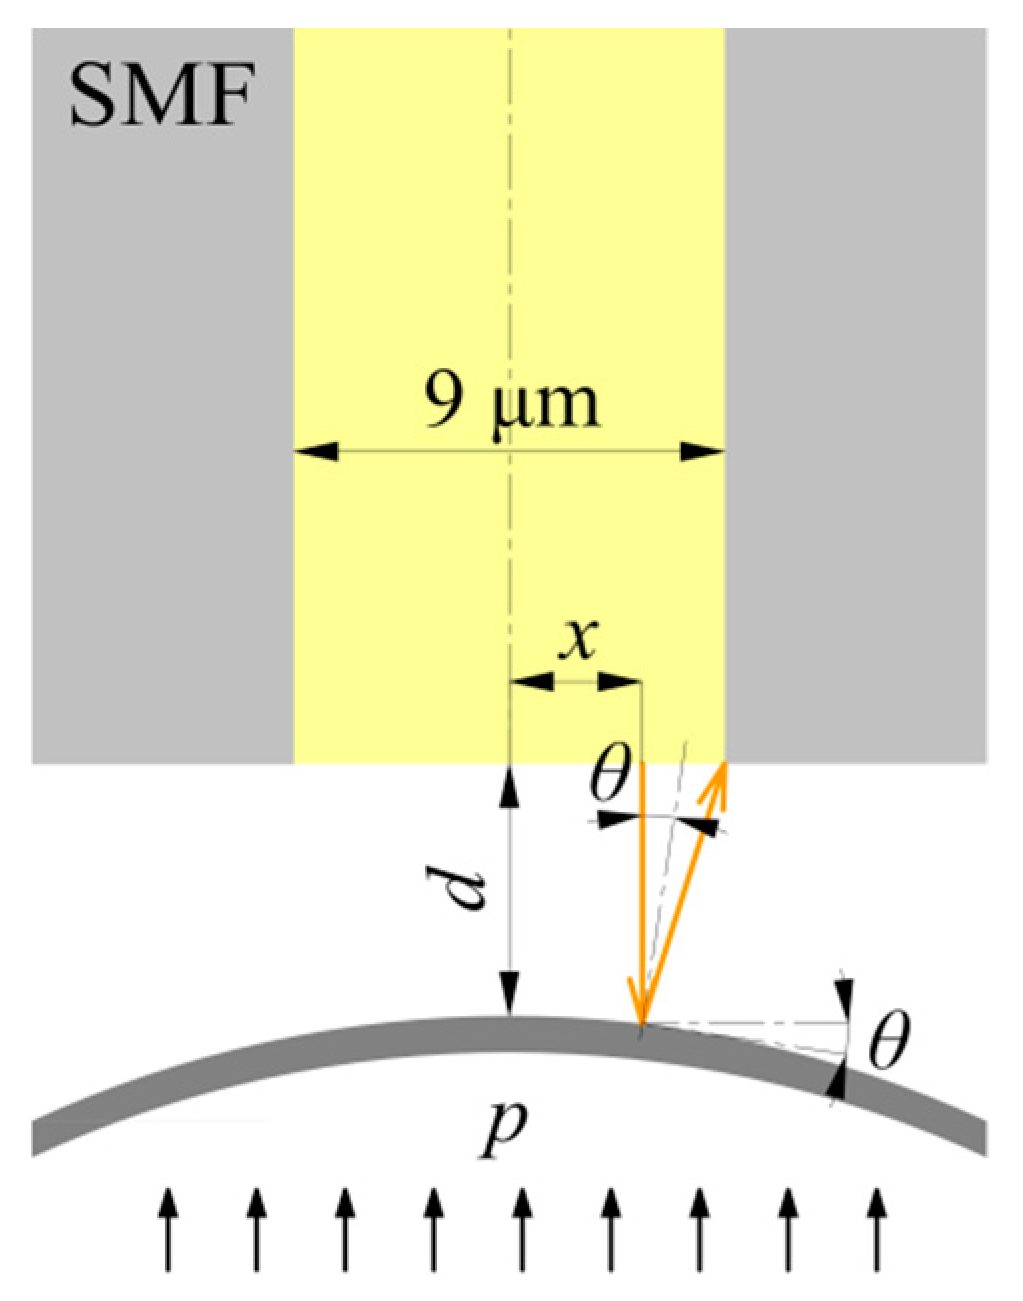
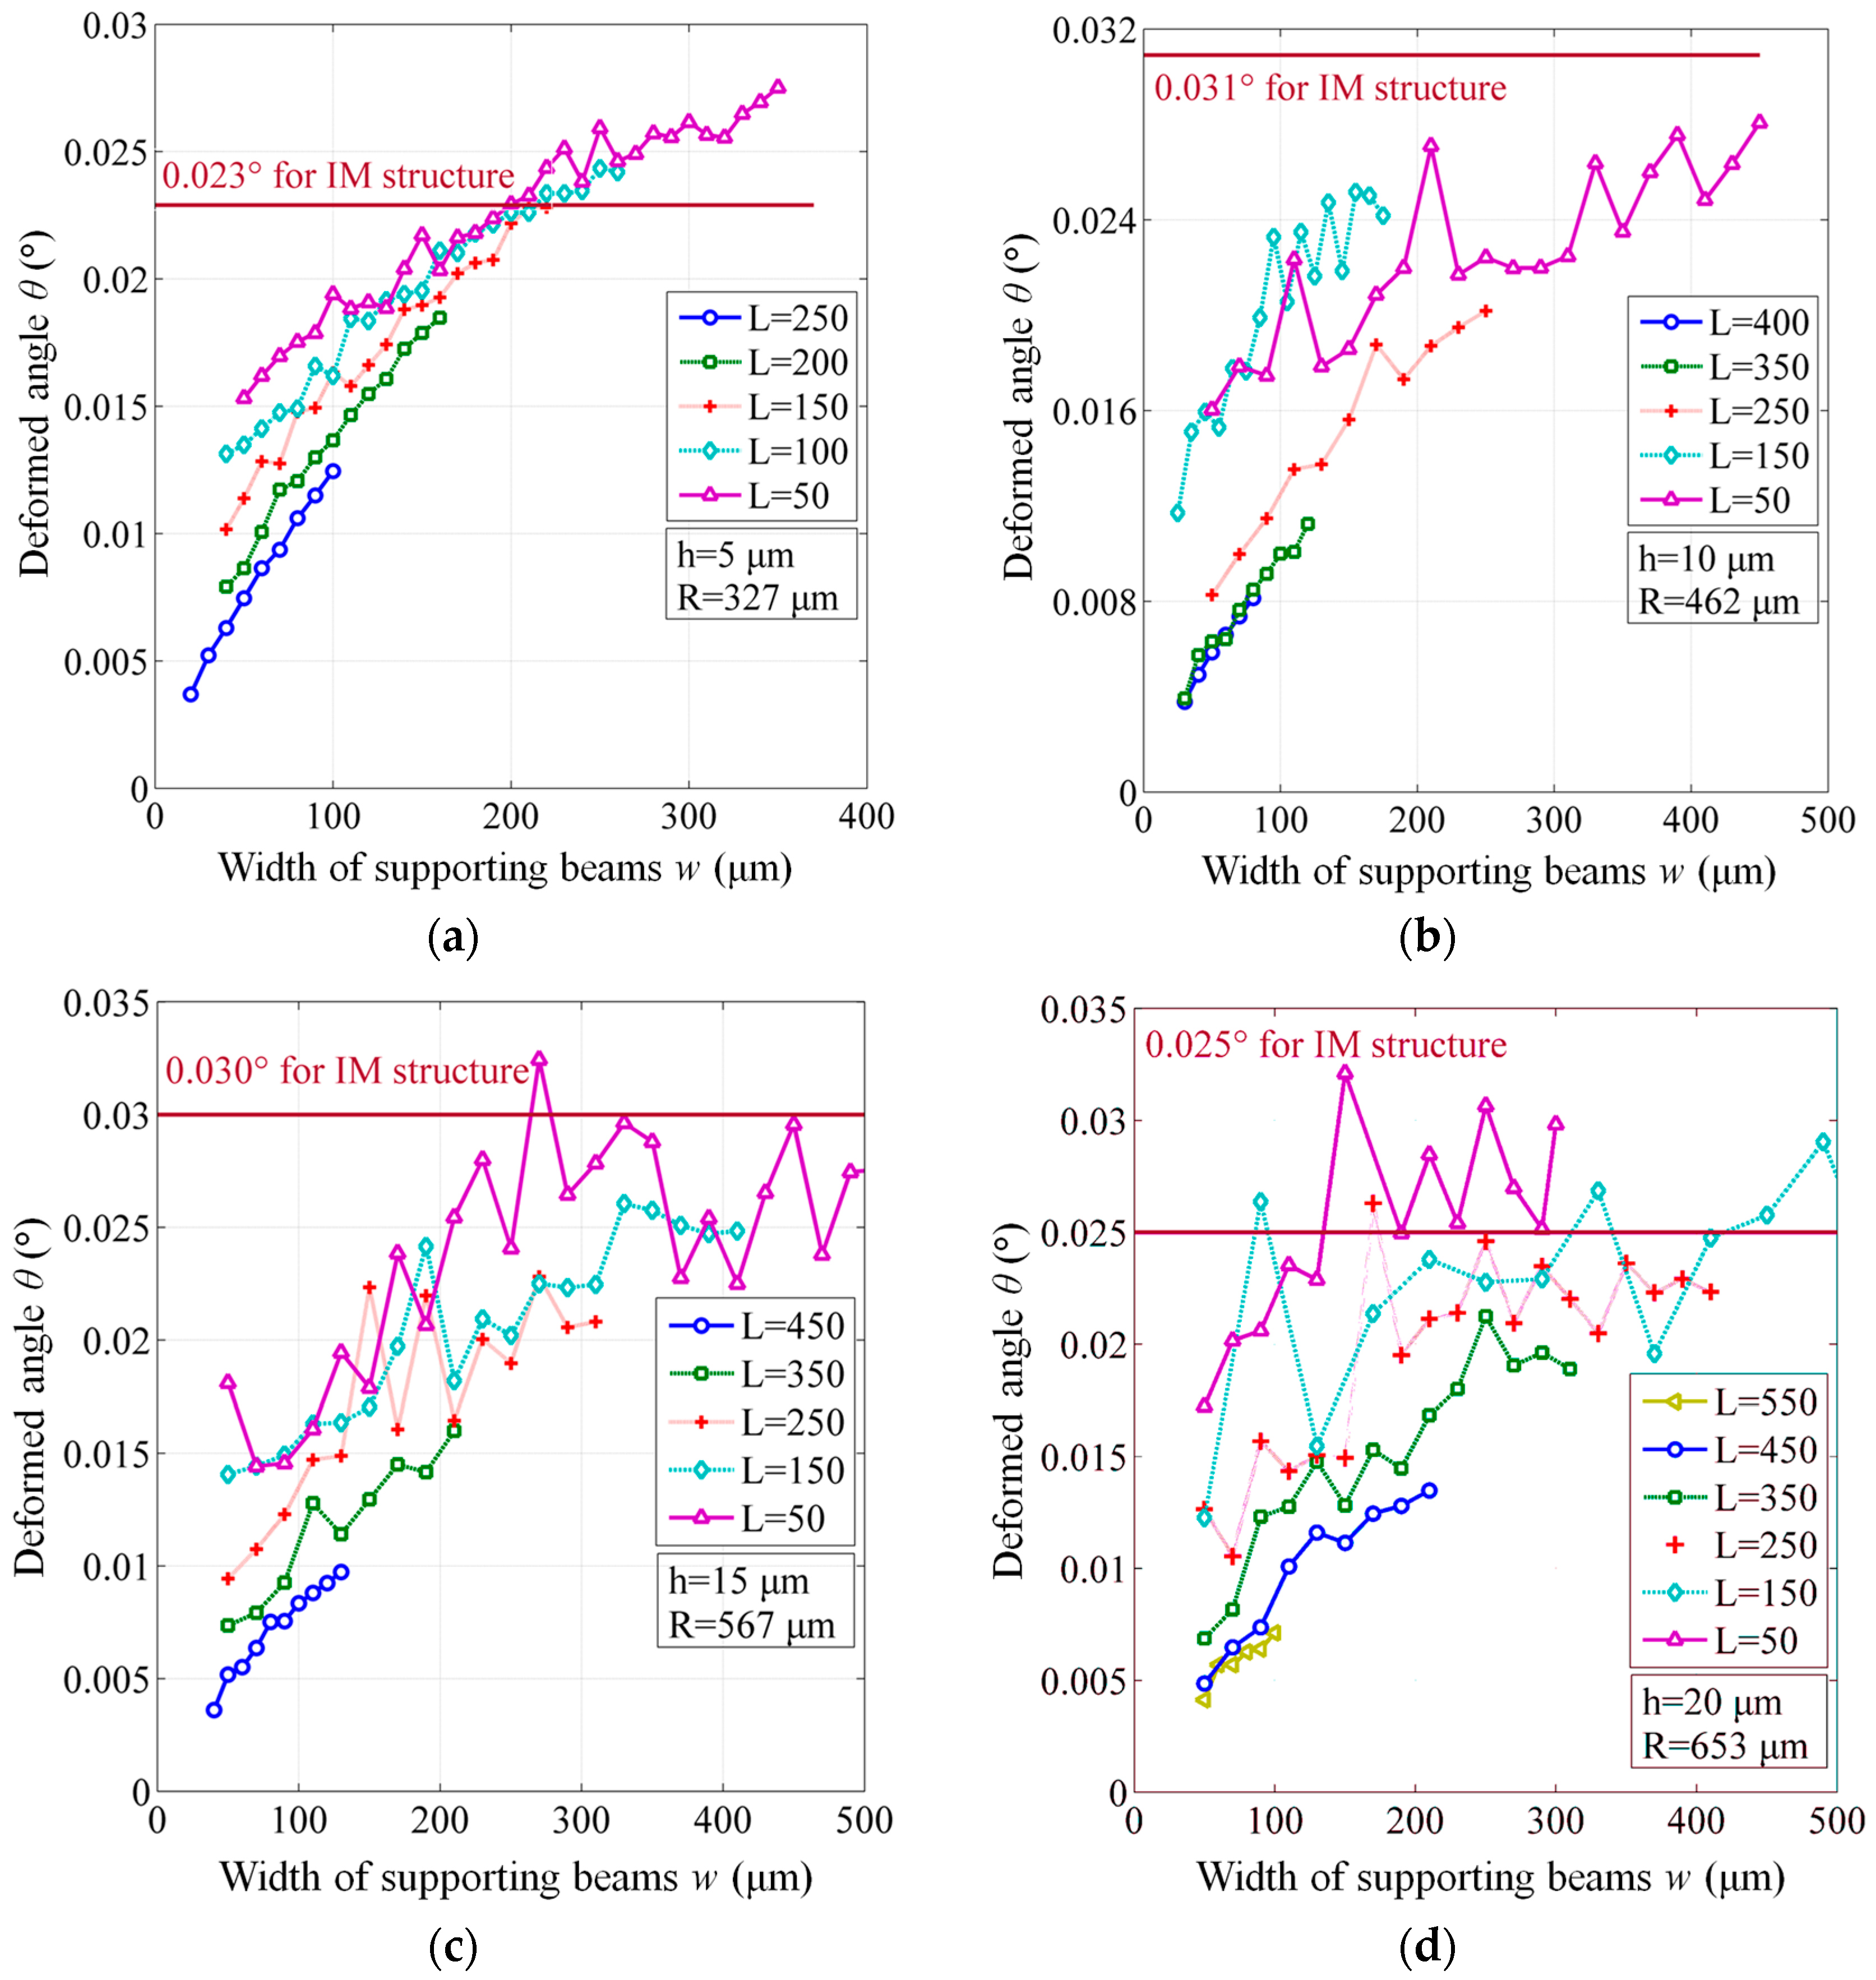
3.4. Flatness of Reflecting Area
4. Conclusions
Acknowledgments
Author Contributions
Conflicts of Interest
References
- Yu, B.; Kim, D.W.; Deng, J.; Xiao, H.; Wang, A. Fiber Fabry-Perot sensors for detection of partial discharges in power transformers. Appl. Opt. 2003, 42, 3241–3250. [Google Scholar] [CrossRef] [PubMed]
- Wang, Y.; Gong, S.; Grzybowski, S. Reliability evaluation method for oil–paper insulation in power transformers. Energies 2011, 4, 1362–1375. [Google Scholar] [CrossRef]
- Stone, G.C. Partial discharge and electrical equipment insulation condition assessment. IEEE Trans. Dielect. Electr. Insul. 2005, 12, 891–904. [Google Scholar] [CrossRef]
- Wang, Q.; Ma, Z. Feedback-stabilized interrogation technique for optical Fabry–Perot acoustic sensor using a tunable fiber laser. Opt. Laser Technol. 2013, 51, 43–46. [Google Scholar] [CrossRef]
- Wang, M.; Vandermaar, A.J.; Srivastava, K.D. Review of condition assessment of power transformers in service. IEEE Electr. Insul. Mag. 2002, 18, 12–25. [Google Scholar] [CrossRef]
- Yi, W.H.; Jin, T.; Xu, G.H. Research progress on F-P interference-based fiber-optic sensors. Sensors 2016, 16, 1424. [Google Scholar]
- Lundgaard, L.E. Partial discharge. XIII. Acoustic partial discharge detection-fundamental considerations. IEEE Electr. Insul. Mag. 1992, 84, 25–31. [Google Scholar] [CrossRef]
- Lundgaard, L.E. Partial discharge. XIV. Acoustic partial discharge detection-practical application. IEEE Electr. Insul. Mag. 1992, 8, 34–43. [Google Scholar] [CrossRef]
- Dong, B.; Han, M.; Sun, L.; Wang, J.; Wang, Y.; Wang, A. Sulfur hexafluoride-filled extrinsic Fabry–Perot interferometric fiber-optic sensors for partial discharge detection in transformers. IEEE Photon. Technol. Lett. 2008, 20, 1566–1568. [Google Scholar] [CrossRef]
- Gander, M.J.; MacPherson, W.N.; Barton, J.S.; Reuben, R.L.; Jones, J.D.C.; Stevens, R.; Chana, K.S.; Anderson, S.J.; Jones, T.V. Embedded micromachined fiber-optic Fabry-Perot pressure sensors in aerodynamics applications. IEEE Sens. J. 2003, 3, 102–107. [Google Scholar] [CrossRef]
- Islam, M.R.; Ali, M.M.; Lai, M.H.; Lim, K.S.; Ahmad, H. Chronology of Fabry-Perot interferometer fiber-optic sensors and their applications: a review. Sensors 2014, 14, 7451–7488. [Google Scholar] [CrossRef] [PubMed]
- Wang, X.; Li, B.; Xiao, Z.; Lee, S.H.; Roman, H.; Russo, O.L.; Chin, K.K.; Farmer, K.R. An ultra-sensitive optical MEMS sensor for partial discharge detection. J. Micromech. Microeng. 2005, 15, 521–527. [Google Scholar] [CrossRef]
- Li, X.; Shao, Y.; Yu, Y.; Zhang, Y.; Wei, S.A. Highly sensitive fiber-optic Fabry–Perot interferometer based on internal reflection mirrors for refractive index measurement. Sensors 2016, 16, 794. [Google Scholar] [CrossRef] [PubMed]
- Shang, Y.; Ni, Q.; Ding, D.; Chen, N.; Wang, T. Fabrication of optical fiber sensor based on double-layer SU-8 diaphragm and the partial discharge detection. Optoelectron. Lett. 2015, 11, 61–64. [Google Scholar] [CrossRef]
- Song, L.; Wang, Z.; Wang, A.; Liu, Y.; Cooper, K.L. Angular dependence of the frequency response of an extrinsic Fabry-Perot interferometric (EFPI) fiber acoustic sensor for partial discharge detection. J. Lightwave Technol. 2006, 24, 3433–3438. [Google Scholar] [CrossRef]
- Wang, X.; Xu, J.; Zhu, Y.; Cooper, K.L.; Wang, A. All-fused-silica miniature optical fiber tip pressure sensor. Opt. Lett. 2006, 31, 885–887. [Google Scholar] [CrossRef] [PubMed]
- Zhu, J.; Wang, M.; Shen, M.; Chen, L.; Ni, X. An optical fiber Fabry–Perot pressure sensor using a SU-8 Structure and angle polished fiber. IEEE Photon. Technol. Lett. 2015, 27, 2087–2090. [Google Scholar] [CrossRef]
- Giovanni, M.D. Flat and corrugated diaphragm design handbook. J. Mech. Work. Technol. 1983, 8, 93–94. [Google Scholar]
- Wang, W.; Yu, Q.; Jiang, X. High sensitivity diaphragm-based extrinsic Fabry–Perot interferometric optical fiber underwater ultrasonic sensor. Adv. Mater. Rapid Commun. 2012, 6, 697–702. [Google Scholar]
- Posada-Roman, J.; Garcia-Souto, J.A.; Rubio-Serrano, J. Fiber optic sensor for acoustic detection of partial discharges in oil-paper insulated electrical systems. Sensors 2012, 12, 4793–4802. [Google Scholar] [CrossRef] [PubMed]


| Thickness h (μm) | Radius R (μm) | Frequency f (kHz) | Sensitivity S (nm/kPa) | Linear Range (%) | Flatness θ (°) | ||||
|---|---|---|---|---|---|---|---|---|---|
| IM | BSM | IM | BSM | IM | BSM | IM | BSM | ||
| 5 | 327 | 180 | 152.9–76.81 | 109.2 | 411.1–149.6 | 25 | 30 | 0.023 | 0.028–0.004 |
| 10 | 462 | 146.9–77.53 | 54.59 | 202.9–79.75 | 24 | 28 | 0.031 | 0.028–0.004 | |
| 15 | 567 | 145.1–95.58 | 36.72 | 115.2–54.48 | 24 | 27 | 0.030 | 0.032–0.003 | |
| 20 | 653 | 146.6–72.75 | 27.26 | 137.4–40.13 | 24 | 26 | 0.025 | 0.032–0.004 | |
© 2017 by the authors. Licensee MDPI, Basel, Switzerland. This article is an open access article distributed under the terms and conditions of the Creative Commons Attribution (CC BY) license ( http://creativecommons.org/licenses/by/4.0/).
Share and Cite
Fu, C.; Si, W.; Li, H.; Li, D.; Yuan, P.; Yu, Y. A Novel High-Performance Beam-Supported Membrane Structure with Enhanced Design Flexibility for Partial Discharge Detection. Sensors 2017, 17, 593. https://doi.org/10.3390/s17030593
Fu C, Si W, Li H, Li D, Yuan P, Yu Y. A Novel High-Performance Beam-Supported Membrane Structure with Enhanced Design Flexibility for Partial Discharge Detection. Sensors. 2017; 17(3):593. https://doi.org/10.3390/s17030593
Chicago/Turabian StyleFu, Chenzhao, Wenrong Si, Haoyong Li, Delin Li, Peng Yuan, and Yiting Yu. 2017. "A Novel High-Performance Beam-Supported Membrane Structure with Enhanced Design Flexibility for Partial Discharge Detection" Sensors 17, no. 3: 593. https://doi.org/10.3390/s17030593