
DNA Sequencing Sensors: An Overview

 ,
, 
 and
and 
Abstract
:1. Introduction
2. Short-Read Sequencing
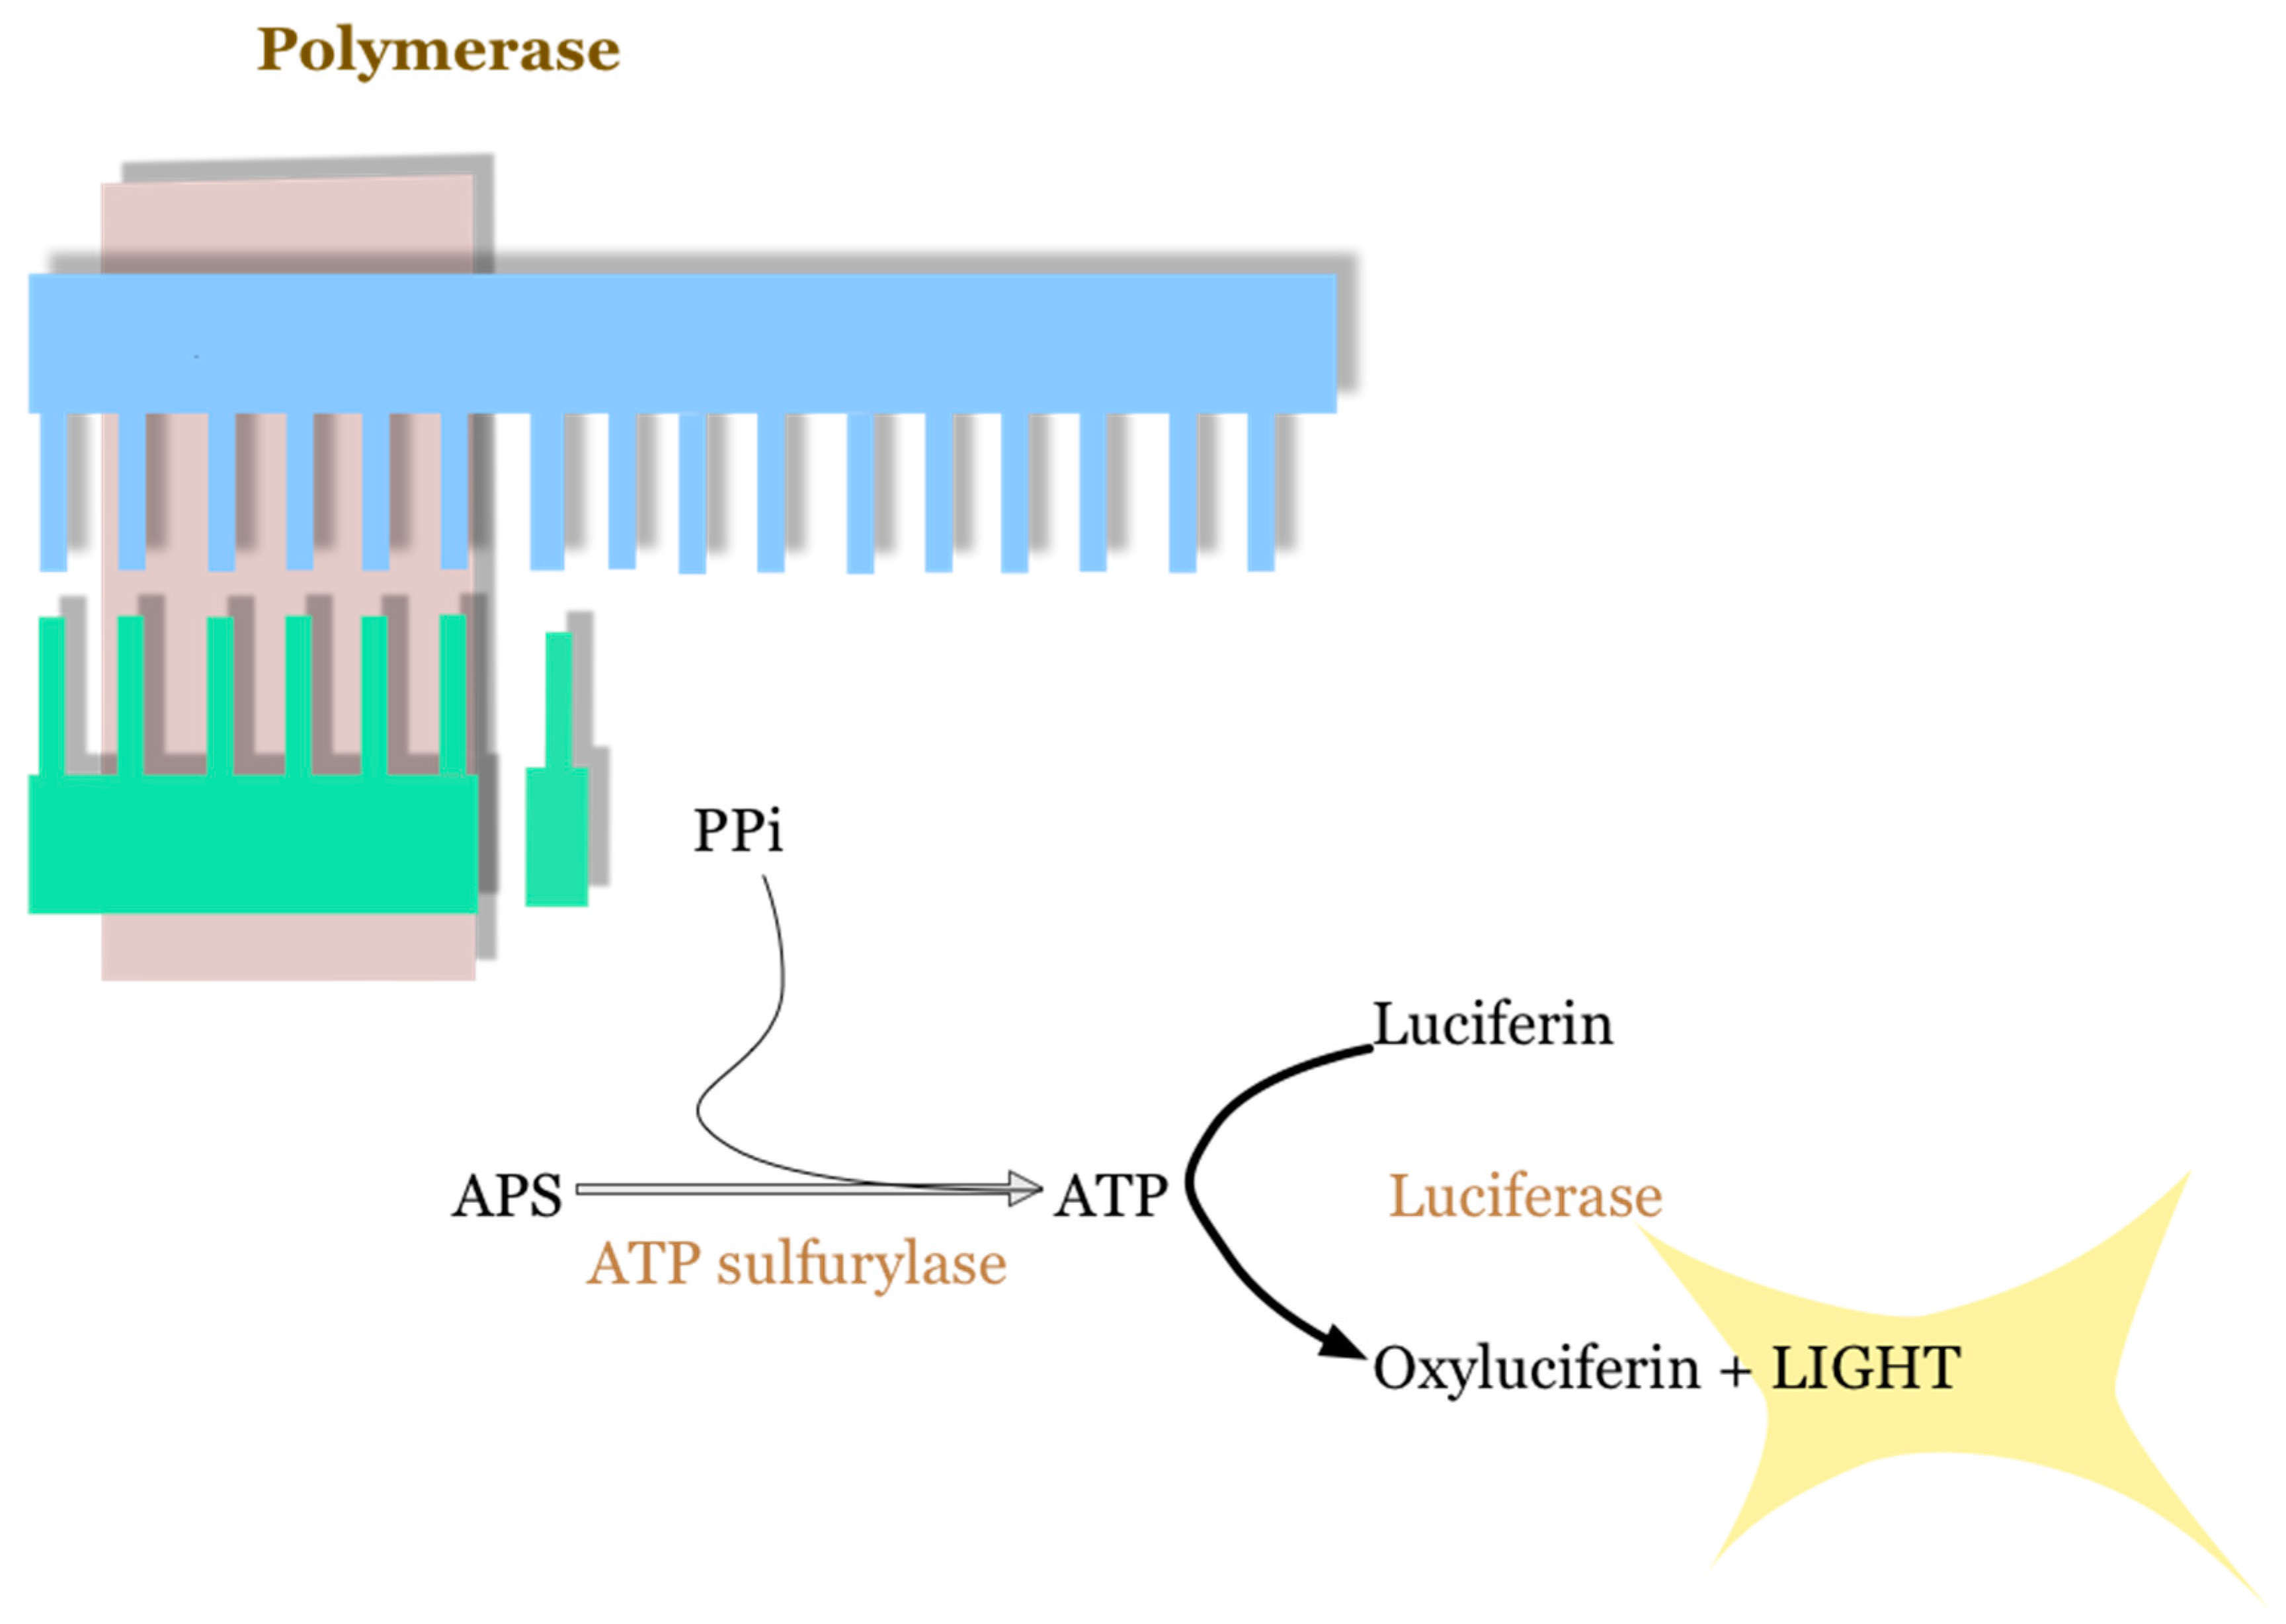
2.1. 454 Roche Platform
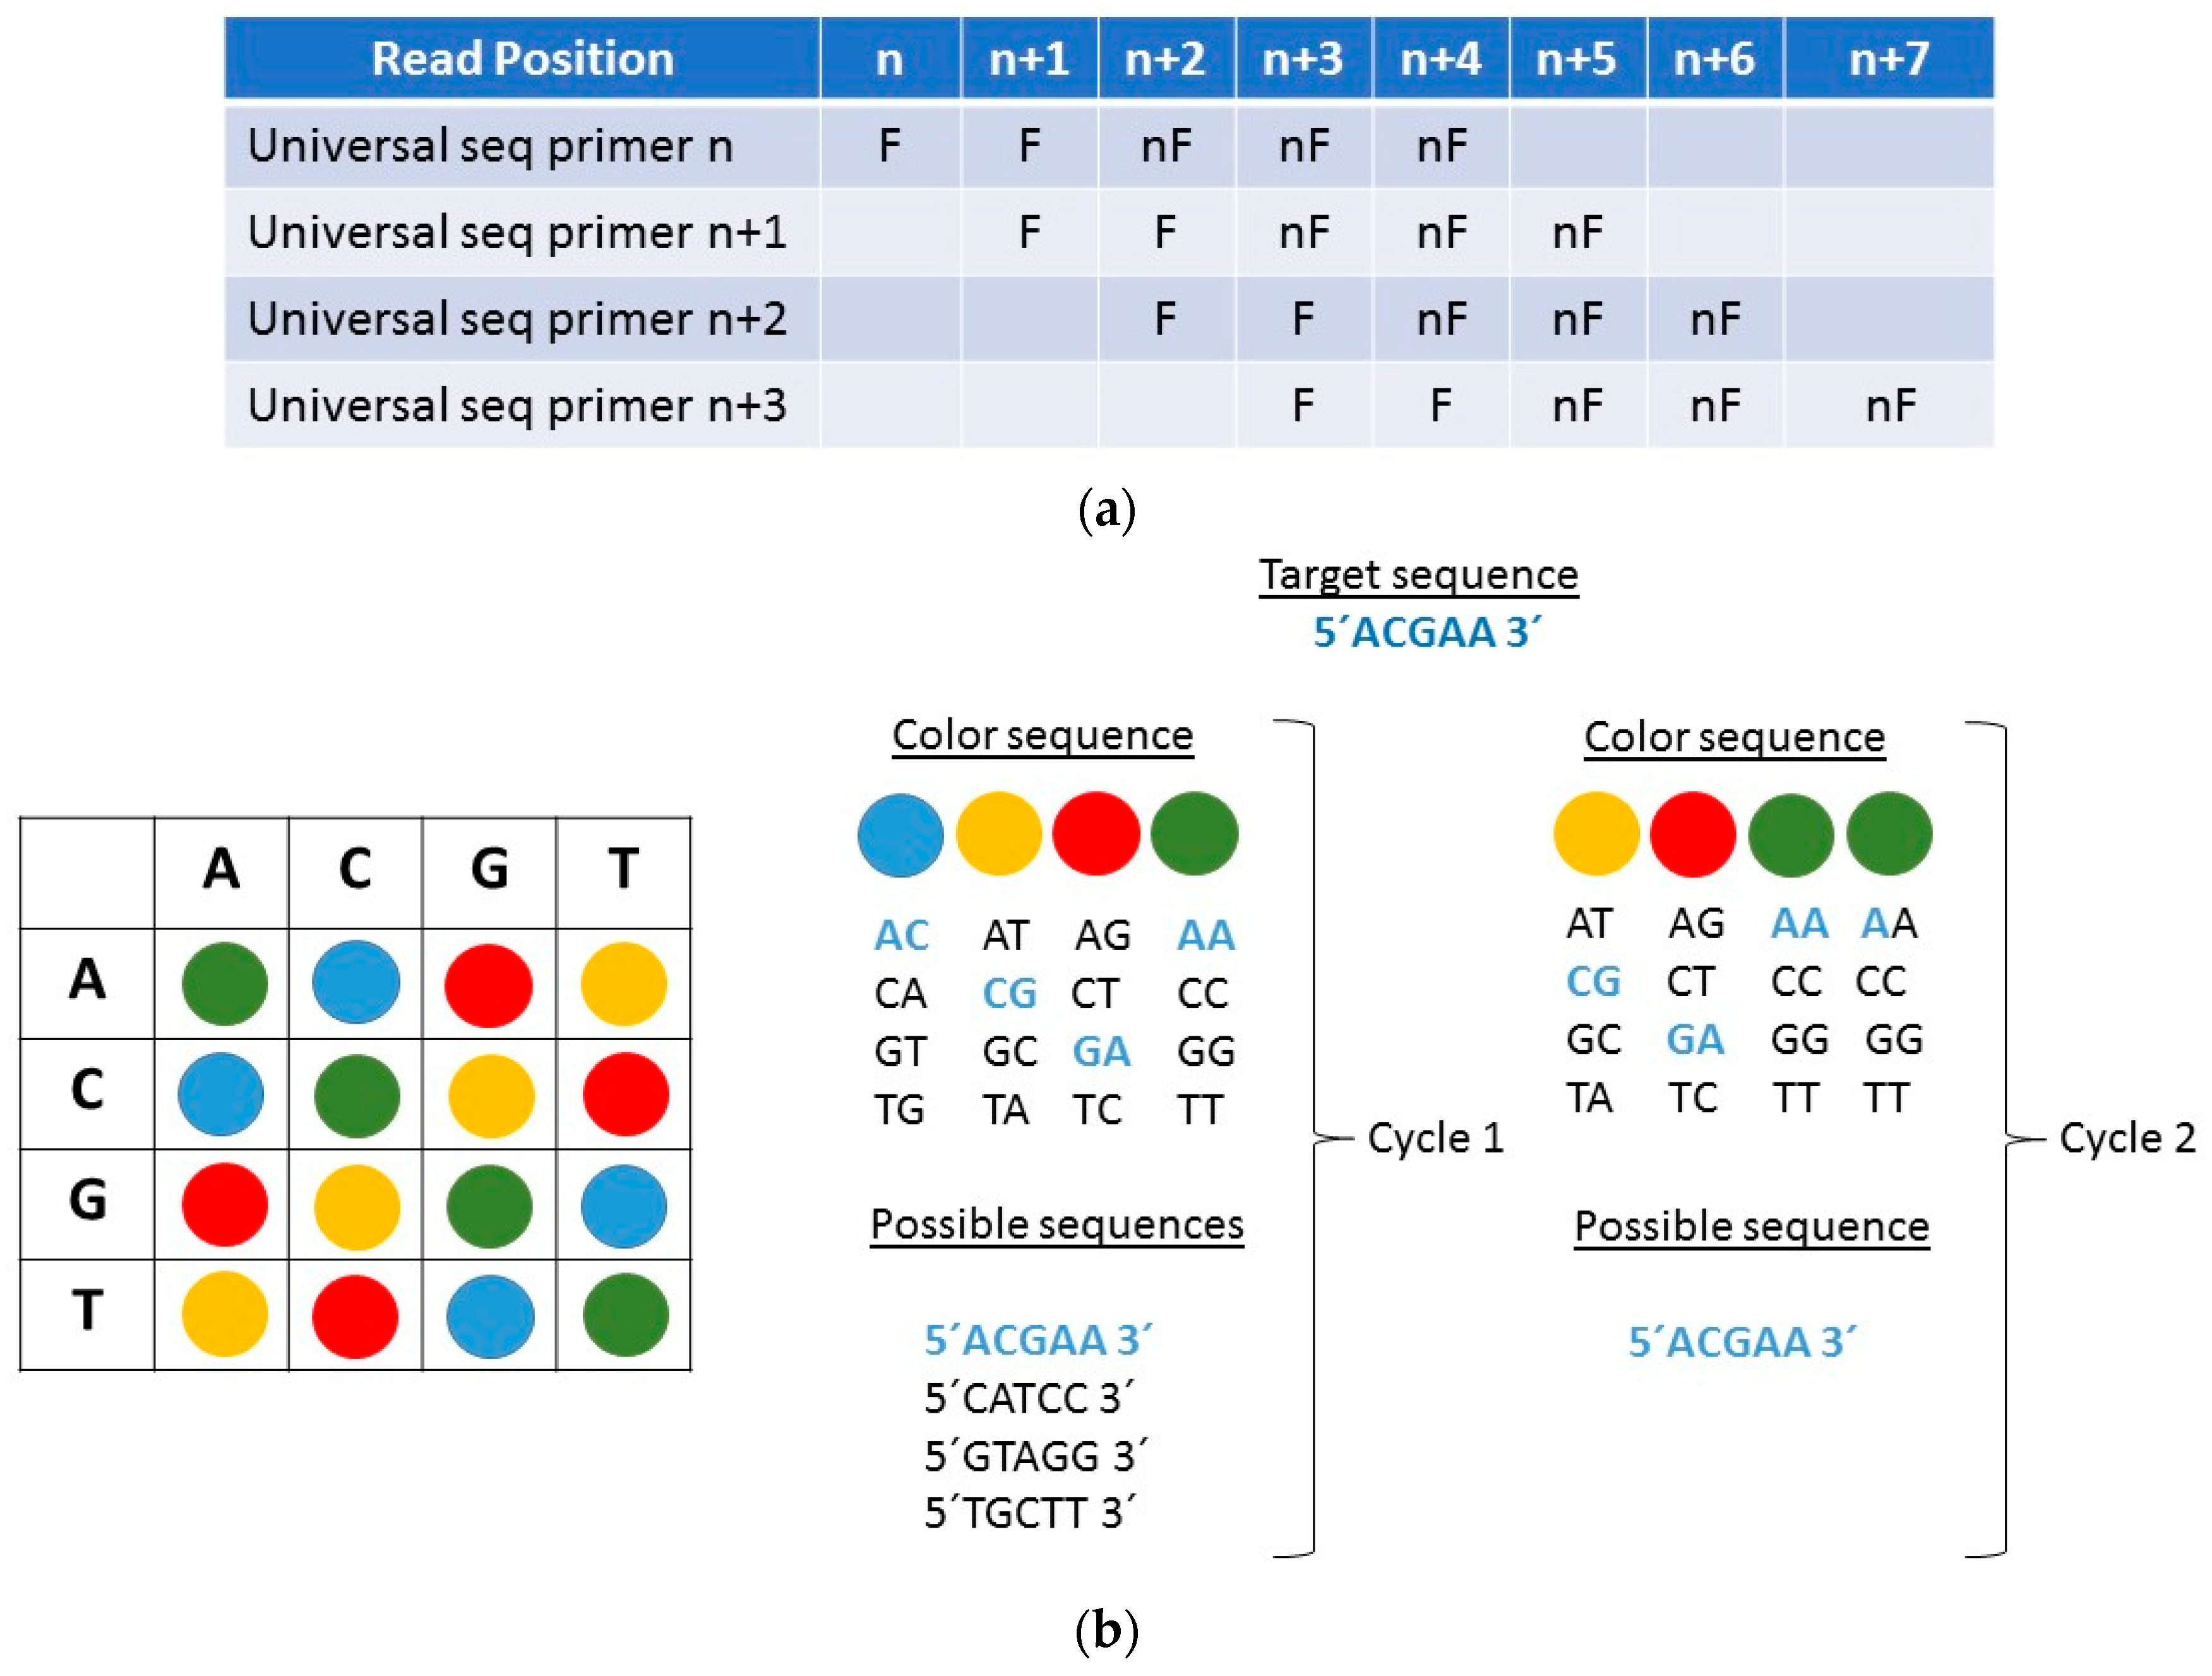
2.2. AB SOLiD Platform
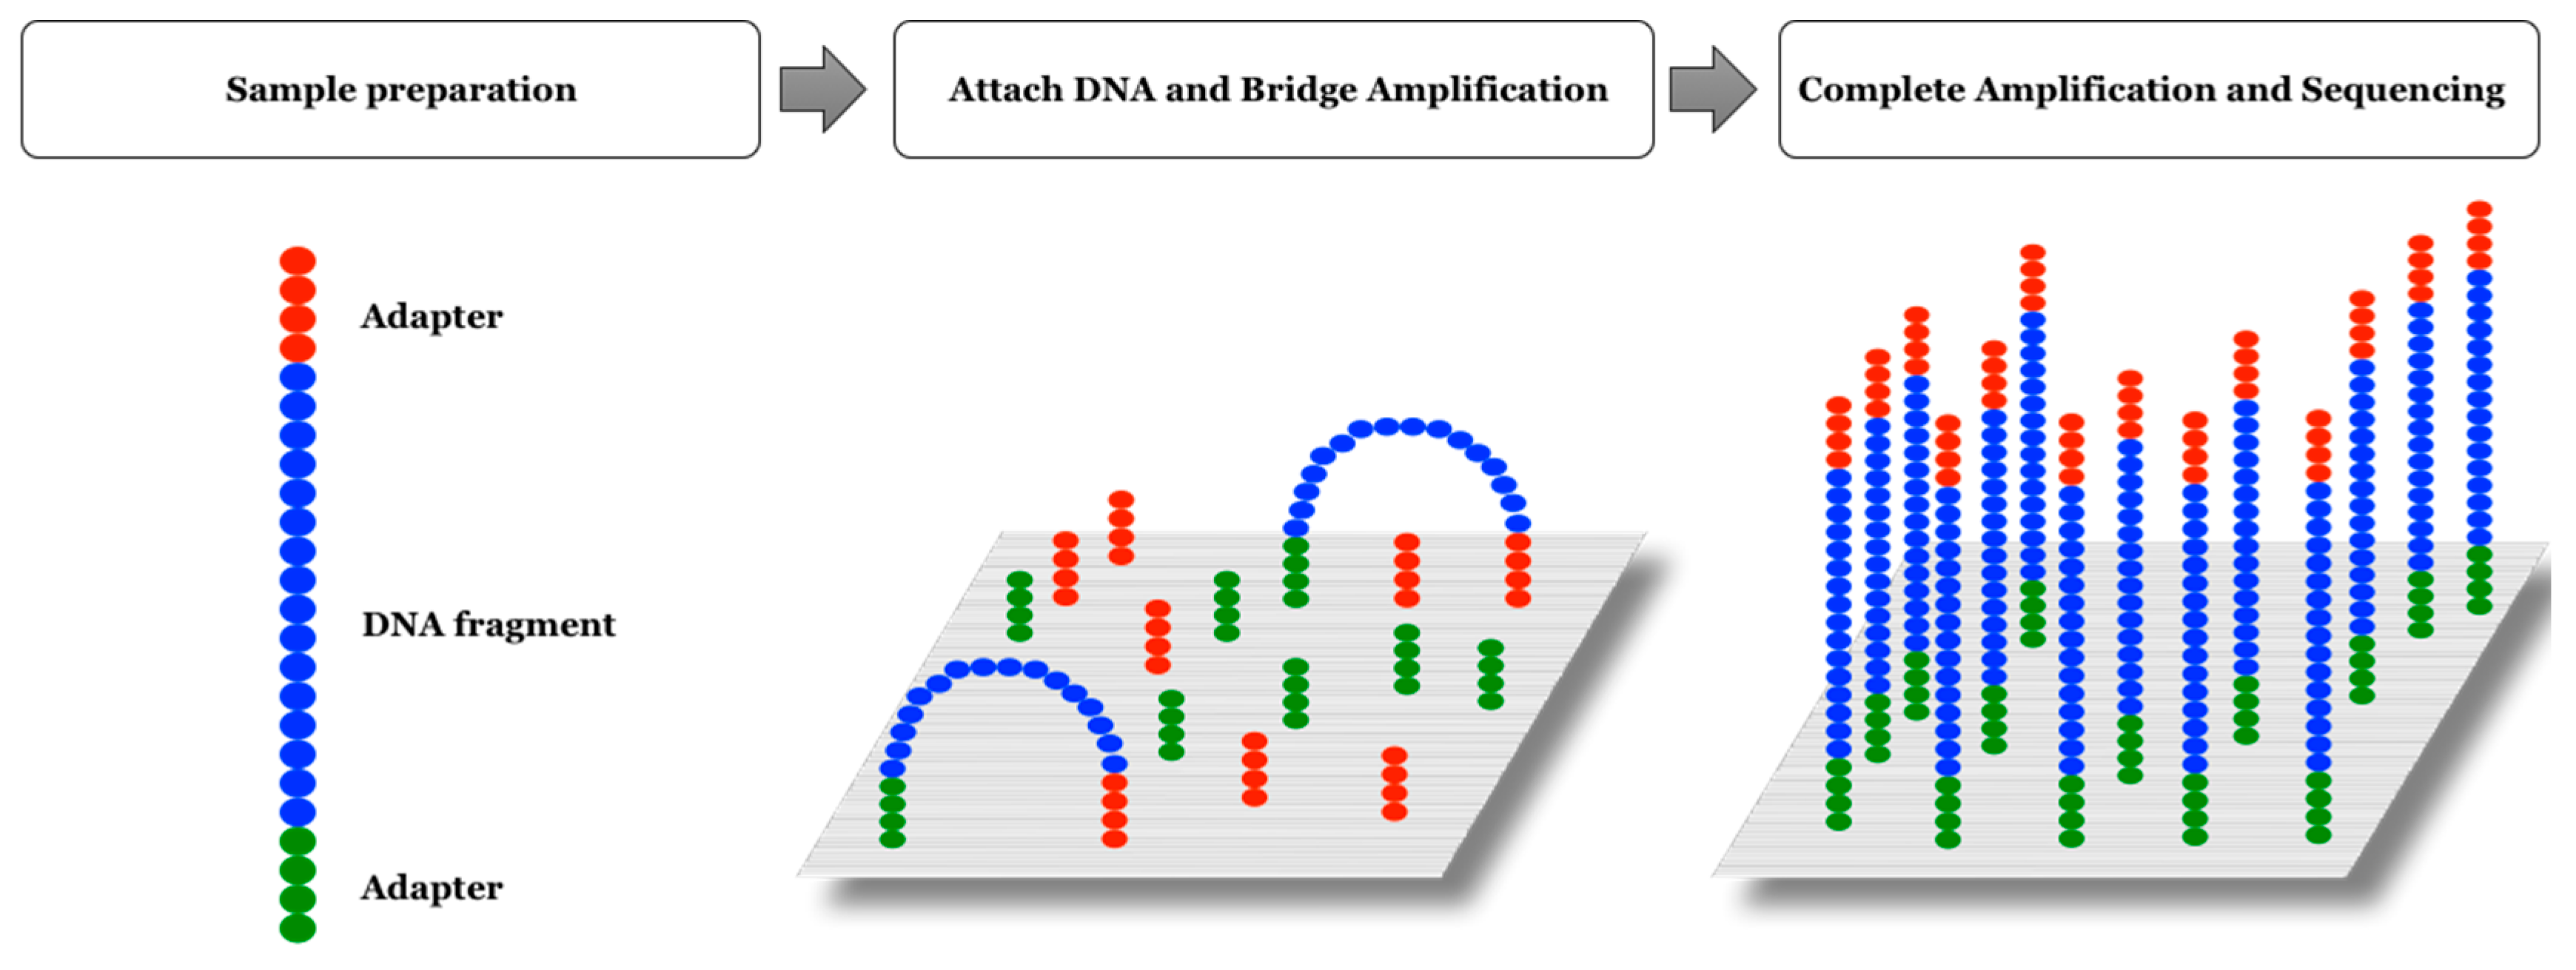
2.3. Illumina Platform
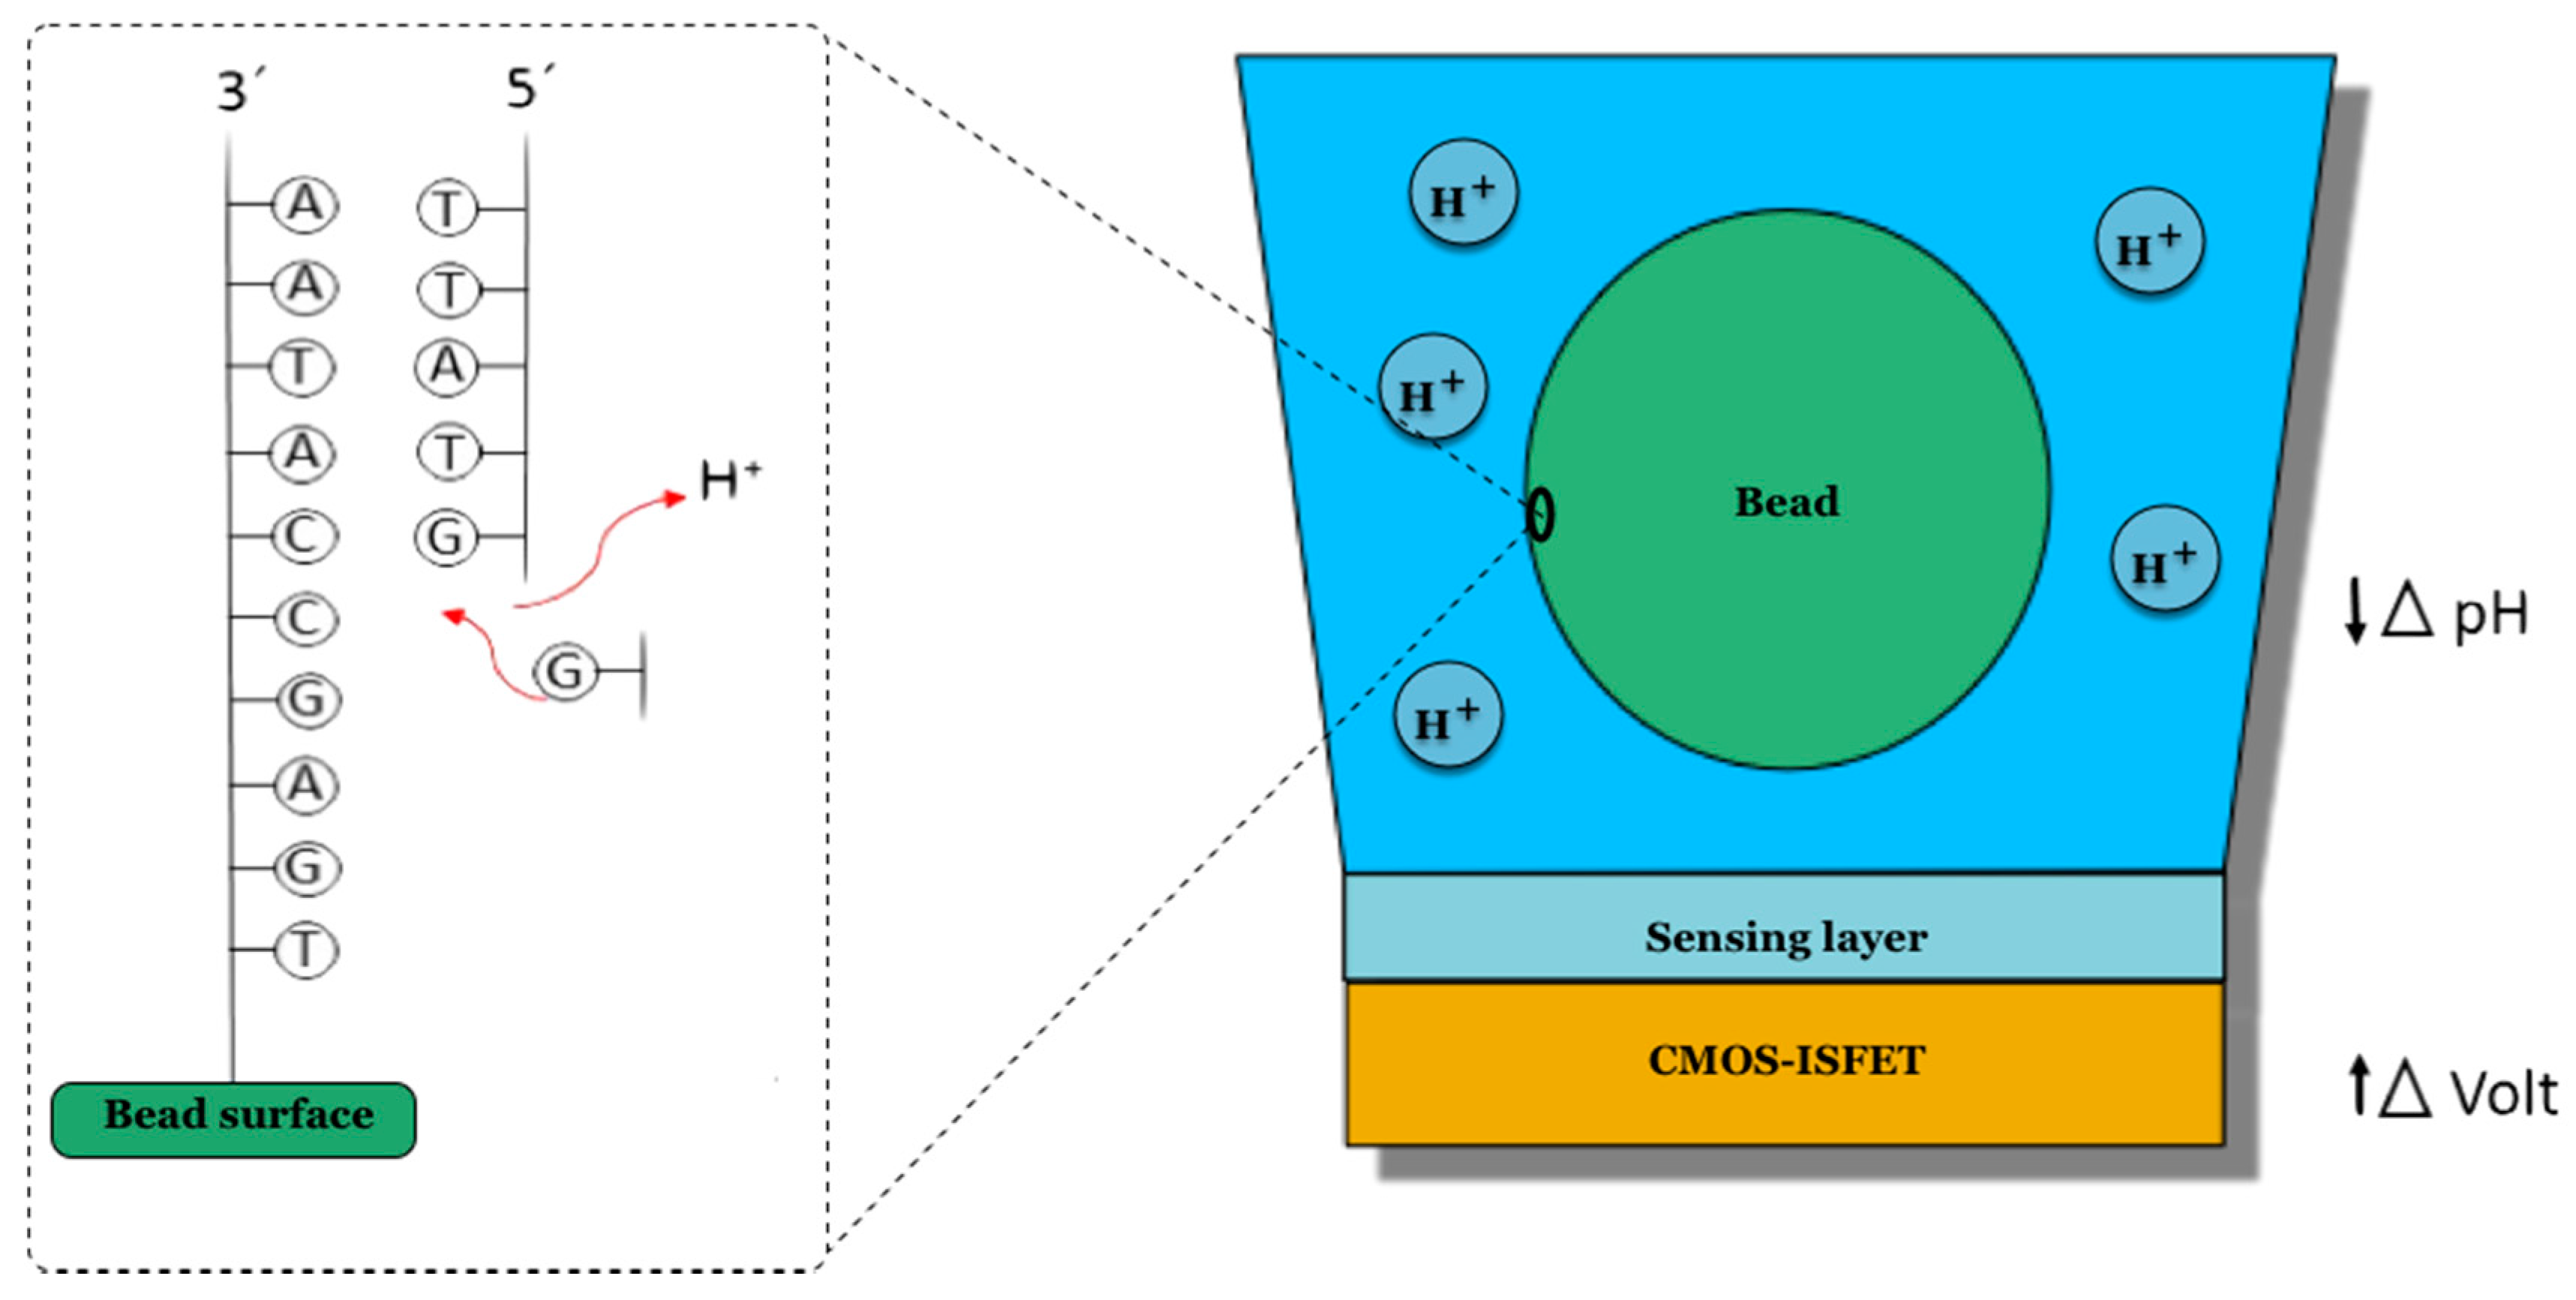
2.4. Ion Torrent Platform
3. Single-Molecule Real-Time Long Read Sequencing
3.1. Pacific Bioscence Platform
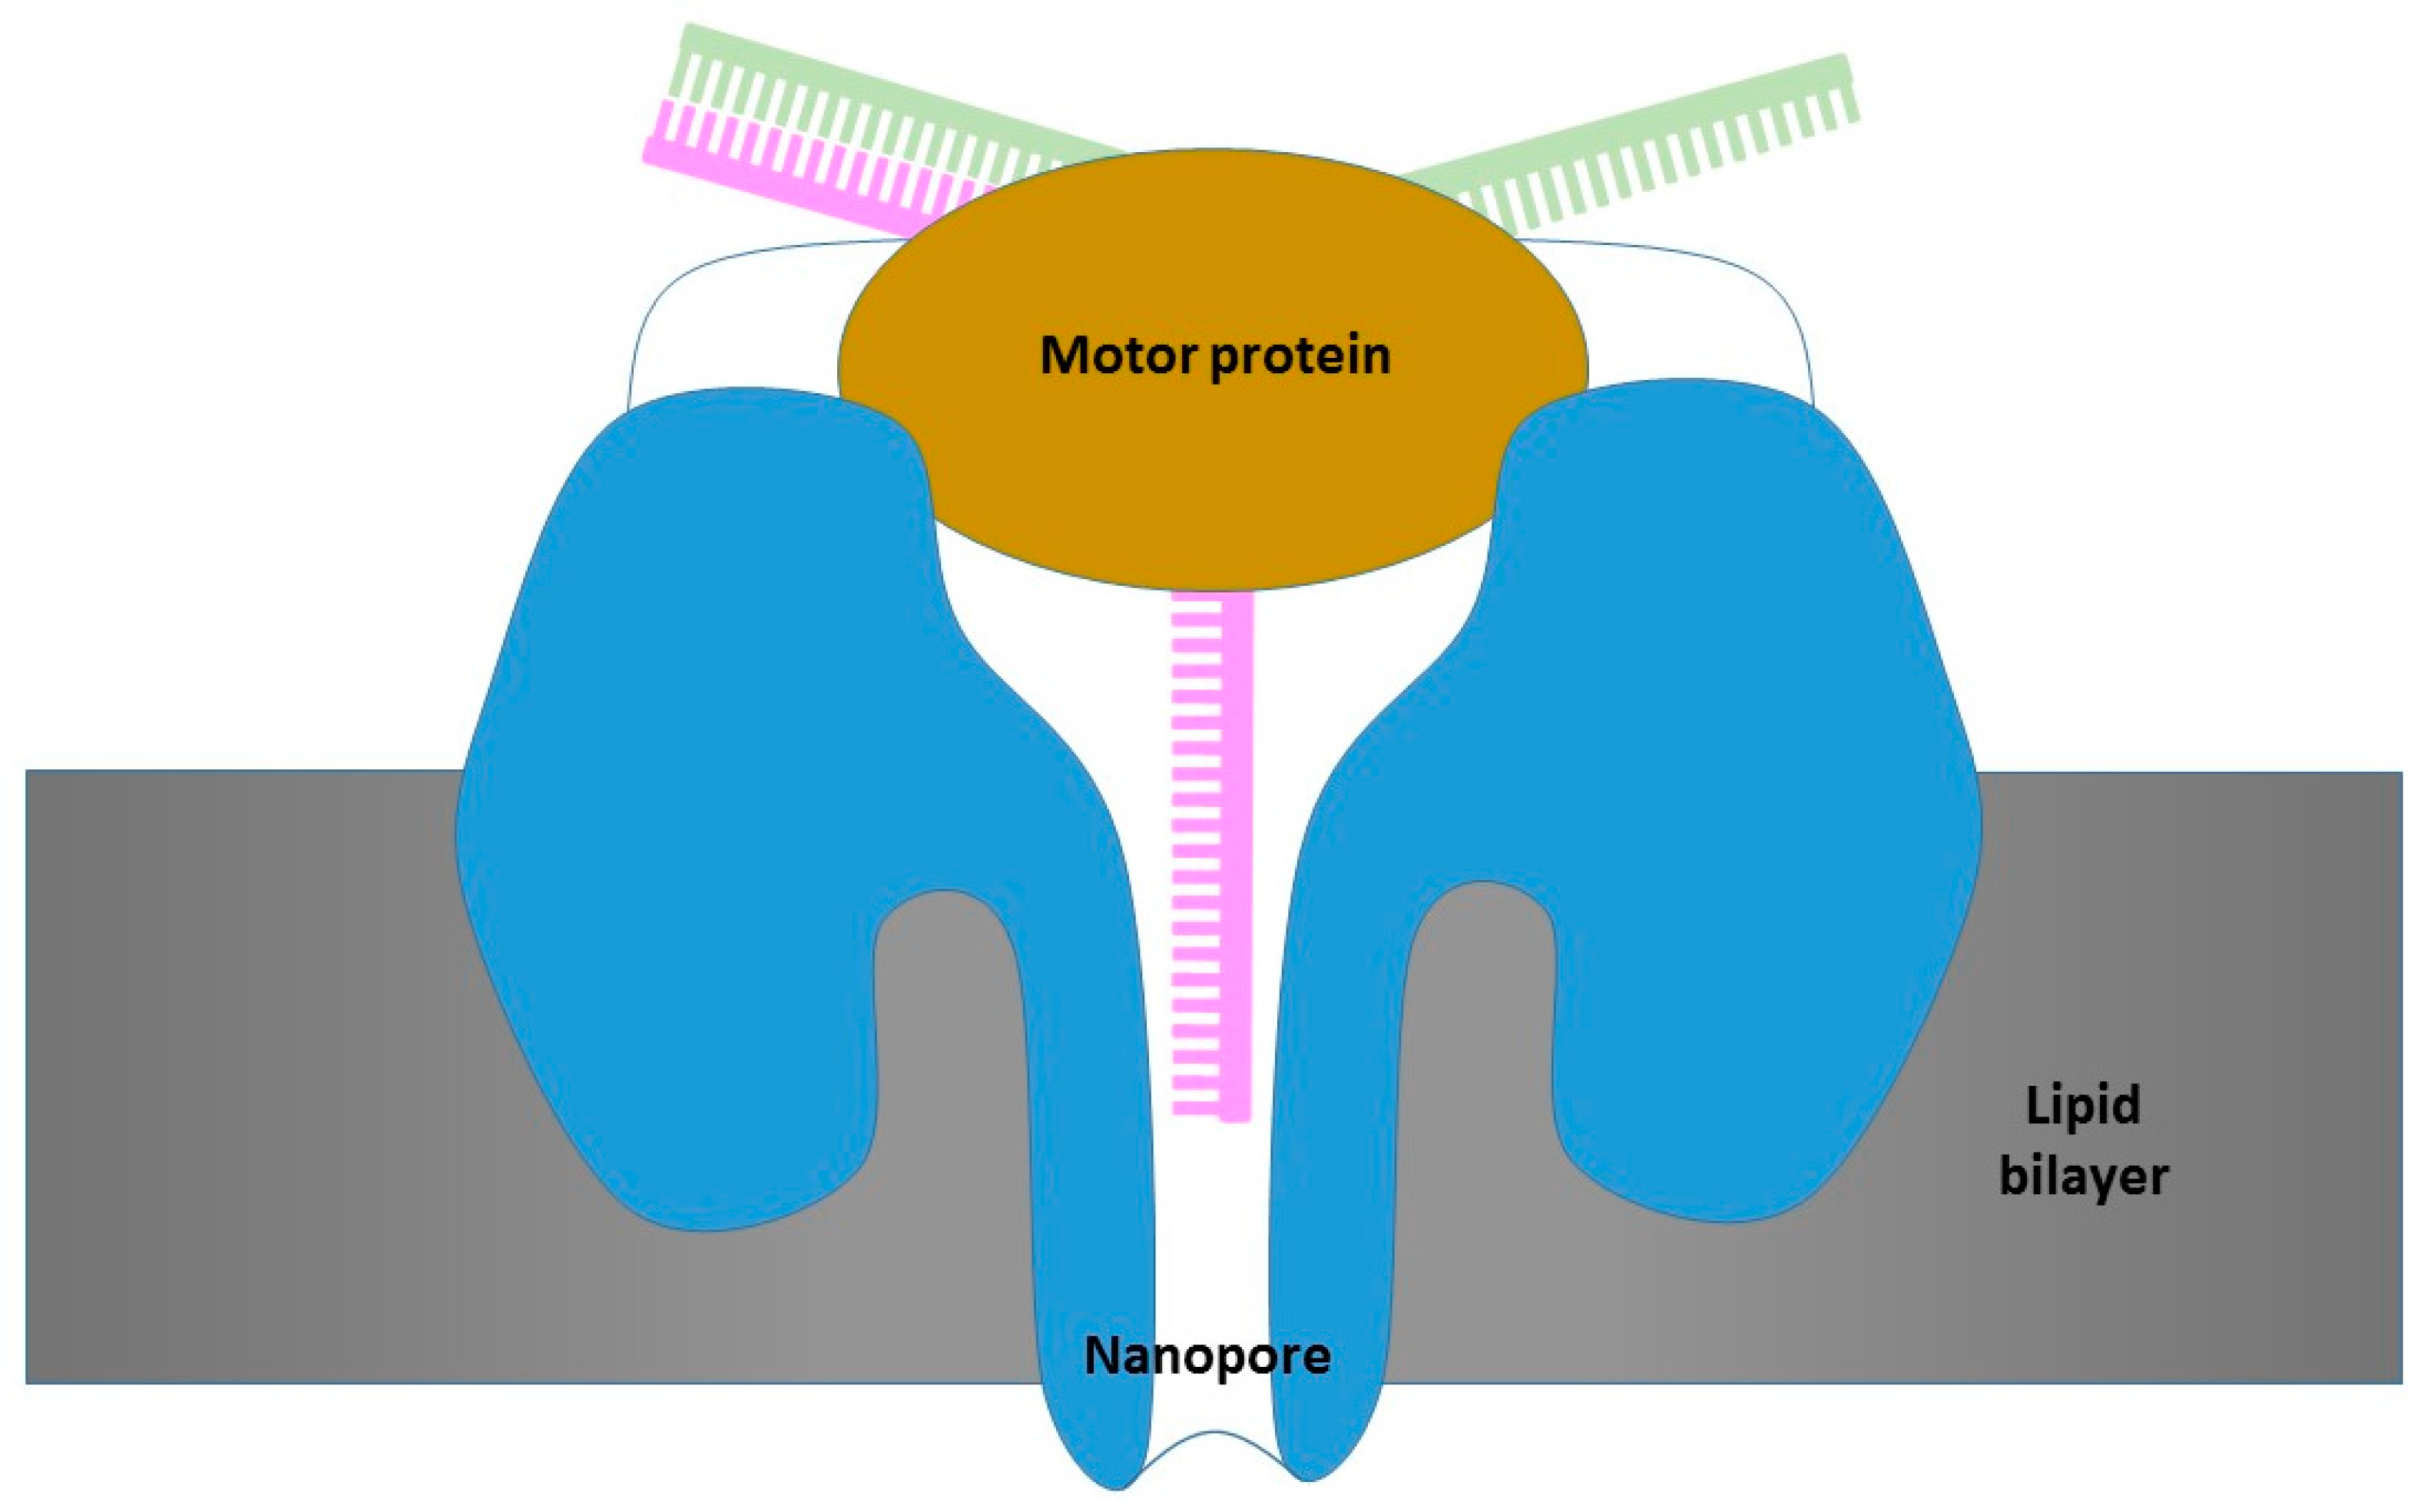
3.2. Oxford Nanopore Platform
4. Conclusions
Conflicts of Interest
References
- Avery, O.T.; MacLeod, C.M.; McCarty, M. Studies on the Chemical Nature of the Substance Inducing Transformation of Pneumococcal Types Induction of Transformation by a Deoxyribonucleic Acid Fraction Isolated from Pneumococcus Type III. J. Exp. Biol. 1944, 79, 137–158. [Google Scholar]
- Watson, J.D.; Crick, F.H.C. Molecular structure of nucleic acids. Nature 1953, 171, 737–738. [Google Scholar] [CrossRef] [PubMed]
- Sanger, F.; Air, G.M.; Barrell, B.G.; Brown, N.L.; Coulson, A.R.; Fiddes, C.A.; Hutchison, C.A.; Slocombe, P.M.; Smith, M. Nucleotide sequence of bacteriophage phi X174 DNA. Nature 1977, 265, 687–695. [Google Scholar] [CrossRef] [PubMed]
- Lander, E.S.; Linton, L.M.; Birren, B.; Nusbaum, C.; Zody, M.C.; Baldwin, J.; Devon, K.; Dewar, K.; Doyle, M.; FitzHugh, W.; et al. Initial sequencing and analysis of the human genome. Nature 2001, 409, 860–921. [Google Scholar] [CrossRef] [PubMed]
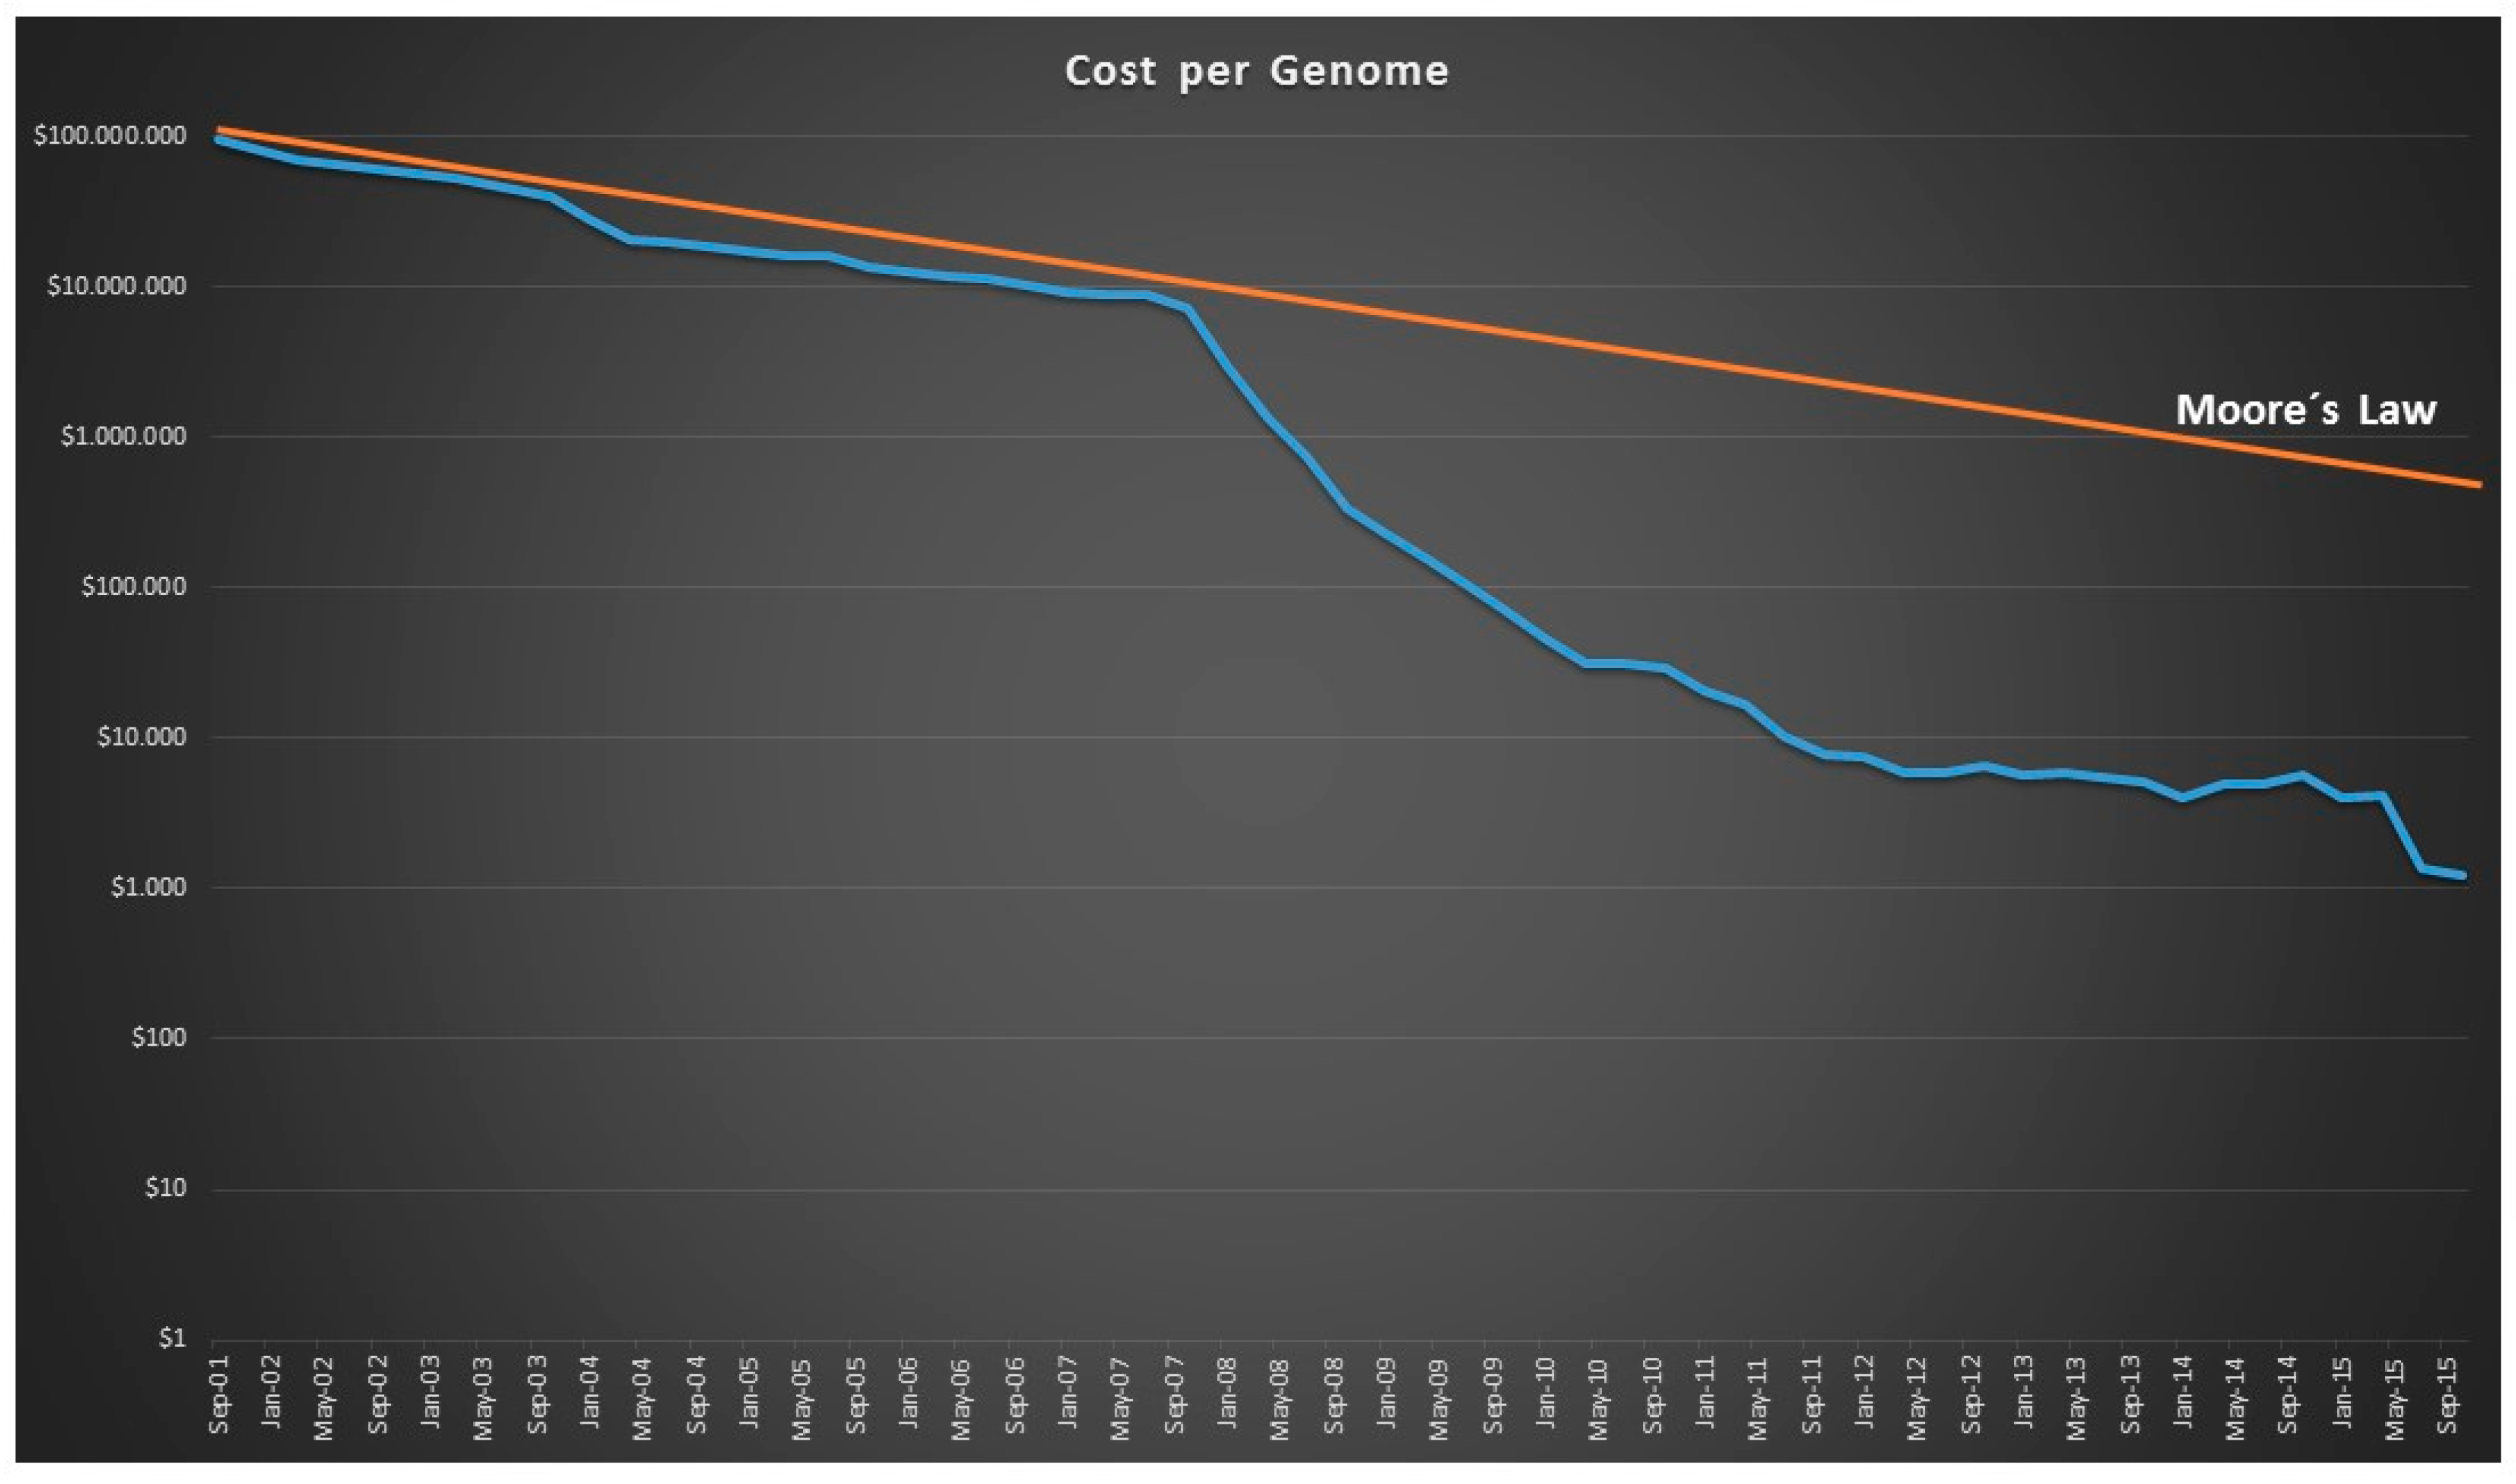
- Muers, M. Technology: Getting Moore from DNA sequencing. Nat. Rev. Genet. 2011, 12, 586–587. [Google Scholar] [CrossRef] [PubMed]
- Kircher, M.; Kelso, J. High-throughput DNA sequencing—Concepts and limitations. BioEssays 2010, 32, 524–536. [Google Scholar] [CrossRef] [PubMed]
- Mullikin, J.C. Sequencing the Genome, Fast. Science 1999, 283, 1867–1868. [Google Scholar] [CrossRef] [PubMed]
- Karger, E.; Harris, J.M.; Gesteland, R.F. Multiwavelength fluorescence detection for DNA sequencing using capillary electrophoresis. Nucleic Acids Res. 1991, 19, 4955–4962. [Google Scholar] [CrossRef] [PubMed]
- Smith, L.M.; Sanders, J.Z.; Kaiser, R.J.; Hughes, P.; Dodd, C.; Connell, C.R.; Heiner, C.; Kent, S.B.; Hood, L.E. Fluorescence detection in automated DNA sequence analysis. Nature 1986, 321, 674–679. [Google Scholar] [CrossRef] [PubMed]
- Lamture, J.B.; Lbeattie, K.; Burke, B.E.; Eggers, M.D.; Ehrlich, D.J.; Fowler, R.; Hollis, M.A.; Kosicki, B.B.; Reich, R.K.; Smith, S.R.; et al. Direct detection of nucleic acid hybridization on the surface of a charge coupled device. Nucleic Acids Res. 1994, 22, 2121–2125. [Google Scholar] [CrossRef] [PubMed]
- Metzker, M.L. Sequencing technologies—The next generation. Nat. Rev. Genet. 2010, 11, 31–46. [Google Scholar] [CrossRef] [PubMed]
- Mardis, E.R. Next-Generation Sequencing Platforms. Annu. Rev. Anal. Chem. 2013, 6, 287–303. [Google Scholar] [CrossRef] [PubMed]
- Hall, N. Advanced sequencing technologies and their wider impact in microbiology. J. Exp. Biol. 2007, 210, 1518–1525. [Google Scholar] [CrossRef] [PubMed]
- Reuter, J.A.; Spacek, D.V.; Snyder, M.P. High-Throughput Sequencing Technologies. Mol. Cell 2015, 58, 586–597. [Google Scholar] [CrossRef] [PubMed]
- Goodwin, S.; McPherson, J.D.; McCombie, W.R. Coming of age: Ten years of next-generation sequencing technologies. Nat. Rev. Genet. 2016, 17, 333–351. [Google Scholar] [CrossRef] [PubMed]
- Van Dijk, E.L.; Auger, H.; Jaszczyszyn, Y.; Thermes, C. Ten years of next-generation sequencing technology. Trends Genet. 2014, 30, 418–426. [Google Scholar] [CrossRef] [PubMed]
- Balzer, S.; Malde, K.; Lanzén, A.; Sharma, A.; Jonassen, I. Characteristics of 454 pyrosequencing data enabling realistic simulation with flowsim. Bioinformatics 2010, 26, i420–i425. [Google Scholar] [CrossRef] [PubMed] [Green Version]
- Hyman, E.D. A new method of sequencing DNA. Anal. Biochem. 1988, 174, 423–436. [Google Scholar] [CrossRef]
- Chowdhury, A.; Mannan, S.B.I.N.; Mazumdar, R.M. Pyrosequencing-Principles and Applications. Int. J. Life Sci. Pharma Res. 2012, 2, 65–76. [Google Scholar]
- Marsh, S. Pyrosequencing Protocols; Springer: Berlin/Heidelberg, Germany, 2007. [Google Scholar]
- Gharizadeh, B.; Nordström, T.; Ahmadian, A.; Ronaghi, M.; Nyrén, P. Long-read pyrosequencing using pure 2′-deoxyadenosine-5′-O′-(1-thiotriphosphate) Sp-isomer. Anal. Biochem. 2002, 301, 82–90. [Google Scholar] [CrossRef] [PubMed]
- Valouev, A.; Ichikawa, J.; Tonthat, T.; Stuart, J.; Ranade, S.; Peckham, H.; Zeng, K.; Malek, J.A.; Costa, G.; McKernan, K.; et al. A high-resolution, nucleosome position map of C. elegans reveals a lack of universal sequence-dictated positioning. Genome Res. 2008, 18, 1051–1063. [Google Scholar] [CrossRef] [PubMed]
- Li, H.; Homer, N. A survey of sequence alignment algorithms for next-generation sequencing. Brief. Bioinform. 2010, 11, 473–483. [Google Scholar] [CrossRef] [PubMed]
- Salmela, L. Correction of sequencing errors in a mixed set of reads. Bioinformatics 2010, 26, 1284–1290. [Google Scholar] [CrossRef] [PubMed]
- Rumble, S.M.; Lacroute, P.; Dalca, A.V.; Fiume, M.; Sidow, A.; Brudno, M. SHRiMP: Accurate mapping of short color-space reads. PLoS Comput. Biol. 2009, 5. [Google Scholar] [CrossRef] [PubMed]
- Drmanac, R.; Sparks, A.B.; Callow, M.J.; Halpern, A.L.; Burns, N.L.; Kermani, B.G.; Carnevali, P.; Nazarenko, I.; Nilsen, G.B.; Yeung, G.; et al. Human Genome Sequencing Using Unchained Base Reads on Self-Assembling DNA Nanoarrays. Science 2009, 1469, 78–81. [Google Scholar] [CrossRef] [PubMed]
- Ståhl, P.L.; Lundeberg, J. Toward the Single-Hour High-Quality Genome. Annu. Rev. Biochem. 2012, 81, 359–378. [Google Scholar] [CrossRef] [PubMed]
- Morozova, O.; Hirst, M.; Marra, M.A. Applications of new sequencing technologies for transcriptome analysis. Annu Rev Genom. Hum. Genet. 2009, 10, 135–151. [Google Scholar] [CrossRef] [PubMed]
- Bentley, D.R. Whole-genome re-sequencing. Curr. Opin. Genet. Dev. 2006, 16, 545–552. [Google Scholar] [CrossRef] [PubMed]
- Bentley, D.R.; Balasubramanian, S.; Swerdlow, H.P.; Smith, G.P.; Milton, J.; Brown, C.G.; Hall, K.P.; Evers, D.J.; Barnes, C.L.; Bignell, H.R.; et al. Accurate whole human genome sequencing using reversible terminator chemistry. Nature 2008, 456, 53–59. [Google Scholar] [CrossRef] [PubMed]
- Axelrod, D. Total internal reflection fluorescence microscopy in cell biology. Traffic 2001, 2, 764–774. [Google Scholar] [CrossRef] [PubMed]
- Gould, T.J.; Myers, J.R.; Bewersdorf, J. Total internal reflection STED microscopy. Opt. Express 2011, 19, 13351–13357. [Google Scholar] [CrossRef] [PubMed]
- Srinivasan, S.; Batra, J. Next Generation: Sequencing & Applications Four Generations of Sequencing—Is it Ready for the Clinic Yet? Next Gener. Seq. Appl. 2014, 1, 107. [Google Scholar]
- Peyro-Saint-Paul, H.; Hermitte, F. From sample to insight: Bringing NGS into clinical routine. Drug Metab. Drug Interact. 2013, 28, A11. [Google Scholar]
- Merriman, B.; Torrent, I.; Rothberg, J.M. Progress in Ion Torrent semiconductor chip based sequencing. Electrophoresis 2012, 33, 3397–3417. [Google Scholar] [CrossRef] [PubMed]
- Singh, P.S. From Sensors to Systems: CMOS-Integrated Electrochemical Biosensors. IEEE Access 2015, 3, 249–259. [Google Scholar] [CrossRef]
- Li, H.; Liu, X.; Li, L.; Mu, X.; Geron, R.; Mason, A.J. CMOS Electrochemical Instrumentation for Biosensor Microsystems: A Review. Sensors 2016, 17, 74. [Google Scholar] [CrossRef] [PubMed]
- Rothberg, J.M.; Hinz, W.; Rearick, T.M.; Schultz, J.; Mileski, W.; Davey, M.; Leamon, J.H.; Johnson, K.; Milgrew, M.J.; Edwards, M.; et al. An integrated semiconductor device enabling non-optical genome sequencing. Nature 2011, 475, 348–352. [Google Scholar] [CrossRef] [PubMed]
- Buermans, H.P.J.; den Dunnen, J.T. Next generation sequencing technology: Advances and applications. Biochim. Biophys. Acta Mol. Basis Dis. 2014, 1842, 1932–1941. [Google Scholar] [CrossRef] [PubMed]
- Toumazou, C.; Georgiou, P. Piet Bergveld—40 years of ISFET technology: From neuronal sensing to DNA sequencing. Electron. Lett. 2011, 47, S7–S12. [Google Scholar] [CrossRef]
- Nakano, M.; Komatsu, J.; Matsuura, S.I.; Takashima, K.; Katsura, S.; Mizuno, A. Single-molecule PCR using water-in-oil emulsion. J. Biotechnol. 2003, 102, 117–124. [Google Scholar] [CrossRef]
- Lee, H.; Gurtowski, J.; Yoo, S.; Nattestad, M.; Marcus, S.; Goodwin, S.; McCombie, W.R.; Schatz, M. Third-generation sequencing and the future of genomics. bioRxiv 2016. [Google Scholar] [CrossRef]
- Quail, M.; Smith, M.E.; Coupland, P.; Otto, T.D.; Harris, S.R.; Connor, T.R.; Bertoni, A.; Swerdlow, H.P.; Gu, Y.; Rothberg, J.; et al. A tale of three next generation sequencing platforms: Comparison of Ion torrent, pacific biosciences and illumina MiSeq sequencers. BMC Genom. 2012, 13, 341. [Google Scholar] [CrossRef] [PubMed]
- Coupland, P.; Chandra, T.; Quail, M.; Reik, W.; Swerdlow, H. Direct sequencing of small genomes on the pacific biosciences RS without library preparation. Biotechniques 2012, 53, 365–372. [Google Scholar] [CrossRef] [PubMed]
- Eid, J.; Fehr, A.; Gray, J.; Luong, K.; Lyle, J.; Otto, G.; Peluso, P.; Rank, D.; Baybayan, P.; Bettman, B.; et al. Real-time DNA sequencing from single polymerase molecules. Science 2009, 323, 133–138. [Google Scholar] [CrossRef] [PubMed]
- Levene, M.J.; Korlach, J.; Turner, S.W.; Foquet, M.; Craighead, H.G.; Webb, W.W.; Xie, X.S.; Lu, H.P.; Lu, H.P.; Xun, L.; et al. Zero-mode waveguides for single-molecule analysis at high concentrations. Science 2003, 299, 682–686. [Google Scholar] [CrossRef] [PubMed]
- Lundquist, P.M.; Zhong, C.F.; Zhao, P.; Tomaney, A.B.; Peluso, P.S.; Dixon, J.; Bettman, B.; Lacroix, Y.; Kwo, D.P.; McCullough, E.; et al. Parallel confocal detection of single molecules in real time. Opt. Lett. 2008, 33, 1026–1028. [Google Scholar] [CrossRef] [PubMed]
- Branton, D.; Deamer, D.W.; Marziali, A.; Bayley, H.; Benner, S.A.; Butler, T.; Di Ventra, M.; Garaj, S.; Hibbs, A.; Huang, X.; et al. The potential and challenges of nanopore sequencing. Nat. Biotechnol. 2008, 26, 1146–1153. [Google Scholar] [CrossRef] [PubMed] [Green Version]
- Wang, Y.; Yang, Q.; Wang, Z. The evolution of nanopore sequencing. Front. Genet. 2015, 5, 449. [Google Scholar] [CrossRef] [PubMed]
- Maitra, R.D.; Kim, J.; Dunbar, W.B. Recent advances in nanopore sequencing. Electrophoresis 2012, 33, 3418–3428. [Google Scholar] [CrossRef] [PubMed]
- Malecka, K.; Michalczuk, L.; Radecka, H.; Radecki, J. Ion-channel genosensor for the detection of specific DNA sequences derived from plum pox virus in plant extracts. Sensors 2014, 14, 18611–18624. [Google Scholar] [CrossRef] [PubMed]
- Eisenstein, M. Oxford Nanopore announcement sets sequencing sector abuzz. Nat. Biotechnol. 2012, 30, 295–296. [Google Scholar] [CrossRef] [PubMed]
- Mikheyev, A.S.; Tin, M.M.Y. A first look at the Oxford Nanopore MinION sequencer. Mol. Ecol. Resour. 2014, 14, 1097–1102. [Google Scholar] [CrossRef] [PubMed]
- Clarke, J.; Wu, H.; Jayasinghe, L.; Patel, A.; Reid, S.; Bayley, H. Continuous base identification for single-molecule nanopore DNA sequencing. Nat. Nanotechnol. 2009, 4, 265–270. [Google Scholar] [CrossRef] [PubMed]
- Deamer, D.; Akeson, M.; Branton, D. Three decades of nanopore sequencing. Nat. Biotechnol. 2016, 34, 518–524. [Google Scholar] [CrossRef] [PubMed]
- Yang, Y.; Liu, R.; Xie, H.; Hui, Y.; Jiao, R.; Gong, Y.; Zhang, Y. Advances in Nanopore Sequencing Technology. J. Nanosci. Nanotechnol. 2013, 13, 4521–4538. [Google Scholar] [CrossRef] [PubMed]
- Drummond, T.G.; Drummond, T.G.; Hill, M.G.; Hill, M.G.; Barton, J.K.; Barton, J.K. Electrochemical DNA sensors. Nat. Biotechnol. 2003, 21, 1192–1199. [Google Scholar] [CrossRef] [PubMed]
- Lobo-Castañón, M.J. Analytical and Bioanalytical Chemistry; Springer: Berlin/Heidelberg, Germany, 2016; pp. 8581–8582. [Google Scholar]
- Amaya-González, S.; de-los-Santos-Alvarez, N.; Miranda-Ordieres, A.J.; Lobo-Castañón, M.J. Aptamer-based analysis: A promising alternative for food safety control. Sensors 2013, 13, 16292–16311. [Google Scholar] [CrossRef] [PubMed]
- Shao, Y.; Wang, J.; Wu, H.; Liu, J.; Aksay, I.A.; Lin, Y. Graphene based electrochemical sensors and biosensors: A review. Electroanalysis 2010, 22, 1027–1036. [Google Scholar] [CrossRef]
- Blanco-López, M.C.; Lobo-Castañón, M.J.; Miranda-Ordieres, A.J.; Tuñón-Blanco, P. Electrochemical sensors based on molecularly imprinted polymers. Trends Anal. Chem. 2004, 23, 36–48. [Google Scholar] [CrossRef]


| Methods of DNA Sequencing | Platform | ||
|---|---|---|---|
| Short-read sequencing | Sequencing by ligation | AB SOLiD (Thermo Fisher) | |
| Complete Genomics (BGI) | |||
| Sequencing by synthesis | Cyclic reversible termination (CRT) | Illumina | |
| GeneReader (Qiagen) | |||
| Single-nucleotide addition (SNA) | 454 Roche | ||
| Ion Torrent | |||
| Single-molecule real-time long read sequencing | Pacific Bioscence | ||
| Oxford Nanopore | |||
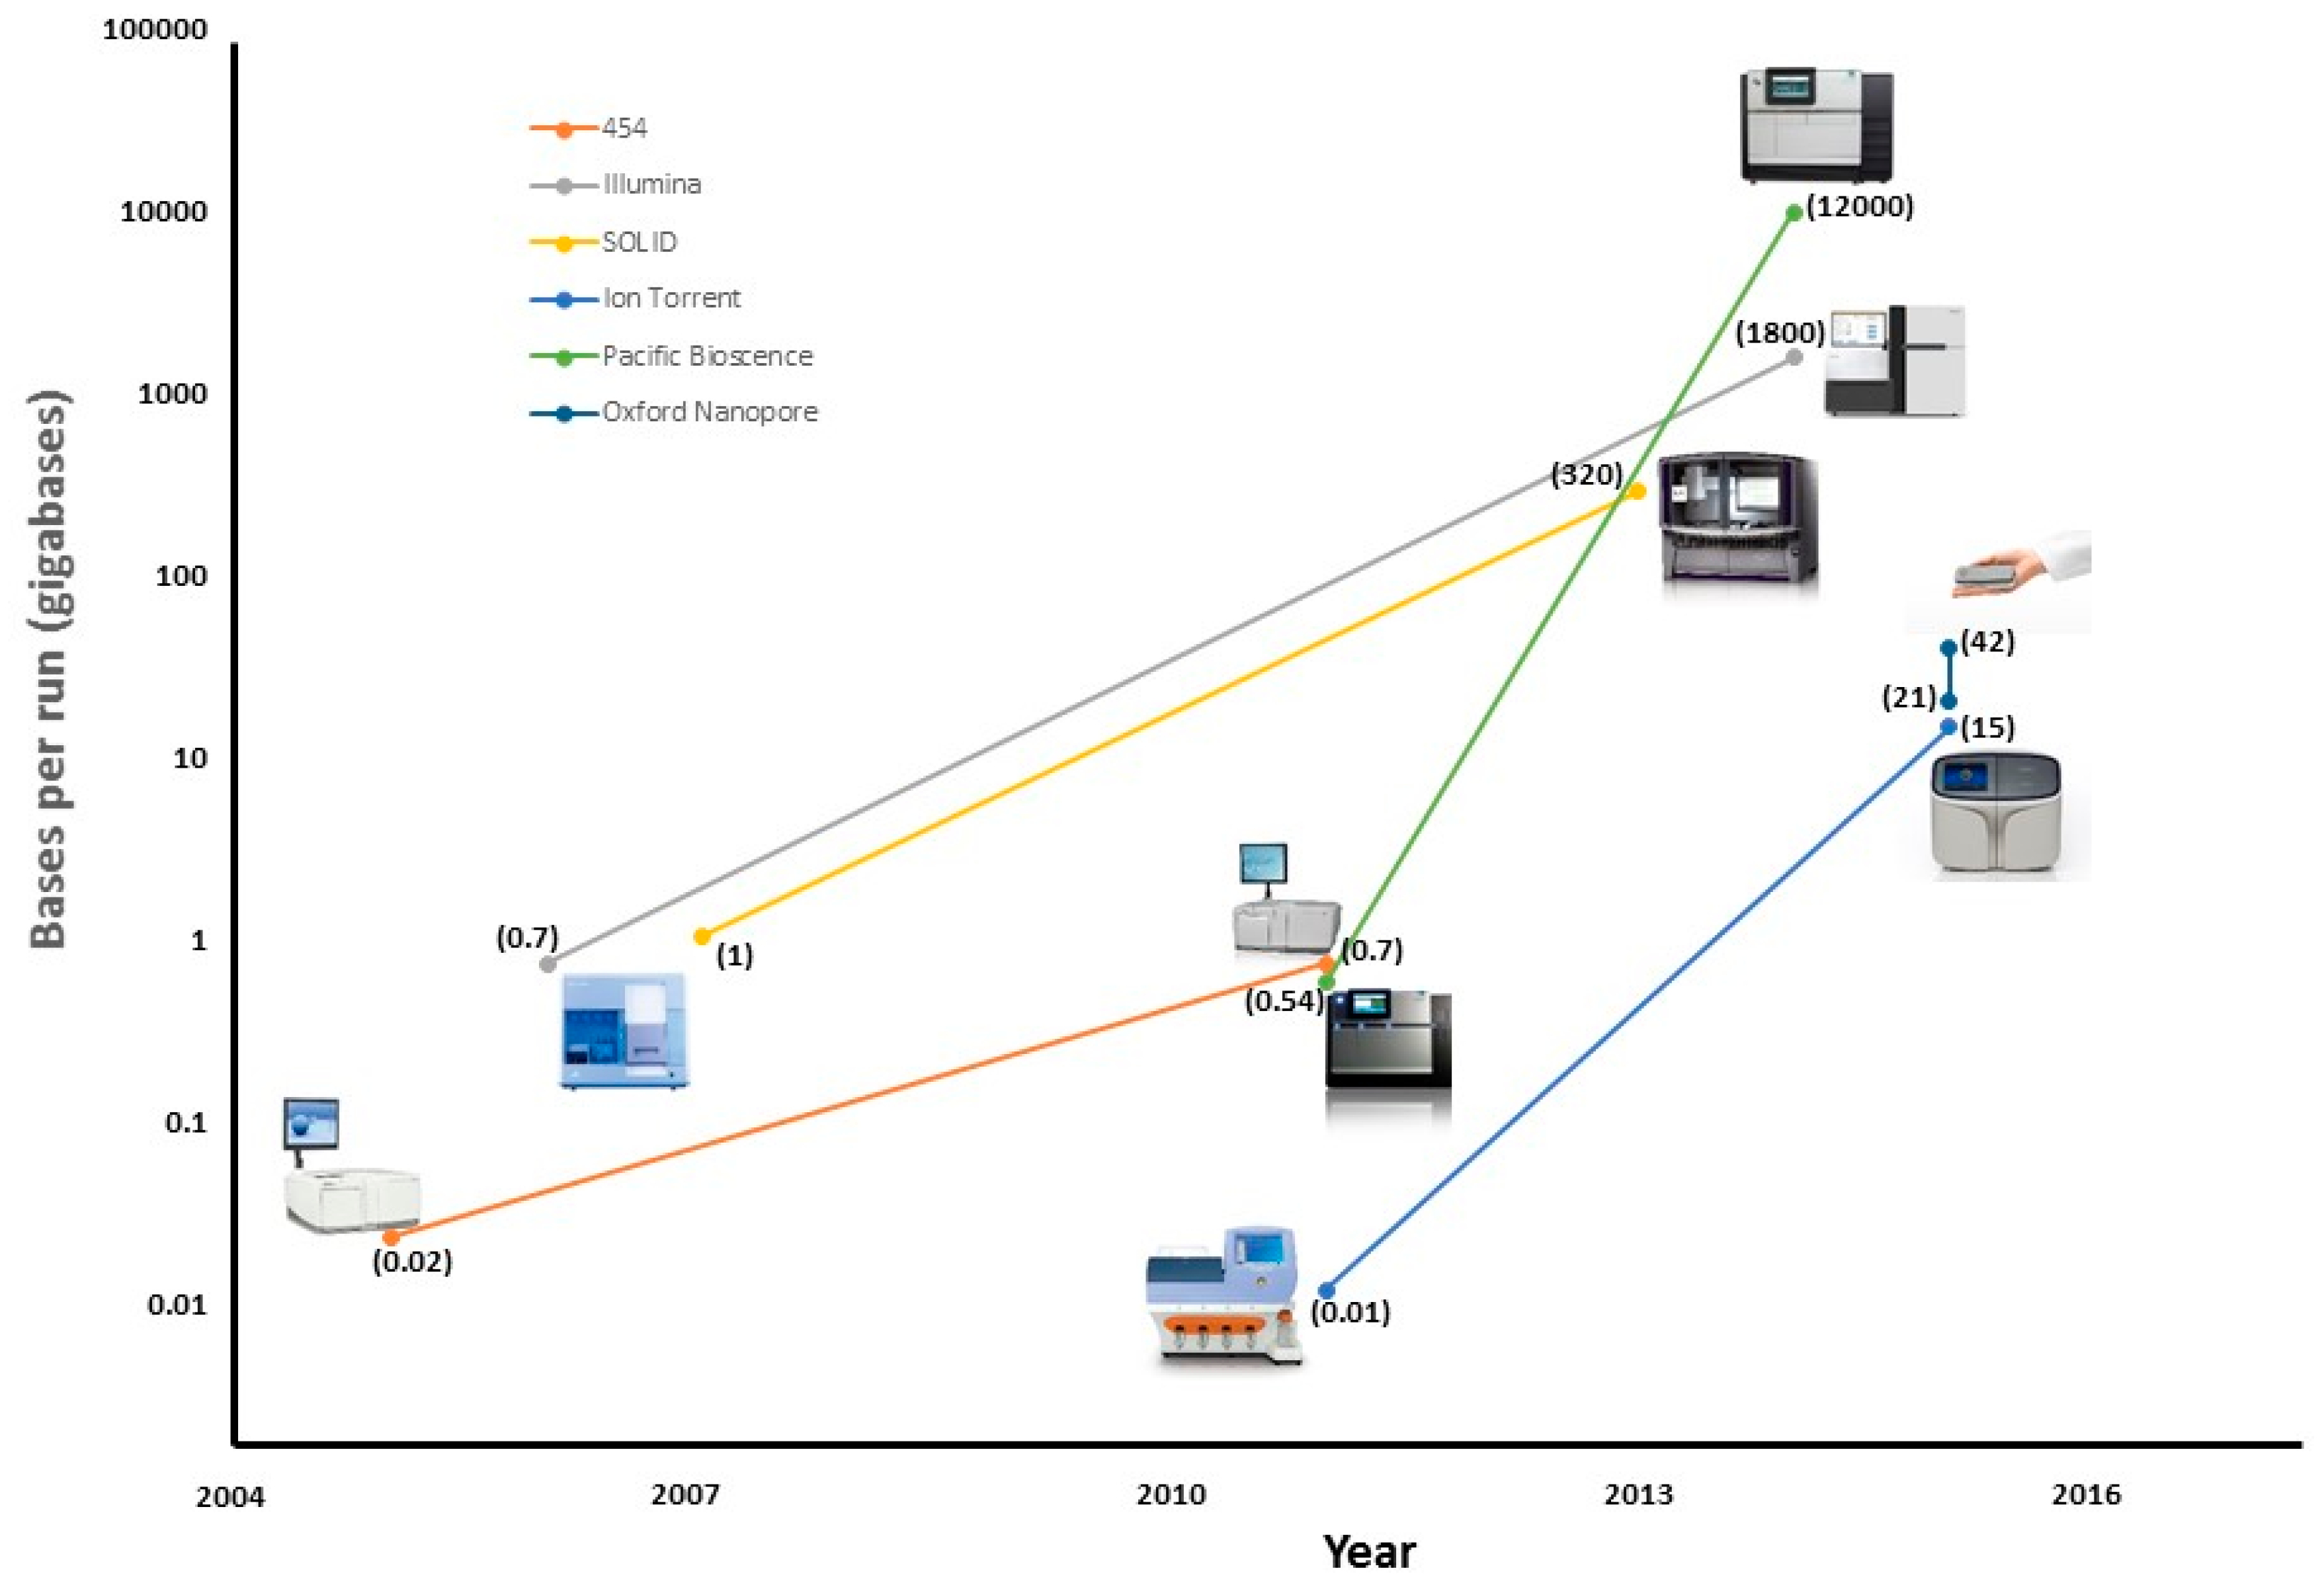
| Platform | Read Length (bp) | Accuracy (%) | Run Time | Bases Per Run (Gb) | Cost/Gb |
|---|---|---|---|---|---|
| 454 Roche | 1000 | 99 | 24 h | 0.54 | $10,000 |
| SOLiD | 75 | 99.9 | 7 d | 520 | $10 |
| Illumina | 300 | 99.9 | 3 d | 1800 | $10 |
| Ion Torrent | 400 | 99 | 2 h | 15 | $100 |
| Pacific Bioscence | 20,000 | 90 | 3 h | 12,000 | $600 |
| Oxford Nanopore | 10,000 | 90 | 2 d | 42 | $1000 |
| Platform | Pros | Cons |
|---|---|---|
| 454 Roche | Long reading length. Low analysis time. Low cost for small studies | High error rate in homopolymers. Low performance. High instrumental cost. High cost per Gb data |
| SOLiD | High throughput. Low cost per Gb data. High accuracy | Short reading length. High instrumental cost |
| Illumina | High throughput. Low cost per Gb data. High accuracy | Short reading length. High instrumental cost |
| Ion Torrent | Low instrumental and operational cost. Short execution time. Very simple machine | Error rate not very good. Intermediate cost per Gb data. More hands-on time |
| Pacific Bioscence | Longest reading length available. Short instrument execution time | High error rate. High cost per Gb data. Many methods are still under development |
| Oxford Nanopore | Small, portable, and low cost instrument | High error rate. Biased errors. High cost per Reading |
© 2017 by the authors. Licensee MDPI, Basel, Switzerland. This article is an open access article distributed under the terms and conditions of the Creative Commons Attribution (CC BY) license ( http://creativecommons.org/licenses/by/4.0/).
Share and Cite
Garrido-Cardenas, J.A.; Garcia-Maroto, F.; Alvarez-Bermejo, J.A.; Manzano-Agugliaro, F. DNA Sequencing Sensors: An Overview. Sensors 2017, 17, 588. https://doi.org/10.3390/s17030588
Garrido-Cardenas JA, Garcia-Maroto F, Alvarez-Bermejo JA, Manzano-Agugliaro F. DNA Sequencing Sensors: An Overview. Sensors. 2017; 17(3):588. https://doi.org/10.3390/s17030588
Chicago/Turabian StyleGarrido-Cardenas, Jose Antonio, Federico Garcia-Maroto, Jose Antonio Alvarez-Bermejo, and Francisco Manzano-Agugliaro. 2017. "DNA Sequencing Sensors: An Overview" Sensors 17, no. 3: 588. https://doi.org/10.3390/s17030588