Command Disaggregation Attack and Mitigation in Industrial Internet of Things


Abstract
:1. Introduction
2. Related Work and Our Contribution
2.1. Related Work
2.2. Our Contribution
- (i)
- We introduce two kinds of command disaggregation attack modes, namely, false command sequence and wrong command allocation.
- (ii)
- We describe three attack models to implement command disaggregation attacks in two modes. Attacks based on the three models can not be detected by the existing detection methods.
- (iii)
- We provide an effective detection framework based on correlations among two-tier command sequences. Detecting command disaggregation attacks with false feedback data injection is still an unexplored topic and our method is the first to effectively identify command disaggregation attacks before a disruption occurs.
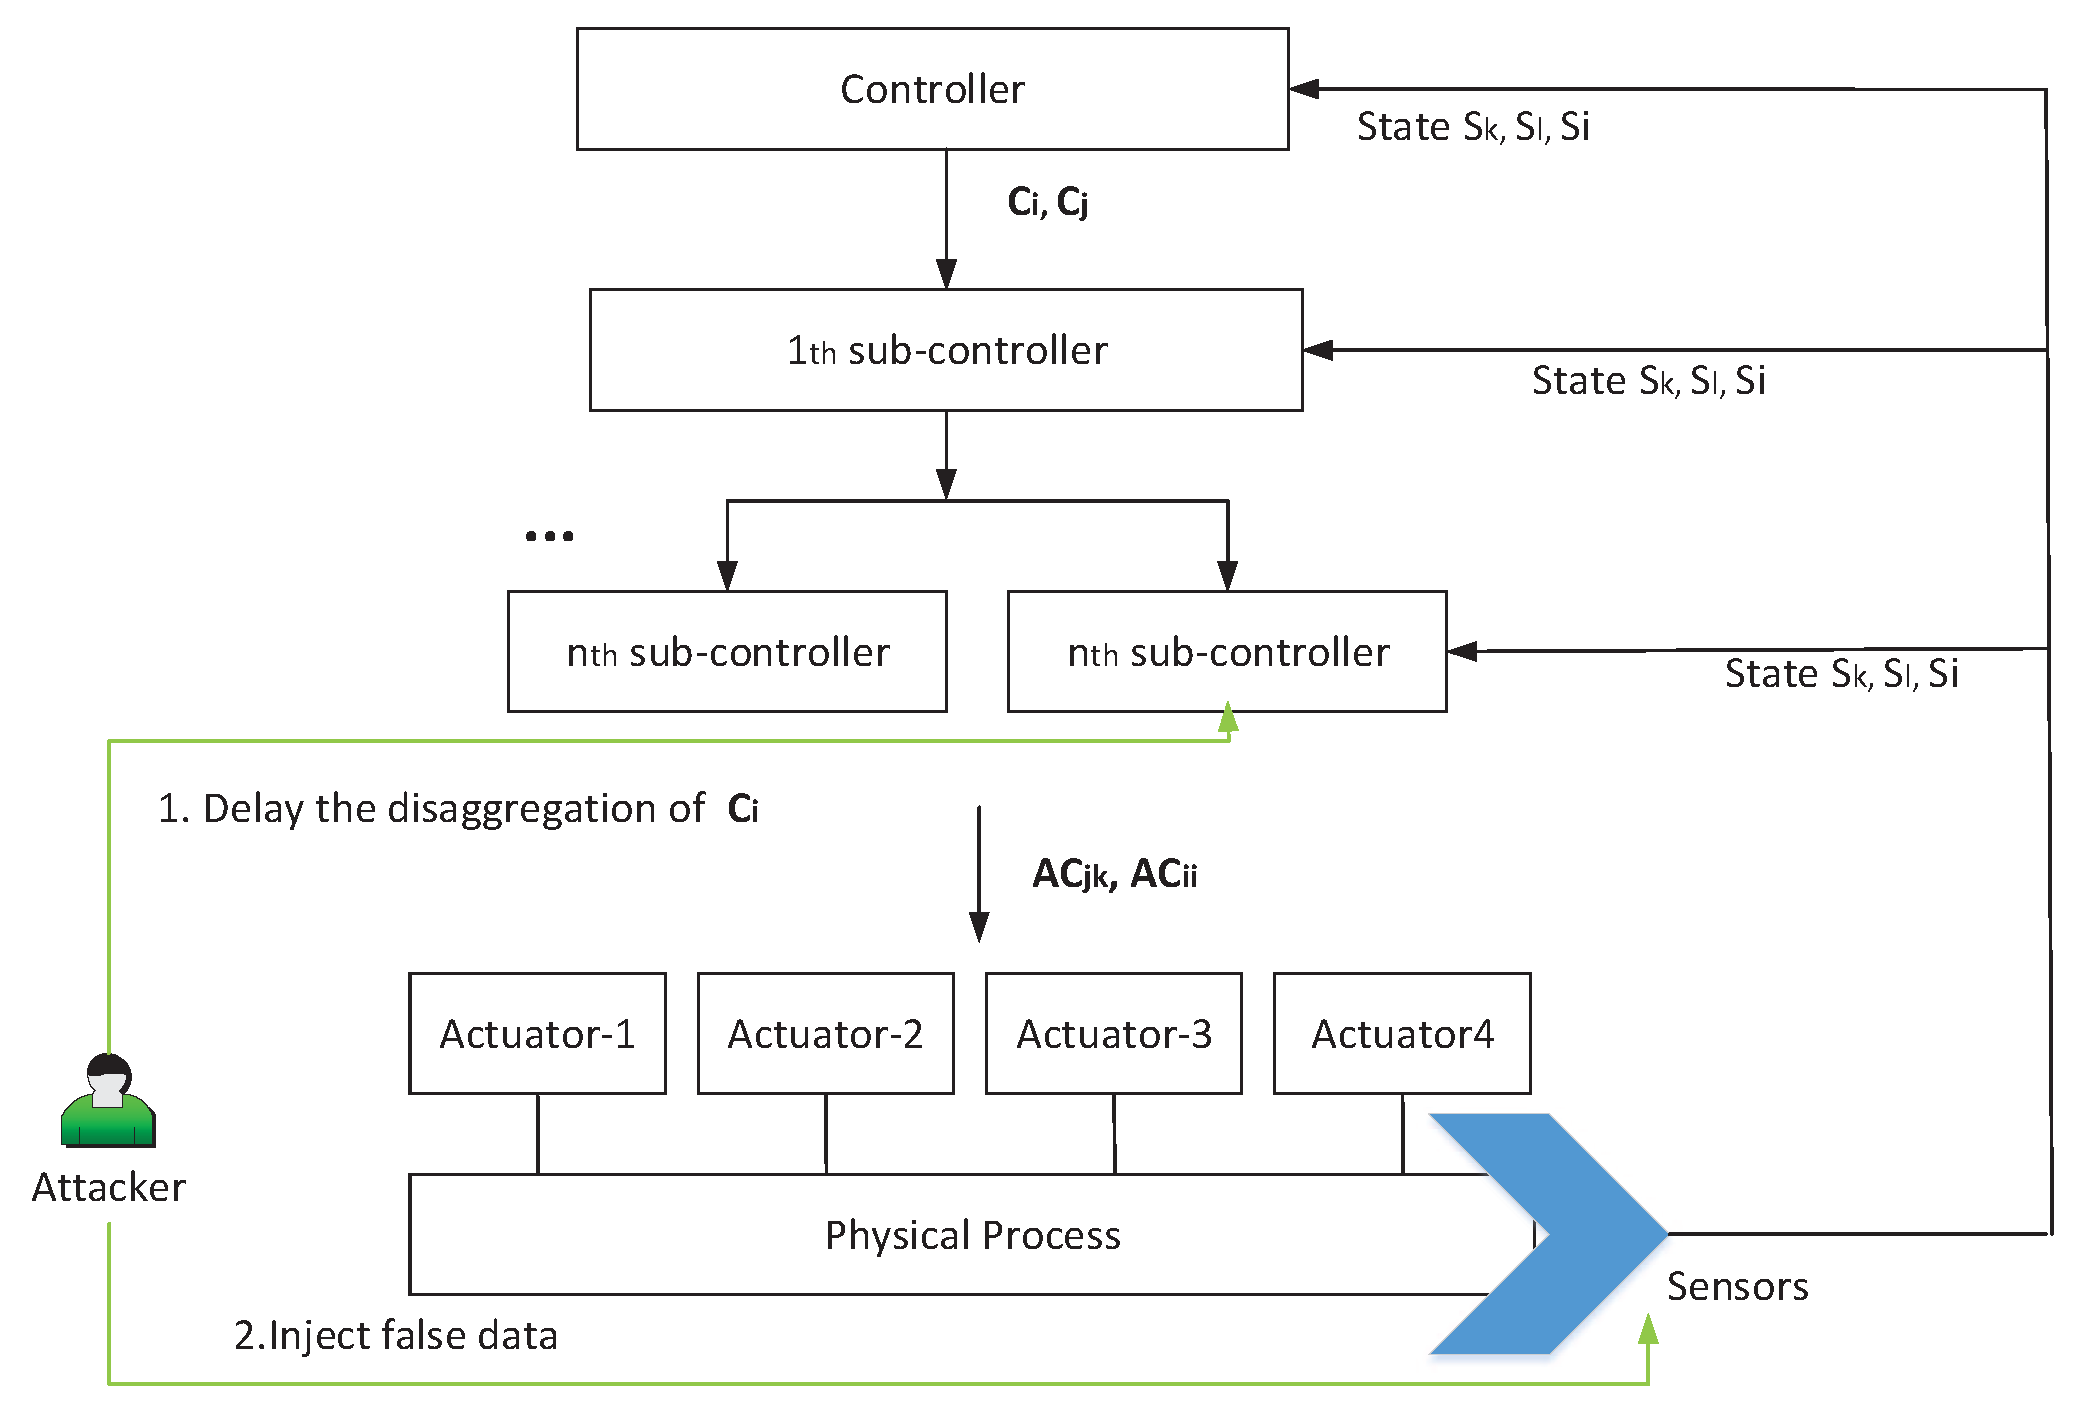
3. Command Disaggregation Attack
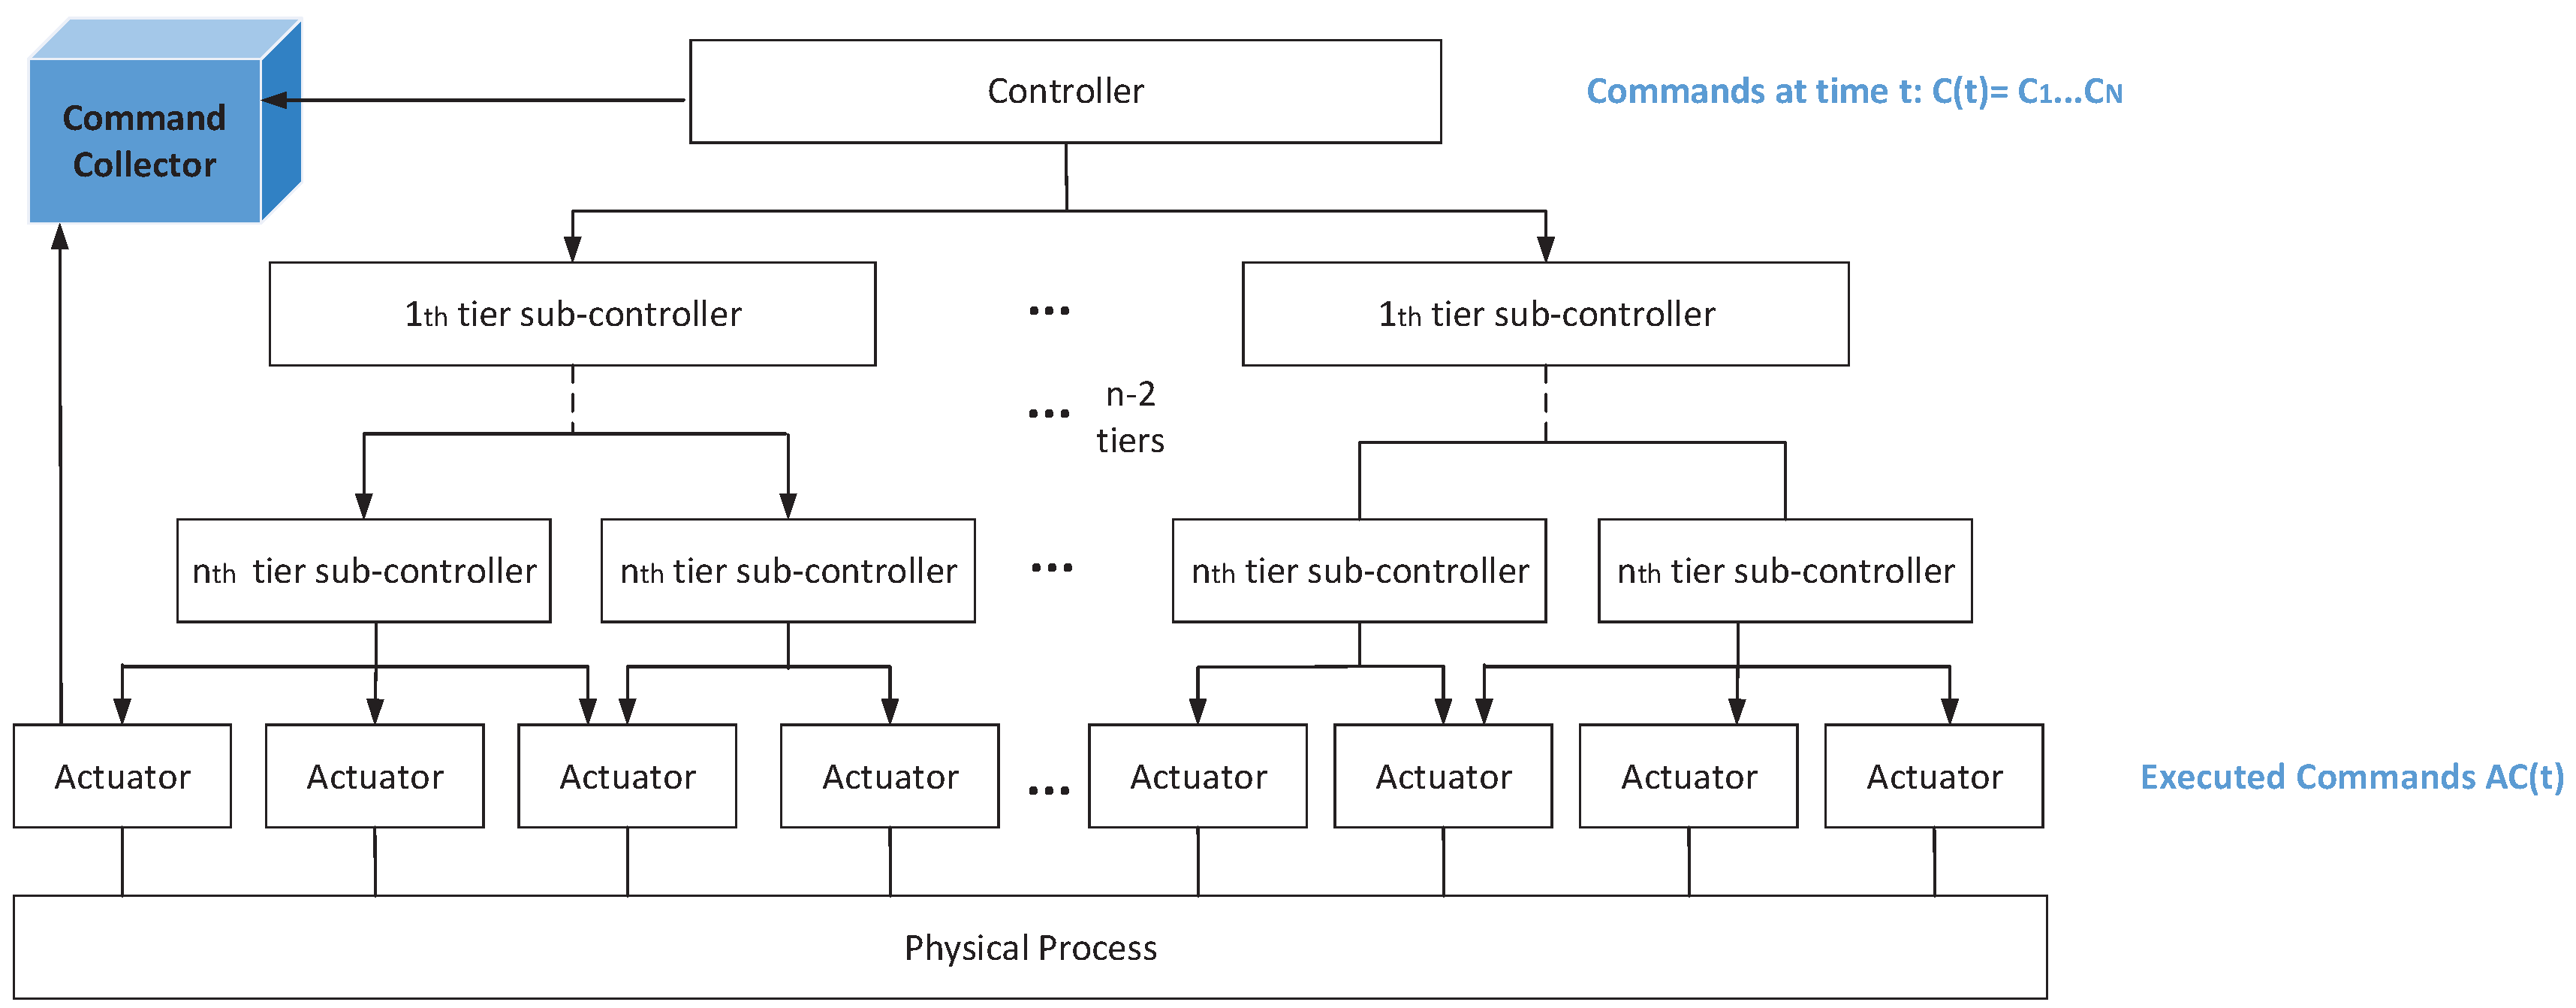
3.1. System Model
- is a finite set of commands from the central controller. is the kth kind of command. indicates the commands issued by the central controller at time t.
- is a finite set of time series. A time series is the measured values of one sensor with the change of time. means the time series from the ith sensor. denotes the measurement of the ith sensor at time instant l. means the number of sensors.
- is a finite set of physical system states. denotes the jth kind of state and . Detectors and controllers can evaluate the system state at time k, , based on values of sensors, which can be computed bywhere is the constant matrix. denotes the evaluated state at time k, and under normal circumstances, . = where denotes the value of time series at time instant k.
- is a set of sub-commands executed by actuators. indicates the executed sub-commands by actuators when command from the central controller is and the system state is . Element defines the sub-command that will be executed by the kth actuator. N means the number of actuators. An actuator only executes a sub-command in unit time, and a sub-controller only disaggregates one command from the upper-tier sub-controller during once outflow of the central controller. denotes the executed sub-commands when the corresponding commands are issued from the central controller. is an element of AC(t) and denotes the sub-command executed by the ith actuator. The system state at time t, , is decided by and [14], which can be described aswhere and are constant matrices. indicates the time interval between the time t when current commands are issued and the time of its last outflow.
- is a finite set of relationships among commands and system states. () indicates that the executed sub-commands are when the system state is and the command from the controller is .
- is a subset of set S. A disruption occurs when the system state is .
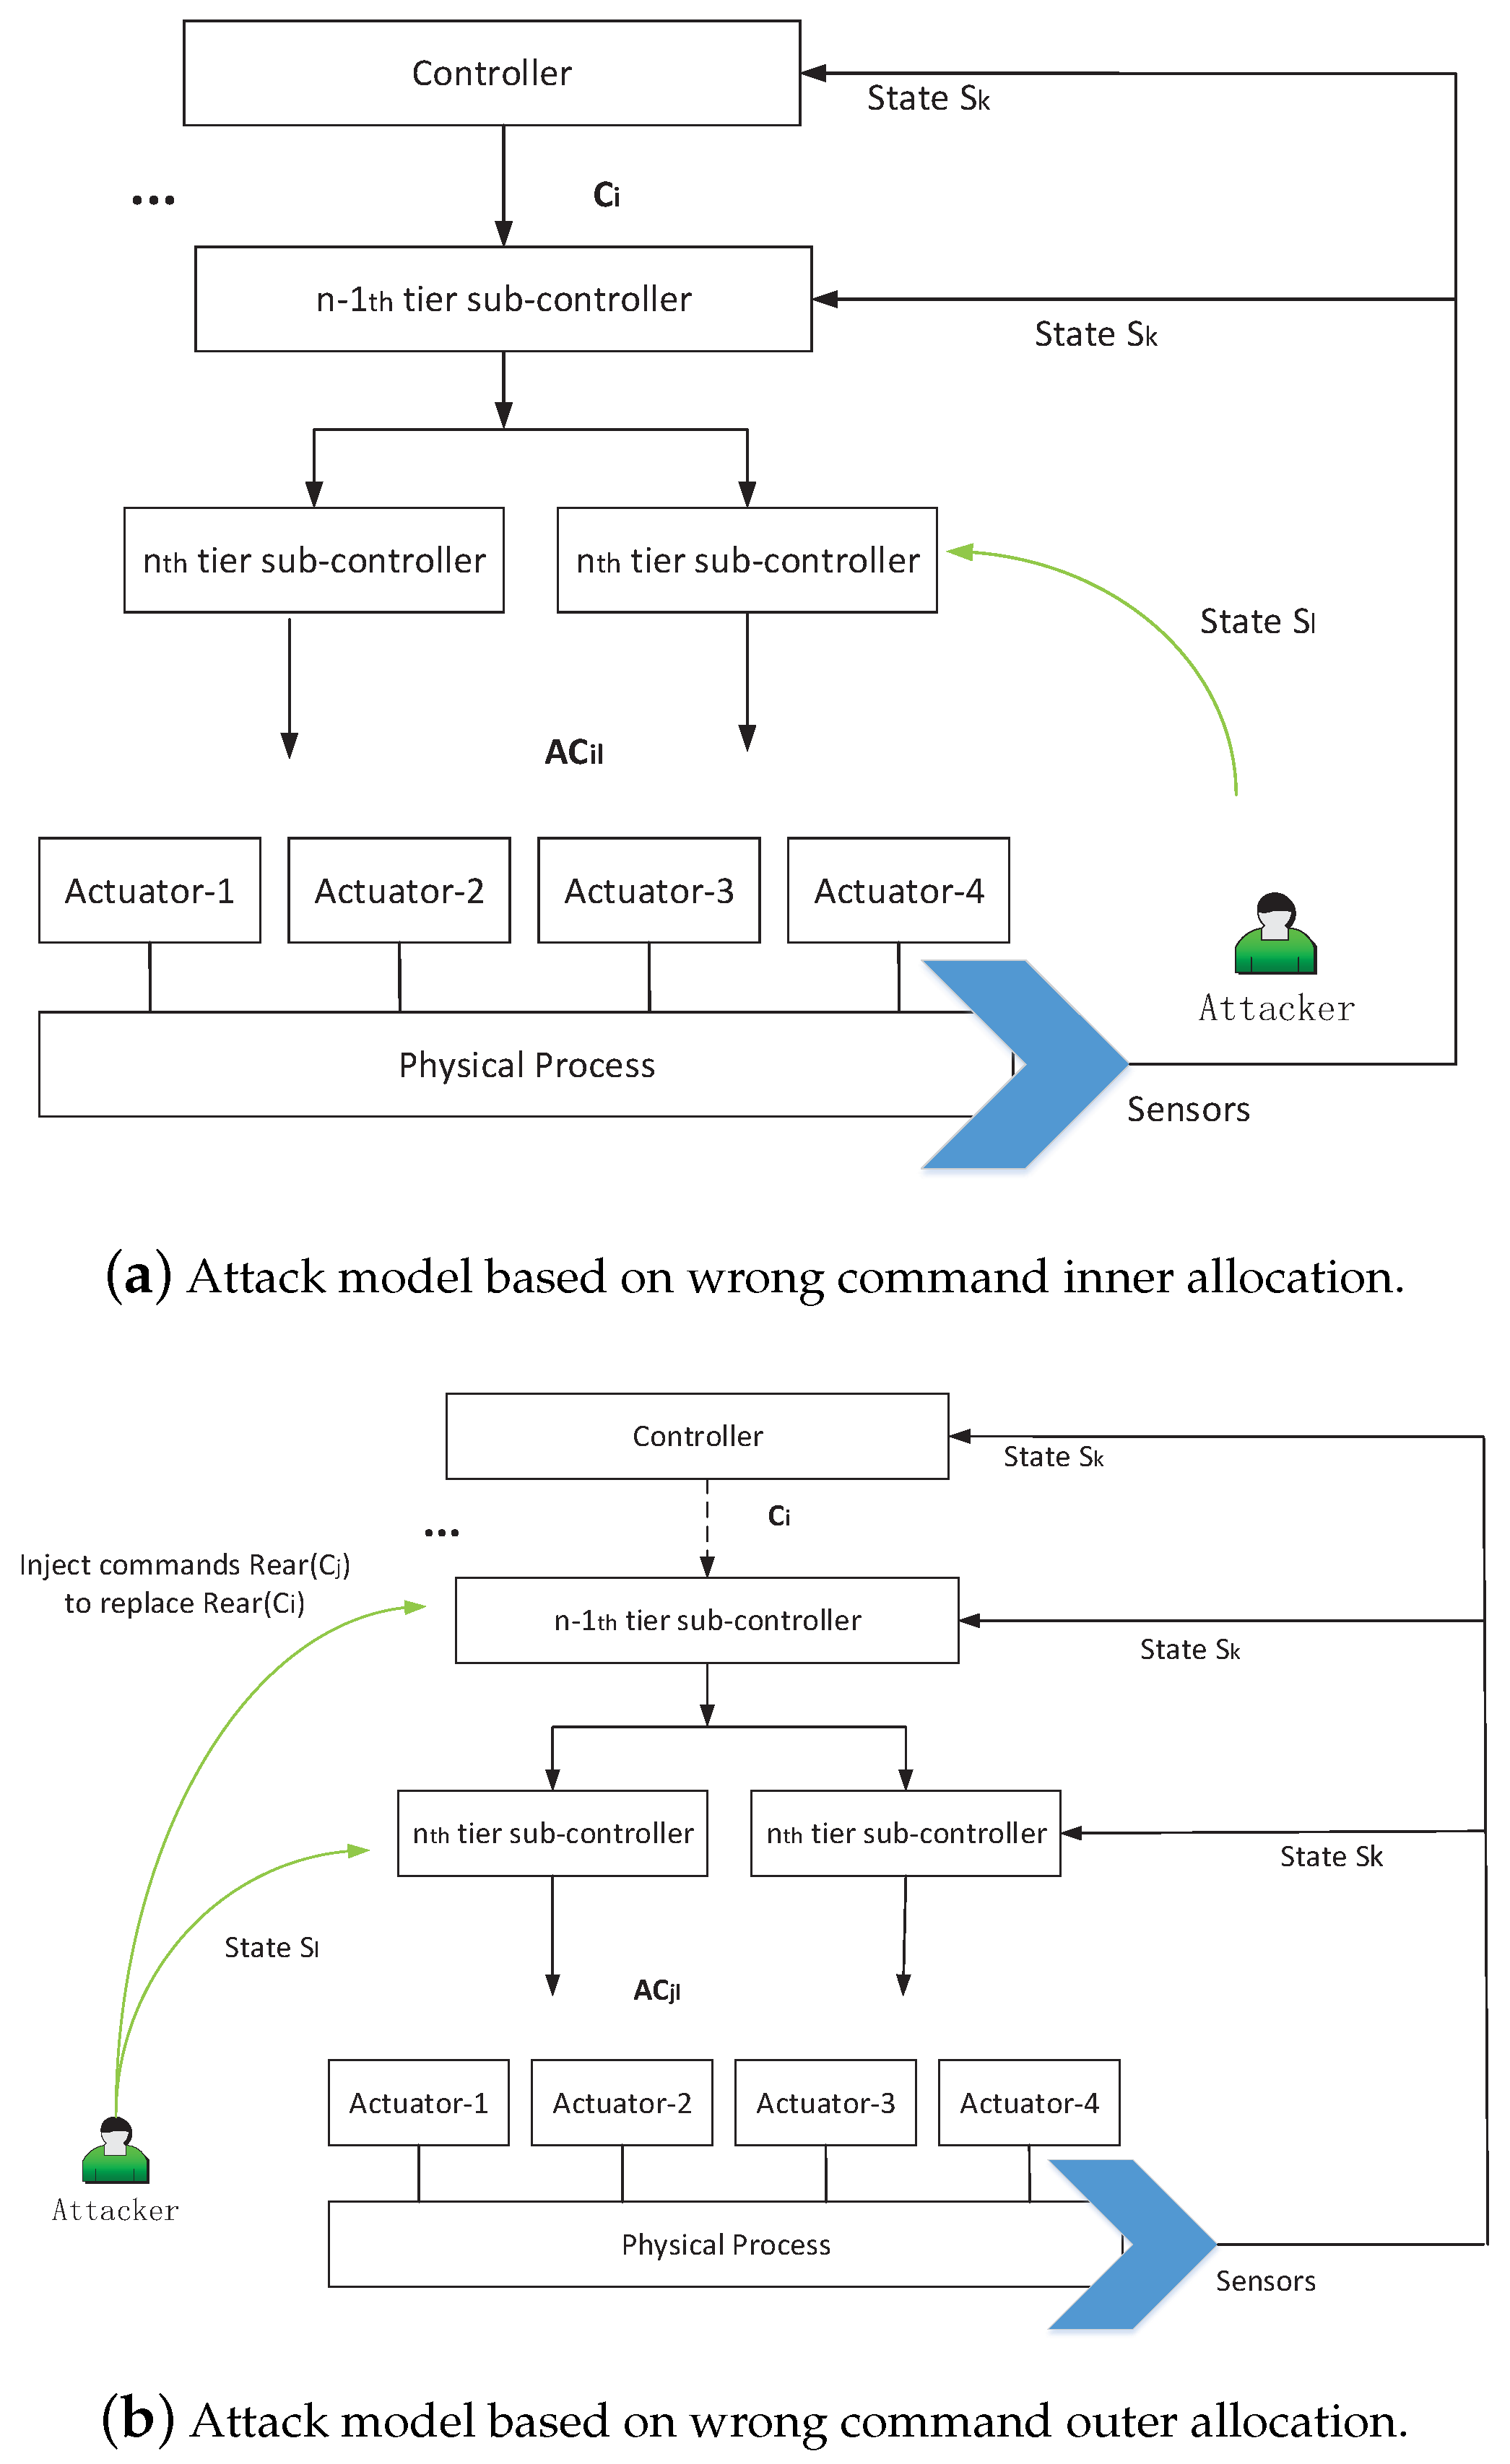
3.2. Two Kinds of Attack Modes and the Attack Models
3.2.1. Wrong Command Allocation
3.2.2. False Command Sequence
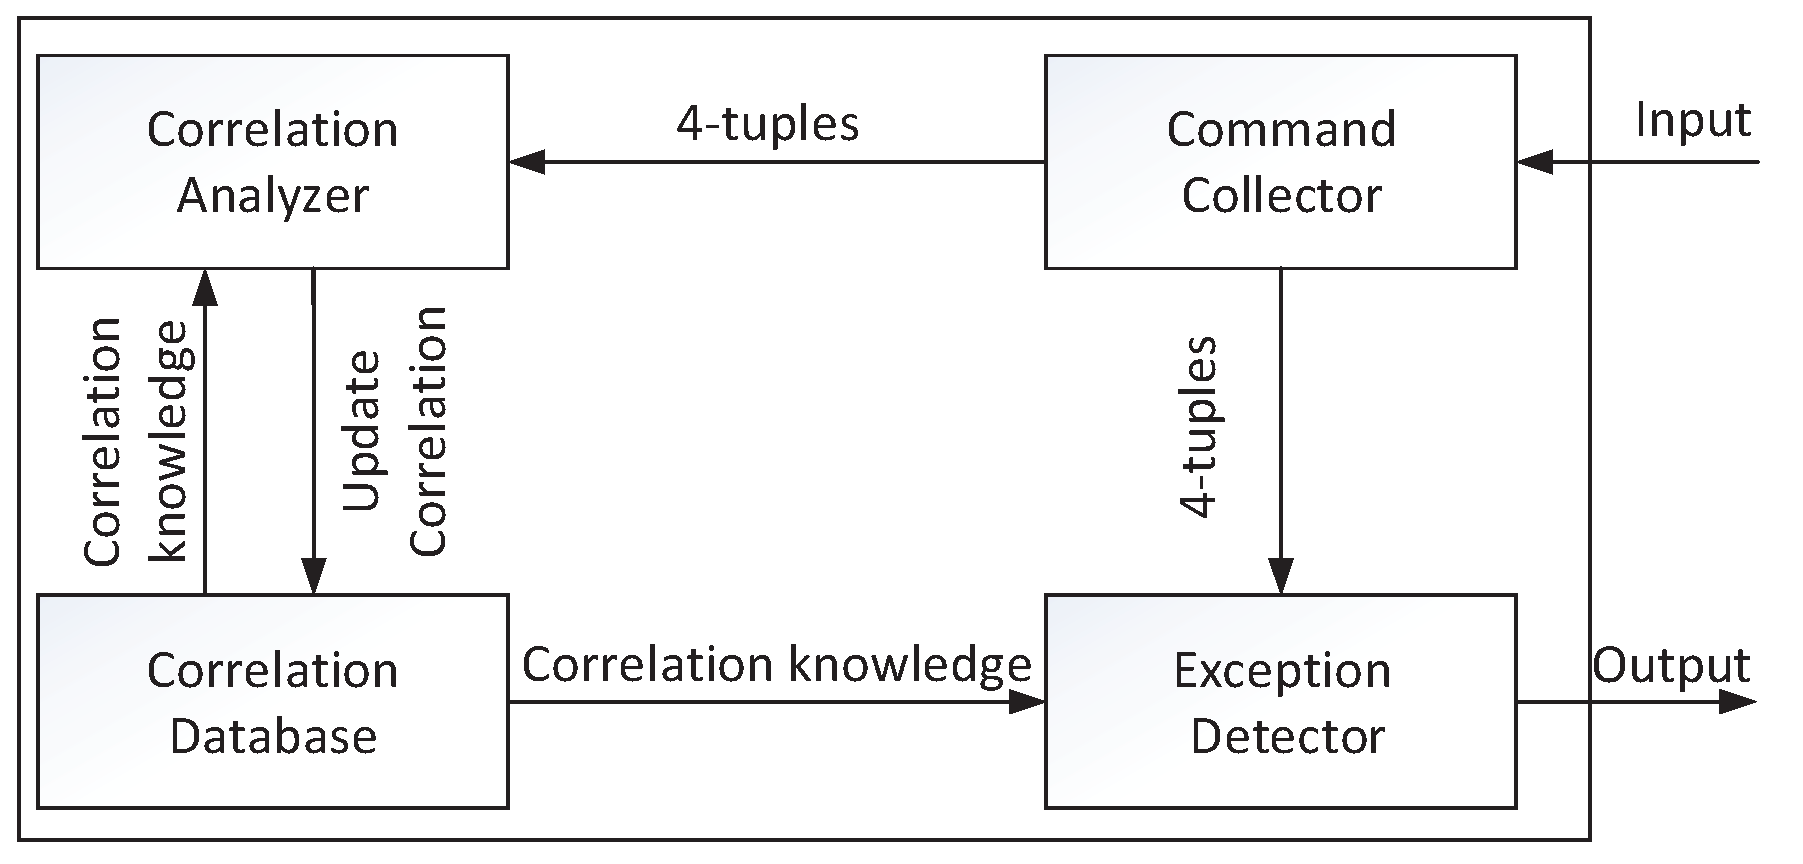
4. Detection Framework Based on Correlations among Two-Tier Command Sequences
4.1. Detection Framework
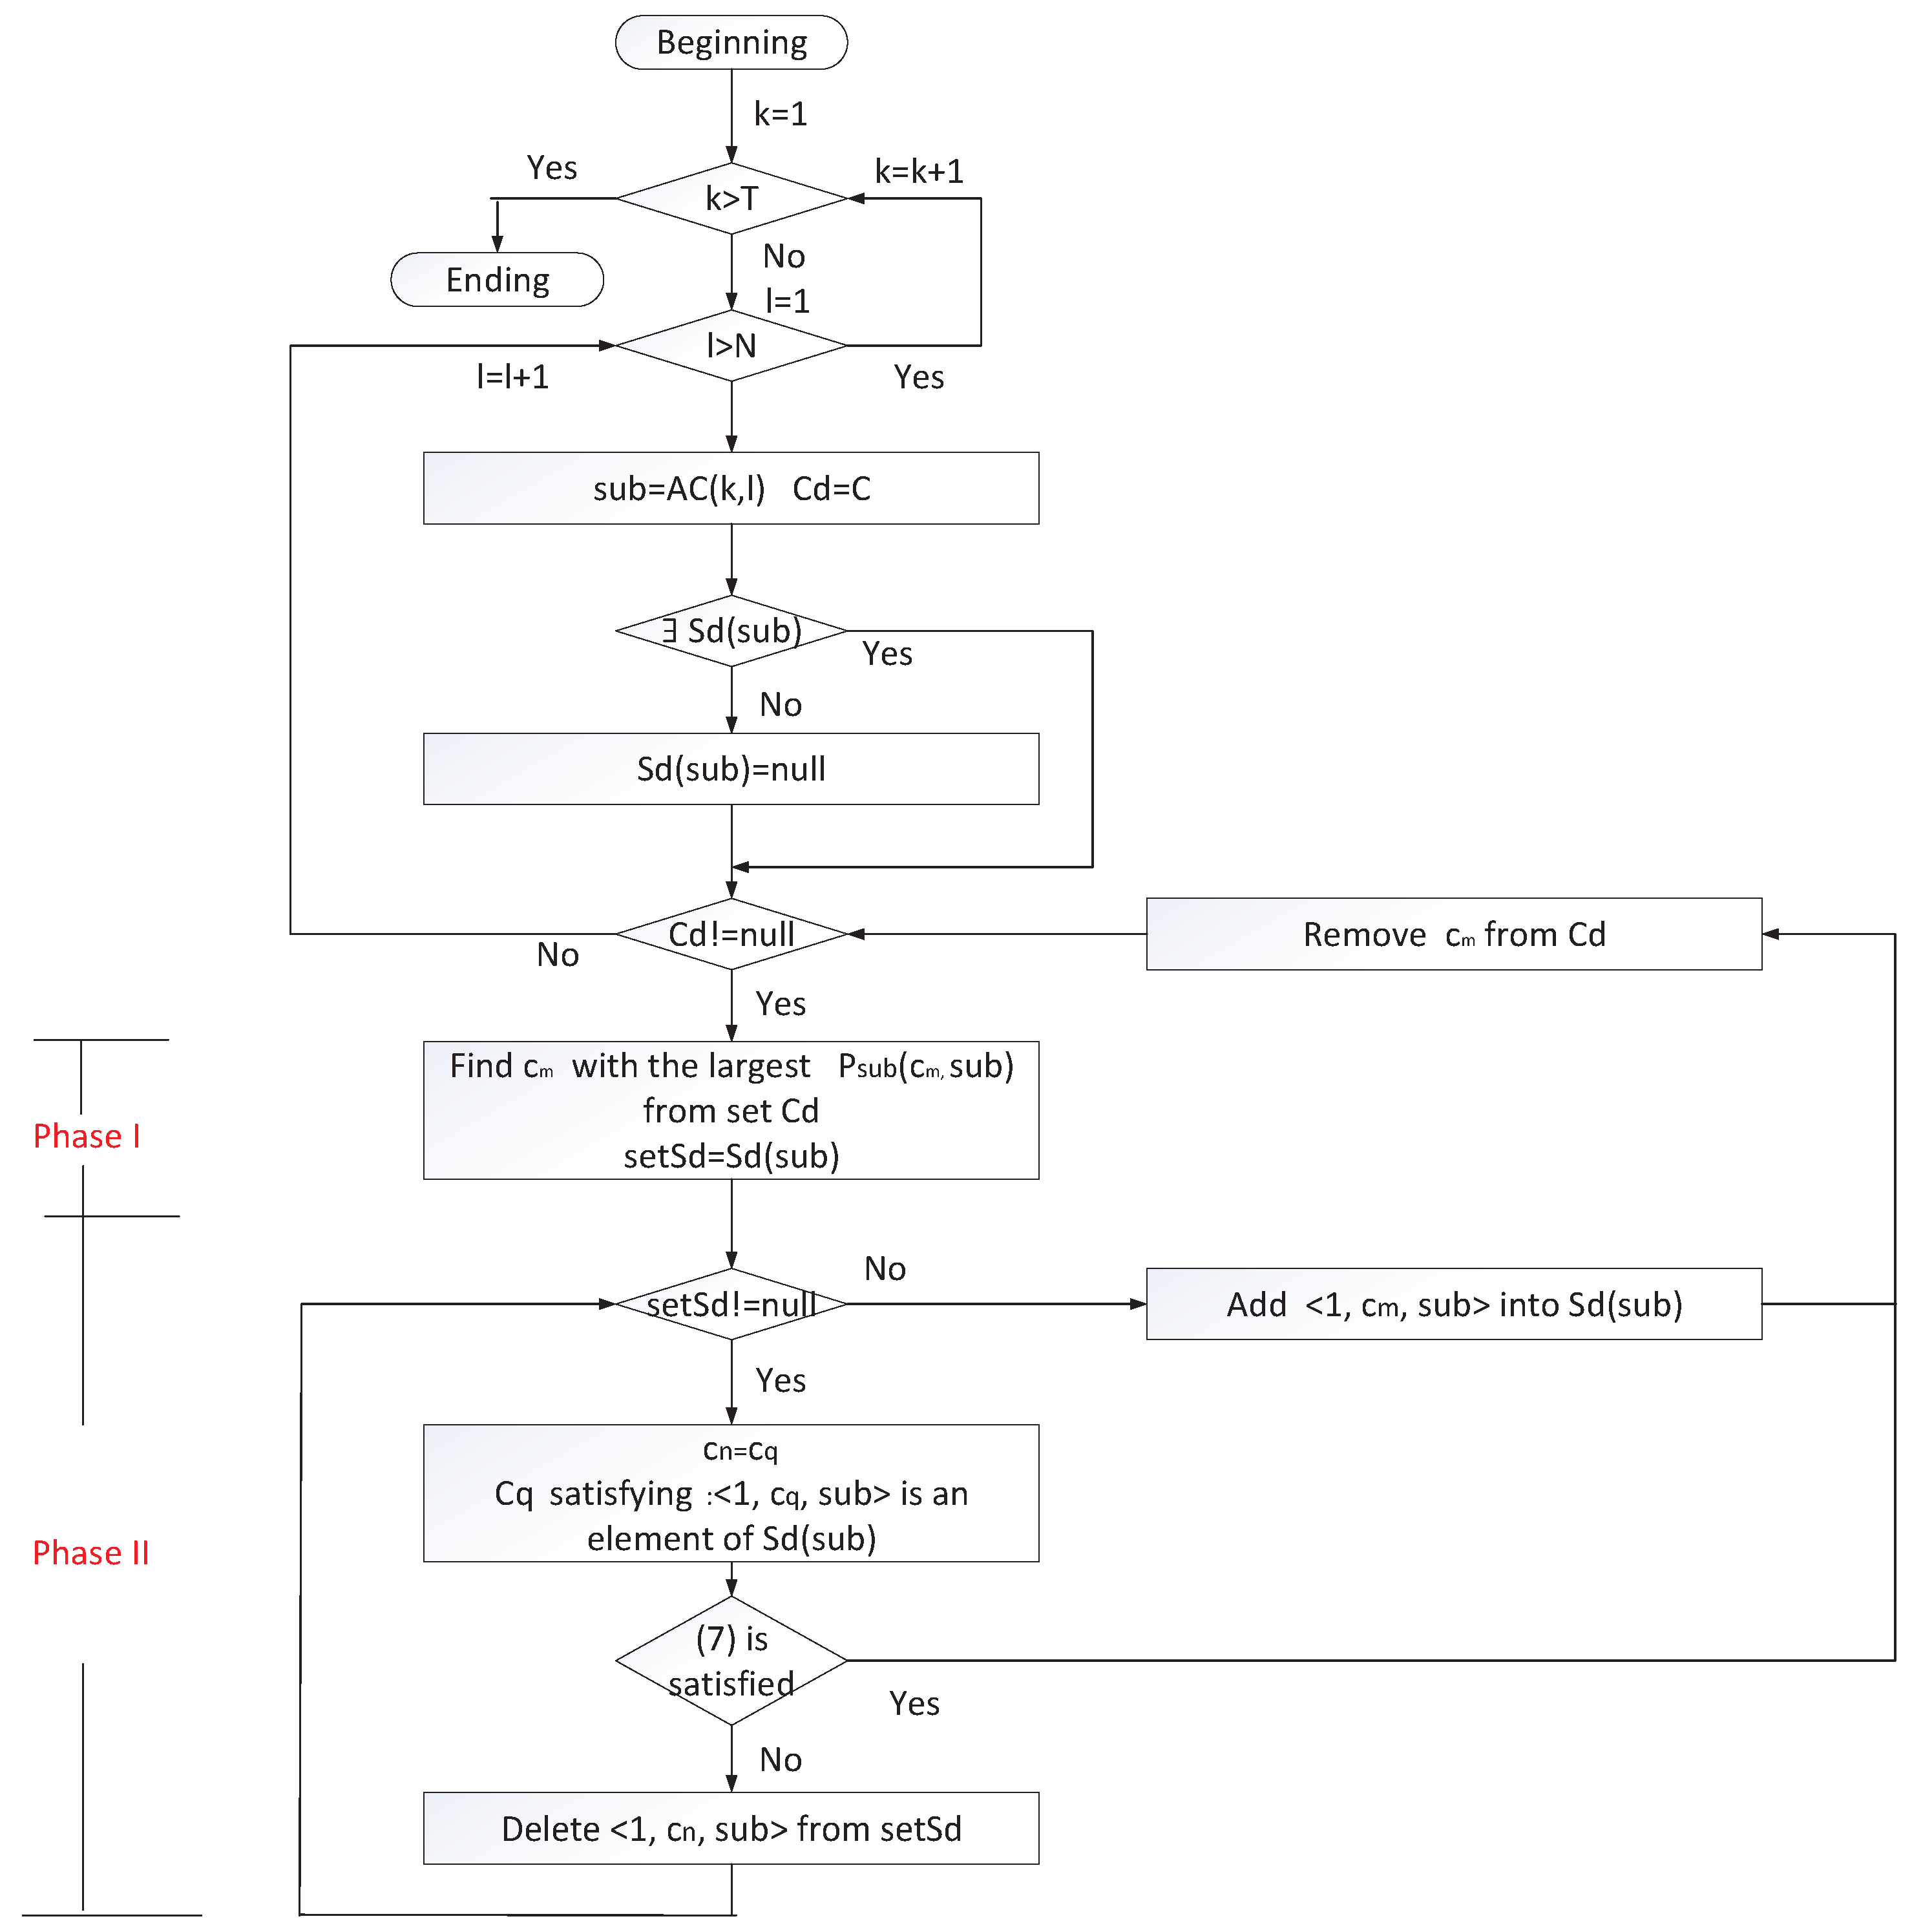
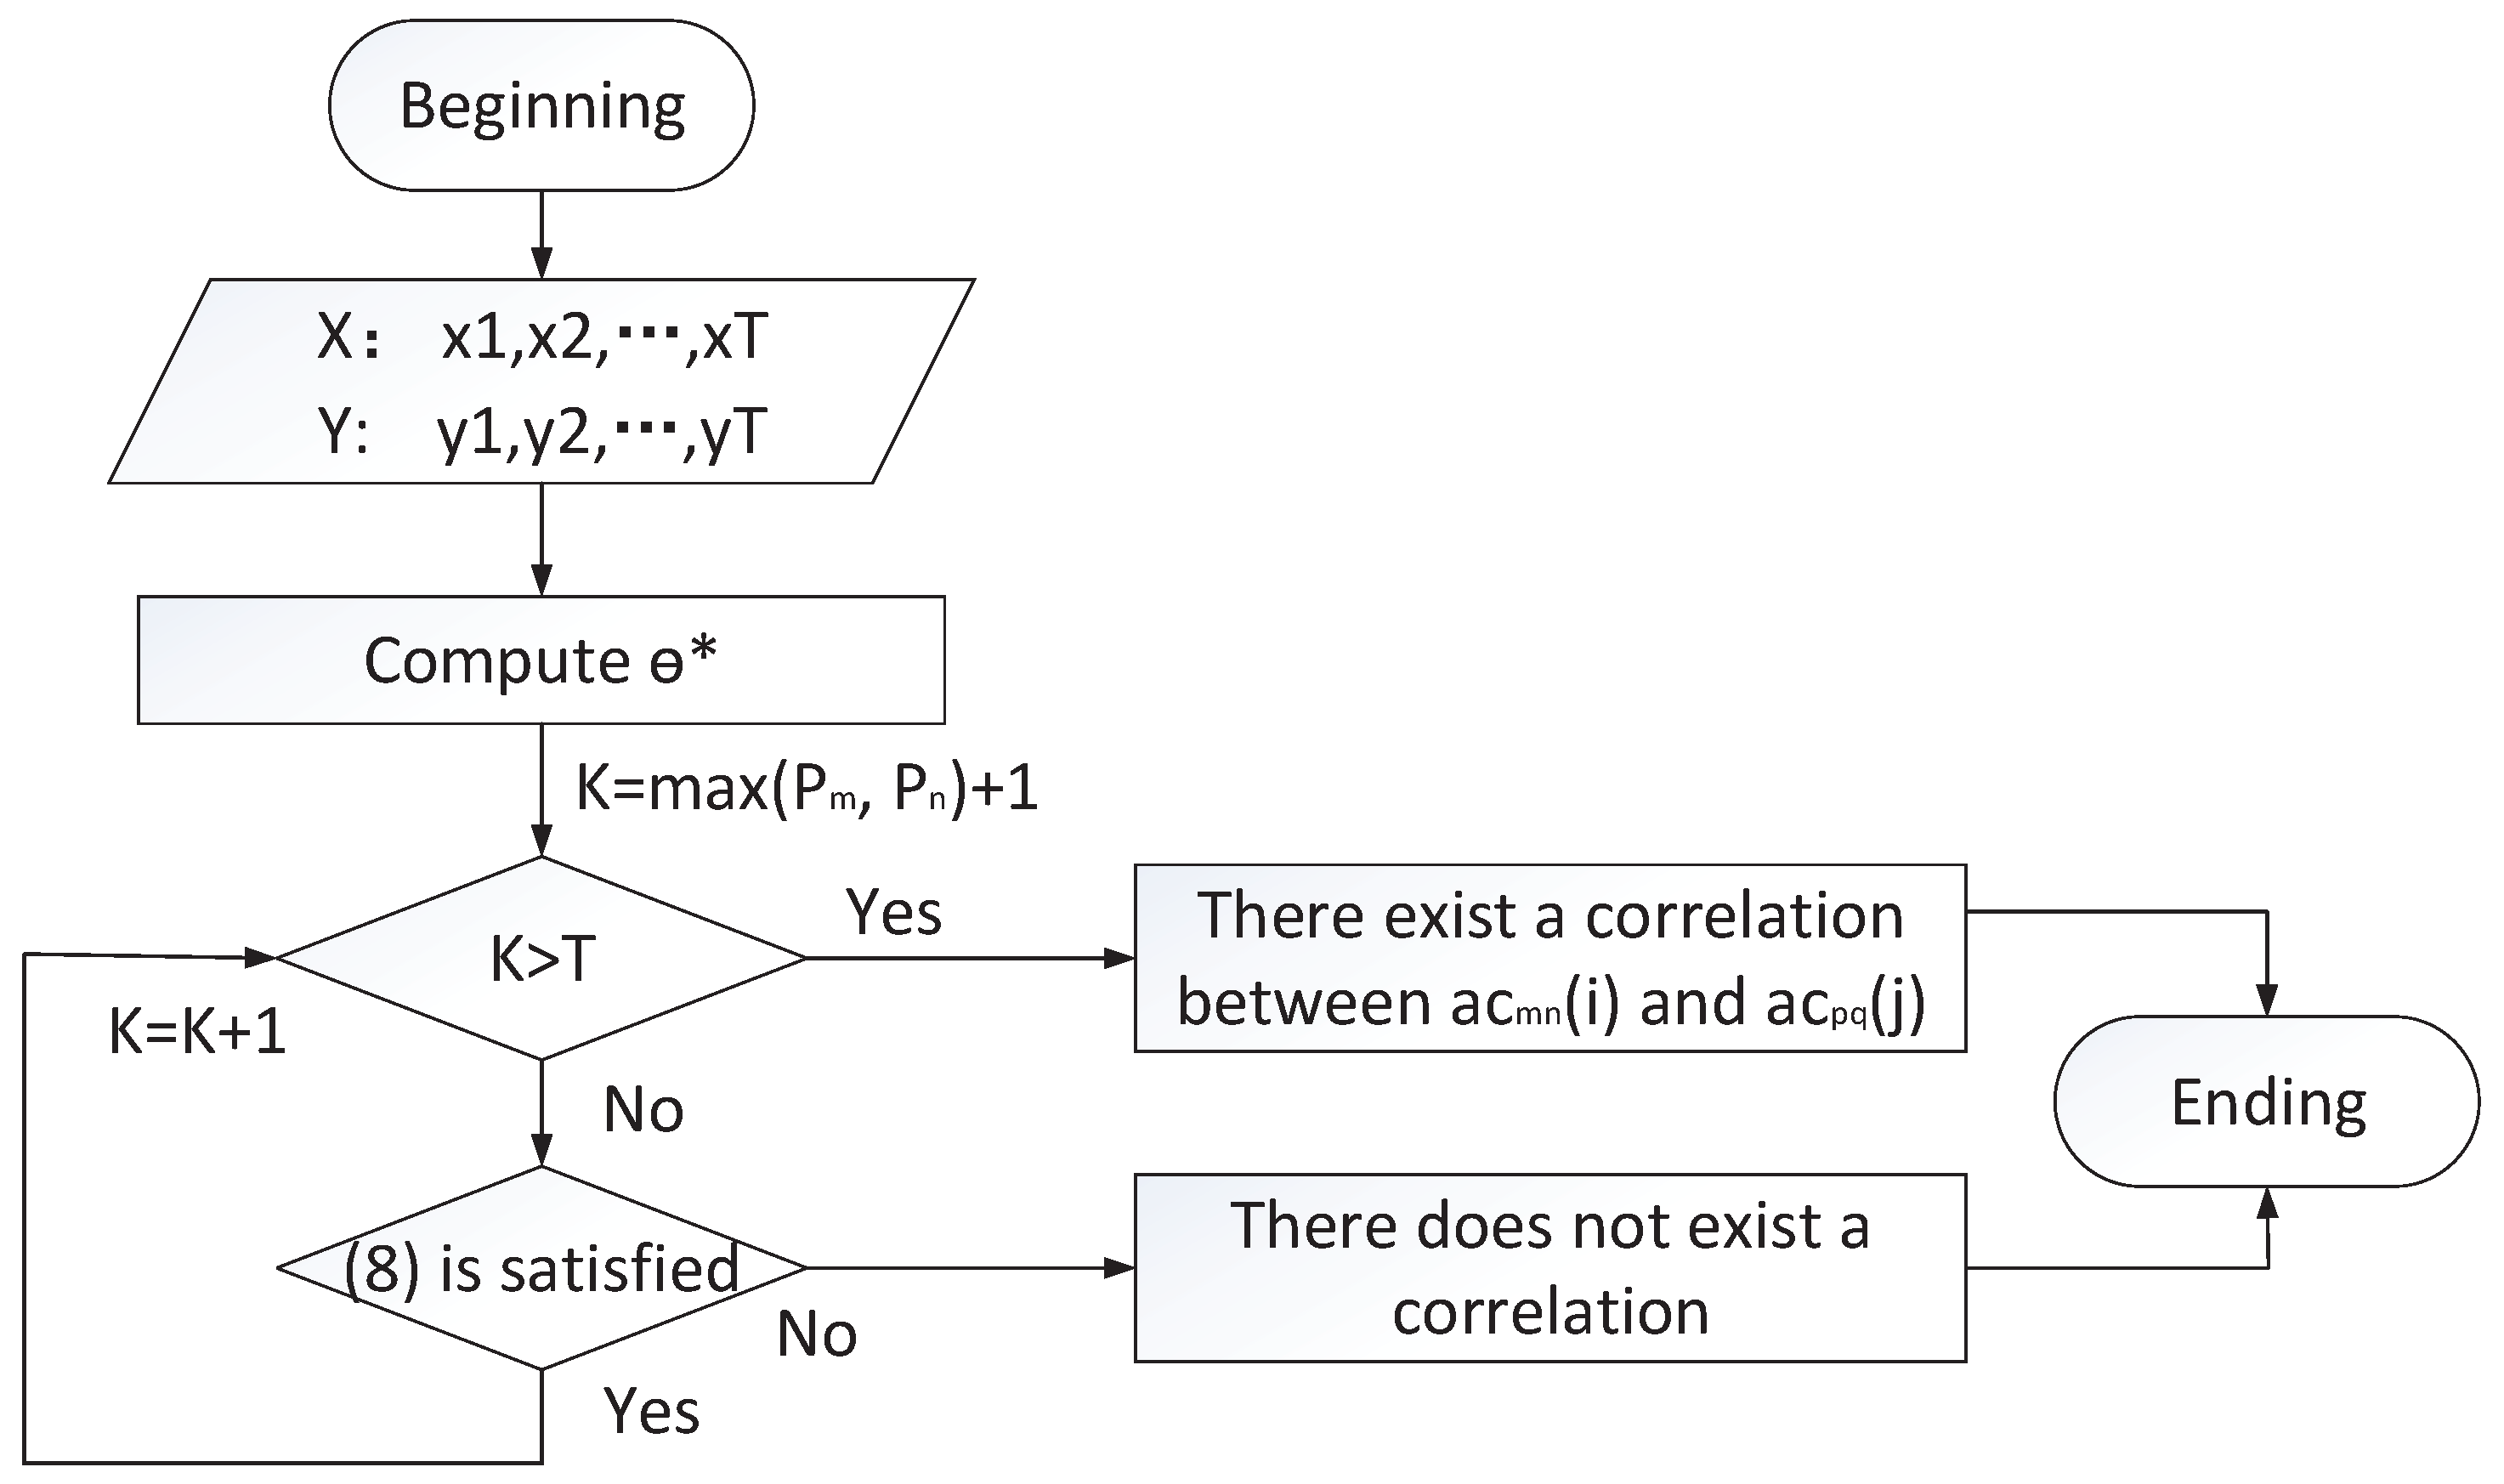
4.2. Correlation Mining and Exception Detection
4.2.1. Correlation between a Command and Sub-Commands
4.2.2. Correlation among Executed Sub-Commands
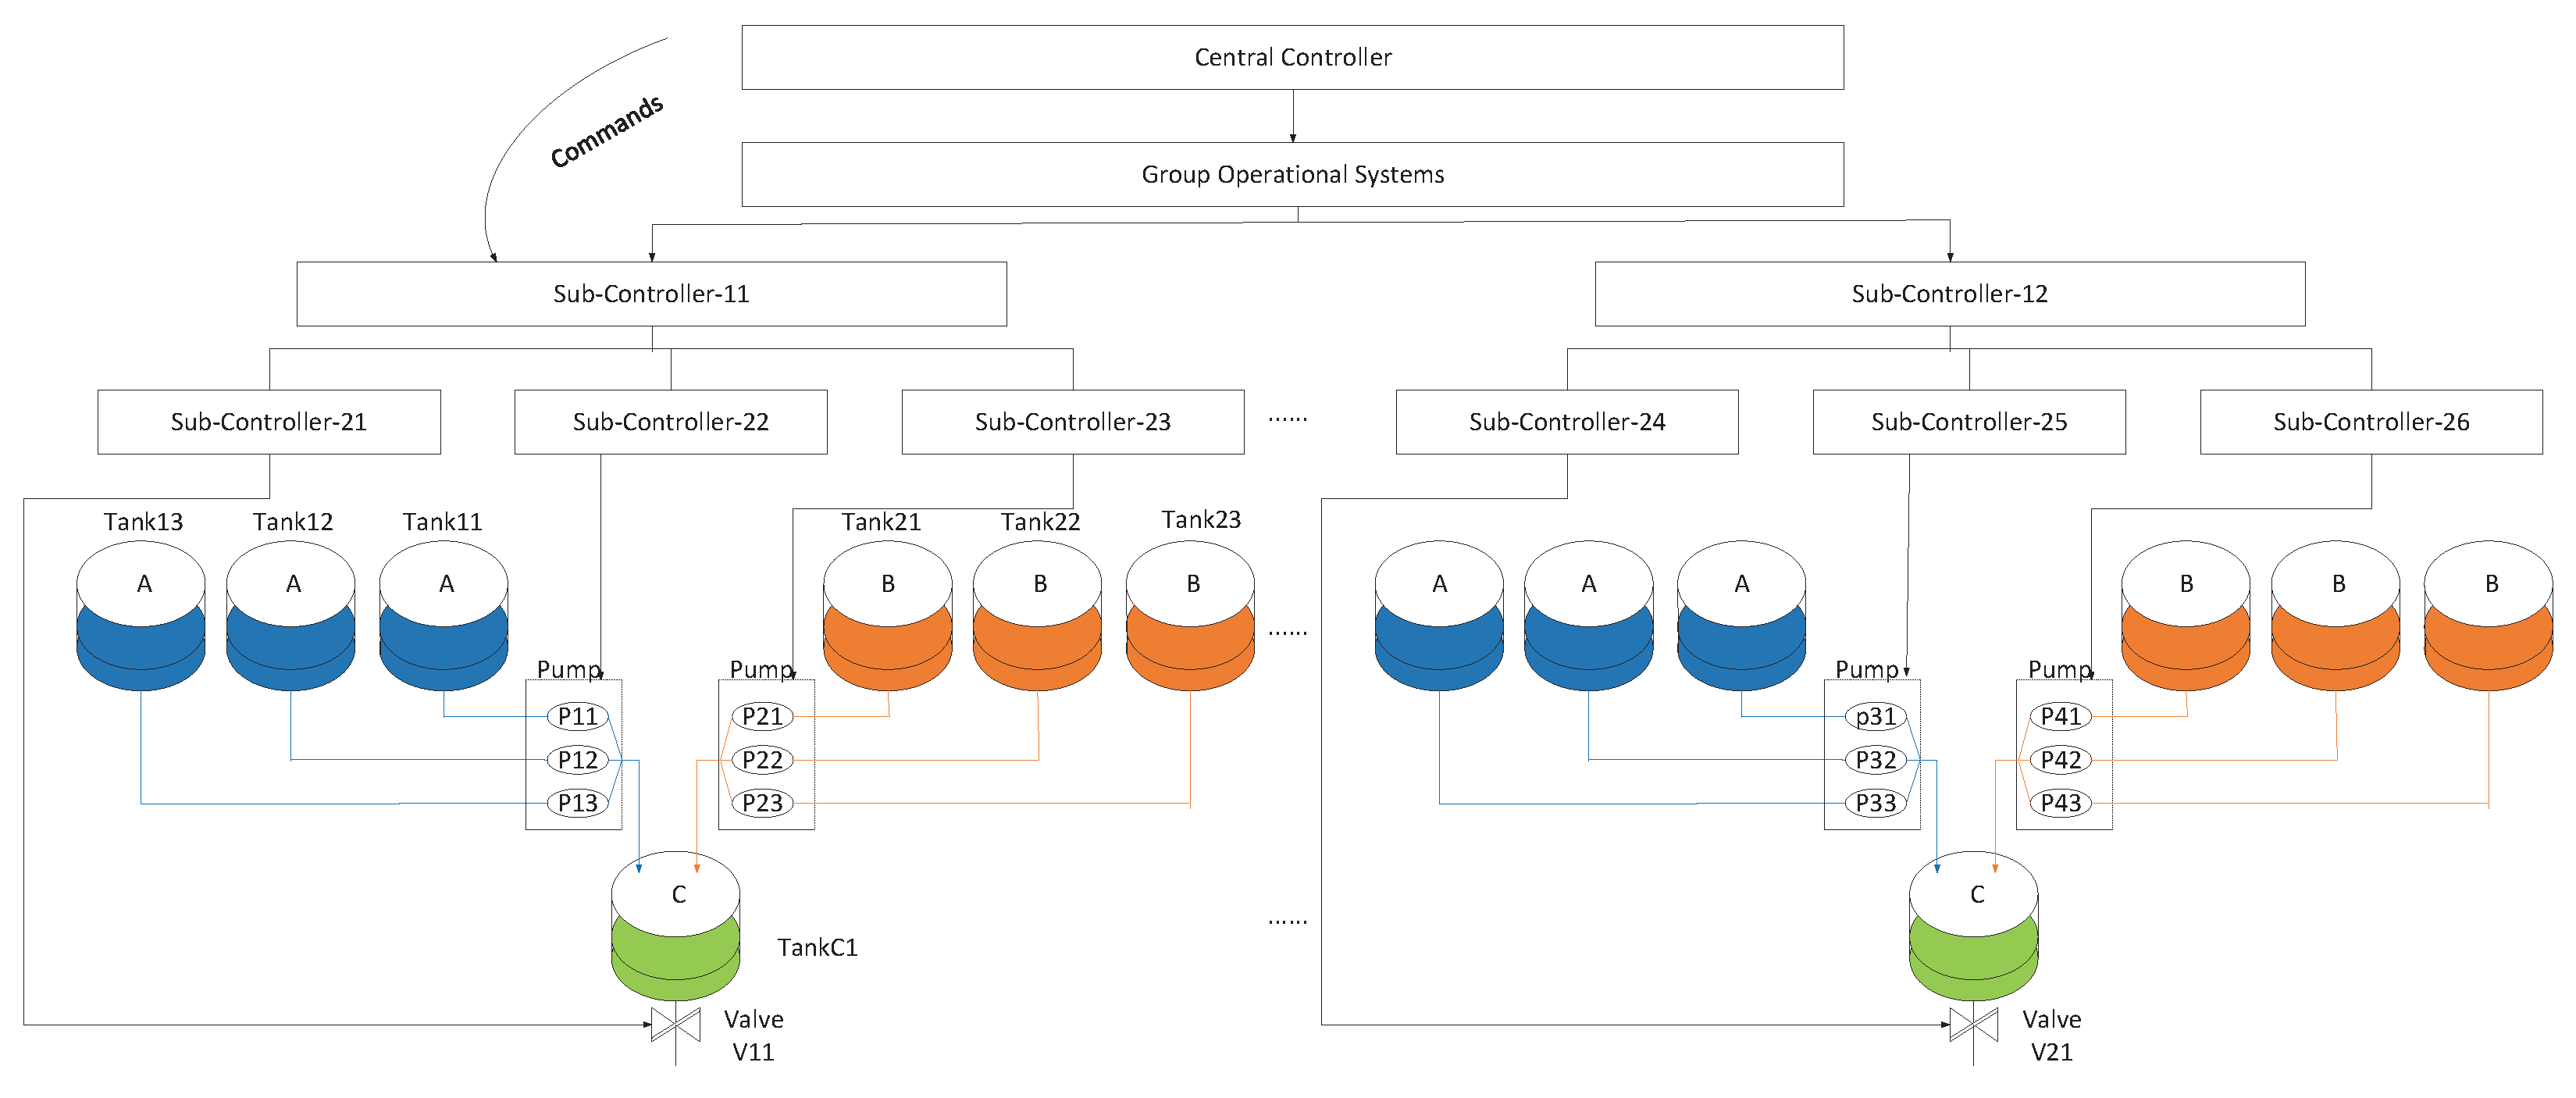
5. Case Study
5.1. Scenarios
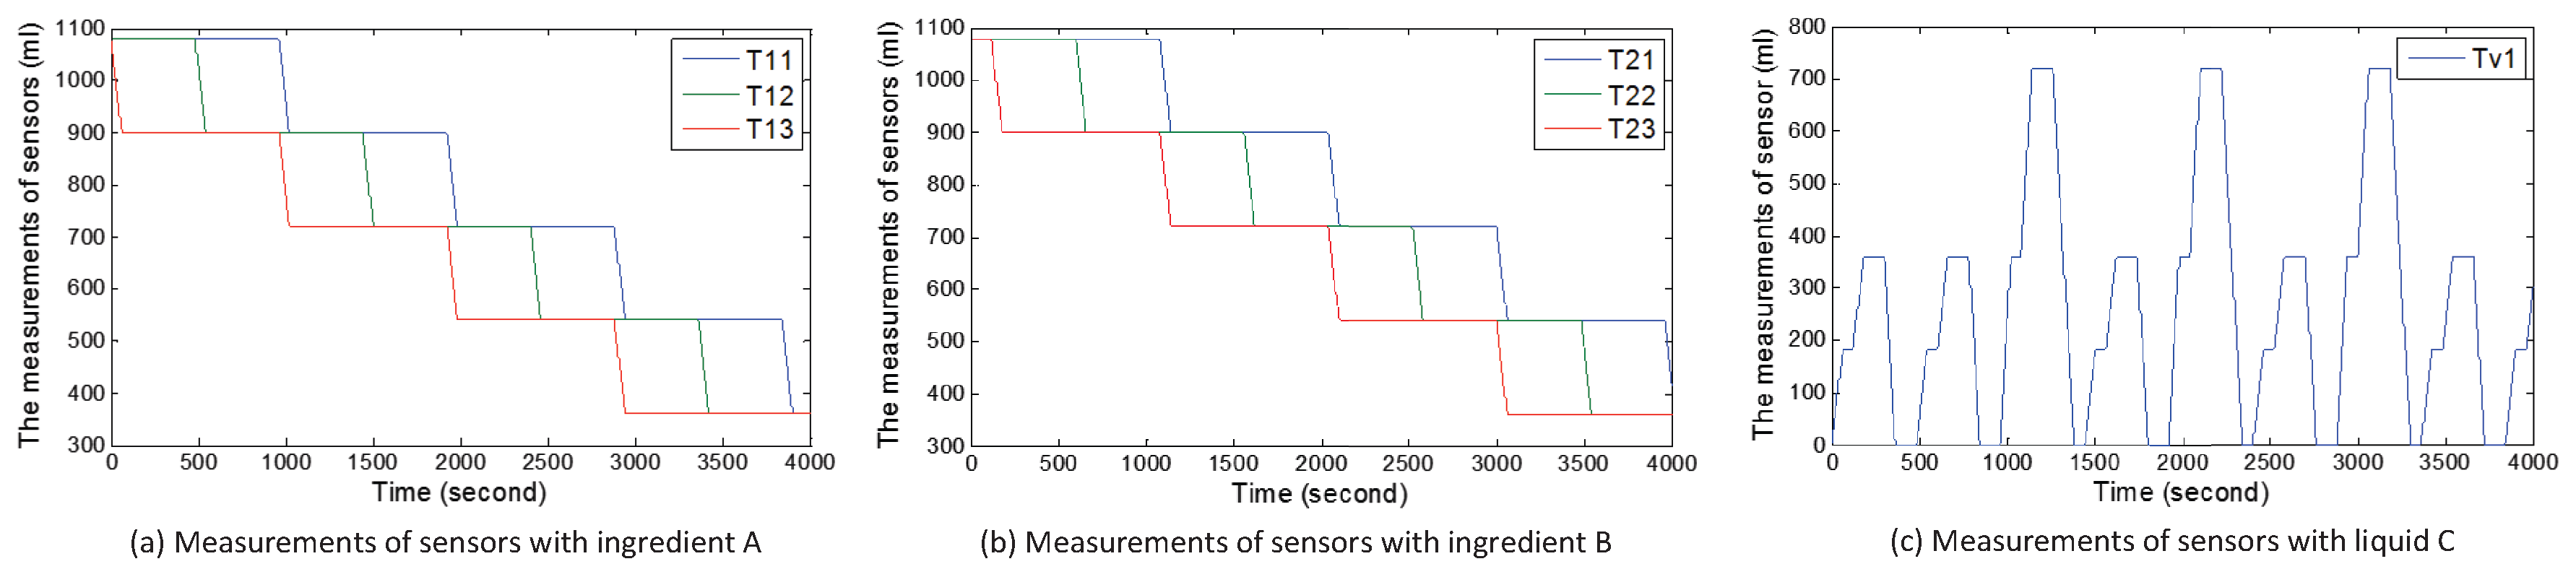
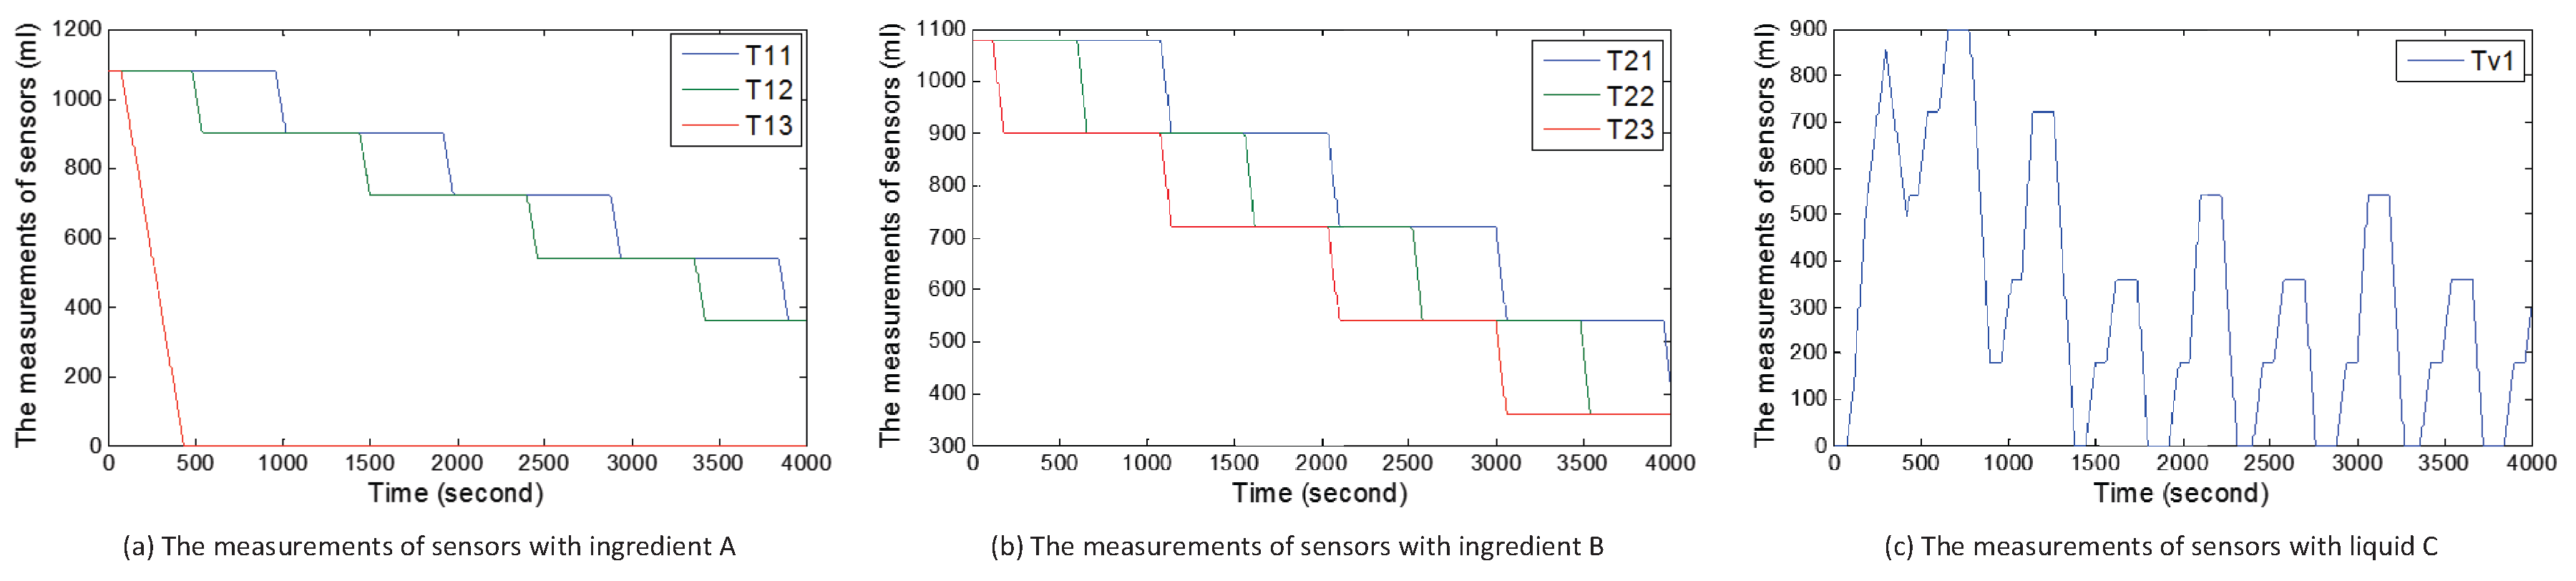
5.1.1. Scenario 1:3-Tank System
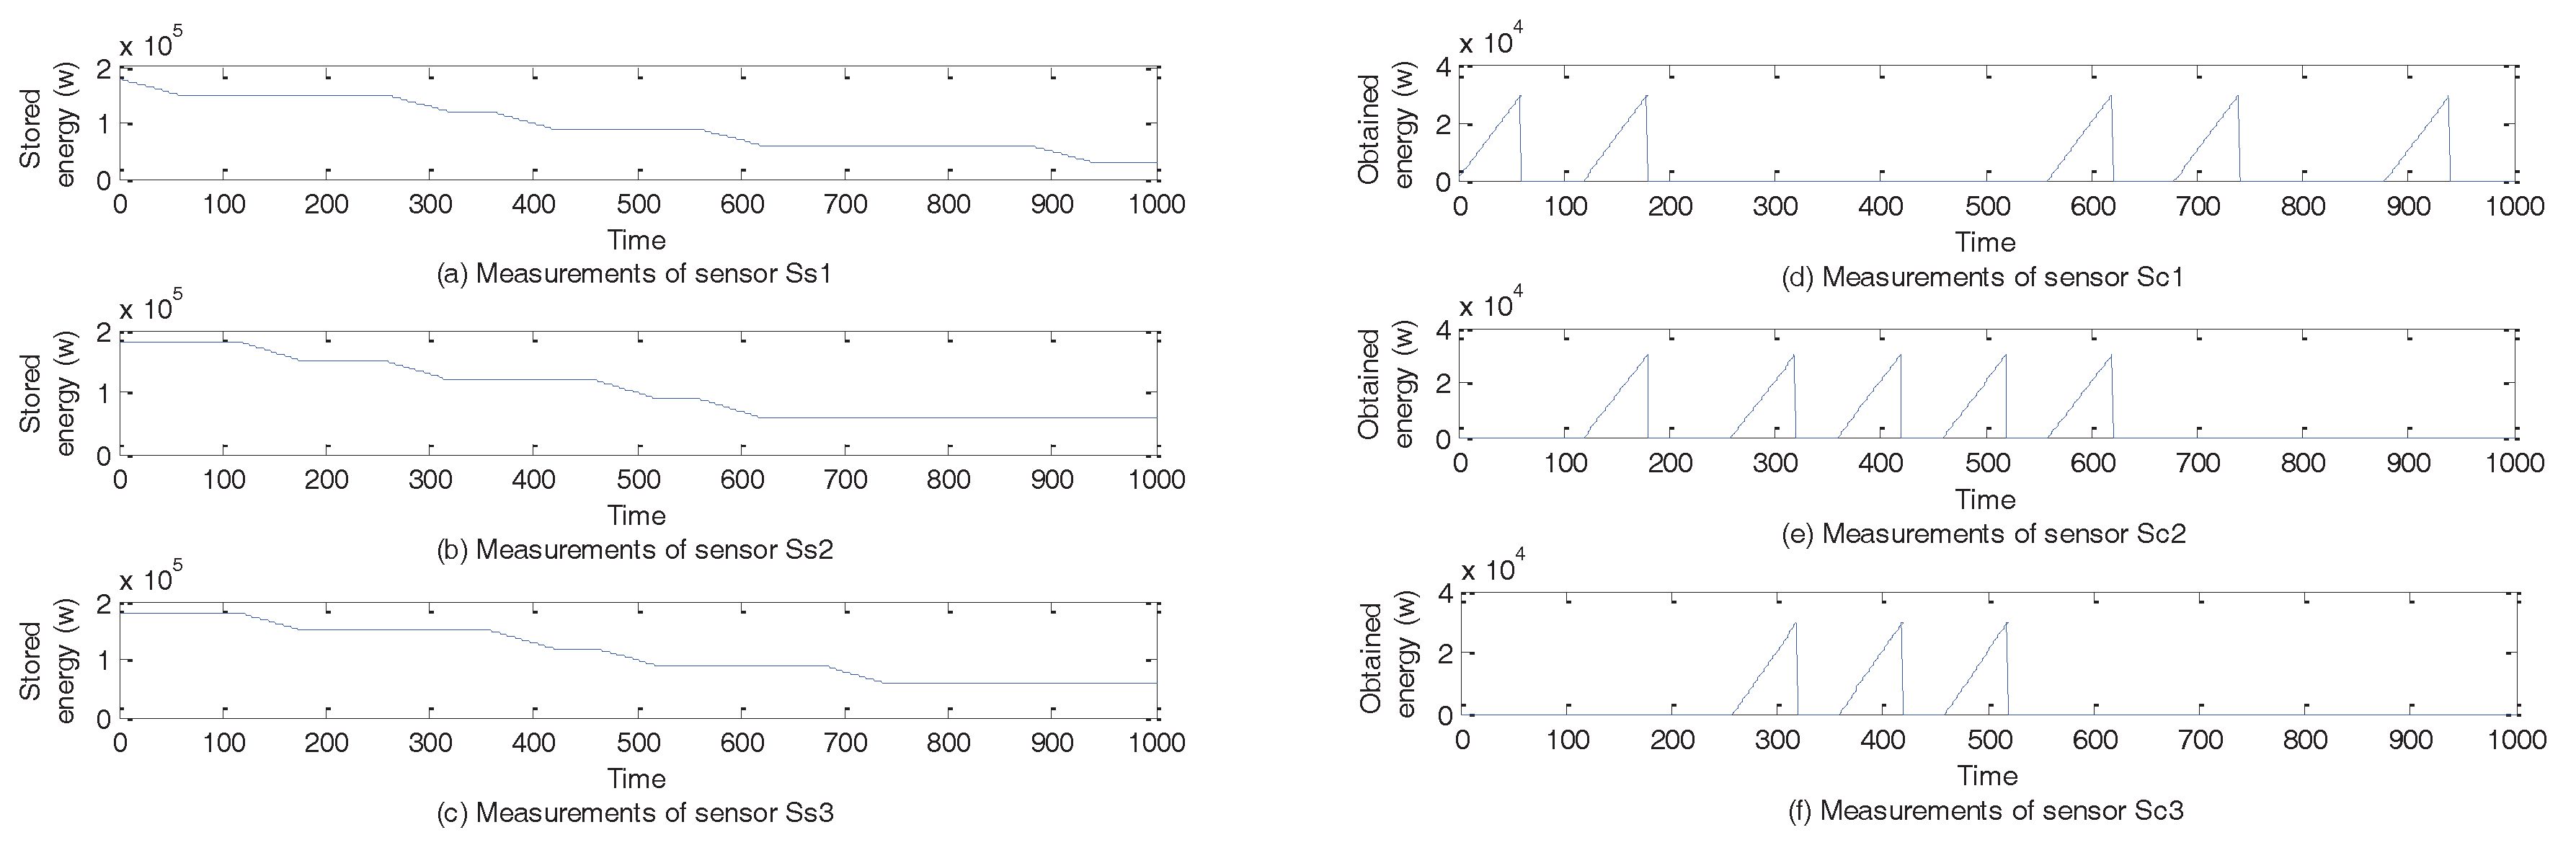
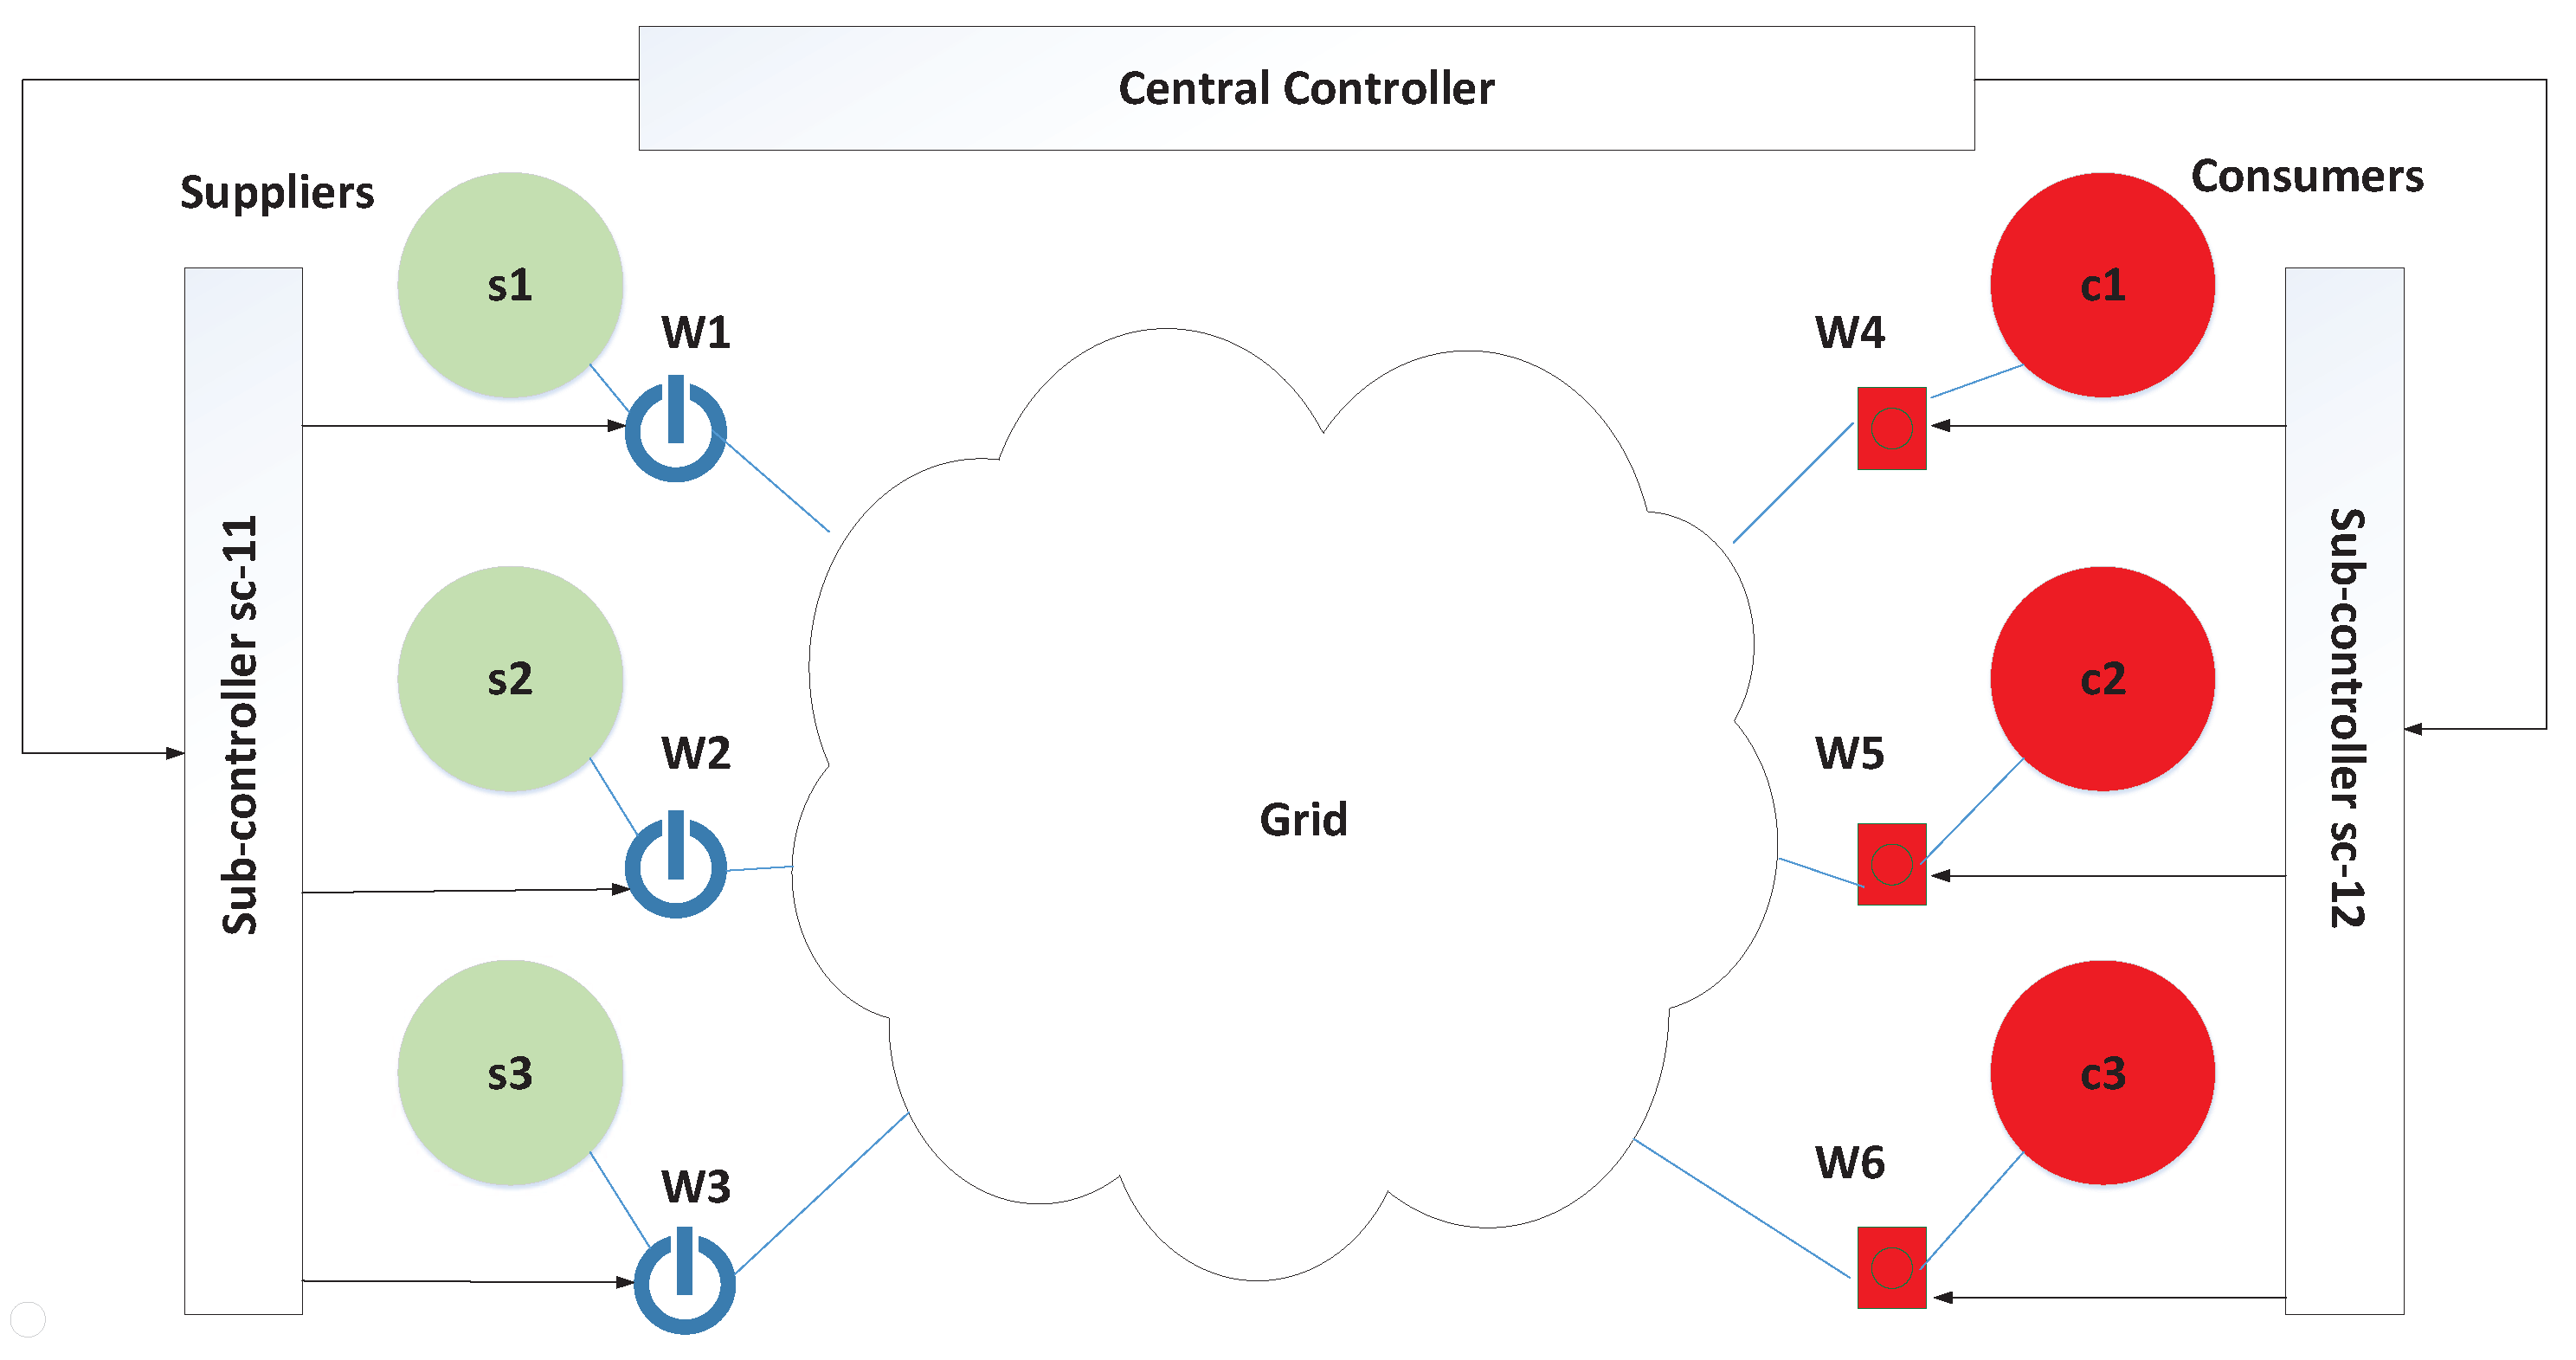
5.1.2. Scenario 2: Energy Trading System in the Smart Grid
5.2. Attack Cases
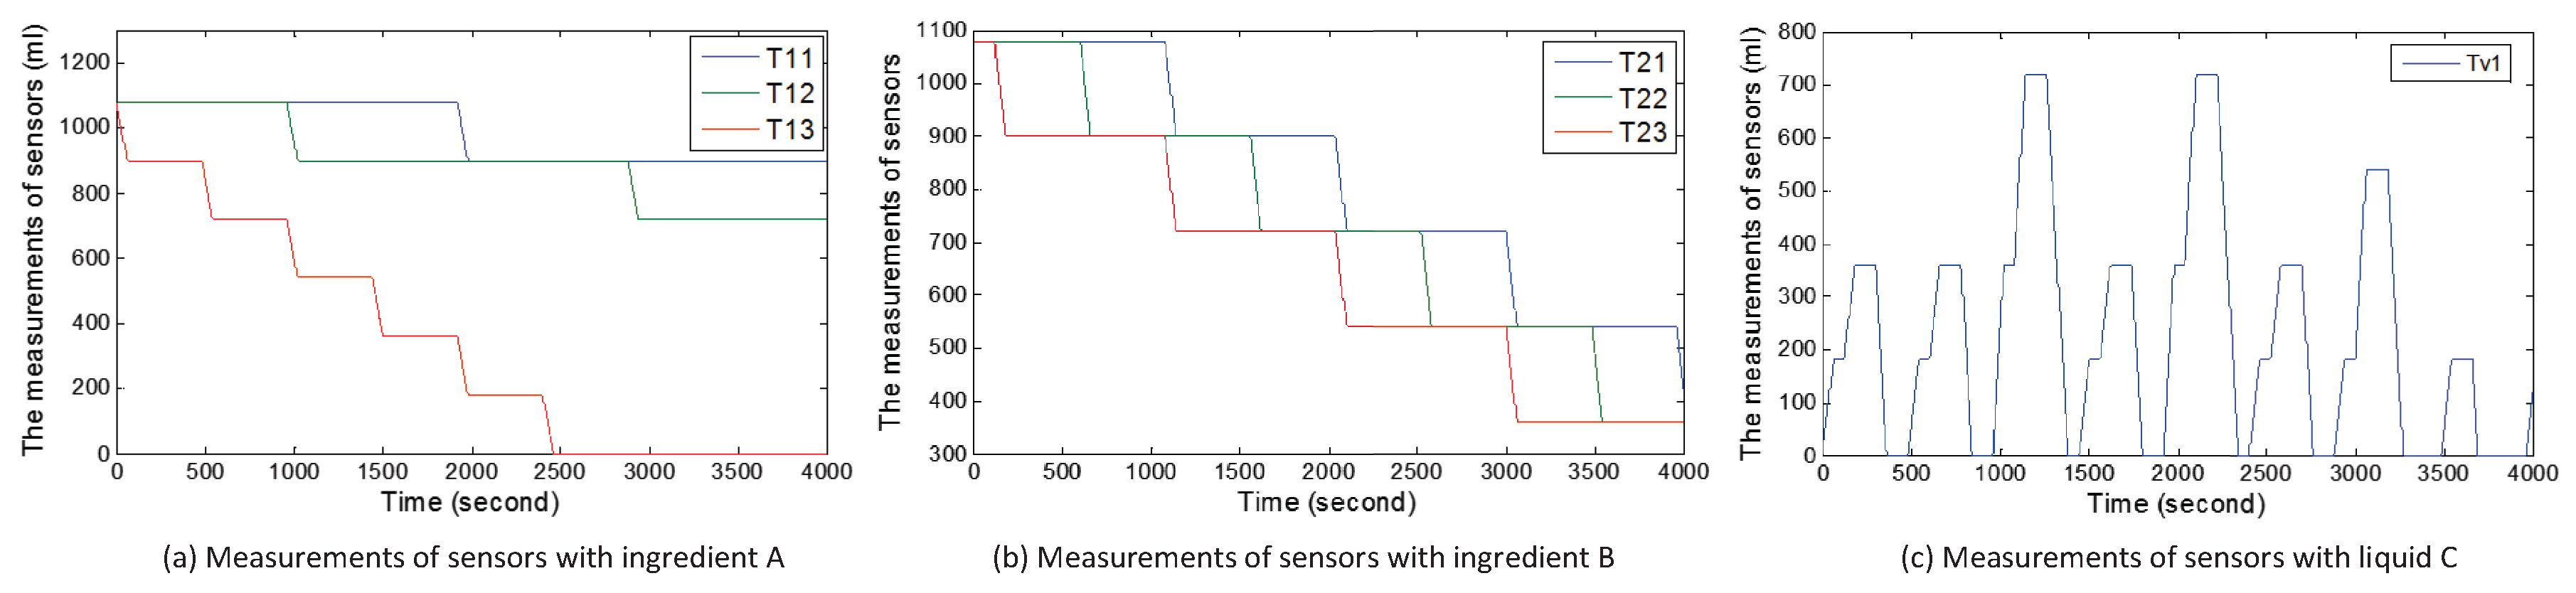
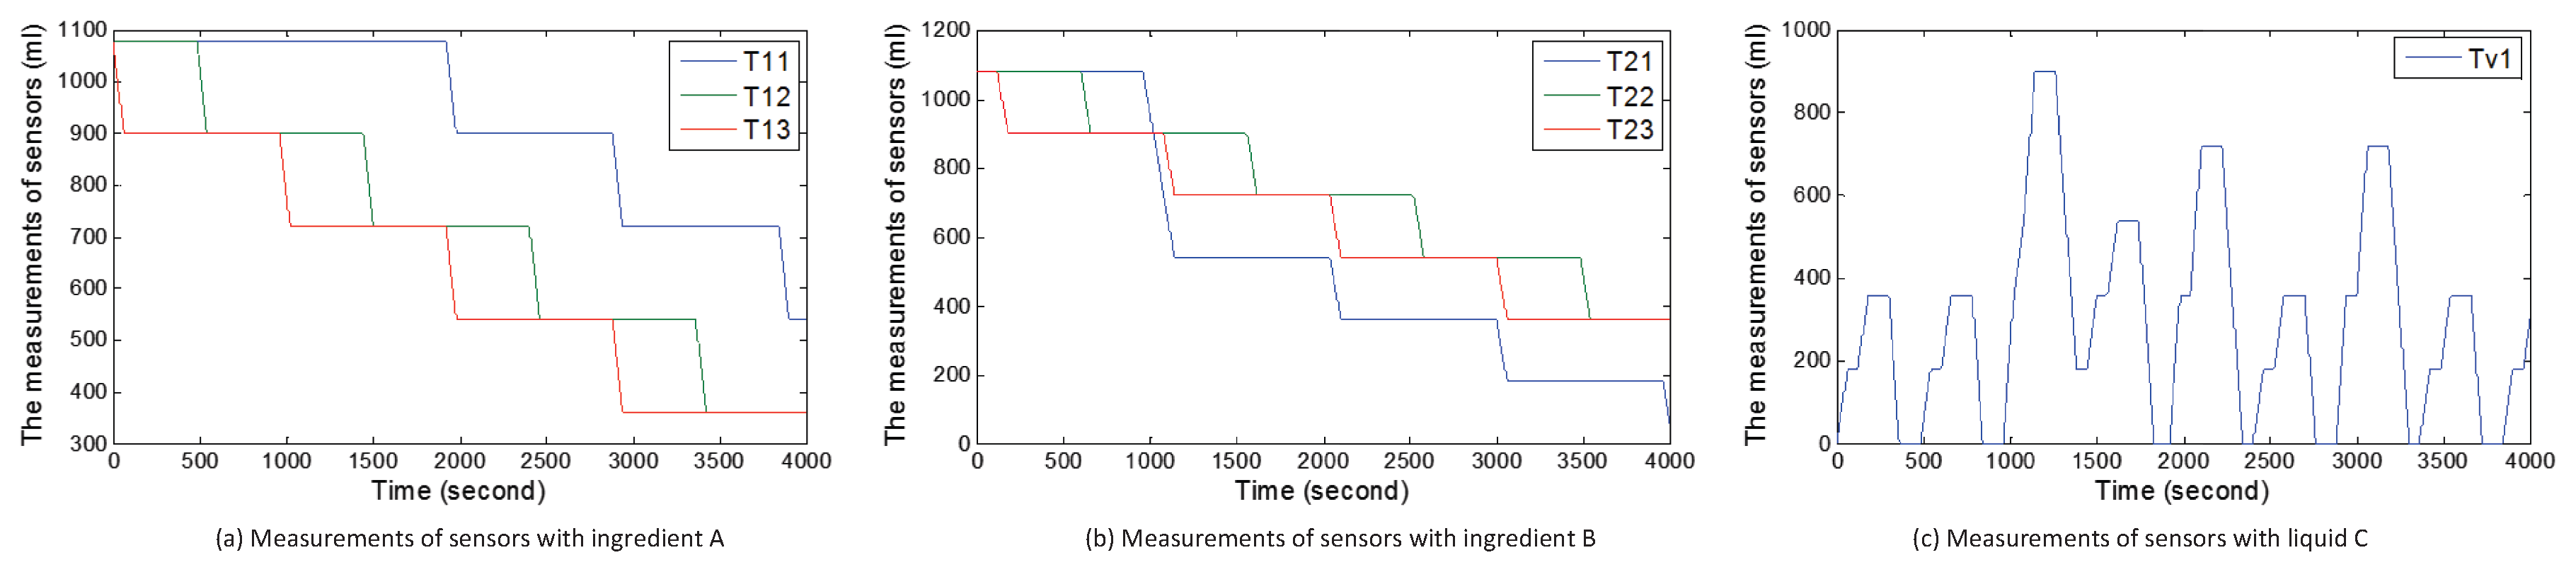
5.3. Attack Impact
5.3.1. Case 1
5.3.2. Case 2
5.3.3. Case 3
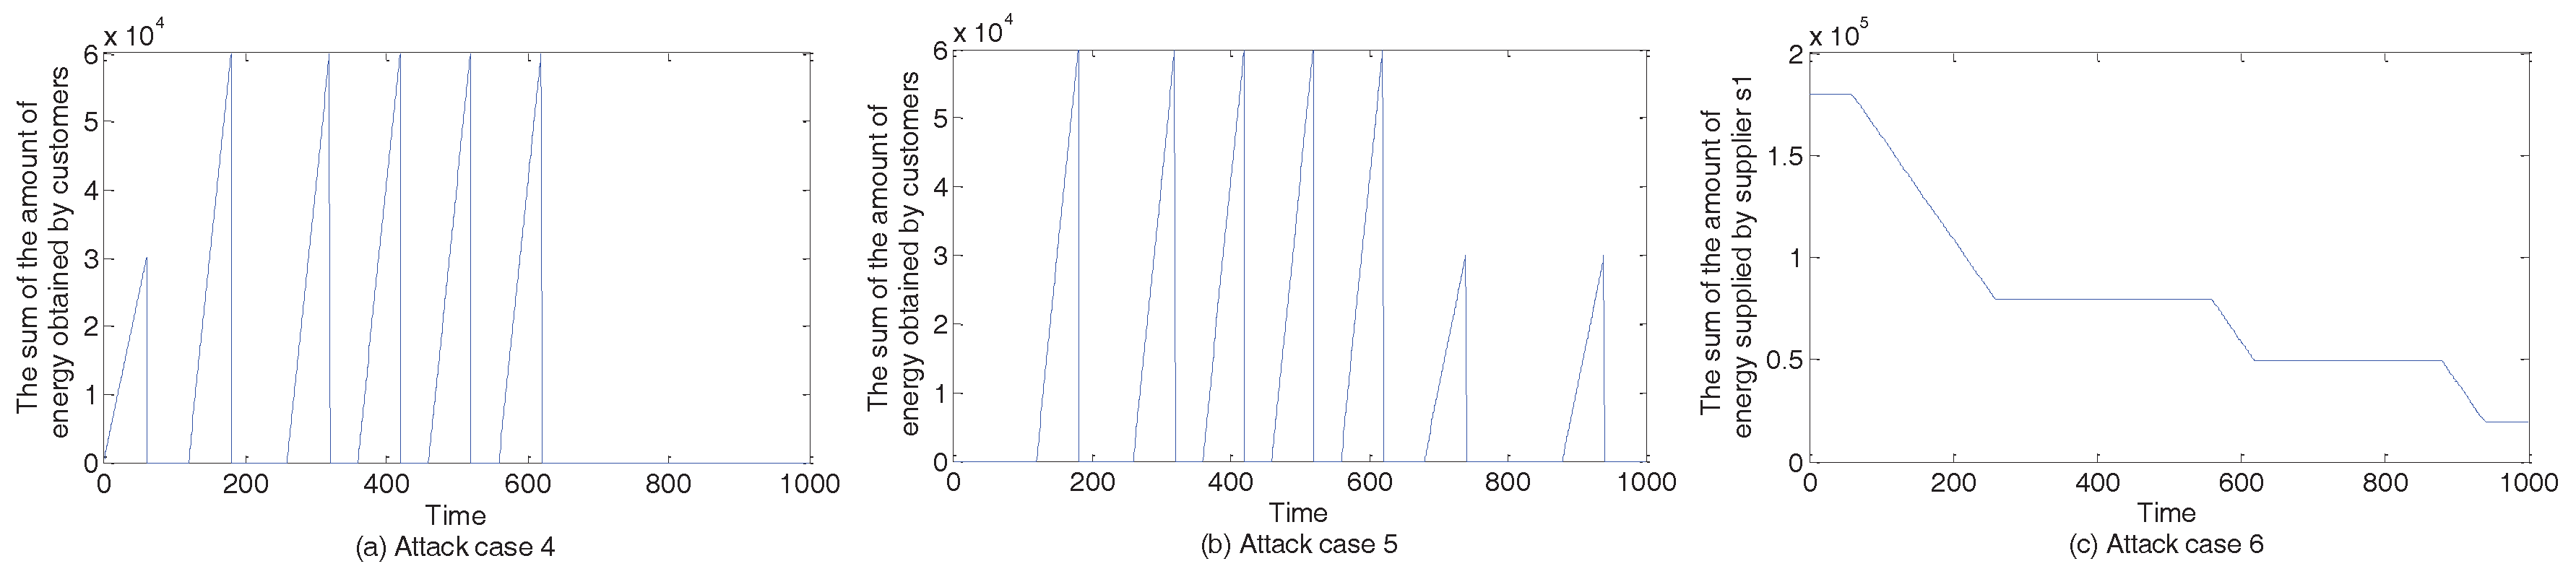
5.3.4. Case 4–Case 6
5.4. Effectiveness of Our Detection Framework
6. Discussion of Detection Framework Enhancement
7. Conclusions
Acknowledgments
Author Contributions
Conflicts of Interest
References
- Fraga-Lamas, P.; Fernández-Caramés, T.M.; Castedo, L. Towards the Internet of Smart Trains: A Review on Industrial IoT-Connected Railways. Sensors 2017, 17, 1457. [Google Scholar] [CrossRef] [PubMed]
- Min, B.; Varadharajan, V. Cascading Attacks Against Smart Grid Using Control Command Disaggregation and Services. In Proceedings of the 31st Annual ACM Symposium on Applied Computing, Pisa, Italy, 4–8 April 2016; pp. 2142–2147. [Google Scholar]
- Taft, J.D. Control Command Disaggregation and Distribution within A Utility Grid. U.S. Patent 20120310435, 2012. [Google Scholar]
- Remmersmann, T.; Schade, U.; Schlick, C. Supervisory control of multi-robot systems by disaggregation and scheduling of quasi-natural language commands. In Proceedings of the 2012 IEEE International Conference on Systems, Man, and Cybernetics (SMC), Seoul, Korea, 14–17 October 2012; pp. 315–320. [Google Scholar]
- Zhao, C.; Topcu, U.; Low, S.H. Optimal Load Control via Frequency Measurement and Neighborhood Area Communication. IEEE Trans. Power Syst. 2013, 28, 3576–3587. [Google Scholar] [CrossRef]
- Hu, J.; Cao, J.; Guerrero, J.M.; Yong, T.; Yu, J. Improving Frequency Stability Based on Distributed Control of Multiple Load Aggregators. IEEE Trans. Smart Grid 2017, 8, 1553–1567. [Google Scholar] [CrossRef]
- Sargolzaei, A.; Yen, K.; Abdelghani, M. Delayed inputs attack on load frequency control in smart grid. In Proceedings of the Innovative Smart Grid Technologies Conference (ISGT), Washington, DC, USA, 19–22 February 2014; pp. 1–5. [Google Scholar]
- Mitchell, R.; Chen, I.R. Modeling and Analysis of Attacks and Counter Defense Mechanisms for Cyber Physical Systems. IEEE Trans. Reliab. 2016, 65, 350–358. [Google Scholar] [CrossRef]
- Amini, S.; Mohsenian-Rad, H.; Pasqualetti, F. Dynamic load altering attacks in smart grid. In Proceedings of the 2015 IEEE Power Energy Society Innovative Smart Grid Technologies Conference (ISGT), Washington, DC, USA, 18–20 February 2015; pp. 1–10. [Google Scholar]
- Liu, Y.; Ning, P.; Reiter, M.K. False Data Injection Attacks Against State Estimation in Electric Power Grids. In Proceedings of the 16th ACM Conference on Computer and Communications Security, Chicago, IL, USA, 9–13 November 2009; pp. 21–32.
- Yi, P.; Zhu, T.; Zhang, Q.; Wu, Y.; Li, J. A denial of service attack in advanced metering infrastructure network. In Proceedings of the 2014 IEEE International Conference on Communications (ICC), Sydney, Australia, 10–14 June 2014; pp. 1029–1034. [Google Scholar]
- Asri, S.; Pranggono, B. Impact of Distributed Denial-of-Service Attack on Advanced Metering Infrastructure. Wirel. Pers. Commun. 2015, 83, 2211–2223. [Google Scholar] [CrossRef]
- Gacia, L.A.; Brasser, F.; Cintuglu, M.H.; Sadeghi, A.R. Hey, My Malware Knows Physics Attacking PLCs with Physical Model Aware Rootkit. In Proceedings of the Network & Distributed System Security Symposium, San Diego, CA, USA, 26–28 February 2017; pp. 1–15. [Google Scholar]
- Vu, Q.D.; Tan, R.; Yau, D.K.Y. On applying fault detectors against false data injection attacks in cyber-physical control systems. In Proceedings of the IEEE INFOCOM 2016—The 35th Annual IEEE International Conference on Computer Communications, San Francisco, CA, USA, 10–14 April 2016; pp. 1–9. [Google Scholar]
- Vuong, T.P.; Loukas, G.; Gan, D.; Bezemskij, A. Decision tree-based detection of denial of service and command injection attacks on robotic vehicles. In Proceedings of the 2015 IEEE International Workshop on Information Forensics and Security (WIFS), Rome, Italy, 16–19 November 2015; pp. 1–6. [Google Scholar]
- Li, W.; Xie, L.; Deng, Z.; Wang, Z. False sequential logic attack on SCADA system and its physical impact analysis. Comput. Secur. 2016, 58, 149–159. [Google Scholar] [CrossRef]
- Quarta, D.; Pogliani, M.; Polino, M.; Maggi, F. An Experimental Security Analysis of an Industrial Robot Controller. In Proceedings of the 2017 IEEE Symposium on Security and Privacy (SP), San Jose, CA, USA, 22–26 May 2017; pp. 268–286. [Google Scholar]
- Tan, R.; Nguyen, H.H.; Foo, E.Y.S.; Dong, X. Optimal False Data Injection Attack against Automatic Generation Control in Power Grids. In Proceedings of the 2016 ACM/IEEE 7th International Conference on Cyber-Physical Systems (ICCPS), Vienna, Austria, 11–14 April 2016; pp. 1–10. [Google Scholar]
- Li, B.; Lu, R.; Wang, W.; Choo, K.K.R. Distributed host-based collaborative detection for false data injection attacks in smart grid cyber-physical system. J. Parallel Distrib. Comput. 2017, 103, 32–41. [Google Scholar] [CrossRef]
- Wang, J.K.; Peng, C. Analysis of Time Delay Attacks Against Power Grid Stability. In Proceedings of the 2nd Workshop on Cyber-Physical Security and Resilience in Smart Grids, Pittsburgh, PA, USA, 18–21 April 2017; pp. 67–72. [Google Scholar]
- Guo, Y.; Ten, C.W.; Hu, S.; Weaver, W.W. Modeling distributed denial of service attack in advanced metering infrastructure. In Proceedings of the 2015 IEEE Power Energy Society Innovative Smart Grid Technologies Conference (ISGT), Washington, DC, USA, 18–20 February 2015; pp. 1–5. [Google Scholar]
- Hu, F.; Lu, Y.; Vasilakosb, A.V.; Hao, Q.; Ma, R.; Patila, Y.; Zhang, T.; Lua, J.; Lia, X.; Xiong, N.N. Robust cyber physical systems: Concept, models, and implementation. Future Gener. Comput. Syst. 2016, 56, 449–475. [Google Scholar] [CrossRef]
- Cheng, W.; Zhang, K.; Chen, H.; Jiang, G. Ranking Causal Anomalies via Temporal and Dynamical Analysis on Vanishing Correlations. In Proceedings of the 22nd ACM SIGKDD International Conference on Knowledge Discovery and Data Mining, San Francisco, CA, USA, 13–17 August 2016; pp. 805–814. [Google Scholar]
- Momtazpour, M.; Zhang, J.; Rahman, S.; Sharma, R.; Ramakrishnan, N. Analyzing Invariants in Cyber-Physical Systems Using Latent Factor Regression. In Proceedings of the 21th ACM SIGKDD International Conference on Knowledge Discovery and Data Mining, Sydney, Australia, 10–13 August 2015; pp. 2009–2018. [Google Scholar]
- Luo, C.; Lou, J.G.; Lin, Q.; Fu, Q.; Ding, R. Correlating Events with Time Series for Incident Diagnosis. In Proceedings of the 20th ACM SIGKDD International Conference on Knowledge Discovery and Data Mining, New York, NY, USA, 24–27 August 2014; pp. 1583–1592. [Google Scholar]
- Melnyk, I.; Banerjee, A.; Matthews, B.; Oza, N. Semi-Markov Switching Vector Autoregressive Model-Based Anomaly Detection in Aviation Systems. In Proceedings of the 22nd ACM SIGKDD International Conference on Knowledge Discovery and Data Mining, San Francisco, CA, USA, 13–17 August 2016; pp. 1065–1074. [Google Scholar]
- Wang, J.; Tu, W.; Hui, L.C.K.; Yiu, S.M.; Wang, E.K. Detecting Time Synchronization Attacks in Cyber-Physical Systems with Machine Learning Techniques. In Proceedings of the 2017 IEEE 37th International Conference on Distributed Computing Systems (ICDCS), Atlanta, GA, USA, 5–8 June 2017; pp. 2246–2251. [Google Scholar]
- Budalakoti, S.; Srivastava, A.N.; Otey, M.E. Anomaly Detection and Diagnosis Algorithms for Discrete Symbol Sequences with Applications to Airline Safety. IEEE Trans. Syst. Man Cybern. Part C (Appl. Rev.) 2009, 39, 101–113. [Google Scholar] [CrossRef]
- Lim, H.K.; Kim, Y.; Kim, M.K. Failure Prediction Using Sequential Pattern Mining in the Wire Bonding Process. IEEE Trans. Semicond. Manuf. 2017, 30, 285–292. [Google Scholar] [CrossRef]
- Ouaddah, A.; Elkalam, A.A.; Ouahman, A.A. FairAccess: A new Blockchain-based access control framework for the Internet of Things. Secur. Commun. Netw. 2017, 9, 5943–5964. [Google Scholar] [CrossRef]
- Liu, B.; Yu, X.L.; Chen, S.; Xu, X.; Zhu, L. Blockchain Based Data Integrity Service Framework for IoT Data. In Proceedings of the 2017 IEEE International Conference on Web Services (ICWS), Honolulu, HI, USA, 25–30 June 2017; pp. 468–475. [Google Scholar]
- Renganathan, K.; Bhaskar, V. Observer based on-line fault diagnosis of continuous systems modeled as Petri nets. ISA Trans. 2010, 49, 587–595. [Google Scholar] [CrossRef] [PubMed]
- Rahmani-andebili, M.; Shen, H. Cooperative distributed energy scheduling for smart homes applying stochastic model predictive controla. In Proceedings of the 2017 IEEE International Conference on Communications (ICC), Paris, France, 21–25 May 2017; pp. 1–6. [Google Scholar]
- Zhou, Y.; Ci, S.; Li, H.; Yang, Y. A new framework for peer-to-peer energy sharing and coordination in the energy internet. In Proceedings of the 2017 IEEE International Conference on Communications (ICC), Paris, France, 21–25 May 2017; pp. 1–6. [Google Scholar]
- Jiang, M.; Munawar, M.A.; Reidemeister, T.; Ward, P.A.S. Efficient Fault Detection and Diagnosis in Complex Software Systems with Information-Theoretic Monitoring. IEEE Trans. Dependable Secur. Comput. 2011, 8, 510–522. [Google Scholar] [CrossRef]
- Sharma, A.B.; Chen, H.; Ding, M.; Yoshihira, K.; Jiang, G. Fault detection and localization in distributed systems using invariant relationships. In Proceedings of the 2013 43rd Annual IEEE/IFIP International Conference on Dependable Systems and Networks (DSN), Budapest, Hungary, 24–27 June 2013; pp. 1–8. [Google Scholar]


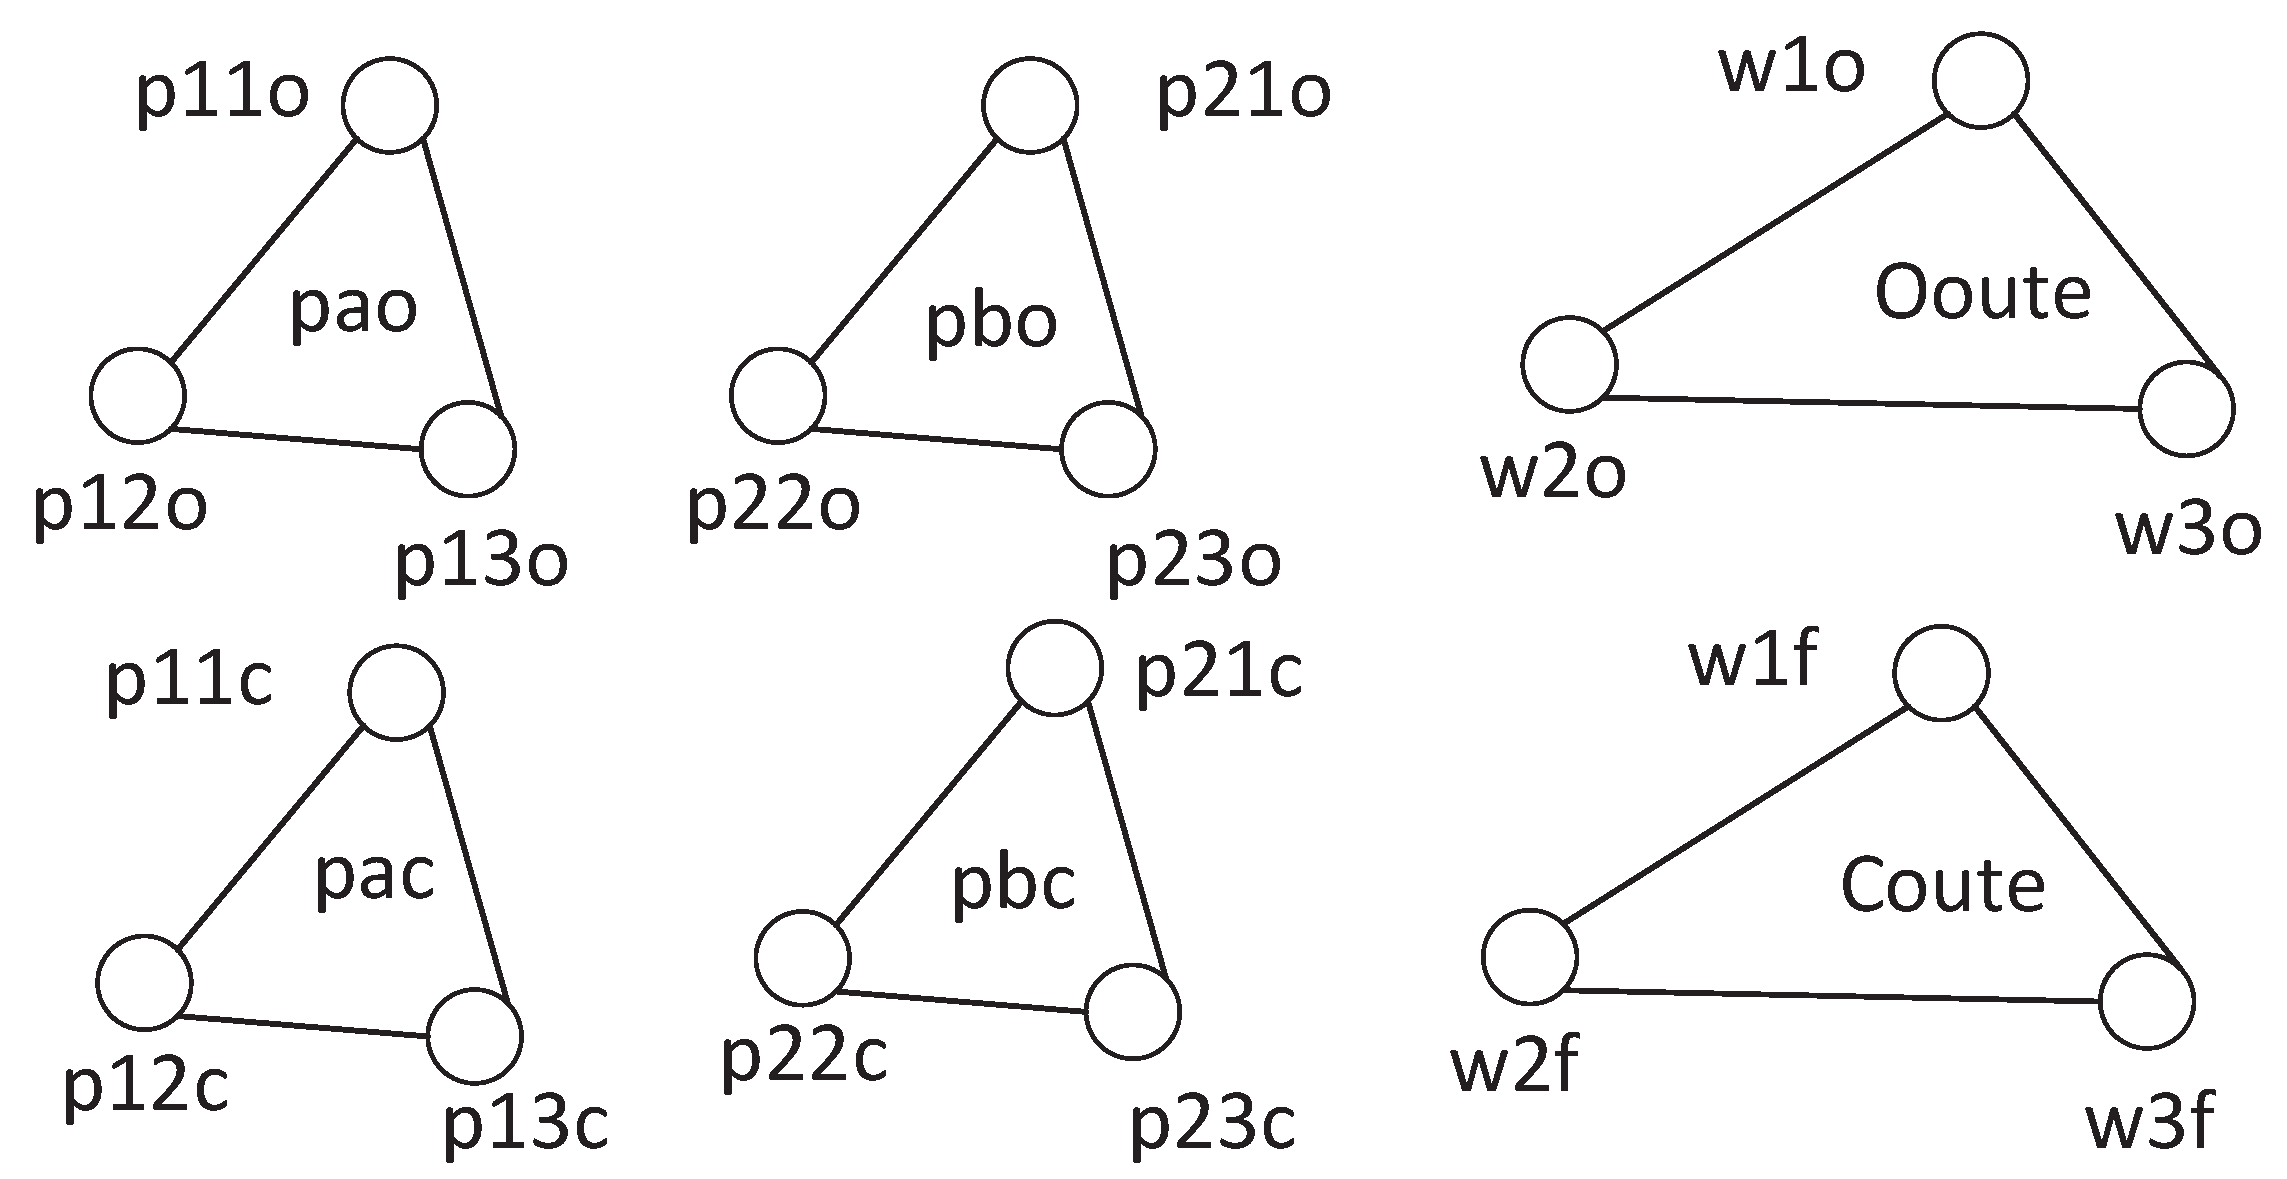
| Command/Time Series | Description |
|---|---|
| P11o/P11f | Switch on/off Pump P11 |
| P12o/P12f | Switch on/off Pump P12 |
| P13o/P13f | Switch on/off Pump P13 |
| P21o/P21f | Switch on/off Pump P21 |
| P22o/P22f | Switch on/off Pump P22 |
| P23o/P23f | Switch on/off Pump P23 |
| V11o/V11c | Open/Close Valve V11 |
| T11 | Measurements of Sensor S11 |
| T12 | Measurements of Sensor S12 |
| T13 | Measurements of Sensor S13 |
| T21 | Measurements of Sensor S21 |
| T22 | Measurements of Sensor S21 |
| T23 | Measurements of Sensor S23 |
| Tv1 | Measurements of Sensor Sv1 |
| Command/Time Series | Description |
|---|---|
| w1o/w1f | Turn on/off switch w1 |
| w2o/w2f | Turn on/off switch w2 |
| w3o/w3f | Turn on/off switch w3 |
| w4o/w4f | Turn on/off switch w4 |
| w5o/w5f | Turn on/off switch w5 |
| w6o/w6f | Turn on/off switch w6 |
| T11 | Measurements of Sensor Ss1 |
| T12 | Measurements of Sensor Ss2 |
| T13 | Measurements of Sensor Ss3 |
| T21 | Measurements of Sensor Sc1 |
| T22 | Measurements of Sensor Sc1 |
| T23 | Measurements of Sensor Sc3 |
| Command | Correlation | Scenario |
|---|---|---|
| pao | , , | 1 |
| pbo | , , | 1 |
| pac | , , | 1 |
| pbc | , , | 1 |
| pvo | 1 | |
| pvc | 1 | |
| Ooute | , , | 2 |
| Opute | , , | 2 |
| Coute | , , | 2 |
| Cpute | , , | 2 |
| Attack Case | Alarm |
|---|---|
| 1 | , , at s |
| 2 | at t = 960 s |
| 3 | at t = 60 s |
| 4 | , , at s |
| 5 | s |
| 6 | s |
© 2017 by the authors. Licensee MDPI, Basel, Switzerland. This article is an open access article distributed under the terms and conditions of the Creative Commons Attribution (CC BY) license (http://creativecommons.org/licenses/by/4.0/).
Share and Cite
Xun, P.; Zhu, P.-D.; Hu, Y.-F.; Cui, P.-S.; Zhang, Y. Command Disaggregation Attack and Mitigation in Industrial Internet of Things. Sensors 2017, 17, 2408. https://doi.org/10.3390/s17102408
Xun P, Zhu P-D, Hu Y-F, Cui P-S, Zhang Y. Command Disaggregation Attack and Mitigation in Industrial Internet of Things. Sensors. 2017; 17(10):2408. https://doi.org/10.3390/s17102408
Chicago/Turabian StyleXun, Peng, Pei-Dong Zhu, Yi-Fan Hu, Peng-Shuai Cui, and Yan Zhang. 2017. "Command Disaggregation Attack and Mitigation in Industrial Internet of Things" Sensors 17, no. 10: 2408. https://doi.org/10.3390/s17102408
APA StyleXun, P., Zhu, P.-D., Hu, Y.-F., Cui, P.-S., & Zhang, Y. (2017). Command Disaggregation Attack and Mitigation in Industrial Internet of Things. Sensors, 17(10), 2408. https://doi.org/10.3390/s17102408