Modified Gray-Level Coding Method for Absolute Phase Retrieval
by
 ,
,
Xiangcheng Chen
1, 
Shunping Chen
2,
Jie Luo
1,
Mengchao Ma
3,
Yuwei Wang
2,*,
Yajun Wang
4,* and
Lei Chen
5 1
School of Automation, Wuhan University of Technology, Wuhan 430070, China
2
Department of Precision Machinery and Precision Instrumentation, University of Science and Technology of China, Hefei 230026, China
3
Department of Instrument Science and Opto-Electronics Engineering, Hefei University of Technology, Hefei 230088, China
4
State Key Laboratory of Information Engineering in Surveying, Mapping, and Remote Sensing, Wuhan University, Wuhan 430079, China
5
School of Mechanical and Electrical Engineering, Wuhan University of Technology, Wuhan 430070, China
*
Authors to whom correspondence should be addressed.
Sensors 2017, 17(10), 2383; https://doi.org/10.3390/s17102383
Submission received: 6 September 2017
/
Revised: 9 October 2017
/
Accepted: 16 October 2017
/
Published: 19 October 2017
(This article belongs to the Special Issue Imaging Depth Sensors—Sensors, Algorithms and Applications)
Abstract
:Fringe projection systems have been widely applied in three-dimensional (3D) shape measurements. One of the important issues is how to retrieve the absolute phase. This paper presents a modified gray-level coding method for absolute phase retrieval. Specifically, two groups of fringe patterns are projected onto the measured objects, including three phase-shift patterns for the wrapped phase, and three n-ary gray-level (nGL) patterns for the fringe order. Compared with the binary gray-level (bGL) method which just uses two intensity values, the nGL method can generate many more unique codewords with multiple intensity values. With assistance from the average intensity and modulation of phase-shift patterns, the intensities of nGL patterns are normalized to deal with ambient light and surface contrast. To reduce the codeword detection errors caused by camera/projector defocus, nGL patterns are designed as n-ary gray-code (nGC) patterns to ensure that at most, one code changes at each point. Experiments verify the robustness and effectiveness of the proposed method to measure isolated objects with complex surfaces.
1. Introduction
Optical three dimensional (3D) sensing systems are becoming increasingly used in many fields such as medical sciences, industrial inspection and virtual reality. Among various technologies, digital fringe projection (DFP) has been a major research subject in terms of speed, accuracy, resolution, and ease of use [1,2,3,4,5]. In a typical DFP system, some pre-designed patterns are projected onto the measured objects by a projector from one viewpoint, and modulated by the objects’ profiles. Meanwhile, their corresponding deformed images are captured by a camera from another viewpoint. Then the phase modulation can be calculated through suitable digital fringe analysis. Finally, the DFP system should be calibrated to recover the relationship between the phase modulation and the real 3D world coordinates [6,7,8]. Therefore, the phase extraction accuracy will directly affect the 3D shape measurement result [9].
Common projected patterns include sinusoidal [10], binary [11], triangular [12], trapezoidal [13], etc. Instead of gray images, color images containing red, green and blue channels may be employed for fast measurement, but this method is sensitive to system noise, nonlinearity and color coupling [14,15,16,17]. The binary, triangular or trapezoidal patterns become sinusoidal in shape when they are blurred to a certain level [18]. Therefore, it would seem reasonable to adopt sinusoidal patterns directly. The methods used to demodulate 3D information from fringe patterns are referred to as digital fringe analysis. Fourier transform [19], windowed Fourier transform [20], wavelet transform [21] and phase-shift [22] are common digital fringe analysis algorithms. Among them, phase-shift methods have been extensively studied due to their pixel-by-pixel measurement [23]. However, the wrapped phase calculated directly from the arctangent function has 2π phase jumps which should be unwrapped to obtain the absolute phase. Ideally, those 2π phase jumps can be easily removed with reference to the neighboring pixels. However, the neighboring pixels are often invalid because of local shadows and isolated objects that result in some challenges for phase unwrapping [24].
The existing phase unwrapping algorithms can be divided into two principal categories: spatial algorithms and temporal algorithms [25]. Spatial algorithms have been investigated with a variety of different considerations [26,27,28]. Spatial algorithms tend to fail when dealing with discontinuous or isolated objects therefore, researchers have focused on the more efficient temporal algorithms which can avoid the error transferring between pixels [29]. Up until now, several temporal algorithms have been developed to address this problem, such as two-wavelength [30], multiple-wavelength [31], gray-code [32], and phase-coding [33]. Among them, the gray-code method is a simple, commonly used bGL method, in which a unique codeword is assigned to each fringe period. As only two intensity values are employed, thus m patterns can generate 2m codewords. A large number of patterns slows down the measurement speed, and makes this method unsuitable for high-speed measurements. The nGL method which encodes n > 2 intensity values effectively reduces the number of coded patterns, thus m patterns can generate nm codewords. For example, if n = 4, and m = 3, the bGL method can generate 23 = 8 codewords, in contrast the nGL method can generate 43 = 64 codewords which is many more than the former method. Instead of directly using the gray-level patterns for the shape measurement [5], the nGL patterns are only used for fringe order calculations in this paper. Meanwhile, gray-level methods [34,35,36,37] employ an additional pattern for uniform illumination, then intensity ratios which encode the spatial locations are calculated. In contrast, the nGL method does not need uniform illumination for background calculation.
However, ambient light and surface contrast make codeword detection difficult in the nGL method. To overcome this problem, the average intensity and modulation of phase-shift fringes are employed to eliminate these influences. In addition, the codes change at the same place in nGL patterns, which creates a tendency for codeword detection errors at the code boundaries, especially for blurred patterns [38]. Caspi [39] used a generalized Gray code method [40] for range imaging with color structured light, which has the same advantage as the binary Gray code method [32]. That is, the effect of a detection error due to a transition is limited to an error between the two adjacent light planes. Horn [37] and Porras-Aguilar [36] proposed the use of projection patterns where two neighboring gray-levels differ only by one grey-level to avoid the detection error at code-boundaries, which is known as the Hamming distance of 1 gray-level. Furthermore, Porras-Aguilar [34] demonstrated an optimal coding scheme avoiding the influence of defocus errors using space-filling curves, so that the codewords can have one or two gray-level changes. In this paper, the coded patterns were only used for identifying the fringe orders. A n-ary gray-code method, similar to Caspi [39], was used to reduce the codeword detection errors at the code boundaries, whereby at most, one code changes at each point for different coded patterns. Using the proposed method, the codeword can be detected more accurately, and the phase retrieval performance can be improved.
2. Materials and Methods
2.1. Three-Step Phase-Shift Method
Phase-shift methods have been widely used in optical metrology because of their speed and accuracy [41]. Among various phase-shift methods, the three-step method requires the least number of patterns for phase recovery. Three sinusoidal phase-shift fringe patterns with equal phase shifts captured by camera can be mathematically described as:
where denotes the average intensity, denotes the intensity modulation, and denotes the modulating phase to be solved. Combining the above equations, the three variables can be calculated as [42,43,44]:
Generally, background and shadow regions can be removed with the assistance of the modulation map and a segmentation threshold. Due to the arctangent operation, the solved phase map will be limited in range of [−π, π] with 2π discontinuities. Thus, phase unwrapping should be carried out to remove these discontinuities. The key to the phase unwrapping is to determine the fringe orders. If the fringe orders are determined, the wrapped phase can be unwrapped as:
where denotes the unwrapped phase or absolute phase.
2.2. Intensity Normalization for Coded Patterns
In this paper, we employ extra coded patterns to calculate the fringe orders. Three coded patterns used to encode the codewords can be mathematically described as:
Similarly, denotes the average intensity, denotes the intensity modulation, , and denote the coded coefficients ranging from −1 to 1. Note that, and are assigned the same values as that of phase-shift patterns, thus they can be computed with Equations (4) and (5). The following equations used to normalize the coded patterns can be described as:
Through the above equations which take the average intensity and modulation into consideration, the influences of ambient light and surface contrast can be eliminated, and the codes can be exactly identified.
2.3. The n-Ary Gray-Code Method
Among the various temporal phase unwrapping algorithms, the bGL method may be the simplest way to resolve phase ambiguity [45]. In this method, codewords are encoded within binary patterns used to mark the fringe orders of the phase-shift patterns. Figure 1 shows three-frame binary patterns as an example. There are two intensity values: the black stripes are assigned to the logical value 0, while the white stripes are assigned to the logical value 1. In general, m patterns can generate 2m codewords, and each of them contains m bits. The pattern images can be sequentially captured by the camera. Then, the codewords of each pixel can be determined through suitable threshold algorithms. This method proves to be reliable and less sensitive to the surface contrast, since only binary values are used in all pixels. However, a larger number of patterns need to be projected to achieve high spatial resolution, which means that image acquisition takes too long and the measured objects have to remain static. Thus, this method is not suitable for real-time measurement [46].
To reduce the number of projected patterns, the nGL coding method is developed where more than two intensity values are encoded. Differing from the bGL method that only uses intensity values 0 and 255, the nGL method uses n > 2 intensity values from 0 to 255. Figure 2 shows the nGL method with n = 4 intensity levels. However, the images of nGL patterns become blurred due to the camera/projector defocus, which makes the codeword determination at code boundaries difficult. This problem will be worse if the codes change at the same place in different coded patterns.
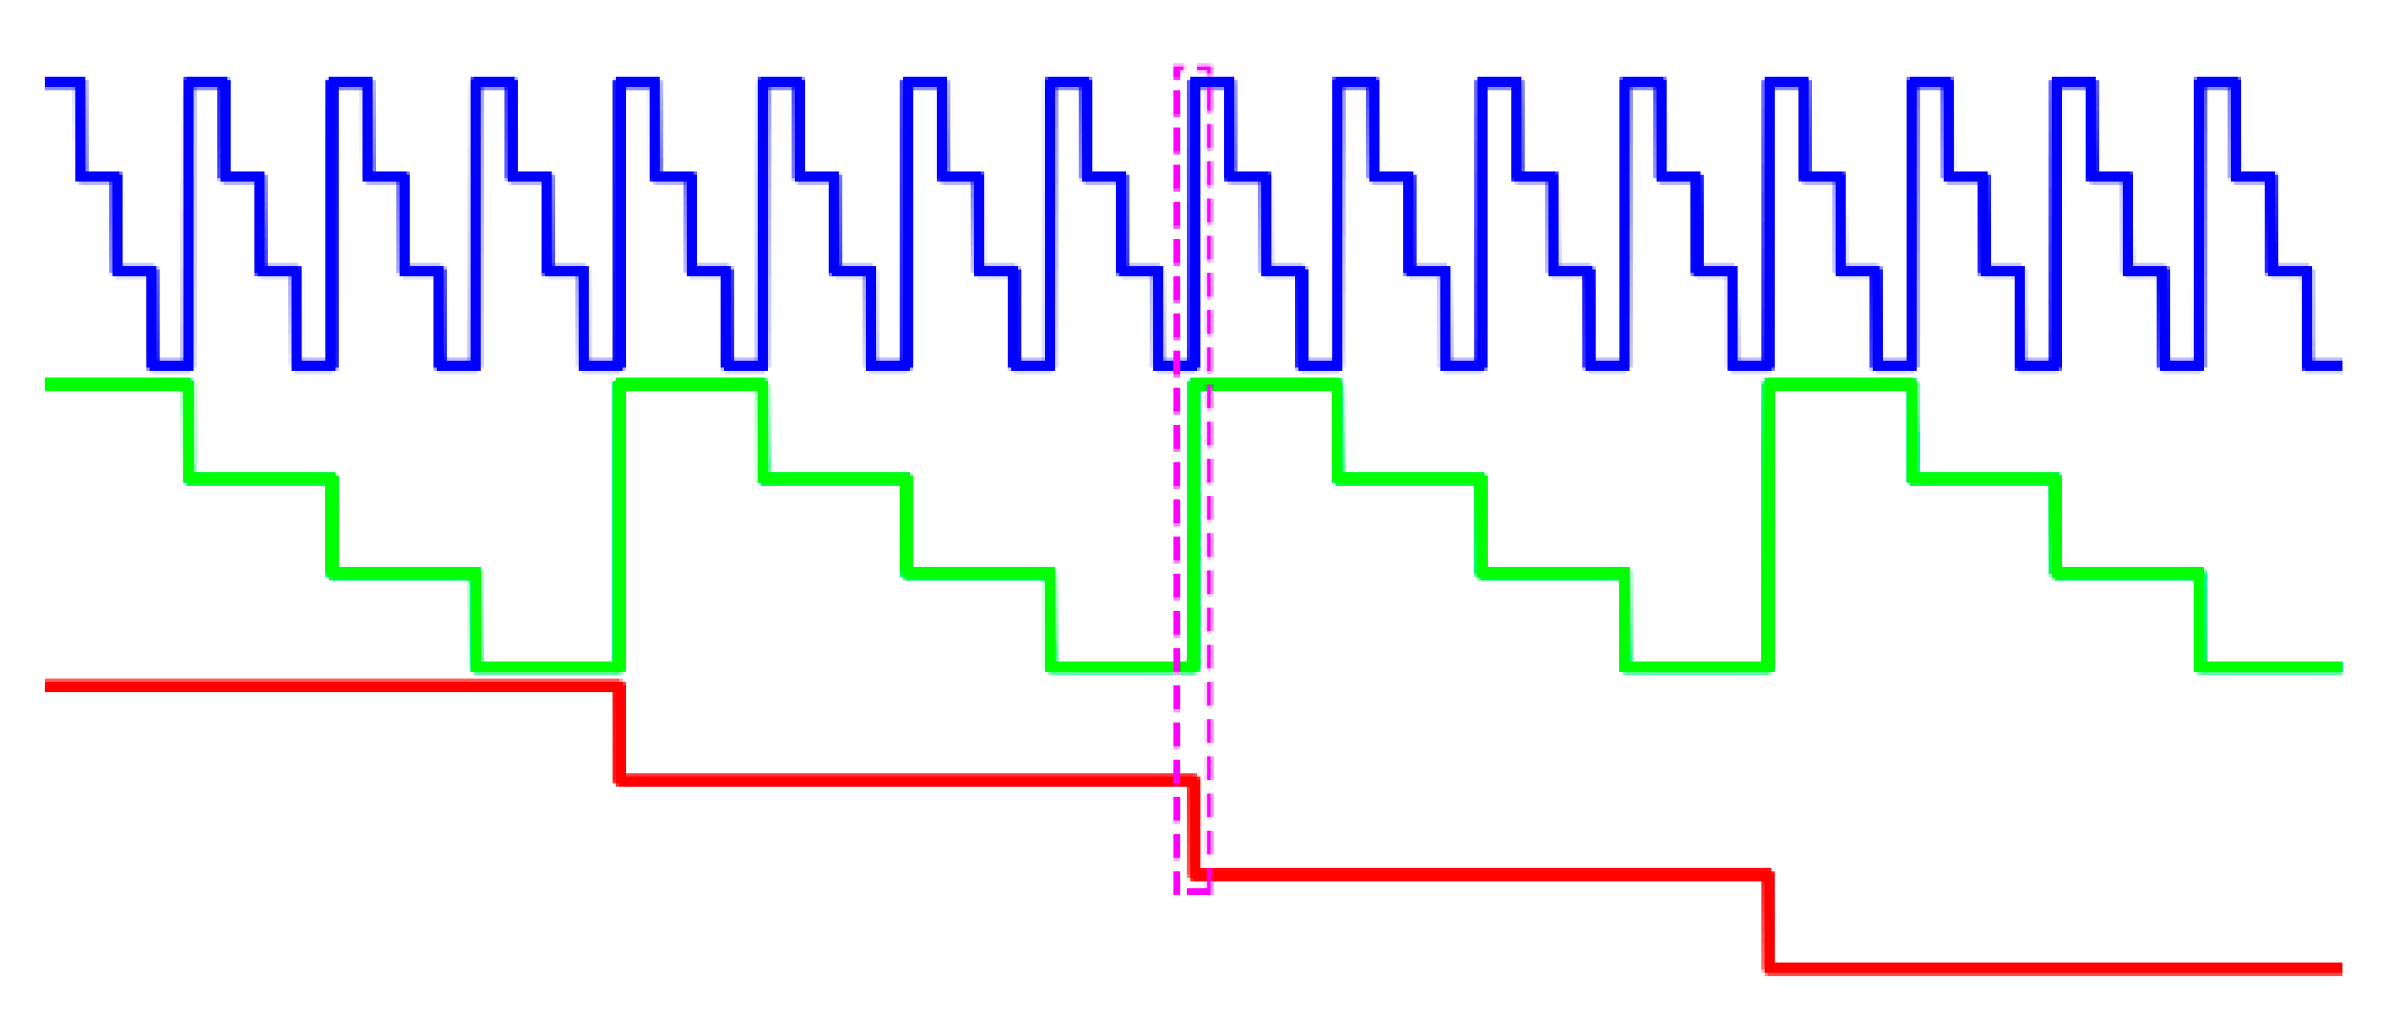
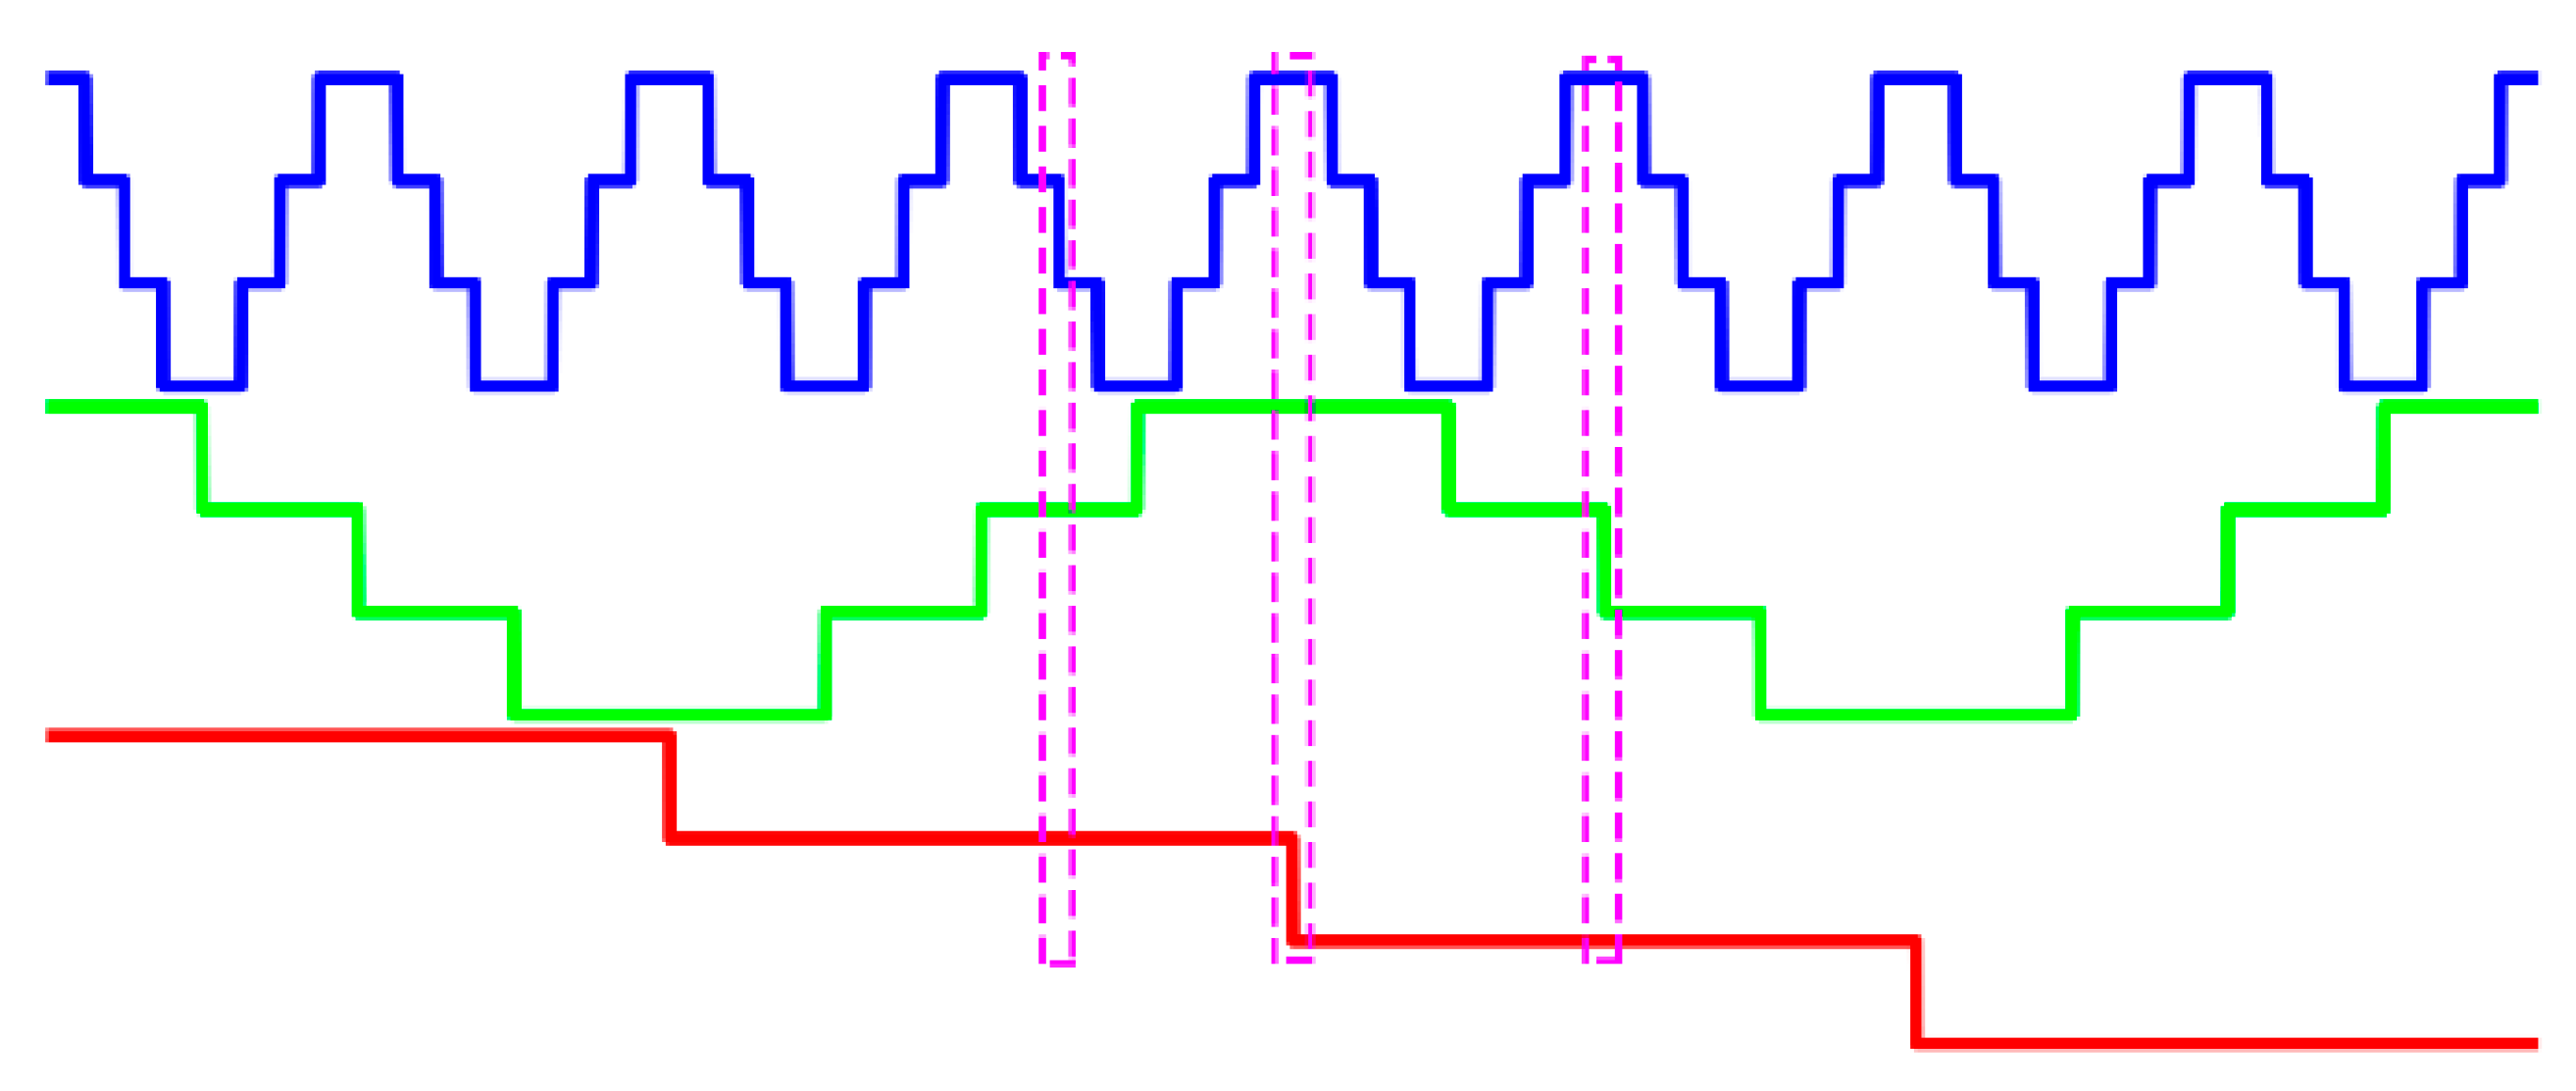
To tackle this problem, the nGC method is used to improve the conventional nGL method, as illustrated in Figure 3. Clearly, at most, one code changes at each pixel of all the nGC patterns. Moreover, the codewords do not appear more than once. The total number of codewords remains the same, yet the codeword detection errors occurring at the code boundaries could be reduced and the phase unwrapping can be improved.
2.4. The Framework of the Proposed Method
The following steps describe the framework for absolute phase retrieval using the nGC method.
- Step 1: Design codewords. Let C1, C2 and C3 be the code sequences for the three coded patterns. All designed 3-bit codewords are given in Table 1.
- Step 2: Calculate the code coefficients. The code coefficients range from −1 to 1, while codewords range from 1 to 4. The following mathematical equations describe the mapping relationship from the codewords to the code coefficients.
- Step 3: Encode codewords into patterns. With the three code sequences, the three coded patterns used to carry them can be mathematically described as:where and are constants, denotes the fringe order; P denotes the number of pixels per fringe period.
- Step 4: Wrapped phase calculation. Once the deformed phase-shift patterns are captured by the camera, and can be calculated on the basis of Equations (4) and (5), and the wrapped phase can be calculated on the basis of Equation (6).
- Step 5: Intensity Normalization. With the captured coded patterns, and and calculated in the previous step, , and can be calculated on the basis of Equations (11)–(13).
- Step 6: Calculate codewords. Then, C1, C2 and C3 can be obtained as:C1 = Round[2a1 + 5/2]C2 = Round[2a2 + 5/2]C3 = Round[2a3 + 5/2]Here, Round(x) denotes the closest integer of input x.
- Step 7: Determine fringe order. Looking at C1, C2 and C3 in Table 1, their order can be regarded as the fringe order. Then, we can convert the wrapped phase to the absolute phase according to the Equation (7).
3. Simulations
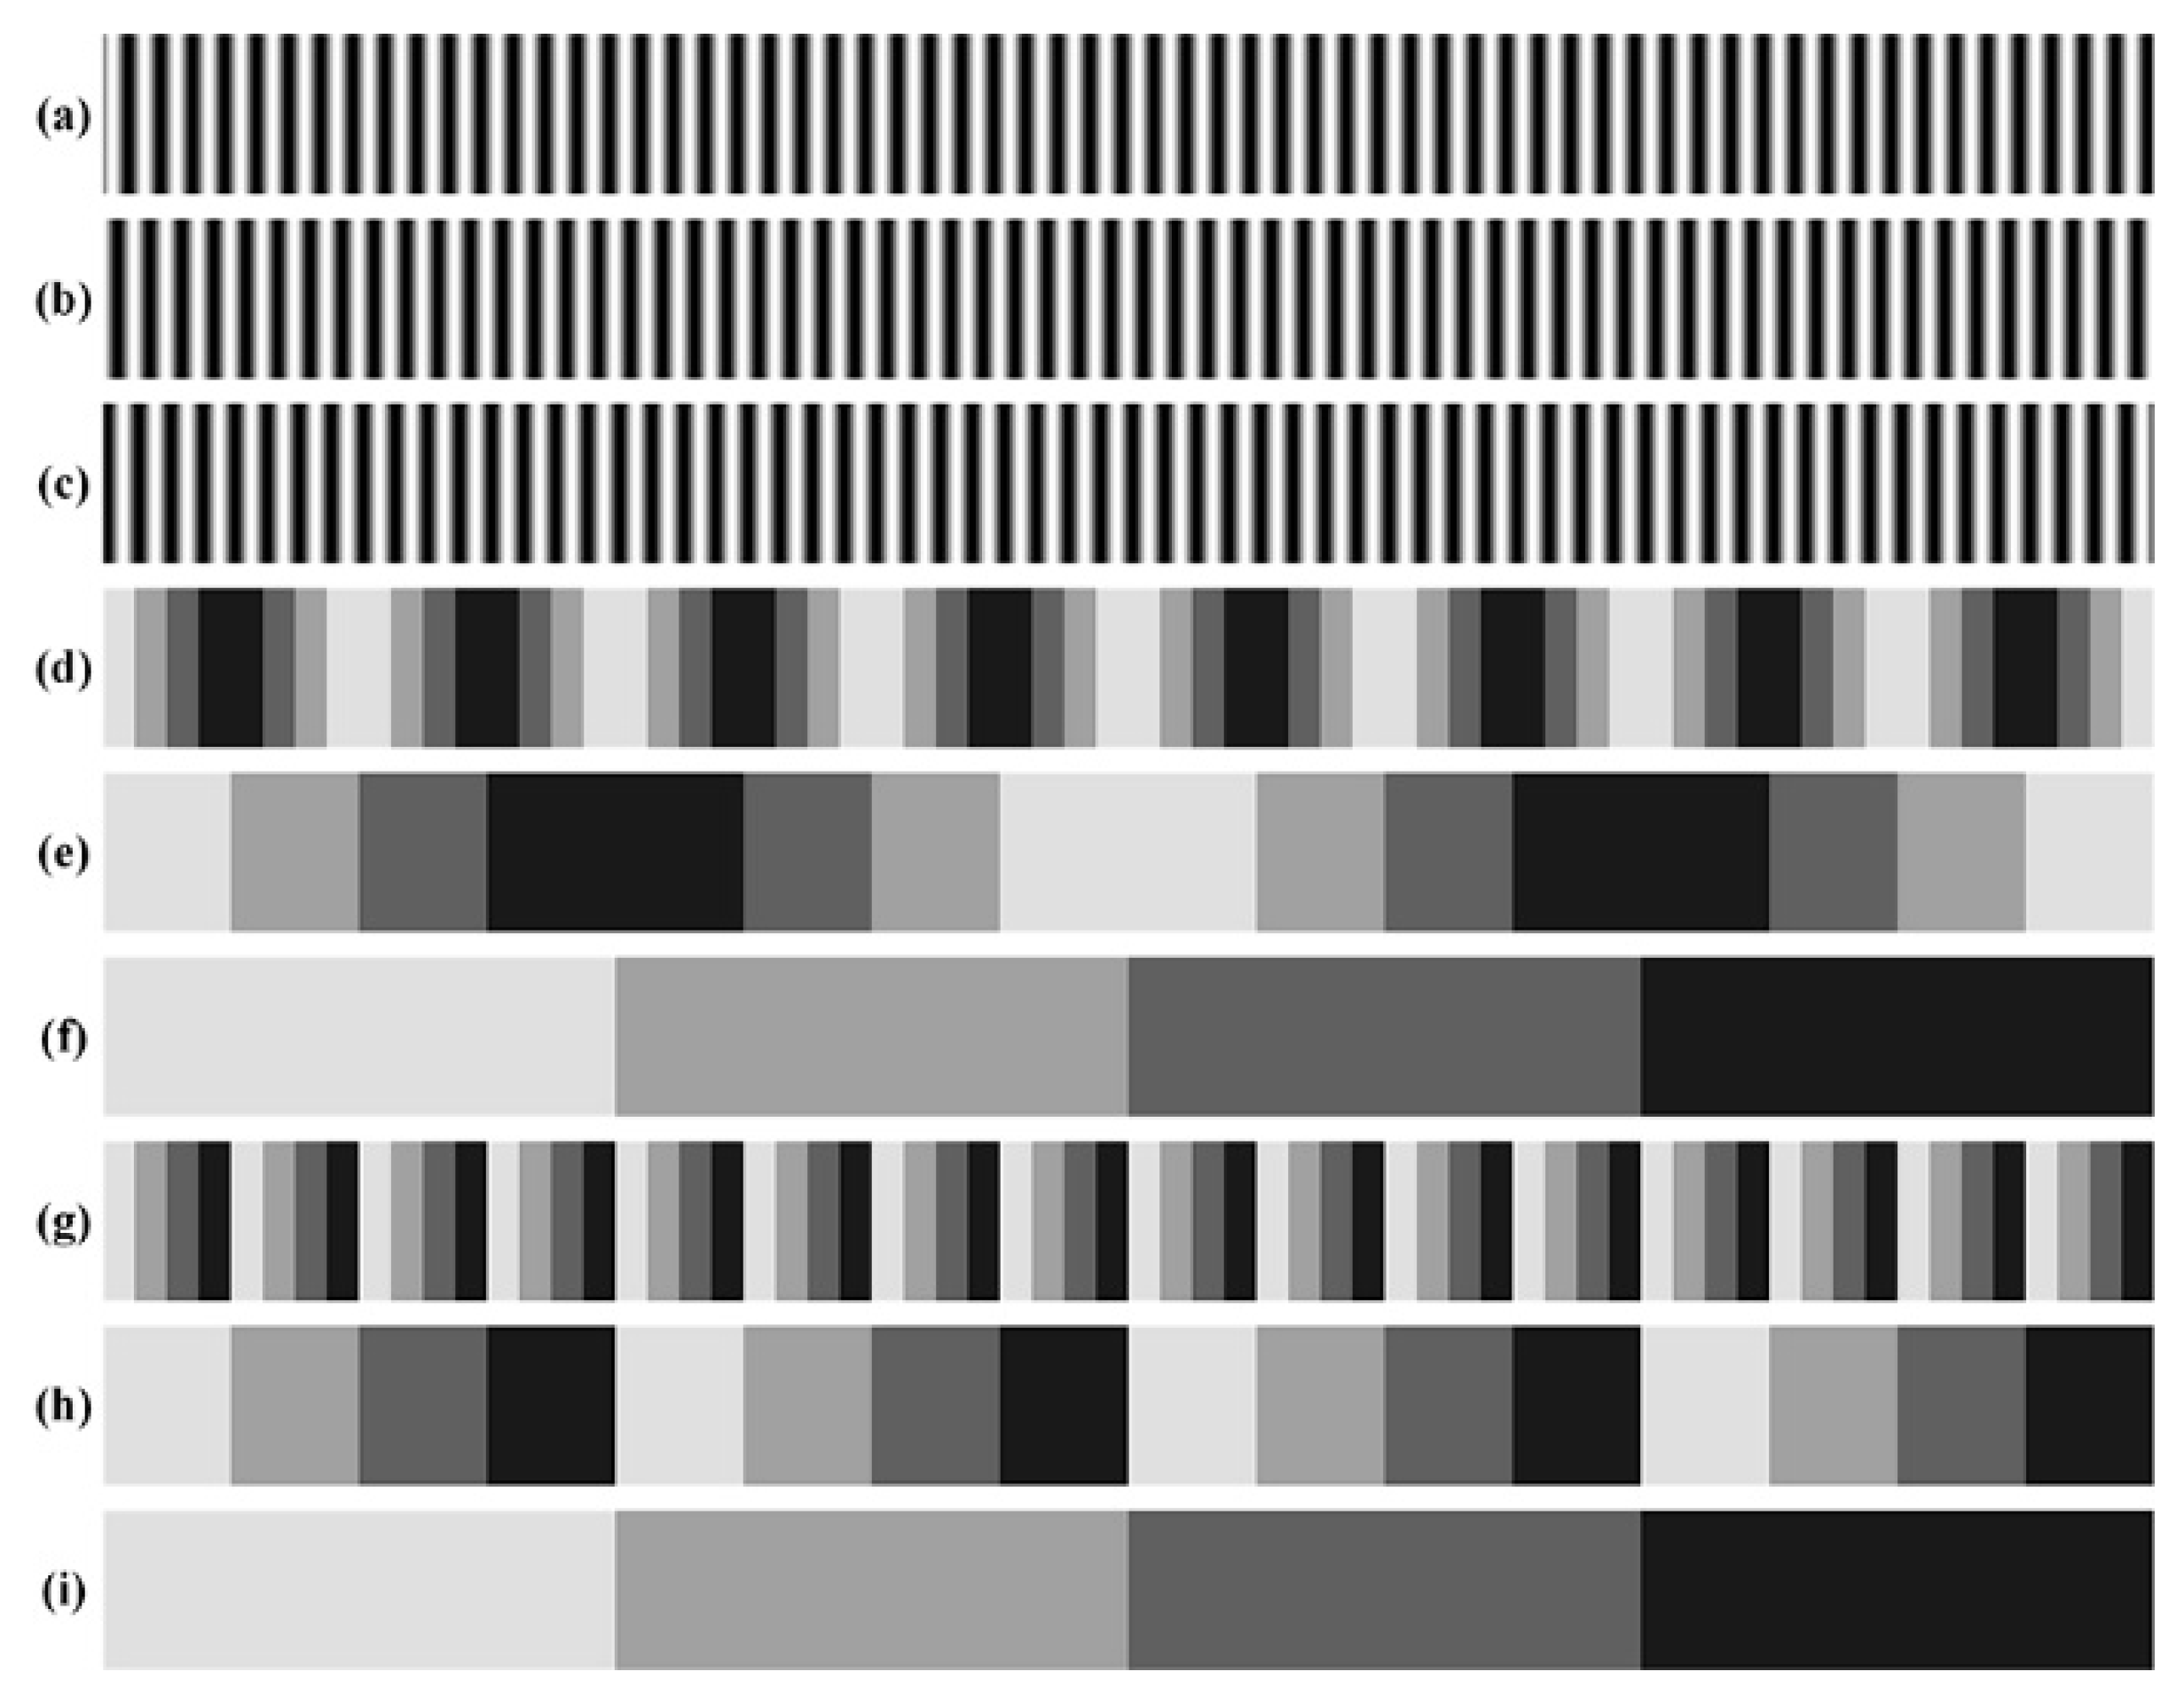
In order to explore the feasibility of the proposed method, some simulations have been done. Figure 5 shows the simulated phase-shift patterns and coded patterns. In those simulations, three nGC patterns are used to generate 64 codewords. The phase-shift patterns have a fringe period of P = 20 pixels. A modulation function is used to simulate variation of the background, as shown in Figure 5a, and the modulation function changes from 0.5 to 1.0. The function modulates both phase-shift fringe patterns and coded fringe patterns, and Gaussian noises are also added to the patterns. Figure 5b,c show the phase-shift fringe patterns and coded fringe patterns after modulating background intensity and adding Gaussian noises (10 dB). Figure 5c shows that it is difficult to differentiate the different codes from intensities because the background intensities change too much.
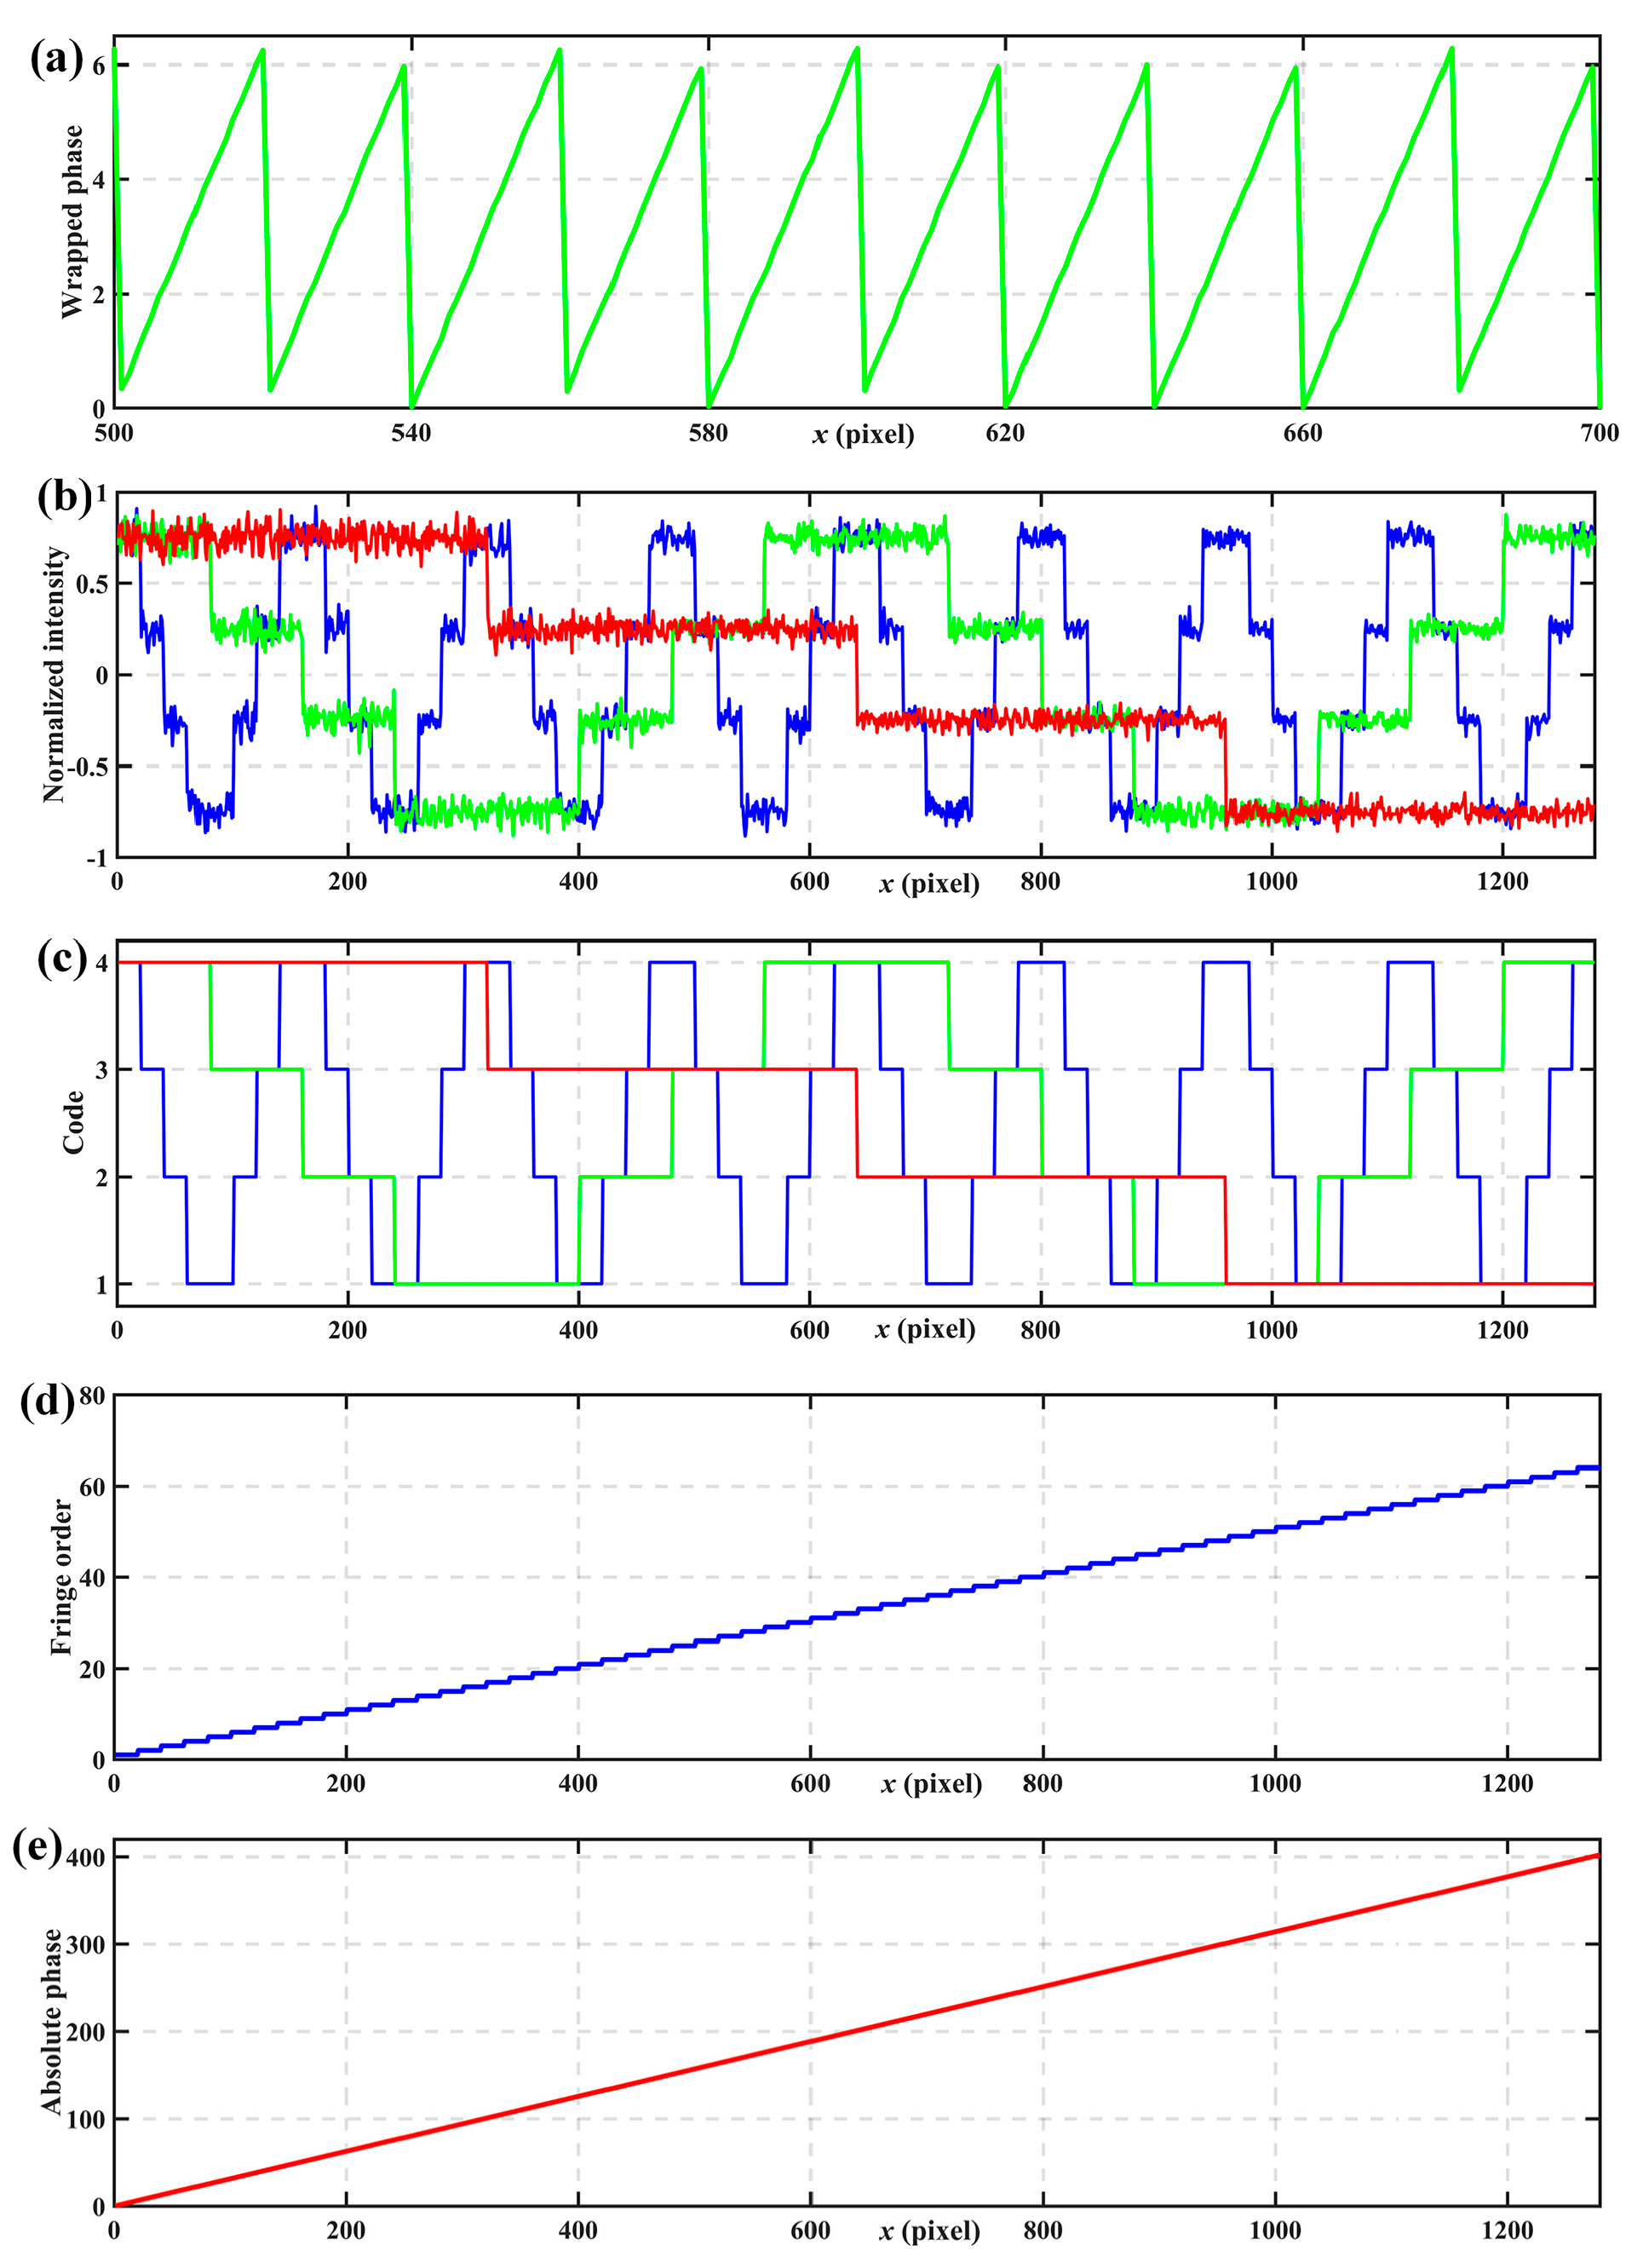
Figure 6 shows simulated results. Figure 6a shows the wrapped phases calculated on the basic of Equation (6). Figure 6b shows the coded fringe patterns with intensity normalization, where three thresholds, −0.5, 0, and 0.5 can divide the intensity into 4 levels unambiguously. Figure 6c shows the codes calculated from the normalization coded fringe patterns according to Equations (20)–(22). Figure 6d shows the fringe orders determined from Table 1. Figure 6e shows the calculated absolute phase according to Equation (7) after obtaining the wrapped phase and fringe orders.
4. Experiments
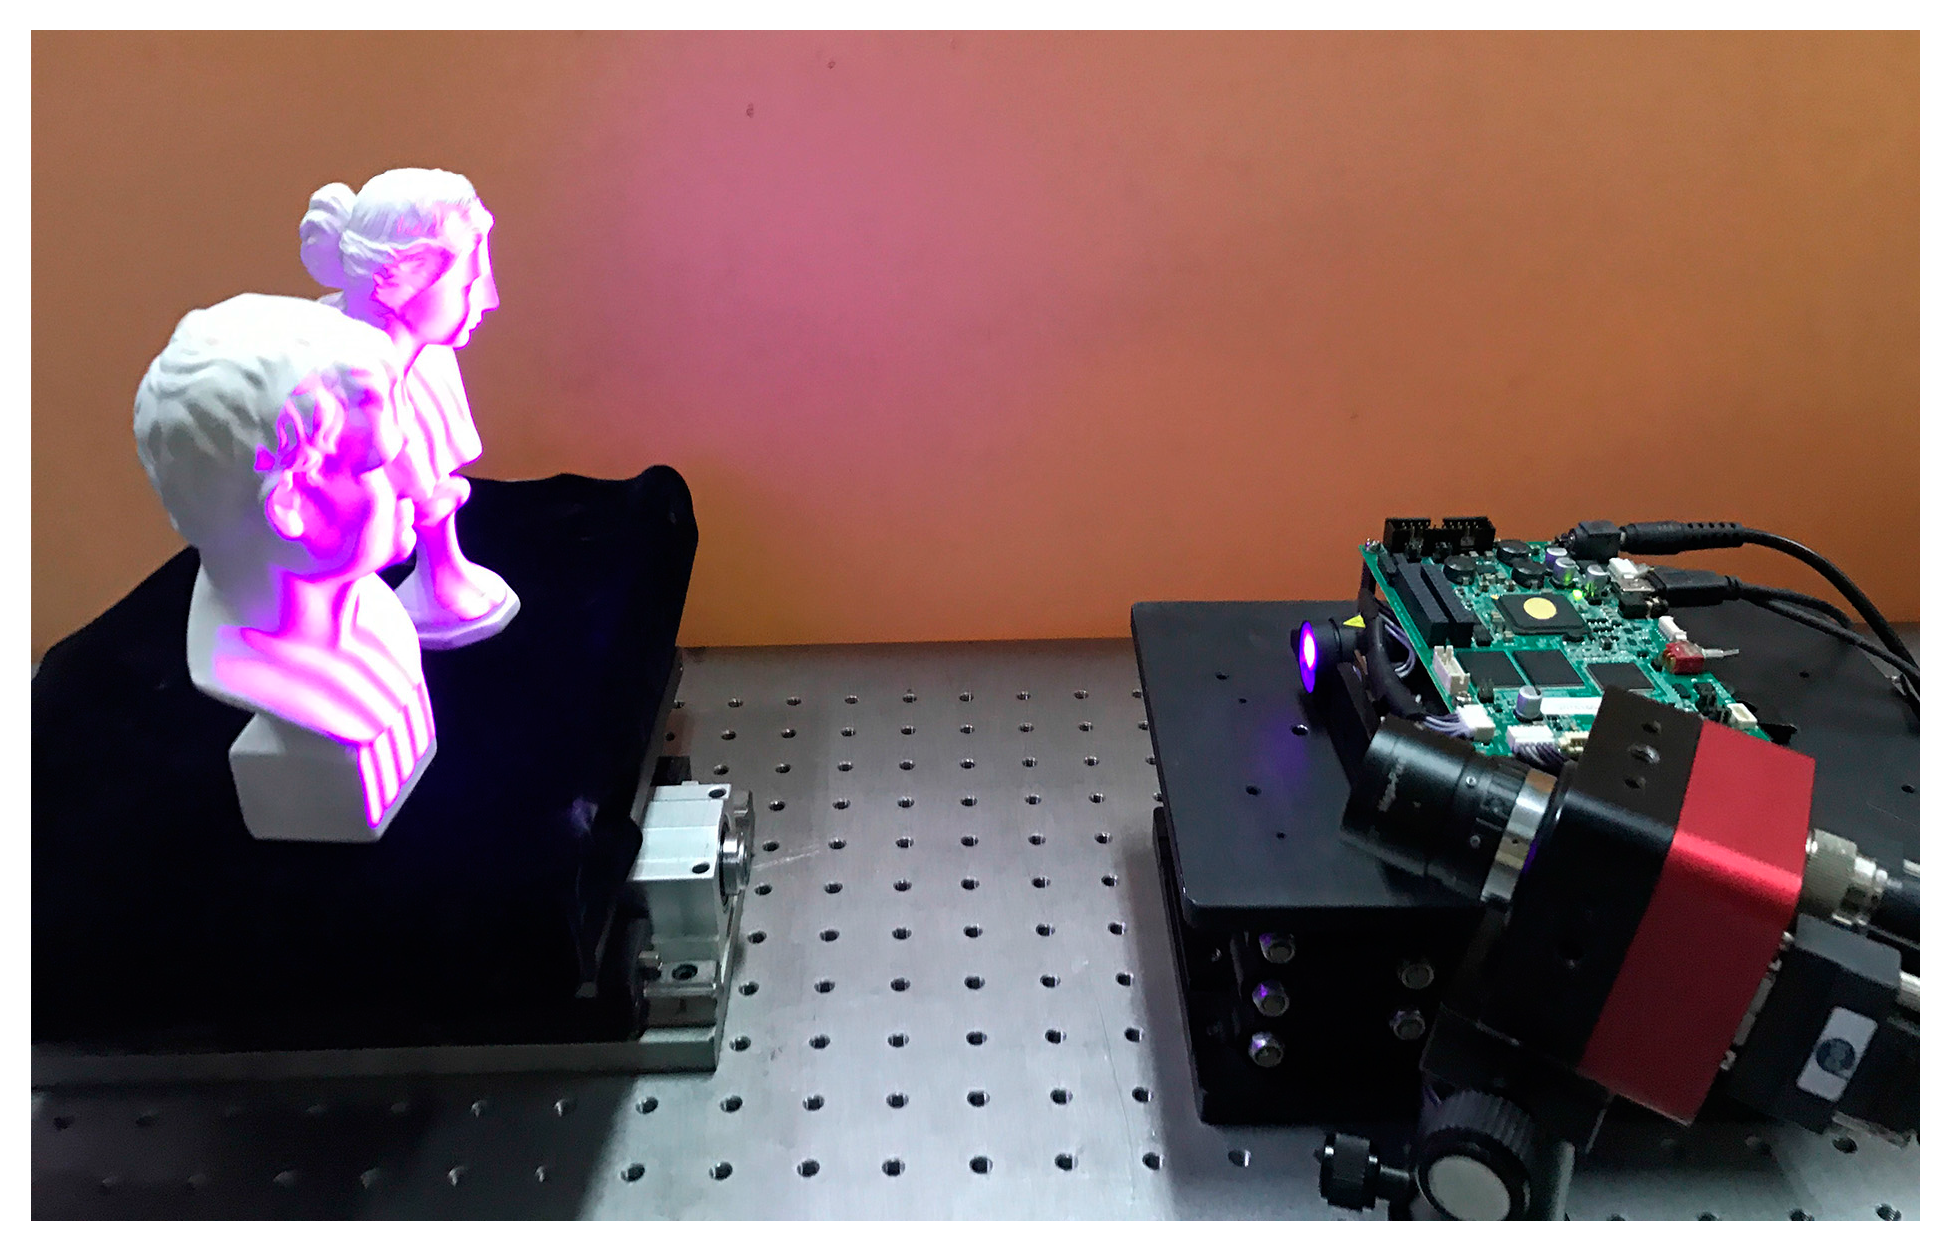
To verify the performance of the proposed method, we developed a common fringe projection system including a COMS camera (IOI Flare 2M360-CL), a digital light processing projector (LightCrafter 4500) and a computer. Figure 7 shows the setup used in the experiments. The camera has a resolution of 1280 × 1024 pixels, and the images are delivered to the computer via high-speed Camera Link. The resolution of the projector is 912 × 1140 pixels. The measured objects are two separated plaster sculptures placed before the fringe projection measurement system. The sinusoidal phase-shift fringe patterns and nGC coded patterns were projected onto the measured objects by the projector sequentially, and then deformed fringe patterns were captured by the camera at the same time. For comparison, the nGL patterns were also projected and captured like the nGC coded patterns.
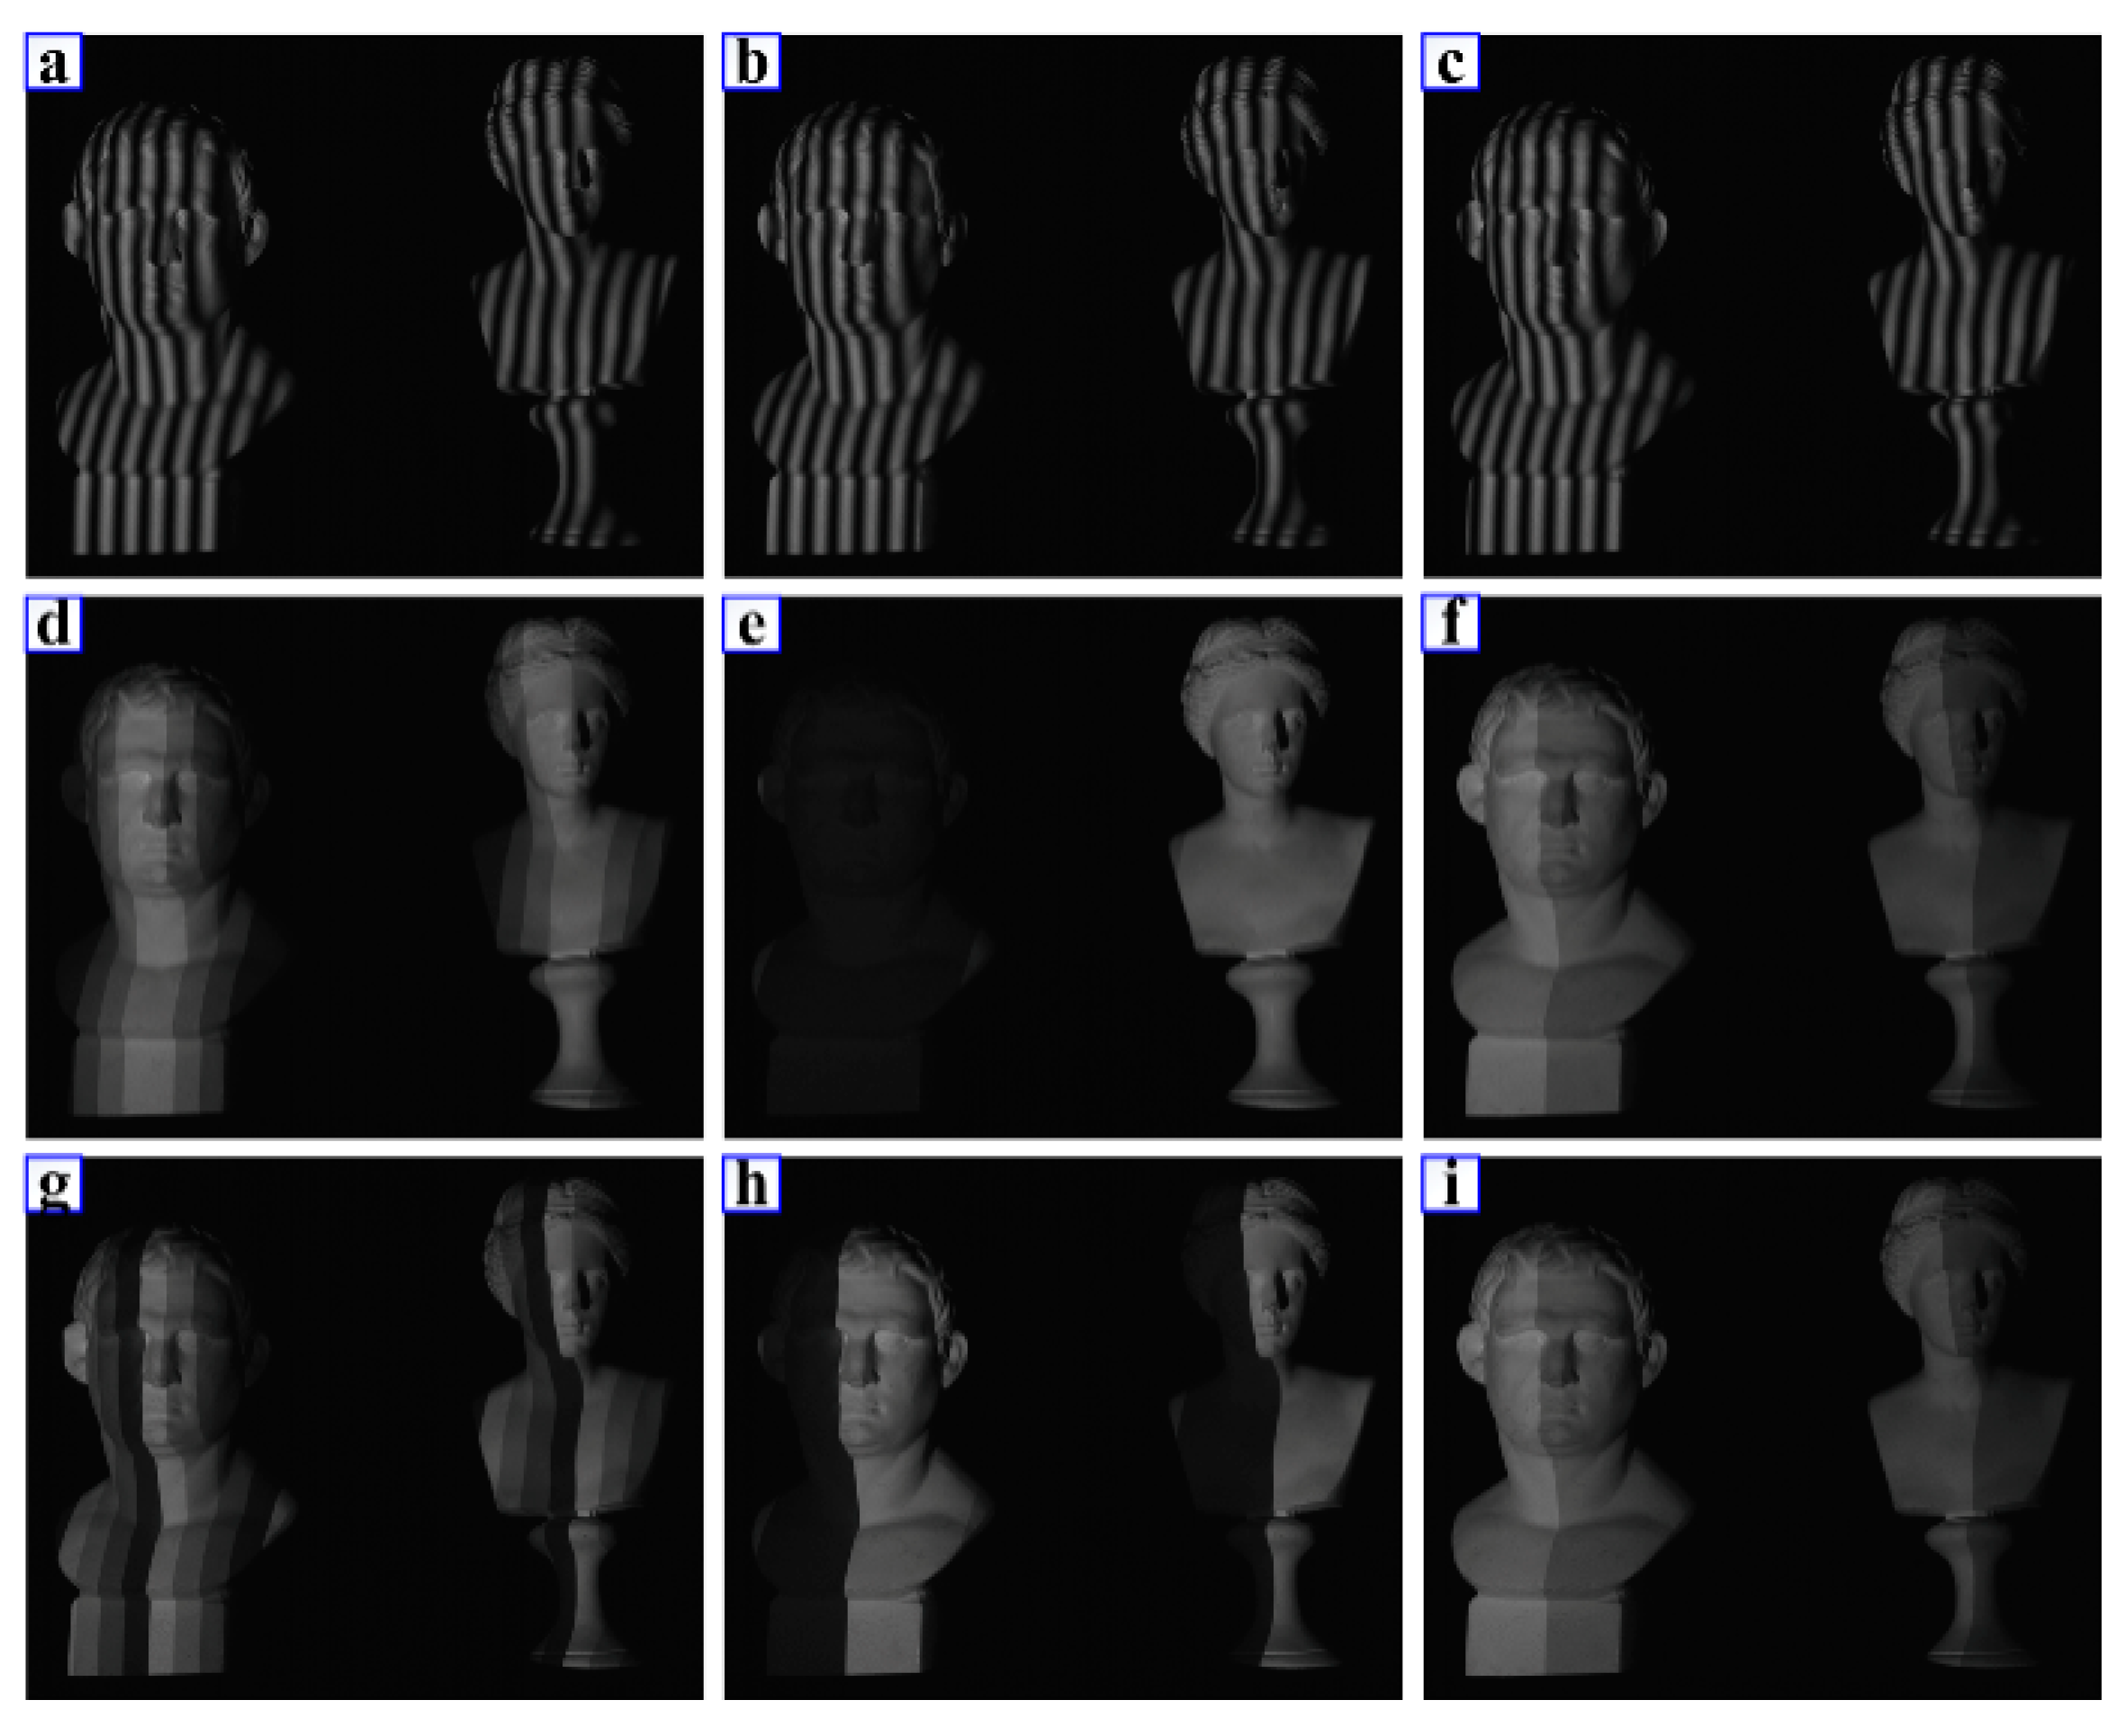
Figure 8 shows the projected patterns including three phase-shift patterns, three nGC patterns and three nGL patterns. Figure 8 shows the deformed images of these patterns, respectively. Figure 8a–c shows the images of phase-shift patterns, from which the wrapped phase can be calculated. Figure 8d–f shows the images of nGC patterns, from which the codewords representing the fringe order can be extracted. Figure 8g–i shows the nGL patterns for comparison.
Figure 9 shows the captured images of these projected patterns, including phase-shift patterns, nGC patterns and nGL patterns. To better illustrate the proposed method, Figure 10a shows the intensities of three phase-shift patterns at the reference plane, while Figure 10b shows the intensities of three nGC patterns. Figure 10c shows the codewords determined from Equations (17)–(19). Figure 10d shows the wrapped phase calculated from Equation (6). By looking up the position of the codeword in Table 1, the fringe order for each pixel can be determined as shown in Figure 10e. Then based on Equation (7), the absolute phase can be obtained as shown in Figure 10f. The 2π discontinuities are removed, and the absolute phase is continuous.
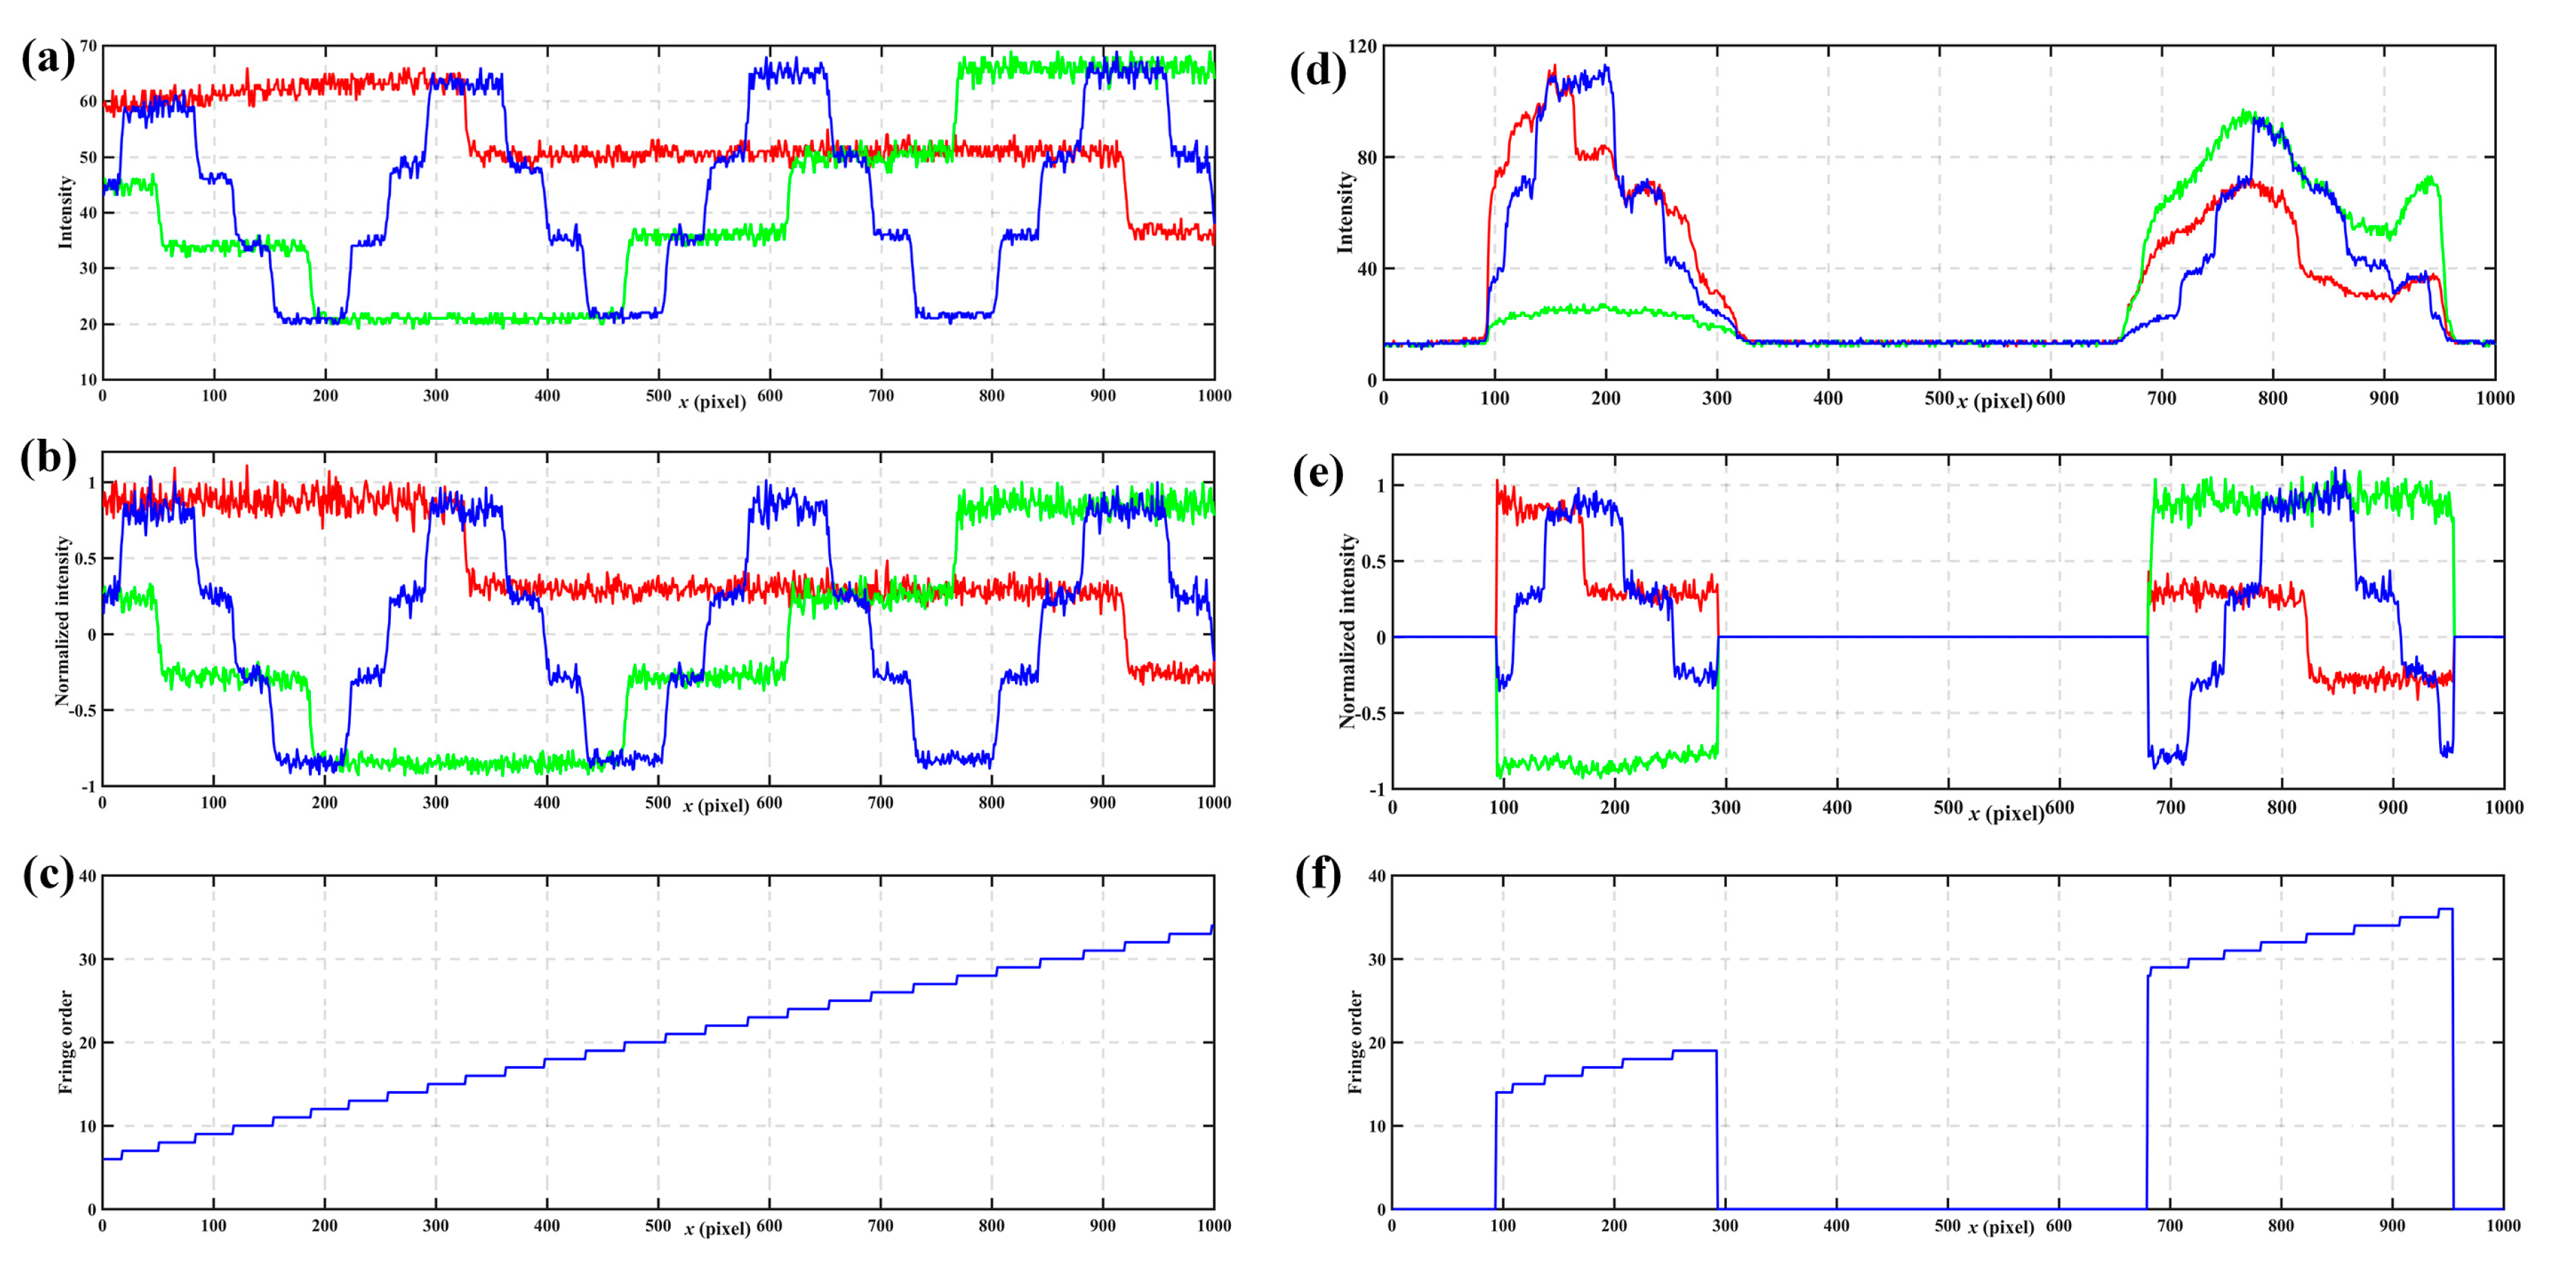
The first experiment shows the process of the nGC method. Figure 11a shows a cross-section of the reference plane without normalization. Figure 11b shows the same section of the reference plane after normalization. Because the surface contrast remains nearly the same in the reference plane, the intensity normalization shows little improvement. Figure 11c shows fringe orders calculated from the normalization patterns for the reference plane. Figure 11d shows a cross-section of the tested objects without normalization. Figure 11e shows the same cross-section of the tested objects after normalization, which illustrates significant differences compared to Figure 11d. It was hard for us to extract the codes from Figure 11d, but there was no difficulty in Figure 11e. Thus, intensity normalization can eliminate the influences of ambient light and surface contrast, which make the nGC more robust. Moreover, there is no fringe order error in Figure 11c,f, which also shows the robustness of the nGC method.
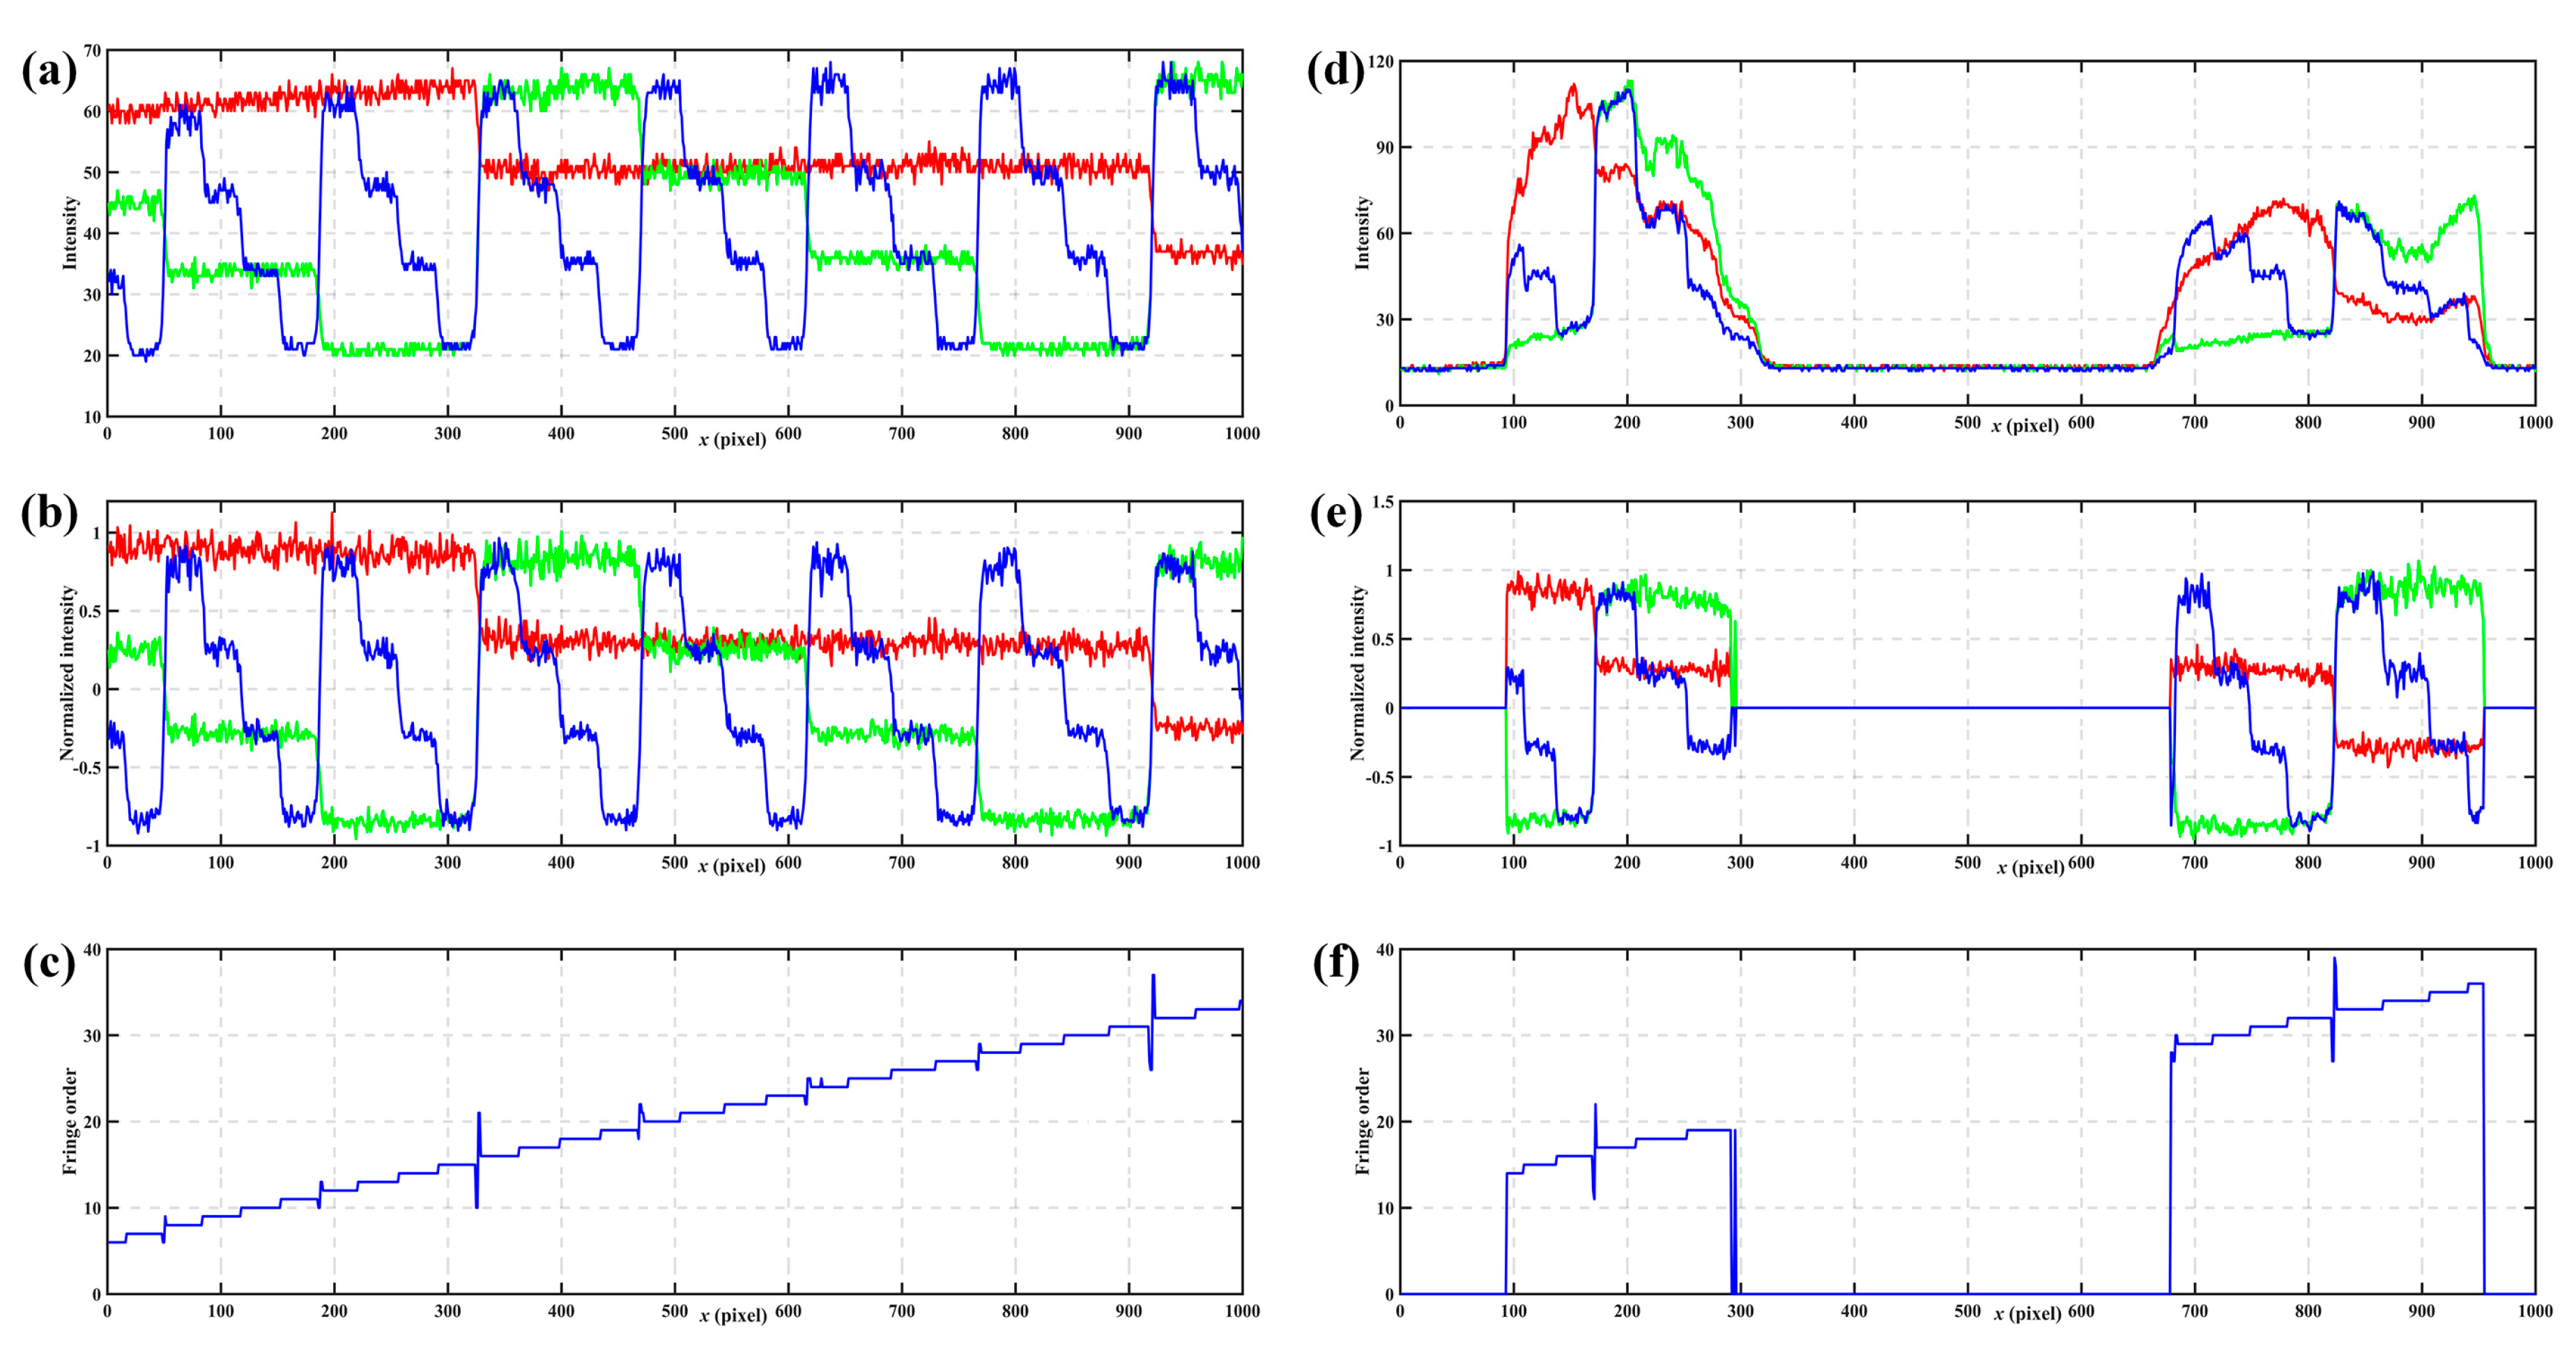
The next experiment shows the process of the nGL method. Figure 12a shows one cross-section of the reference plane without normalization. Figure 12b shows the same section of the reference plane after normalization. Figure 12c shows fringe orders calculated from the normalization patterns for the reference plane. Obviously, some sharp peaks occur in some of the code boundaries which will lead to the absolute phase errors. Figure 12d shows a cross-section of the tested objects without normalization. Figure 12e shows the same cross-section of the tested objects after normalization. Also, intensity normalization can eliminate the influences of ambient light and surface contrast. Figure 12f shows the fringe orders calculated from the normalization patterns for the measured objects. As with Figure 12c, some sharp peaks occur at the edge of some fringes in Figure 12f which leads to absolute phase errors. Comparing the results of the nGL method with the previous nGC method, the nGC method shows less errors happening, and therefore, be more robust in fringe order calculations.
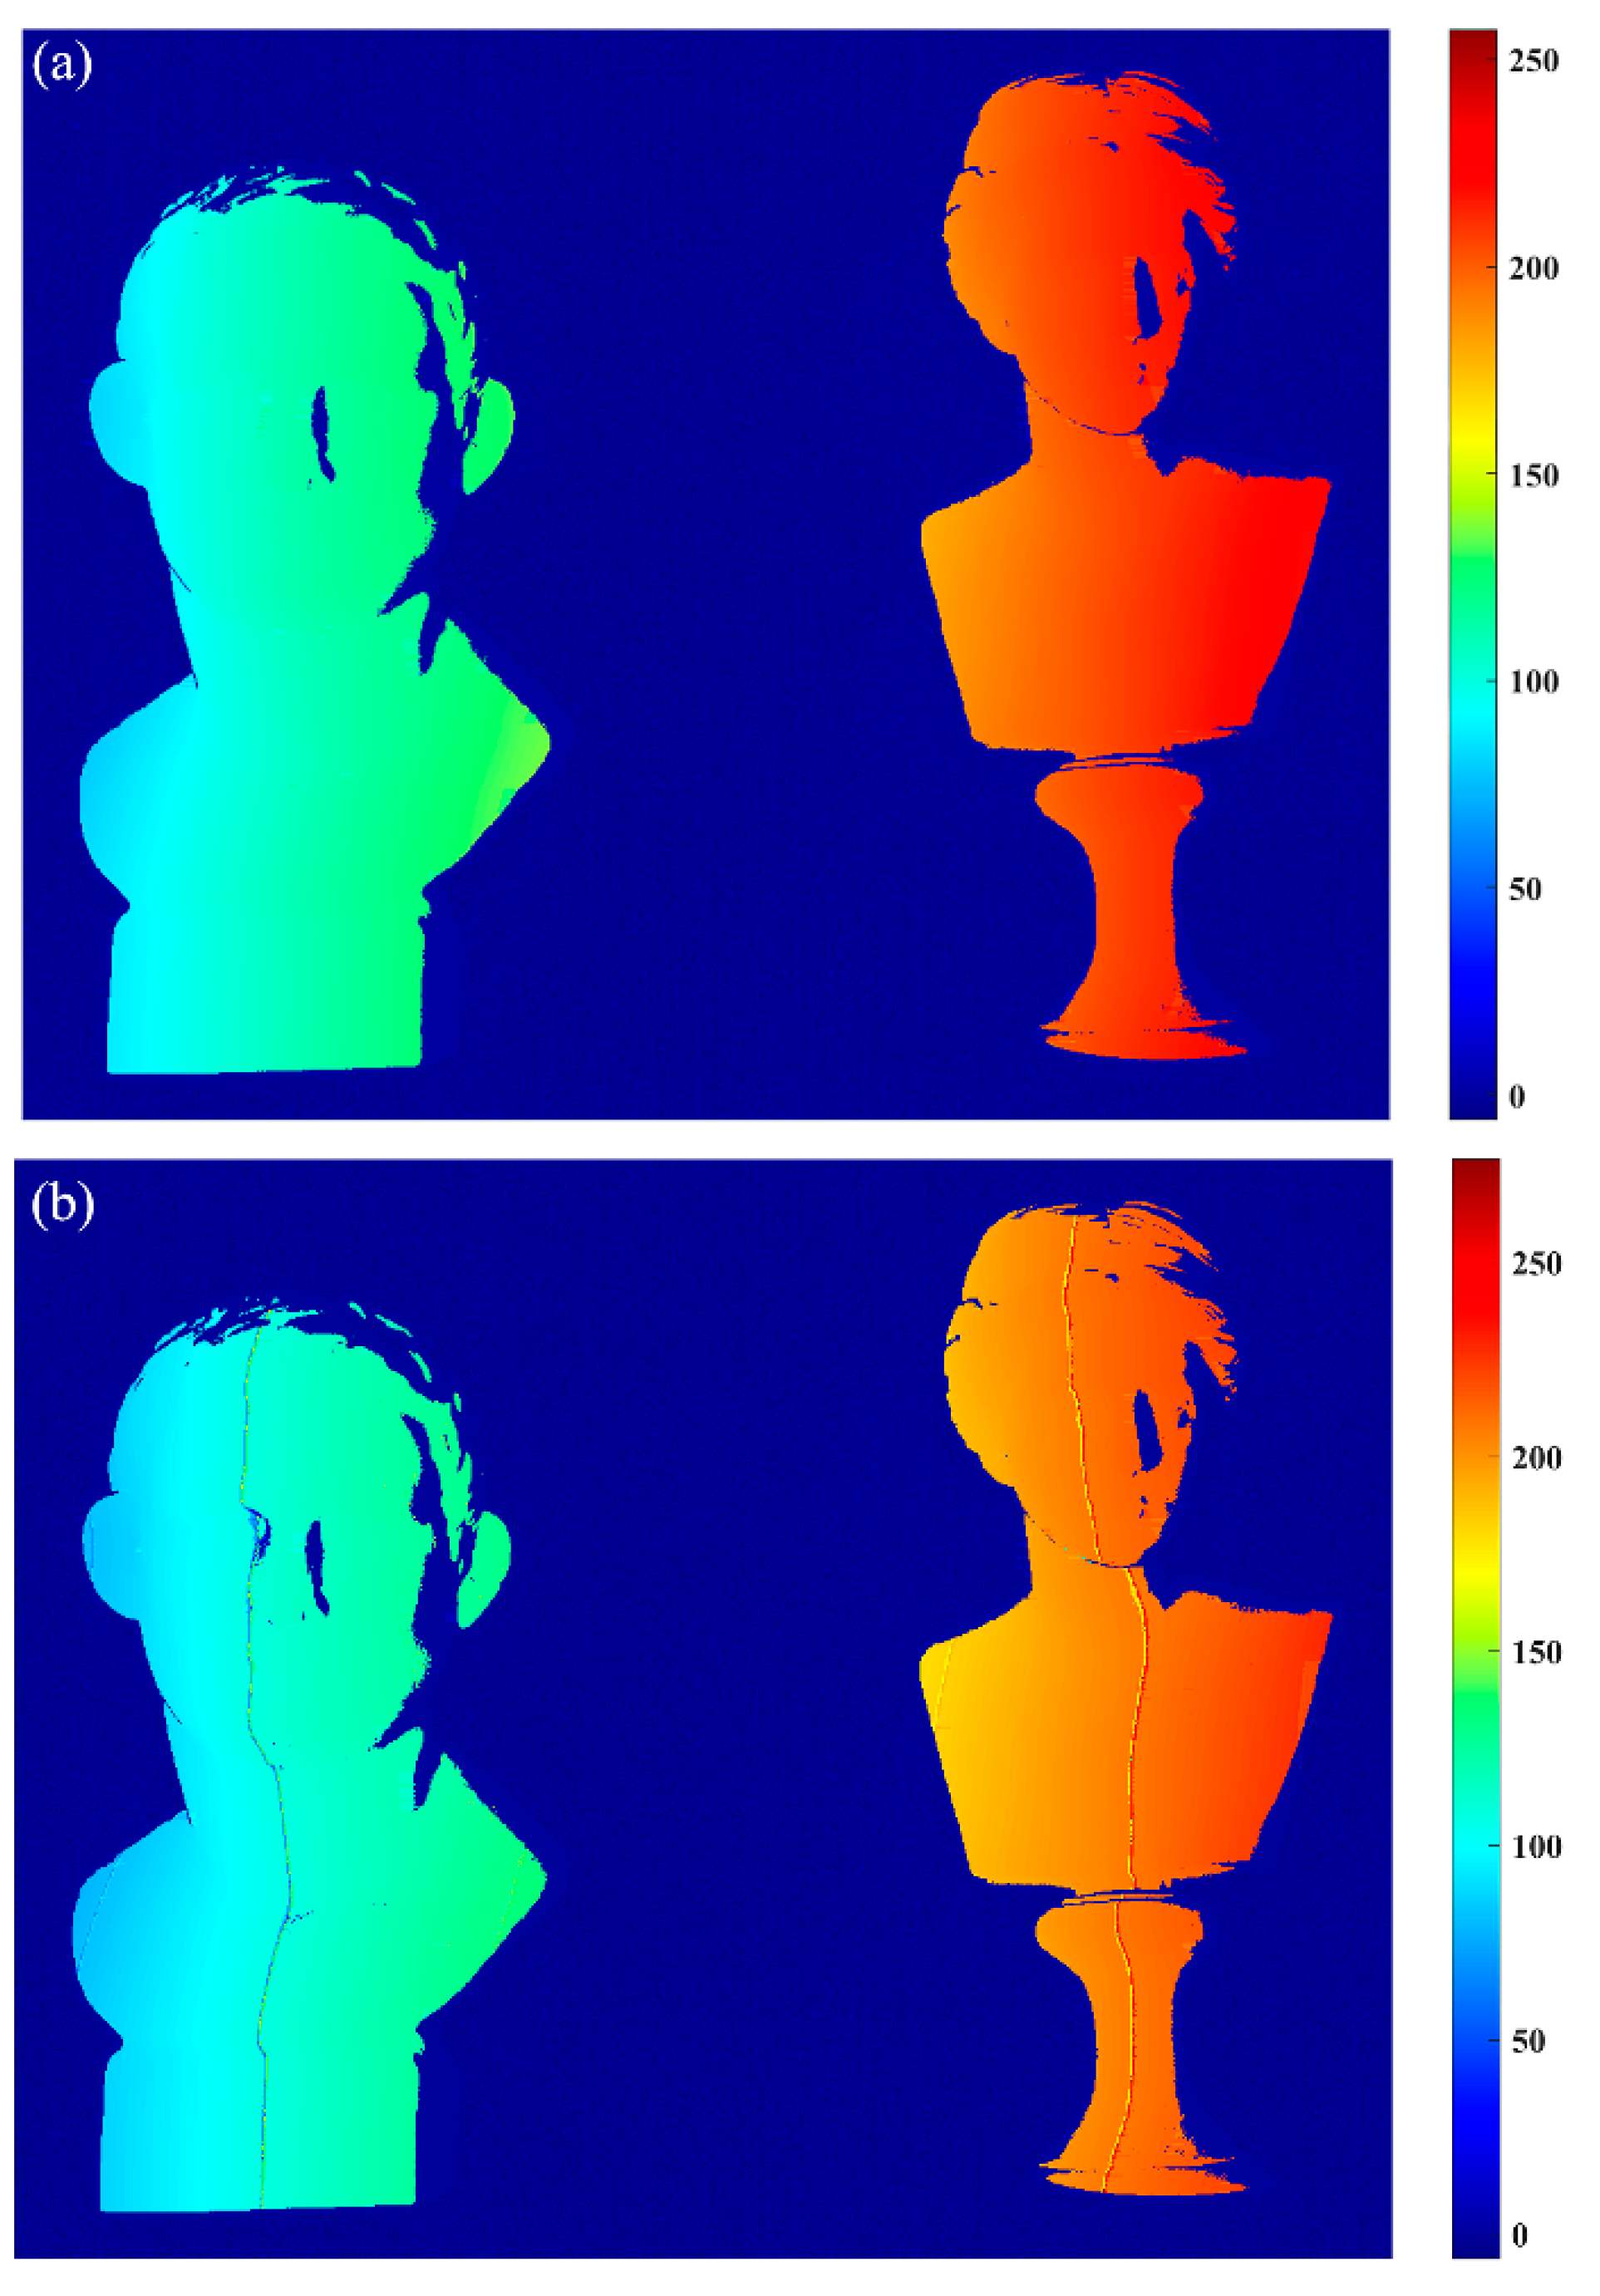
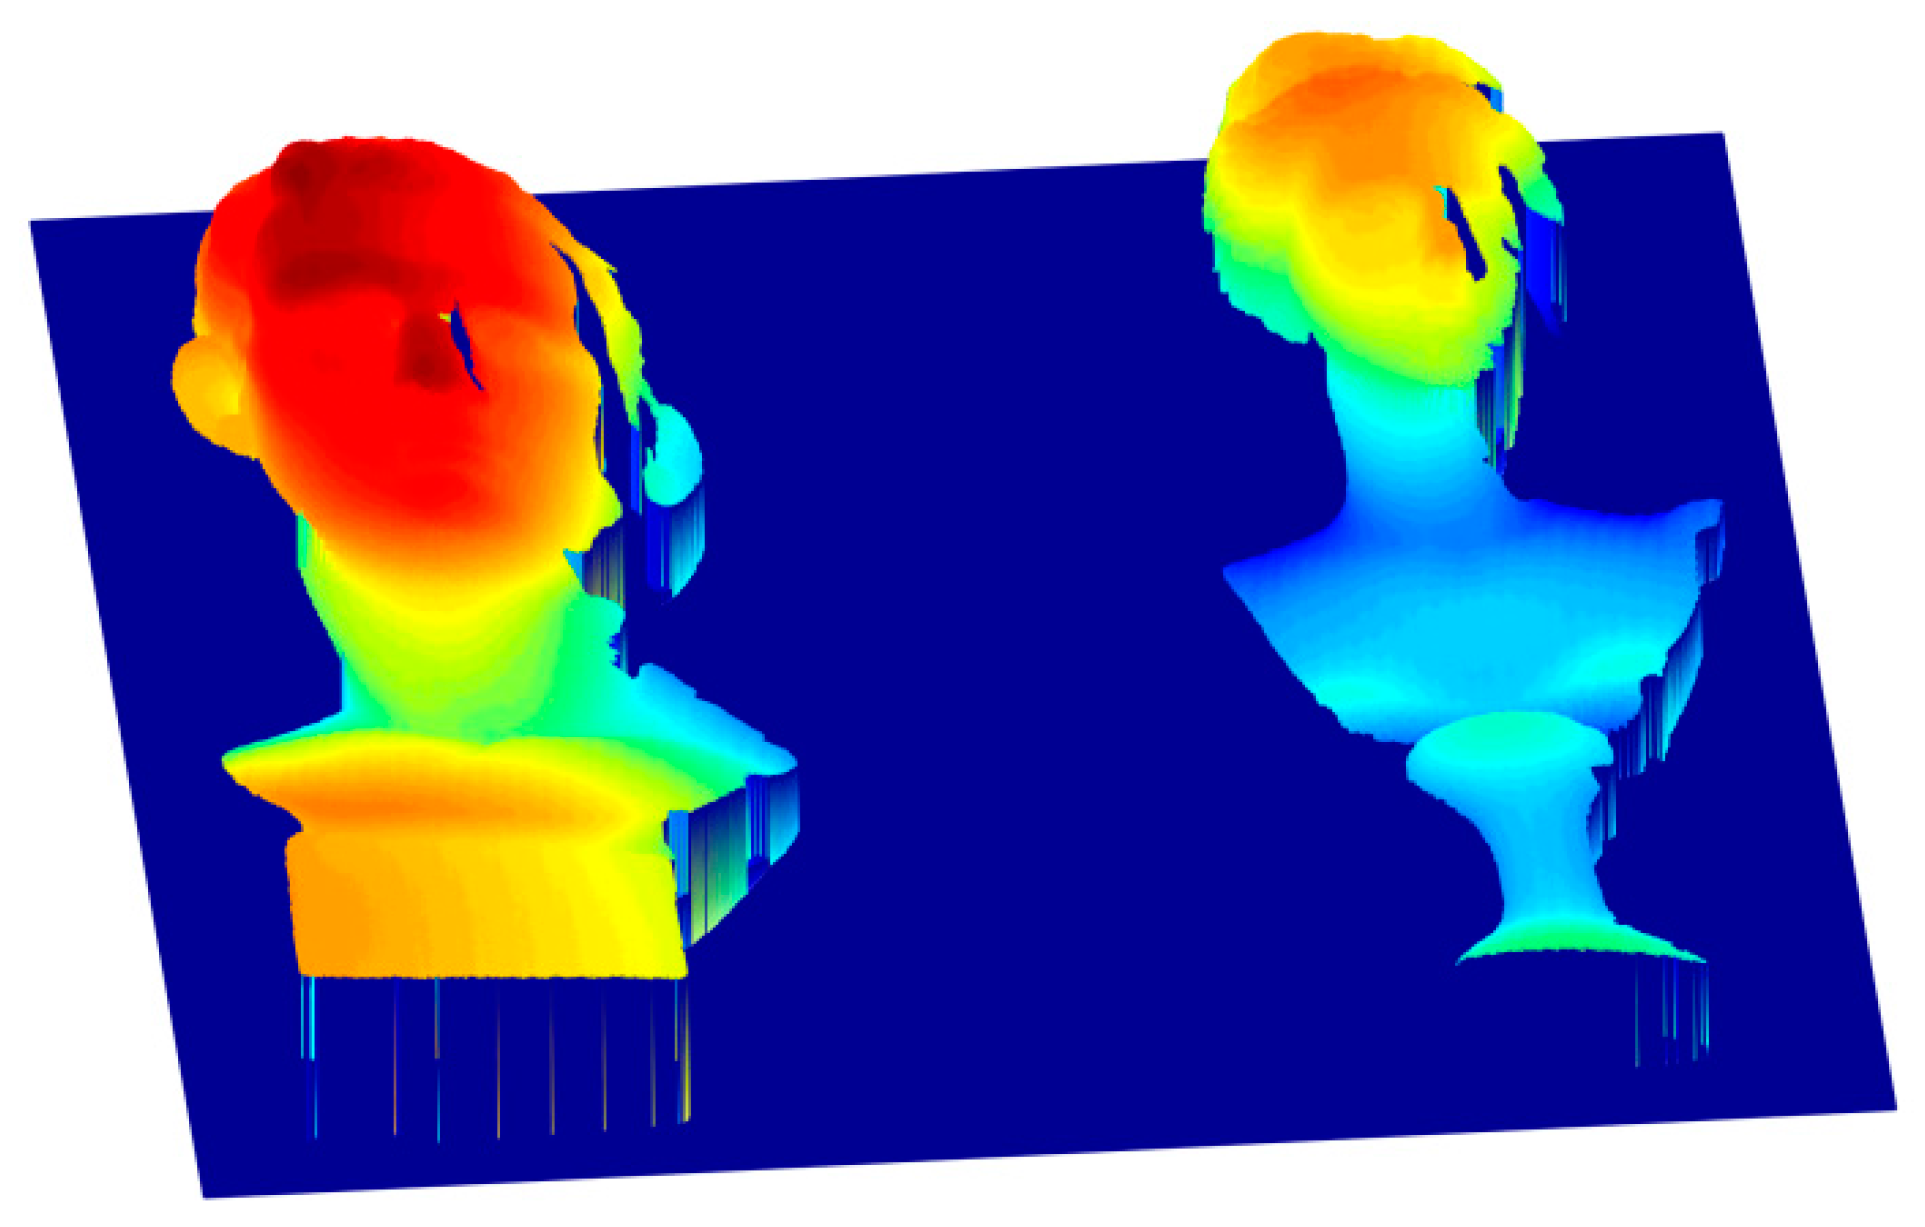
Figure 13 shows the two different results according to the framework proposed in this paper, and the only difference is that the former one uses the nGC method, and the latter uses the nGL method. Figure 13a shows the absolute phase map using the nGC method, which has no obvious mistakes. However, the absolute phase map obtained from the nGL method, shown in Figure 13b, shows some obvious errors at the fringe boundaries because the blurred pattern images caused by the defocus effects of the projector or the camera may lead to incorrect codewords. The results confirm that the proposed method can be performed better than the nGL method. Finally, we present the 3D shape measurement resulting from the nGC method after correction in Figure 14.
5. Conclusions
This paper presents a modified gray-level method for absolute phase retrieval. The proposed method can generate many more codewords than the common bGL method, with n > 2 intensity values. An intensity normalization procedure, which takes the average intensity and modulation of phase-shift patterns into account, is developed to deal with the problems caused by ambient light and surface contrast. Compared with the nGL method, the nGC method can reduce the codeword detection errors and then improve the phase unwrapping. Both simulation and real experiments demonstrate that the proposed method is reliable and applicable.
Acknowledgments
National Natural Science Foundation of China (51605130, 61603360, 51405355), Fundamental Research Funds for the Central Universities (WUT: 2017IVA059).
Author Contributions
Xiangcheng Chen and Yajun Wang conceived and designed the experiments; Mengchao Ma, Jie Luo and Lei Chen performed the experiments; Xiangcheng Chen and Yuwei Wang analyzed the data; Yuwei Wang and Shunping Chen wrote the paper.
Conflicts of Interest
The authors declare no conflict of interest.
References
- Nguyen, H.; Nguyen, D.; Wang, Z.; Kieu, H.; Le, M. Real-time, high-accuracy 3D imaging and shape measurement. Appl. Opt. 2015, 54, A9–A17. [Google Scholar] [CrossRef] [PubMed]
- Chen, S.; Li, Y.F.; Zhang, J. Vision processing for realtime 3-D data acquisition based on coded structured light. IEEE Trans. Image Process. 2008, 17, 167–176. [Google Scholar] [CrossRef] [PubMed]
- Van der Jeught, S.; Dirckx, J.J. Real-time structured light profilometry: A review. Opt. Lasers Eng. 2016, 87, 18–31. [Google Scholar] [CrossRef]
- Salvi, J.; Fernandez, S.; Pribanic, T.; Llado, X. A state of the art in structured light patterns for surface profilometry. Pattern Recognit. 2010, 43, 2666–2680. [Google Scholar] [CrossRef]
- Geng, J. Structured-light 3D surface imaging: A tutorial. Adv. Opt. Photonics 2011, 3, 128–160. [Google Scholar] [CrossRef]
- Zhang, Z.; Ma, H.; Guo, T.; Zhang, S.; Chen, J. Simple, flexible calibration of phase calculation-based three-dimensional imaging system. Opt. Lett. 2011, 36, 1257–1259. [Google Scholar] [CrossRef] [PubMed]
- Wang, P.; Wang, J.; Xu, J.; Guan, Y.; Zhang, G.; Chen, K. Calibration method for a large-scale structured light measurement system. Appl. Opt. 2017, 56, 3995–4002. [Google Scholar] [CrossRef]
- Lu, P.; Sun, C.; Liu, B.; Wang, P. Accurate and robust calibration method based on pattern geometric constraints for fringe projection profilometry. Appl. Opt. 2017, 56, 784–794. [Google Scholar] [CrossRef] [PubMed]
- Liu, Y.K.; Zhang, Q.C.; Su, X.Y. 3D shape from phase errors by using binary fringe with multi-step phase-shift technique. Opt. Lasers Eng. 2015, 74, 22–27. [Google Scholar] [CrossRef]
- Chen, X.; Wang, Y.; Wang, Y.; Ma, M.; Zeng, C. Quantized phase coding and connected region labeling for absolute phase retrieval. Opt. Express 2016, 24, 28613. [Google Scholar] [CrossRef] [PubMed]
- Lei, S.; Zhang, S. Flexible 3-D shape measurement using projector defocusing. Opt. Lett. 2009, 34, 3080–3082. [Google Scholar] [CrossRef] [PubMed]
- Jia, P.; Kofman, J.; English, C.E. Two-step triangular-pattern phase-shifting method for three-dimensional object-shape measurement. Opt. Eng. 2007, 46, 083201. [Google Scholar]
- Huang, P.S.; Zhang, S. Trapezoidal phase-shifting method for three-dimensional shape measurement. Opt. Eng. 2005, 44, 123601. [Google Scholar] [CrossRef]
- Je, C.; Lee, S.W.; Park, R.-H. Color-Phase Analysis for Sinusoidal Structured Light in Rapid Range Imaging. In Proceedings of the 6th Asian Conference on Computer Vision, Jeju, Korea, 27–30 January 2004; Volume 1, pp. 270–275. [Google Scholar]
- Je, C.; Lee, S.W.; Park, R.-H. Colour-stripe permutation pattern for rapid structured-light range imaging. Opt. Commun. 2012, 285, 2320–2331. [Google Scholar] [CrossRef]
- Pan, J.; Huang, P.S.; Chiang, F.-P. Color phase-shifting technique for three-dimensional shape measurement. Opt. Eng. 2006, 45, 013602. [Google Scholar]
- Barone, S.; Paoli, A.; Razionale, A.V. A coded structured light system based on primary color stripe projection and monochrome imaging. Sensors 2013, 13, 13802–13819. [Google Scholar] [CrossRef] [PubMed]
- Zhang, S. Recent progresses on real-time 3D shape measurement using digital fringe projection techniques. Opt. Lasers Eng. 2010, 48, 149–158. [Google Scholar] [CrossRef]
- Takeda, M. Fourier fringe analysis and its application to metrology of extreme physical phenomena: A review [Invited]. Appl. Opt. 2013, 52, 20–29. [Google Scholar] [CrossRef] [PubMed]
- Qian, K. Applications of windowed Fourier fringe analysis in optical measurement: A review. Opt. Lasers Eng. 2015, 66, 67–73. [Google Scholar]
- Zhang, Z.; Jing, Z.; Wang, Z.; Kuang, D. Comparison of Fourier transform, windowed Fourier transform, and wavelet transform methods for phase calculation at discontinuities in fringe projection profilometry. Opt. Lasers Eng. 2012, 50, 1152–1160. [Google Scholar] [CrossRef]
- Srinivasan, V.; Liu, H.C.; Halioua, M. Automated phase-measuring profilometry of 3-D diffuse objects. Appl. Opt. 1984, 23, 3105–3108. [Google Scholar] [CrossRef] [PubMed]
- Li, B.; Wang, Y.; Dai, J.; Lohry, W.; Zhang, S. Some recent advances on superfast 3D shape measurement with digital binary defocusing techniques. Opt. Lasers Eng. 2014, 54, 236–246. [Google Scholar] [CrossRef]
- Su, X.; Chen, W. Reliability-guided phase unwrapping algorithm: A review. Opt. Lasers Eng. 2004, 42, 245–261. [Google Scholar] [CrossRef]
- Zuo, C.; Huang, L.; Zhang, M.L.; Chen, Q.; Asundi, A. Temporal phase unwrapping algorithms for fringe projection profilometry: A comparative review. Opt. Lasers Eng. 2016, 85, 84–103. [Google Scholar] [CrossRef]
- Qian, K.; Gao, W.; Wang, H. Windowed Fourier-filtered and quality-guided phase-unwrapping algorithm. Appl. Opt. 2008, 47, 5420–5428. [Google Scholar]
- Bioucas-Dias, J.M.; Valadão, G. Phase unwrapping via graph cuts. IEEE Trans. Image Process. 2007, 16, 698–709. [Google Scholar] [CrossRef]
- Zheng, D.; Da, F. A novel algorithm for branch cut phase unwrapping. Opt. Lasers Eng. 2011, 49, 609–617. [Google Scholar] [CrossRef]
- Chen, F.; Su, X. Phase-unwrapping algorithm for the measurement of 3D object. Opt. Int. J. Light Electron Opt. 2012, 123, 2272–2275. [Google Scholar] [CrossRef]
- Li, J.L.; Su, H.J.; Su, X.Y. Two-frequency grating used in phase-measuring profilometry. Appl. Opt. 1997, 36, 277–280. [Google Scholar] [CrossRef] [PubMed]
- Cheng, Y.Y.; Wyant, J.C. Multiple-wavelength phase-shifting interferometry. Appl. Opt. 1985, 24, 804–807. [Google Scholar] [CrossRef] [PubMed]
- Sansoni, G.; Corini, S.; Lazzari, S.; Rodella, R.; Docchio, F. Three-dimensional imaging based on Gray-code light projection: Characterization of the measuring algorithm and development of a measuring system for industrial applications. Appl. Opt. 1997, 36, 4463–4472. [Google Scholar] [CrossRef] [PubMed]
- Wang, Y.; Zhang, S. Novel phase-coding method for absolute phase retrieval. Opt. Lett. 2012, 37, 2067–2069. [Google Scholar] [CrossRef] [PubMed]
- Porras-Aguilar, R.; Falaggis, K. Absolute phase recovery in structured light illumination systems: Sinusoidal vs. intensity discrete patterns. Opt. Lasers Eng. 2016, 84, 111–119. [Google Scholar] [CrossRef]
- Porras-Aguilar, R.; Falaggis, K.; Ramos-Garcia, R. Error correcting coding-theory for structured light illumination systems. Opt. Lasers Eng. 2017, 93, 146–155. [Google Scholar] [CrossRef]
- Porras-Aguilar, R.; Falaggis, K.; Ramos-Garcia, R. Optimum projection pattern generation for grey-level coded structured light illumination systems. Opt. Lasers Eng. 2017, 91, 242–256. [Google Scholar] [CrossRef]
- Horn, E.; Kiryati, N. Toward optimal structured light patterns. Image Vis. Comput. 1999, 17, 87–97. [Google Scholar] [CrossRef]
- Wang, Y.; Zhang, S.; Oliver, J.H. 3D shape measurement technique for multiple rapidly moving objects. Opt. Express 2011, 19, 8539–8545. [Google Scholar] [CrossRef] [PubMed]
- Caspi, D.; Kiryati, N.; Shamir, J. Range imaging with adaptive color structured light. IEEE Trans. Pattern Anal. 1998, 20, 470–480. [Google Scholar] [CrossRef]
- Er, M. On generating the N-ary reflected Gray codes. IEEE Trans. Comput. 1984, 100, 739–741. [Google Scholar] [CrossRef]
- Wang, Y.; Chen, X.; Tao, J.; Wang, K.; Ma, M. Accurate feature detection for out-of-focus camera calibration. Appl. Opt. 2016, 55, 7964–7971. [Google Scholar] [CrossRef] [PubMed]
- Lu, L.; Xi, J.; Yu, Y.; Guo, Q.; Yin, Y.; Song, L. Shadow removal method for phase-shifting profilometry. Appl. Opt. 2015, 54, 6059–6064. [Google Scholar] [CrossRef] [PubMed]
- Zhang, W.; Li, W.; Yan, J.; Yu, L.; Pan, C. Adaptive threshold selection for background removal in fringe projection profilometry. Opt. Lasers Eng. 2017, 90, 209–216. [Google Scholar] [CrossRef]
- Wang, Y.; Cai, B.; Wang, K.; Chen, X. Out-of-focus color camera calibration with one normal-sized color-coded pattern. Opt. Lasers Eng. 2017, 98, 17–22. [Google Scholar] [CrossRef]
- Huang, P.S.; Zhang, S. Fast three-step phase-shifting algorithm. Appl. Opt. 2006, 45, 5086–5091. [Google Scholar] [CrossRef] [PubMed]
- Bell, T.; Li, B.; Zhang, S. Structured light techniques and applications. In Wiley Encyclopedia of Electrical and Electronics Engineering; John Wiley & Sons, Inc.: Hoboken, NJ, USA, 2016. [Google Scholar]
Figure 1.
The binary gray-level (bGL) method.
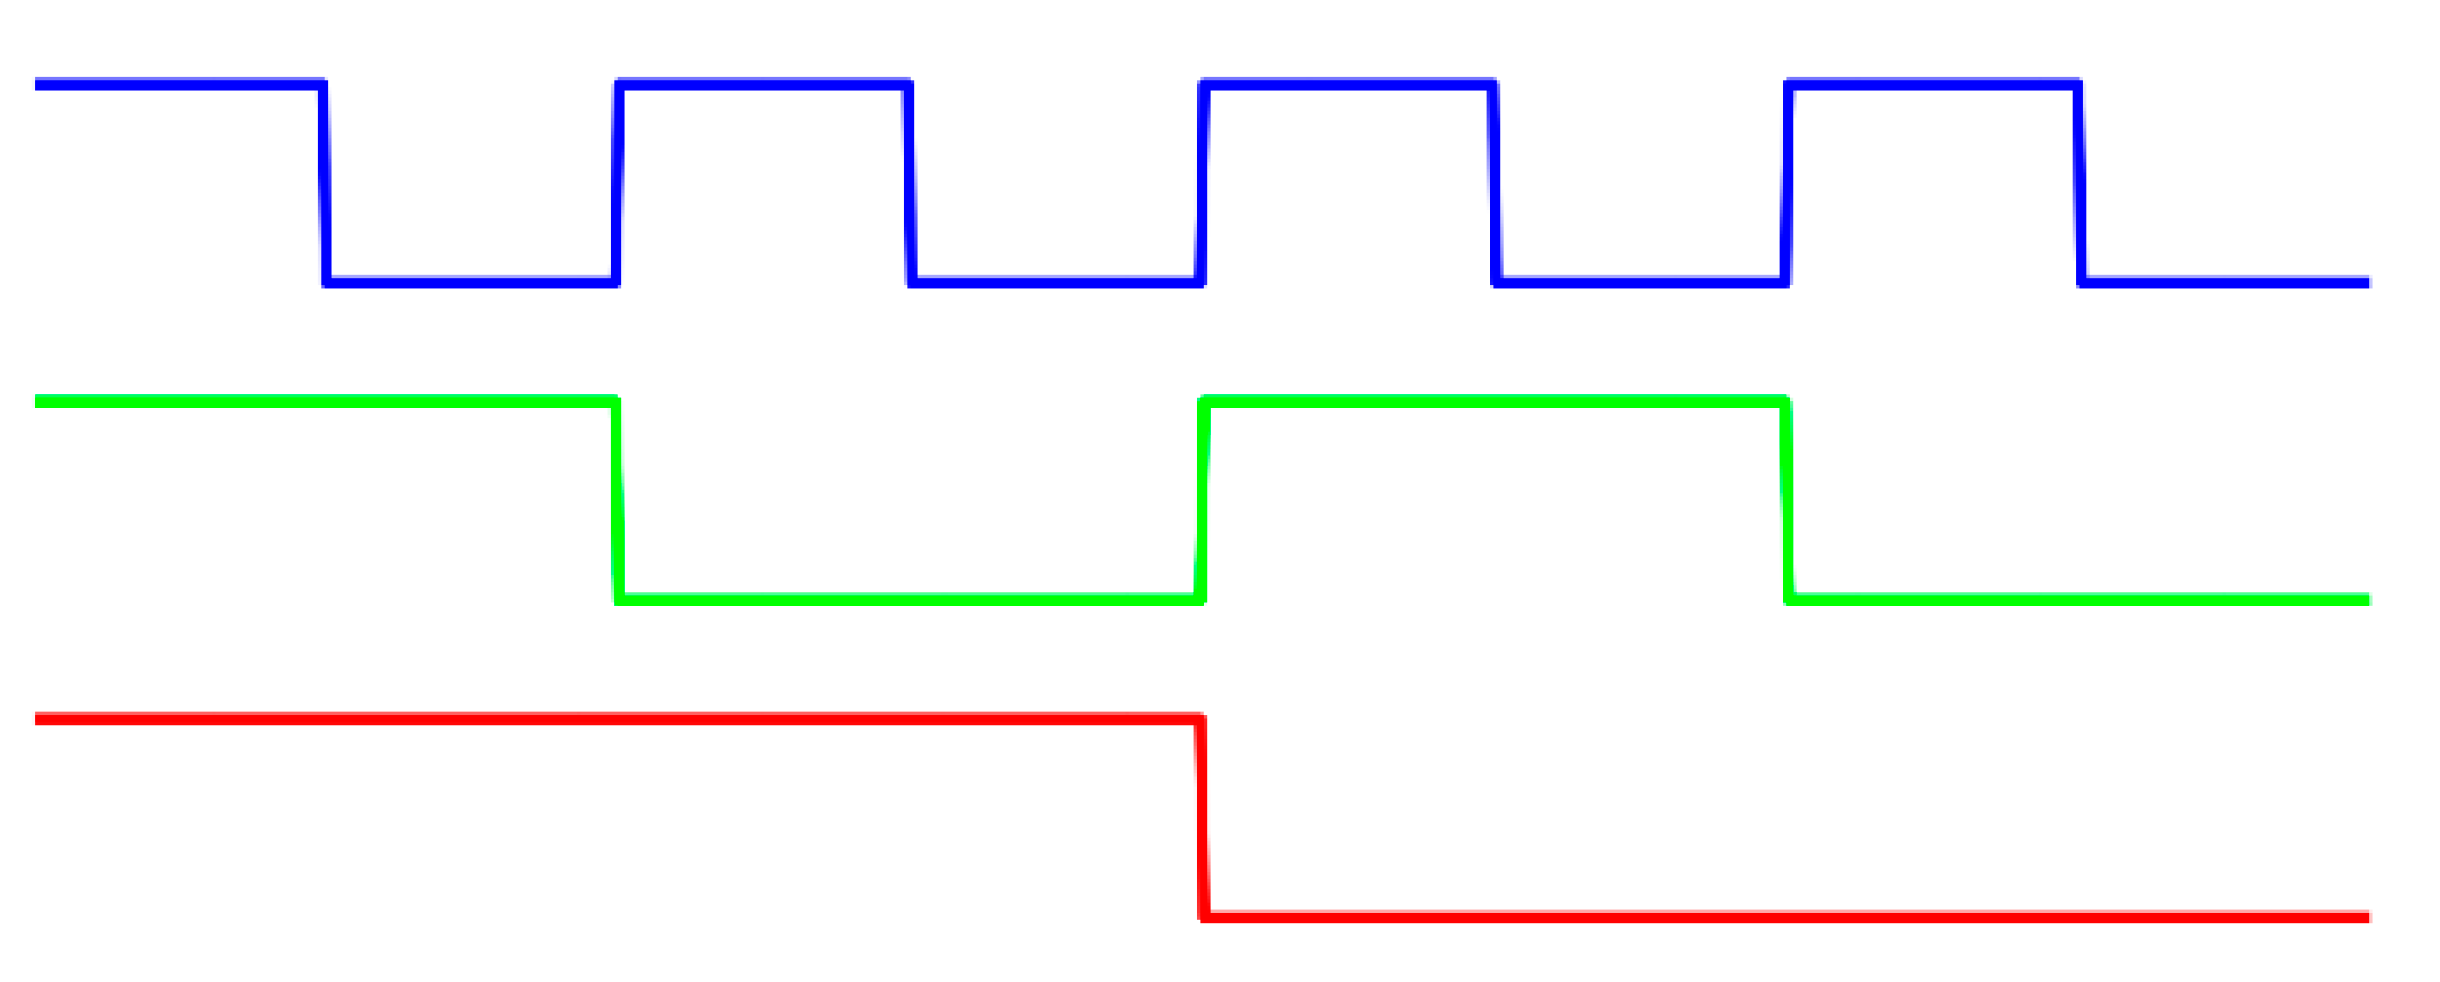
Figure 2.
The n-ary gray-level (nGL) method.

Figure 3.
The n-ary gray-code (nGC) method used in this paper.

Figure 4.
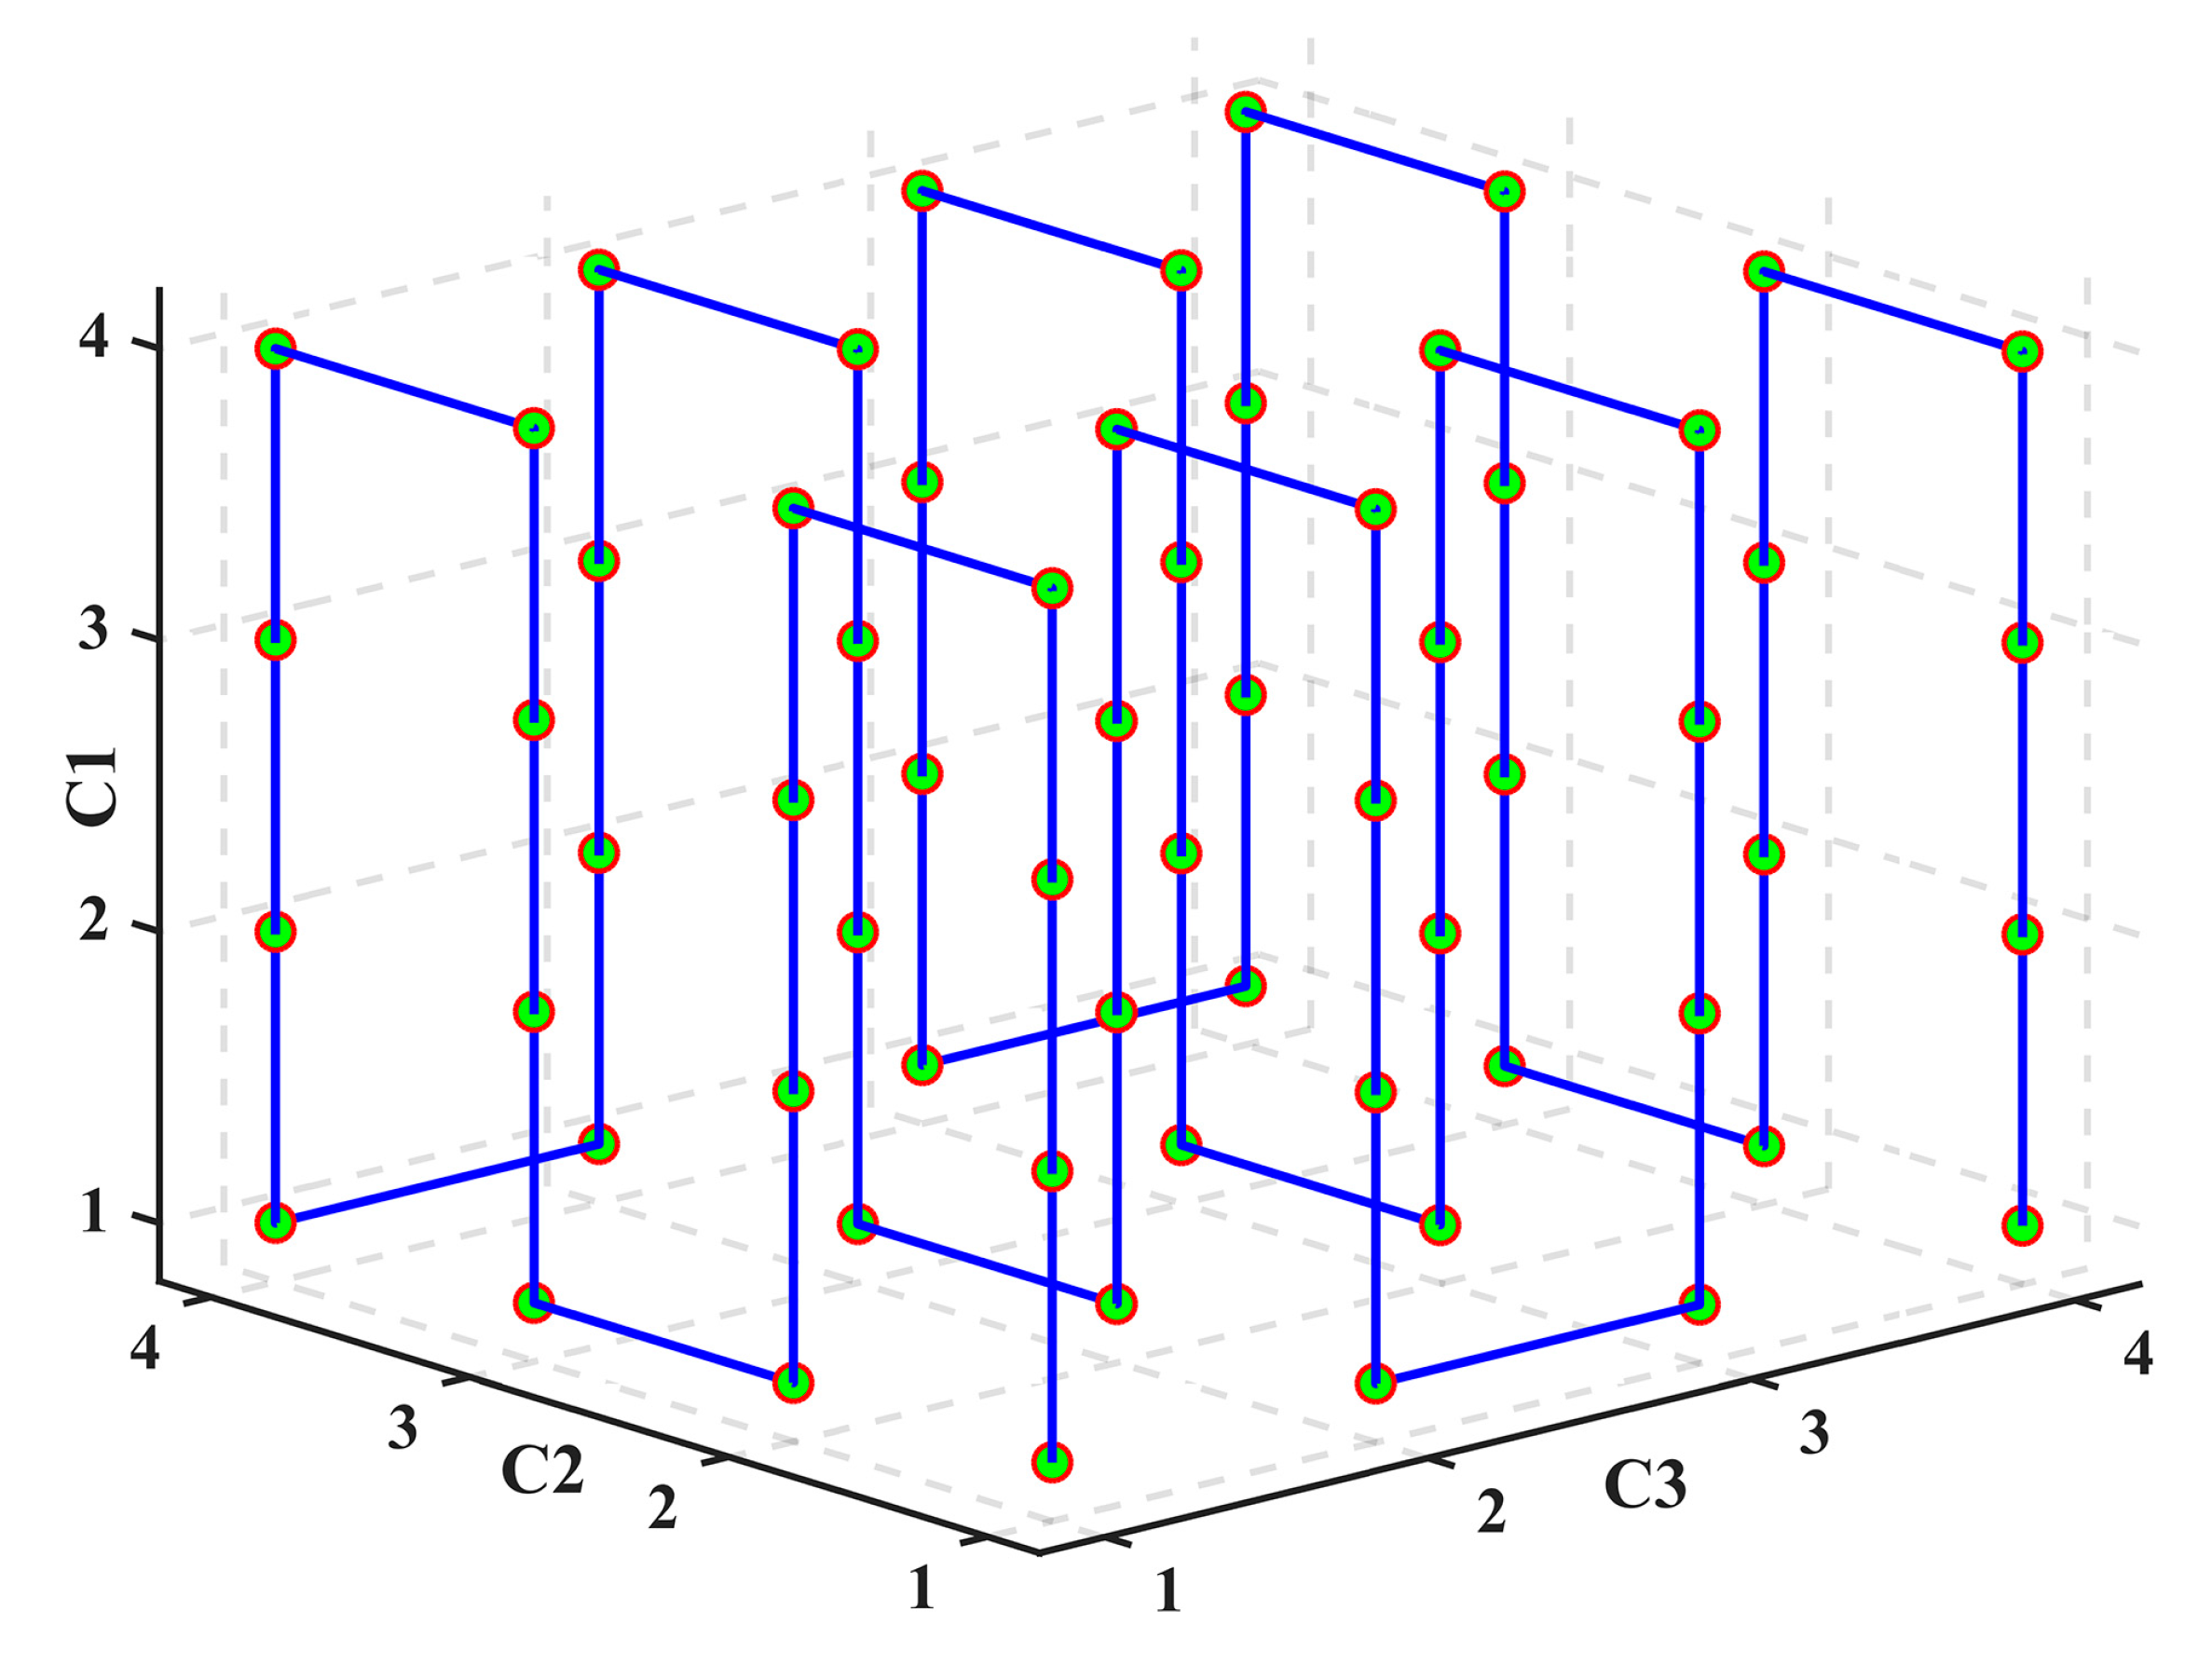
Code-space diagram.

Figure 5.
Simulated patterns. (a) modulation function, (b) modulated phase-shift patterns with noises, (c) modulated coded patterns with noises.
Figure 5.
Simulated patterns. (a) modulation function, (b) modulated phase-shift patterns with noises, (c) modulated coded patterns with noises.
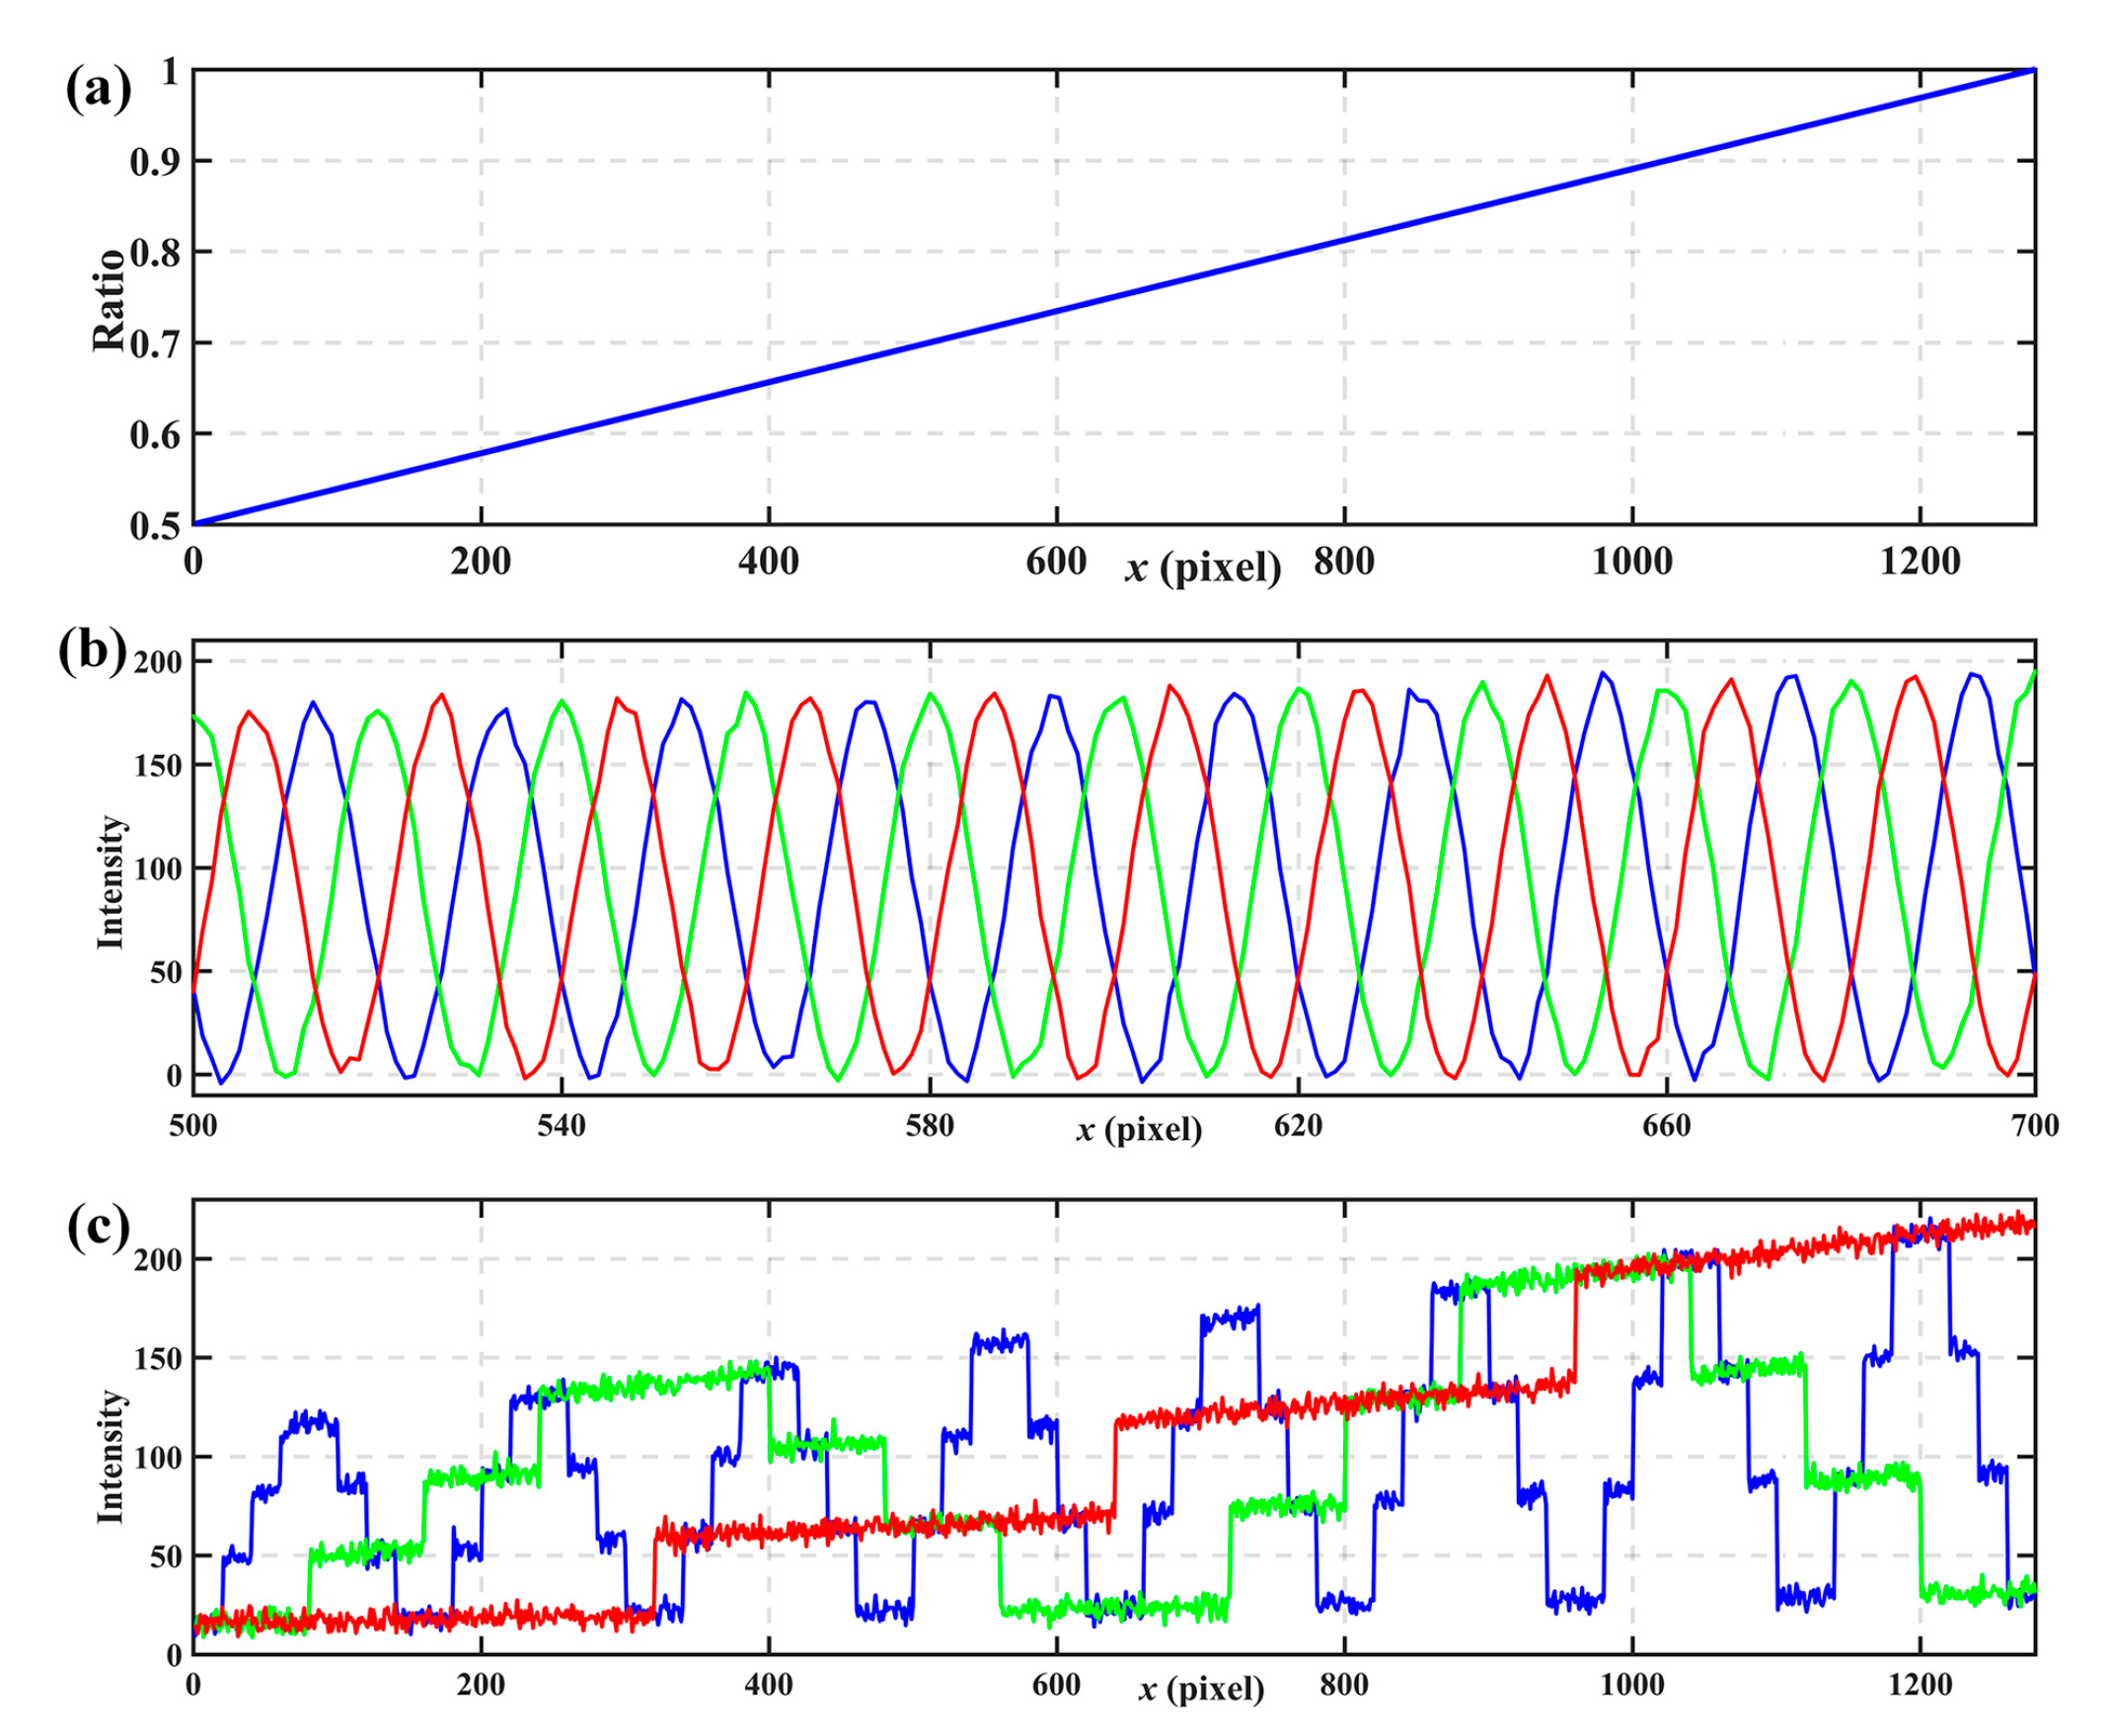
Figure 6.
Simulated results. (a) wrapped phases, (b) coded patterns with intensity normalization, (c) codewords calculated from normalization coded patterns, (d) fringe orders, (e) the calculated absolute phase.
Figure 6.
Simulated results. (a) wrapped phases, (b) coded patterns with intensity normalization, (c) codewords calculated from normalization coded patterns, (d) fringe orders, (e) the calculated absolute phase.

Figure 7.
Setup used in the experiments.

Figure 8.
Projected patterns. (a–c) phase-shift patterns, (d–f) nGC patterns, (g–i) nGL patterns.

Figure 9.
Captured images. (a–c) phase-shift patterns, (d–f) nGC patterns, (g–i) nGL patterns.

Figure 10.
One cross-section of the reference plane. (a) phase-shift patterns, (b) nGC patterns, (c) calculated codewords, (d) wrapped phase, (e) determined fringe order, and (f) absolute phase.
Figure 10.
One cross-section of the reference plane. (a) phase-shift patterns, (b) nGC patterns, (c) calculated codewords, (d) wrapped phase, (e) determined fringe order, and (f) absolute phase.
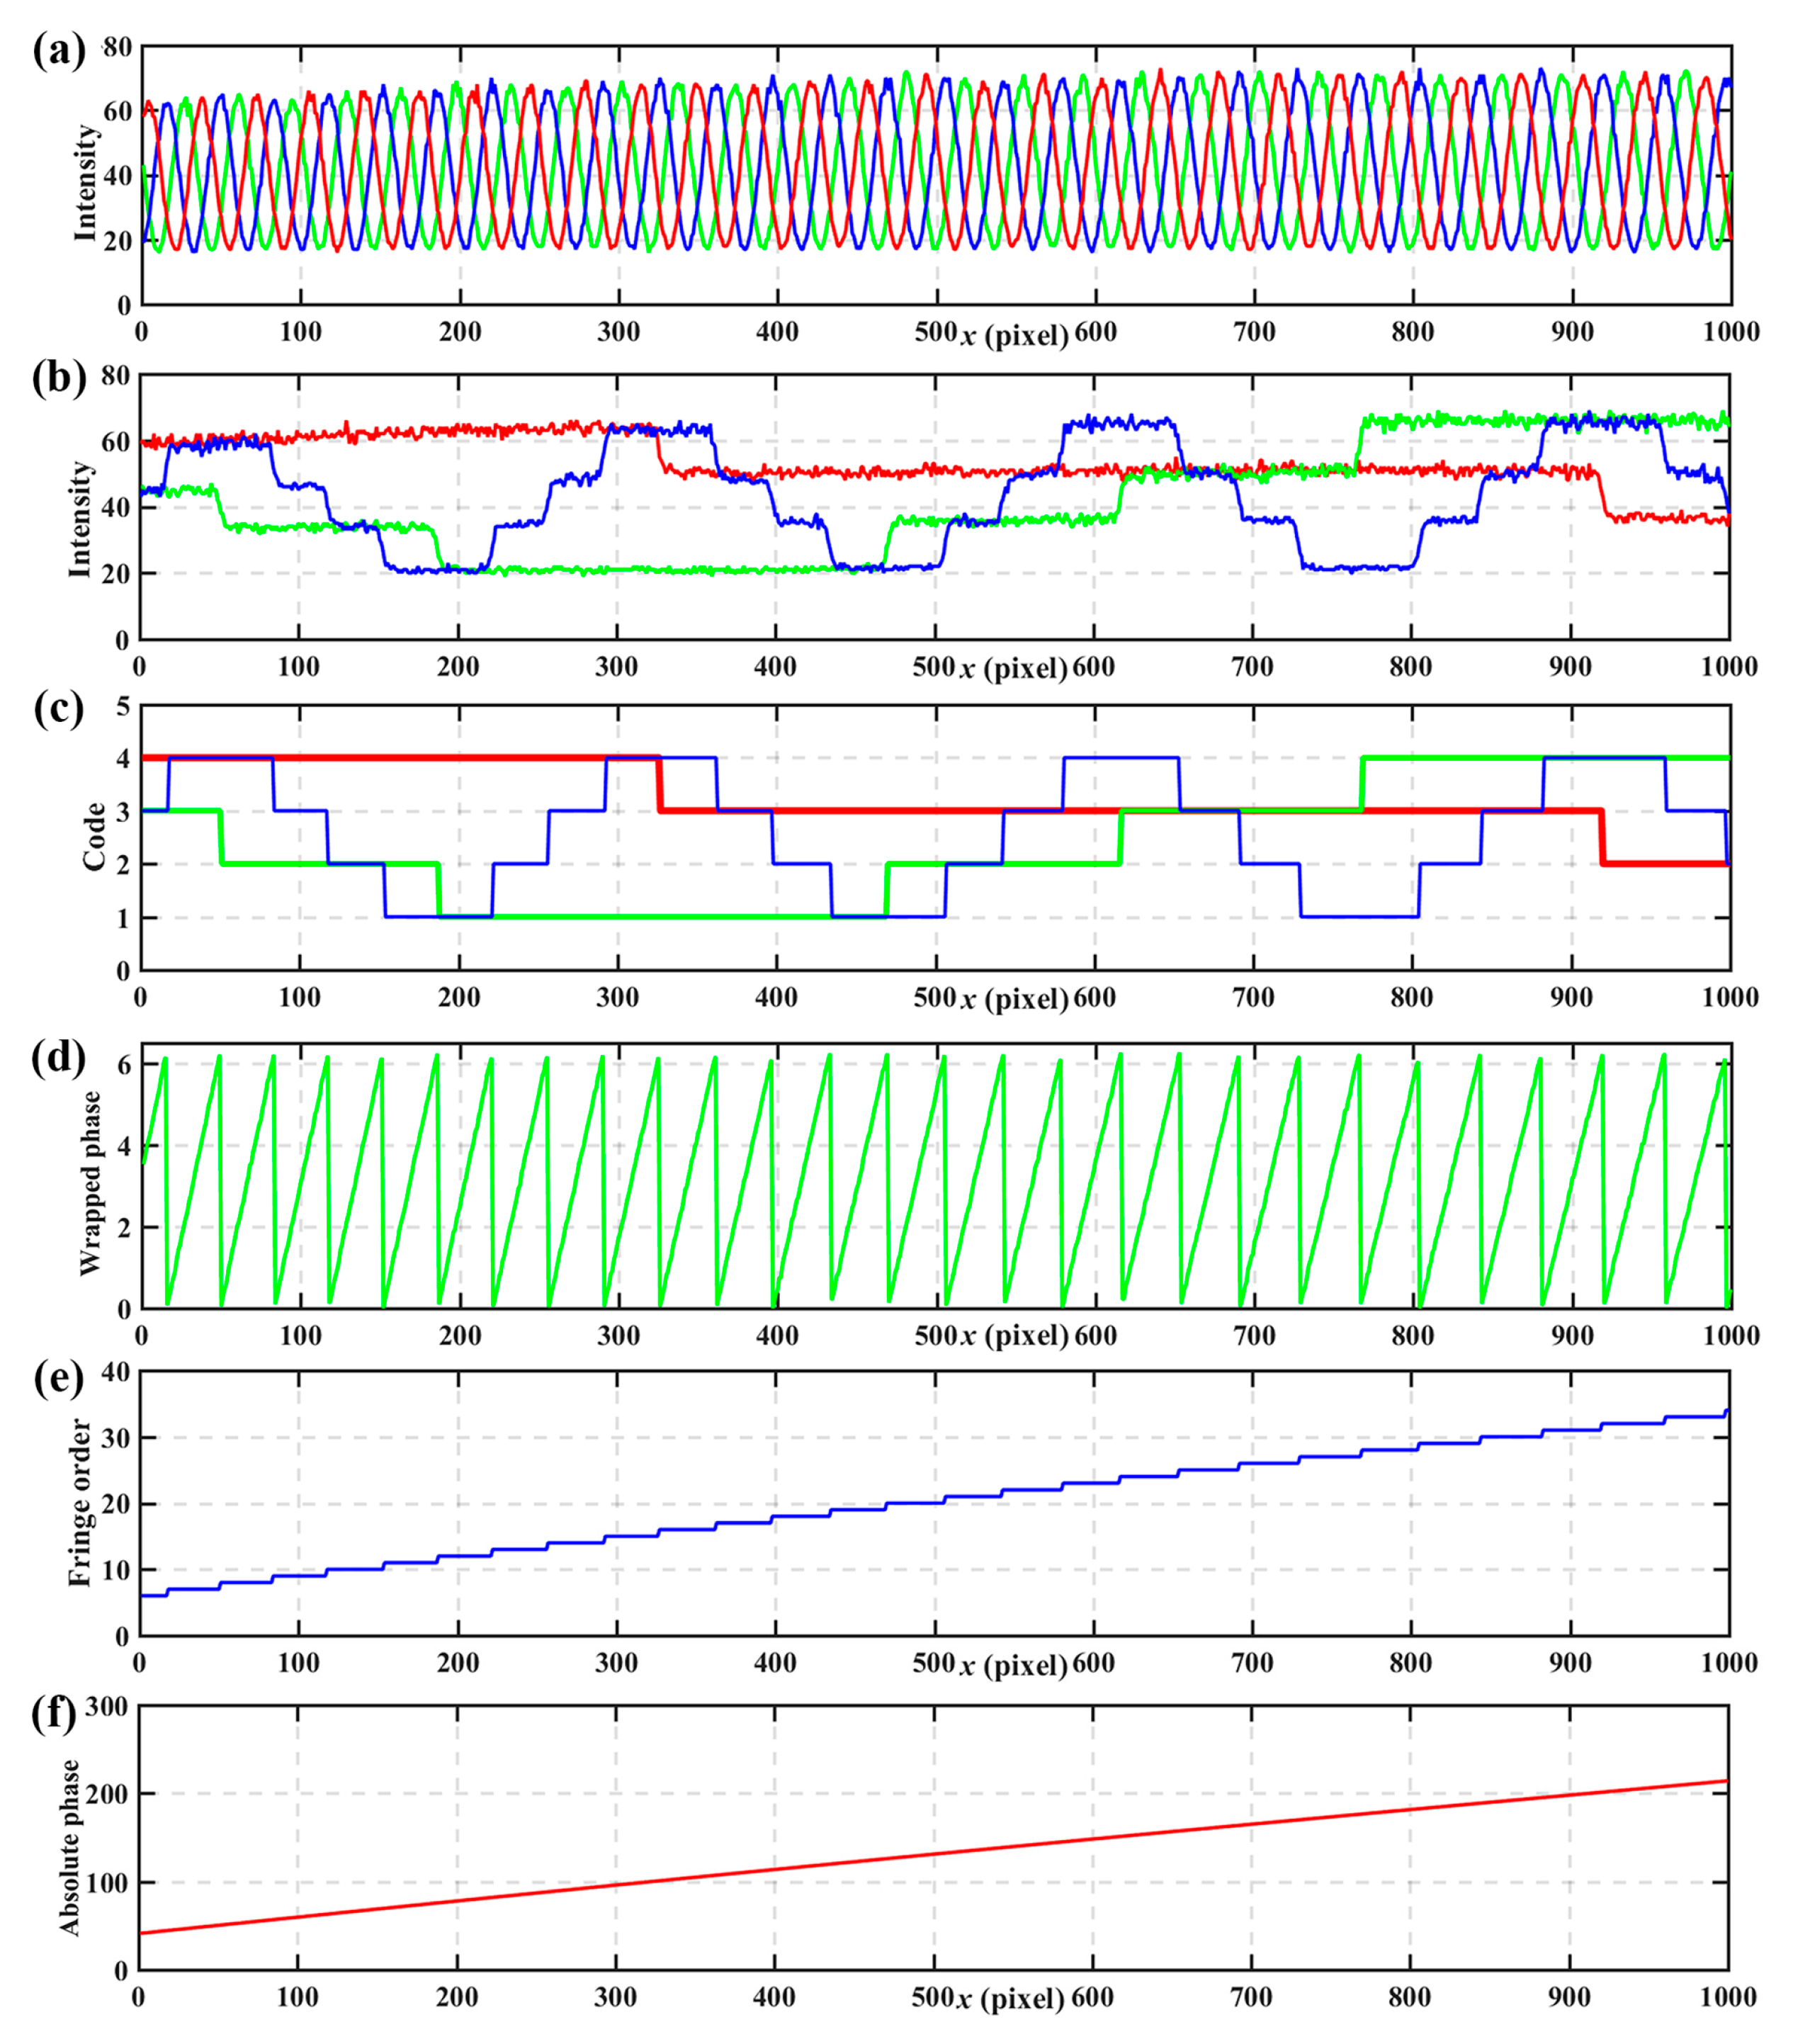
Figure 11.
One cross-section of the nGC method. (a) nGC patterns without normalization of the reference plane, and (b) the same patterns after normalization, (c) fringe orders calculated from the normalization patterns for the reference plane, (d) nGC patterns without normalization of the measured objects, and (e) the same patterns after normalization, and (f) fringe orders calculated from the normalization patterns for the measured objects.

Figure 12.
One cross-section of the nGL method. (a) nGL patterns without normalization of the reference plane, and (b) same patterns after normalization, (c) fringe orders calculated from the normalization patterns for the reference plane, (d) nGL patterns without normalization of the measured objects, and (e) same patterns after normalization, and (f) fringe orders calculated from the normalization patterns for the measured objects.

Figure 13.
The absolute phase maps. (a) nGC method, (b) nGL method.

Figure 14.
The 3D shape measurement result using the proposed method after correction.


Table 1.
The designed codewords.
| C3 | 4 | 3 | 2 | 1 | ||||||||||||
| C2 | 4 | 3 | 2 | 1 | 1 | 2 | 3 | 4 | 4 | 3 | 2 | 1 | 1 | 2 | 3 | 4 |
| C1 | 4321 | 1234 | 4321 | 1234 | 4321 | 1234 | 4321 | 1234 | 4321 | 1234 | 4321 | 1234 | 4321 | 1234 | 4321 | 1234 |
© 2017 by the authors. Licensee MDPI, Basel, Switzerland. This article is an open access article distributed under the terms and conditions of the Creative Commons Attribution (CC BY) license (http://creativecommons.org/licenses/by/4.0/).
Share and Cite
MDPI and ACS Style
Chen, X.; Chen, S.; Luo, J.; Ma, M.; Wang, Y.; Wang, Y.; Chen, L. Modified Gray-Level Coding Method for Absolute Phase Retrieval. Sensors 2017, 17, 2383. https://doi.org/10.3390/s17102383
AMA Style
Chen X, Chen S, Luo J, Ma M, Wang Y, Wang Y, Chen L. Modified Gray-Level Coding Method for Absolute Phase Retrieval. Sensors. 2017; 17(10):2383. https://doi.org/10.3390/s17102383
Chicago/Turabian StyleChen, Xiangcheng, Shunping Chen, Jie Luo, Mengchao Ma, Yuwei Wang, Yajun Wang, and Lei Chen. 2017. "Modified Gray-Level Coding Method for Absolute Phase Retrieval" Sensors 17, no. 10: 2383. https://doi.org/10.3390/s17102383
Note that from the first issue of 2016, this journal uses article numbers instead of page numbers. See further details here.