1. Introduction
Inertial Measurement Units (IMUs) [
1] have recently been gaining popularity in motion capture [
2], feature extraction [
3,
4,
5] and motion evaluation [
6,
7]. IMU systems are usually regarded as a wearable and flexible alternative [
8,
9] for marker-based optical tracking systems, especially in daily monitoring and outdoor measurement, because they are wearable and their workspace is not limited to a special room equipped with cameras. However, one fundamental difference between the two systems is usually not mentioned. For optical tracking systems, all the measurements are with respect to only one reference frame. Conversely, for IMU system the measurement is with respect to the coordinates frame of each sensor, and as such all different. Therefore, for analysis with data from IMUs, special attention must be paid to the alignment between the coordinates frames of different IMUs, and between IMUs and body segments. In most of the researches [
3,
4,
5,
7] this alignment was skipped or performed by manually adjusting the placement of IMUs, assuming that the axes of sensor could represent the axes of the body segment where the sensor is attached.
However, in practice it is very difficult to perfectly align the axis of the sensor with the axis of the body segment, for the following main reasons:
First, the sensor is attached to the curved body surface so it could be difficult to find a place where the two coordinates frames are aligned.
Second, the placement of the sensor has to avoid the main active skeletal muscle groups which further limits the possible placement area.
Finally, the well-known sensor placement may not be feasible in some particular tests. For example, the sensor on waist is usually placed on the center of back close to L5. However, in Stand-to-Sit Test, the sensor on the back may cause pain for the subject or altered movement to avoid hitting the sensor on the back of chair.
Therefore, the alignment of coordinates frames of IMUs is needed for better measurement accuracy and reliability.
The alignment between sensor and body segment has been named in different ways across the state of the arts: sensor to segment calibration [
10]; anatomical calibration [
11,
12]; system calibration [
2]; and also functional calibration [
13]. In this paper we use the term anatomical calibration. The anatomical calibration could be classified into the following categories: (1) Direct anatomical landmark identification (ALI); (2) Imposition of joint constraints (JCI); (3) Multibody modelling (MBM); (4) Functional approach (FUA).
ALI performed anatomical calibration by using extra devices such as an IMU embedded caliper [
12] or a camera-mounted L-shaped stick [
14]. The device was rotated around each axis of anatomical frame with its ends pointing to anatomical landmarks. This method did not rely on posture assumptions and the IMUs were calibrated to be aligned with the real anatomical axis of the segment. However, ALI required not only special devices but also longer setup time and more professional staff to perform the calibration. ALI is performed one by one for all the body segments involved. For each body segment, the staff needs to point both ends of the caliper on anatomical landmarks and rotate the caliper around different axes of the segment.
JCI utilized the limited Degree of Freedom (DoF) for joints such as the knee and elbow, to realize the anatomical calibration from arbitrary motions [
15]. A complete review of researches applying joint constraints could be found in [
9]. However, the usage of JCI was limited to the low DoFs joints (DoF < 3). Furthermore, two sensors on the links connected by the joint were needed so it was not suitable to calibrate only one sensor.
MBM modeled the body as multiple rigid segments which were linked together with rotational joints in a chain [
16]. IMUs were firmly attached to each segment with known distances to both ends of the segment. An Extended Kalman Filter (EKF) or optimization then estimated the orientation between the IMUs and the body segments [
17]. MBM could realize anatomical calibration from predefined motions [
2] or arbitrary motions [
17]. However, the orientation estimation through EKF and the involvement of a magnetometer may lead to errors in calibration. Besides, the requirement for all segment lengths and IMUs’ relative positions on the segments increased the measurement items during the experiment, thus could result in longer setup time. Moreover, the MBM was not applicable when IMUs were attached to only part of the segments in a kinematic chain.
Finally, FUA required the experiment participants to actively or passively perform predefined posture or movement such as flexion/extension, abduction/adduction and circumduction, and determined the rotation matrix between the coordinates frames of the sensor and the body segment through the gravity component of acceleration and the angular velocity along the anatomical axis. Besides, FUA could also be performed with the static sitting, inclined and lying postures [
18]. FUA was extensively used in the research requiring the estimation of joint angle for the lower limbs [
13,
19,
20] as well as the upper limbs [
10,
21,
22]. Although FUA was the most popular technique for anatomical calibration, its accuracy was significantly limited to the accuracy of the predefined motion performed by the subject.
All the anatomical calibration methods except JCI required performing extra predefined movements or measurements during the experiment. Therefore, once an experiment was done without anatomical calibration, the researchers could not retrieve the alignment through post-processing on the experimental data. Although JCI did not need special measurement during the experiment, its usage was limited to joints with DoFs less than 3.
So, how can we retrieve anatomical calibration through post-processing even if this calibration was not explicitly included in the experiment protocol? Inspired by FUA, it would be possible if utilizing the motion constraints, such as the limited range of movement outside sagittal plane in walking test and sit-to-stance (StS) test. Fortunately, these tests were popularly included in various test batteries, for example Tinetti test [
23], Senior fitness test (SFT) [
24], and Short Physical Performance Battery (SPPB) [
25]. The problem, however, was that the alignment retrieved from normal motion tests was the alignment between the IMU sensors and the whole body, instead of the body segments. This difference would affect mainly the lower limbs, for example if the person walked toe-in or toe-out. However, aligning the sensor coordinates frames to the whole body instead of specific body segments could be beneficial when motion projection on anterior-posterior (AP) and medial-lateral (ML) directions were needed.
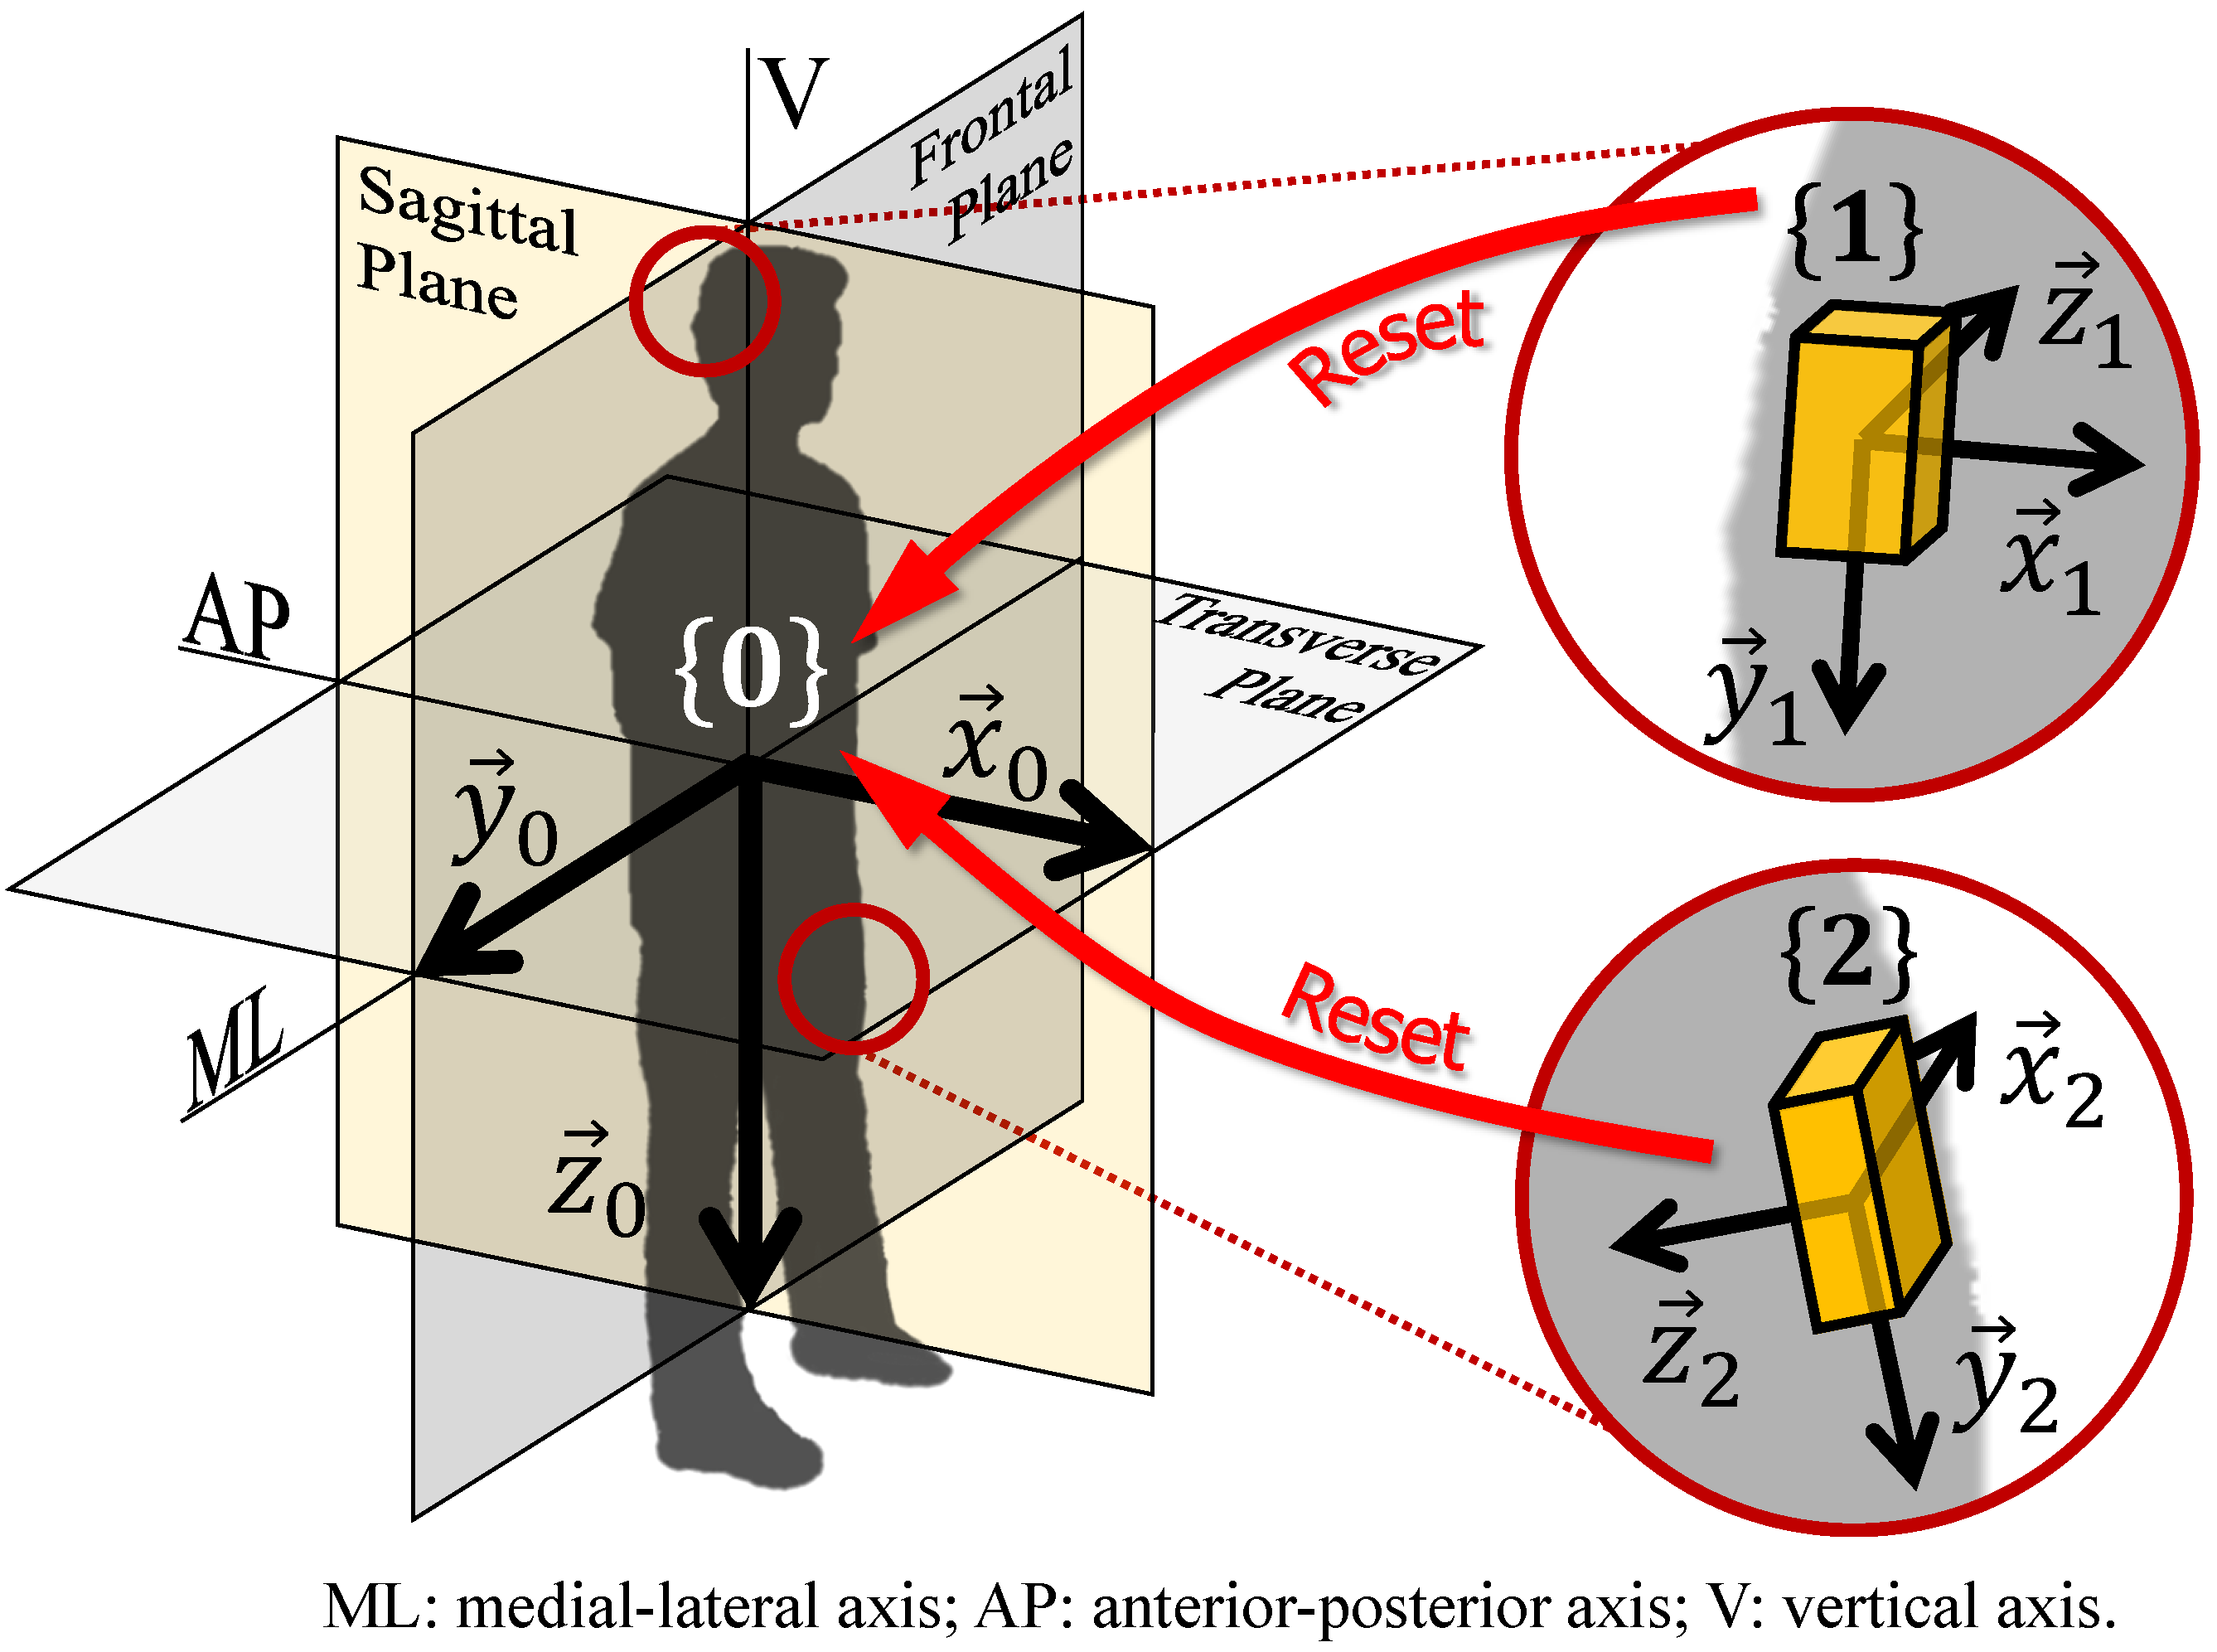
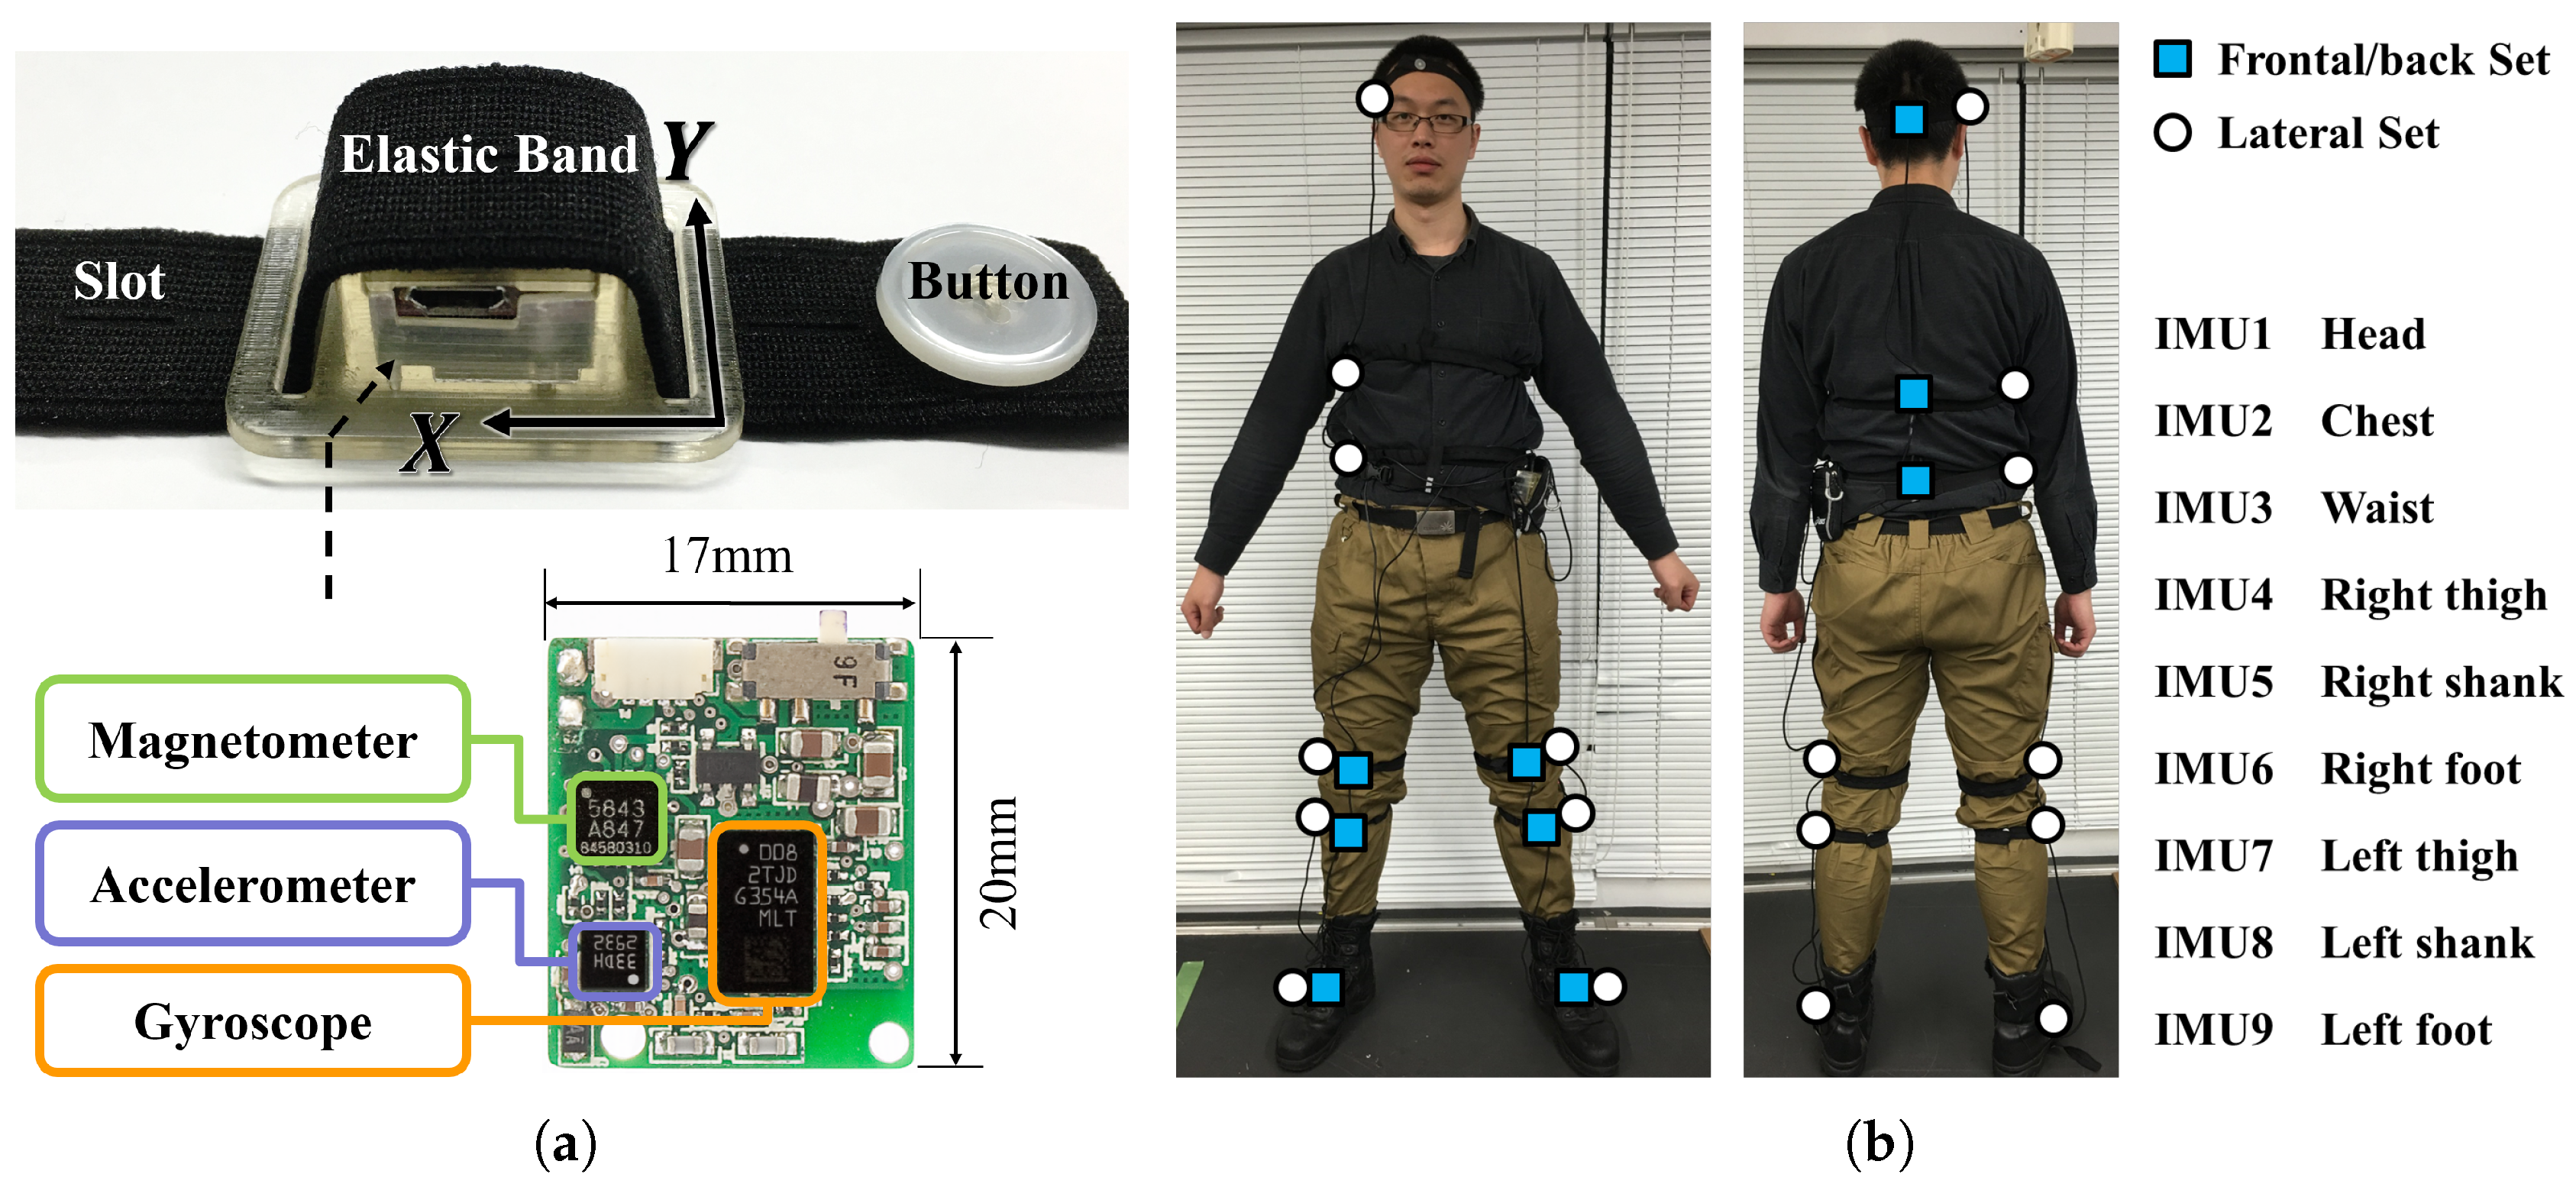
In this paper, the authors propose an anatomical calibration method to align the axis of the sensor coordinates frame to the axis of the “whole body” coordinates frame (
Figure 1), through post-processing the data taken from quiet stance and standard motion tests whose motion is mainly on sagittal plane and has large range of movement such as walking and StS.
Furthermore, experiments are conducted to examine the feasibility of proposed method. We want to verify that proposed algorithm is robust to different sensor positions and motion types, and that after several repetitions the reset coordinates frame will approach to a stable frame which aligns with the plane of the motion. More specifically, the objectives of the experiment are:
- Objective 1
Check the alignment between coordinates frames of multiple sensors attached to frontal/back and lateral side on the same body segment;
- Objective 2
Check the alignment between coordinates frames of different sensors on different body segments when these segments move together as a rigid body;
- Objective 3
Verify if the reset coordinates frame will approach to a stable frame after several repetitions (Gradualness);
- Objective 4
Verify if the coordinates frames extracted from different repetitions are similar (Test-retest reliability);
- Objective 5
Check the alignment between coordinates frames estimated from different types of anatomical calibration test, where special emphasis was put on the comparison between the alignment matrix estimated from standard motion tests and from the movement in traditional anatomical calibration.
3. Results
3.1. Objective 1
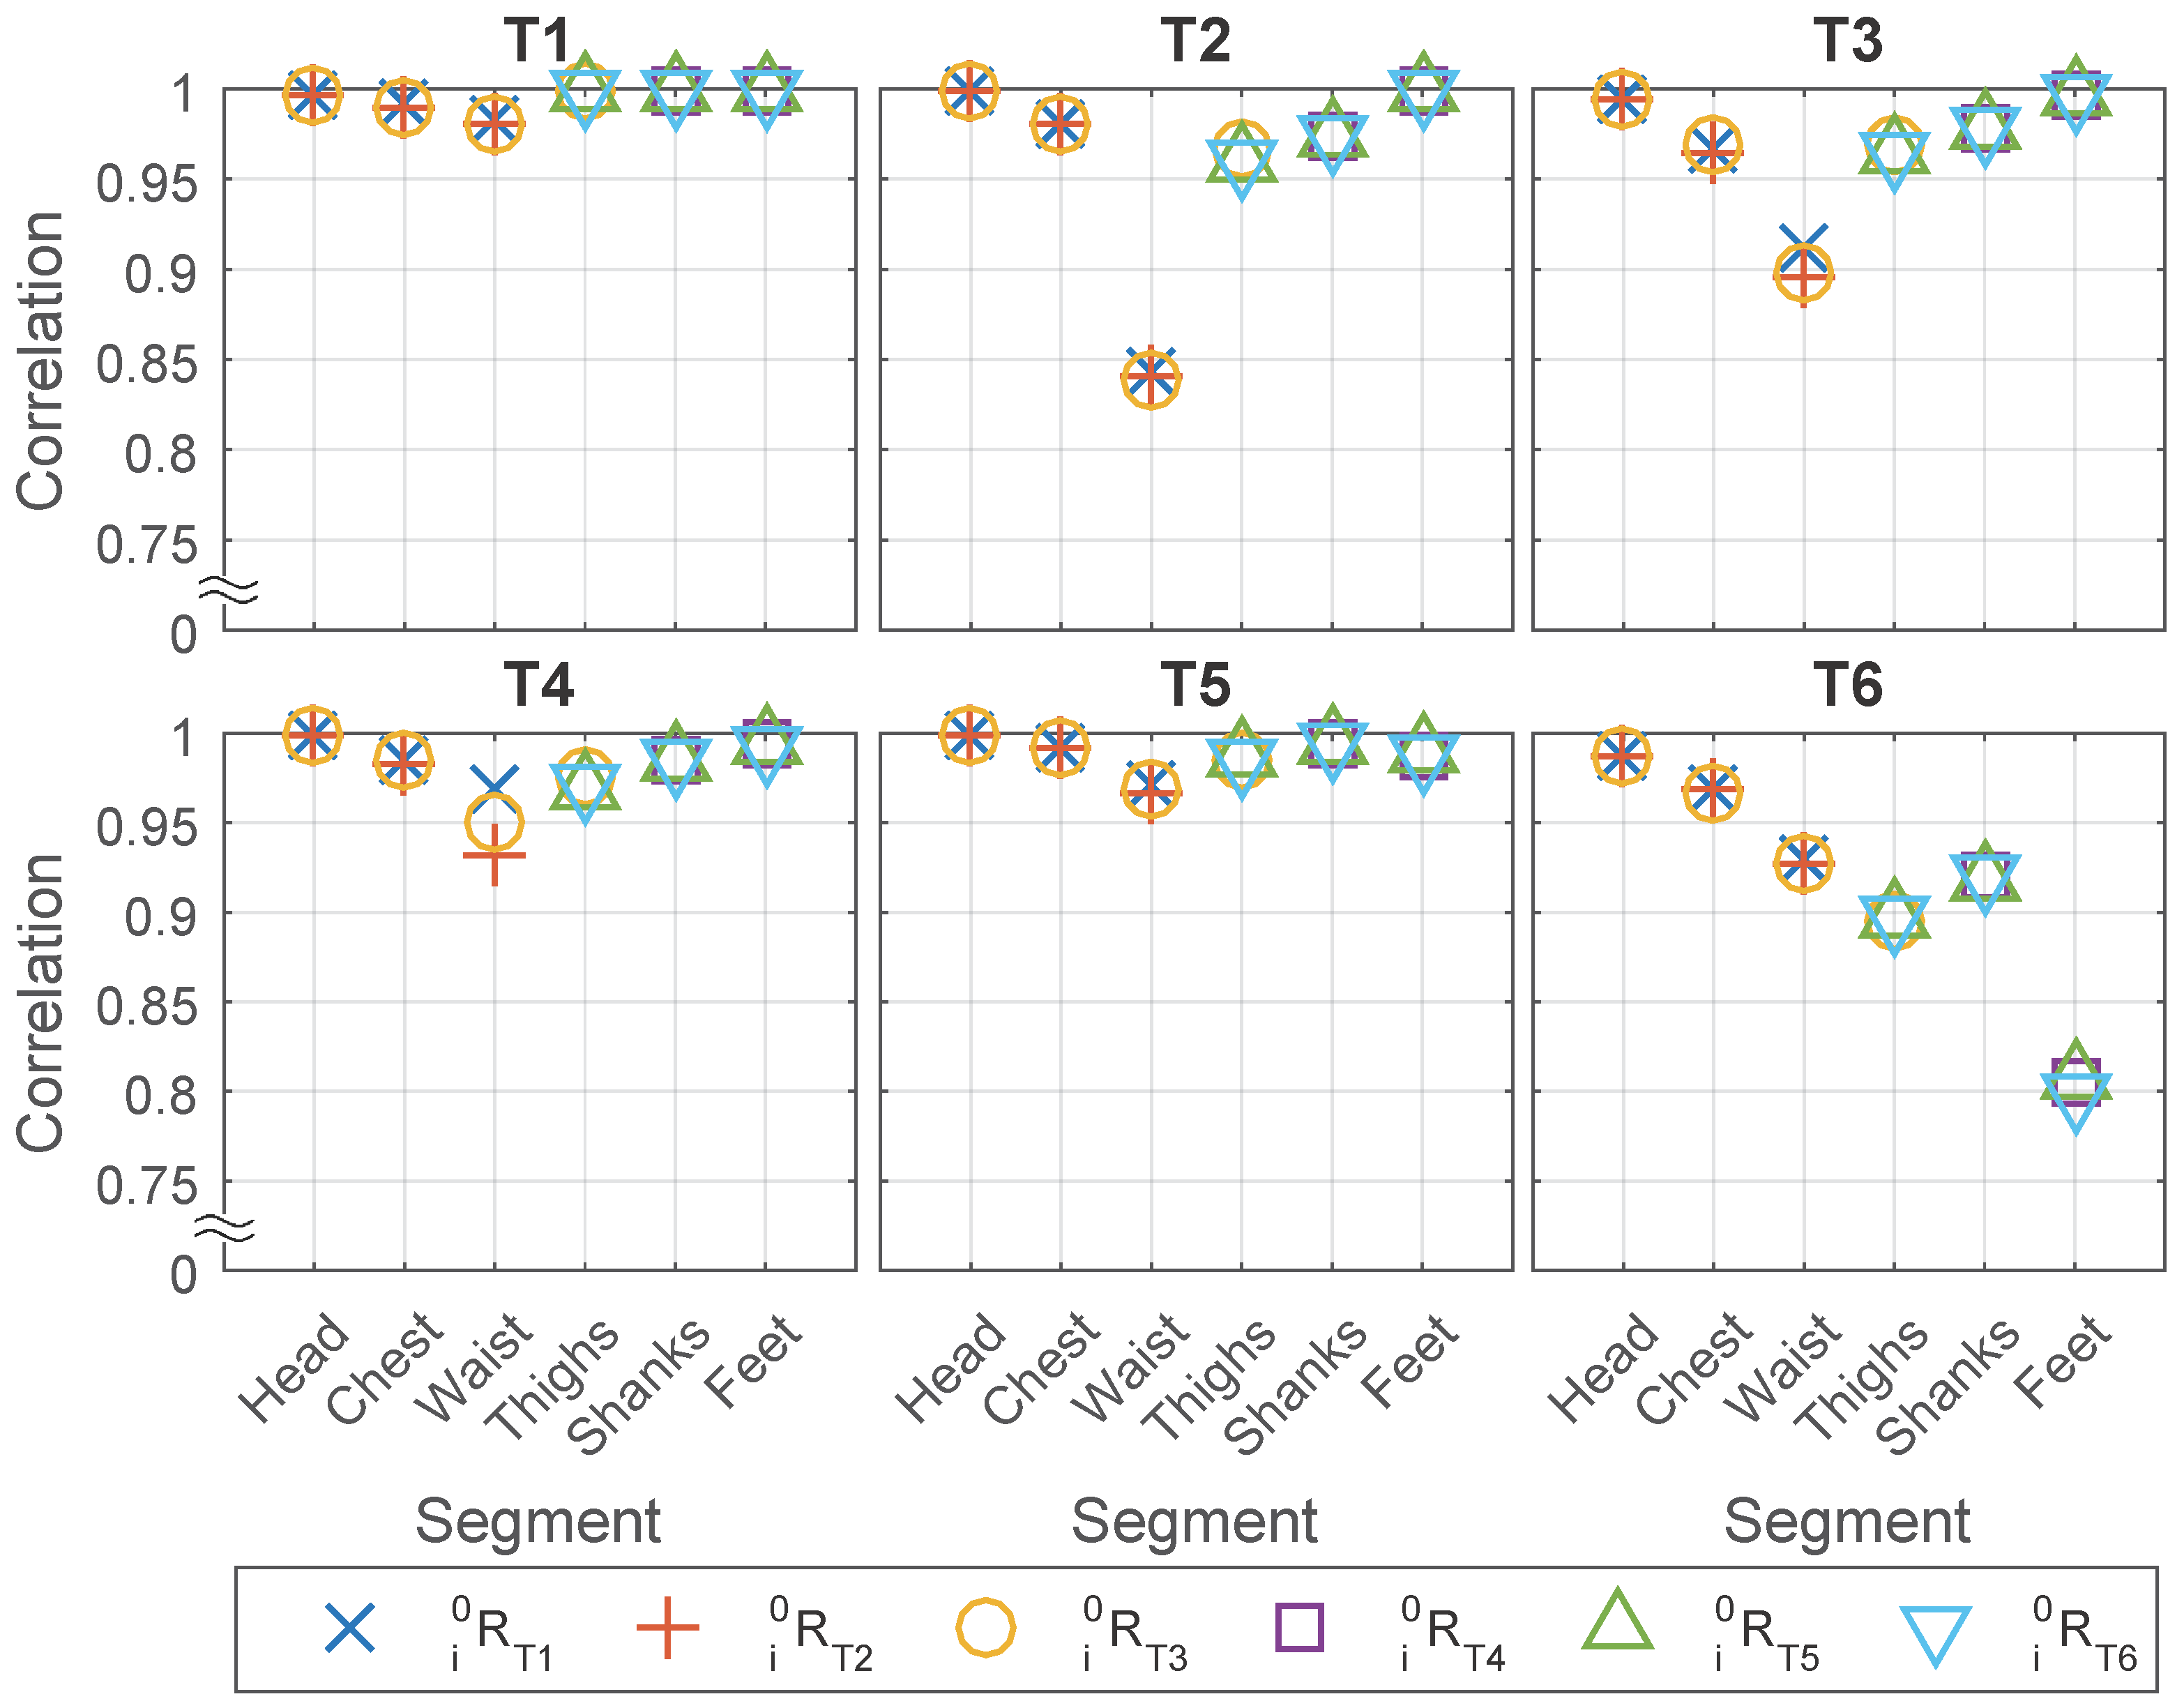
For Objective 1: Check the alignment between coordinates frames of multiple sensors attached to frontal/back and lateral side on the same body segment, acceleration data from two IMUs on each body segment, one from the Frontal/back Set and another from the Lateral Set, are compared and the correlation between the two IMUs is calculated.
The following three factors are thought to be related to the correlation and averaged RMS difference:
,
, and the body segments where the sensors are attached to.
Figure 6 shows the relationship between these three factors with the correlation.
In general, the results show that under most circumstances, the correlation is high (over 0.95) between the two sensors placed on the frontal and lateral sides of the same body segment. In some of the cases, however, the correlation is relative lower (less than or equal to 0.95) and the minimum is at around 0.8, see
Figure 6.
More specifically, we find that the correlation and averaged RMS difference are not related with but highly related with and body segment, which suggested that first the results will be similar regardless of which type of motion is used for anatomical calibration, and second the motion of some body segments in some of the tests are not the same on the frontal and lateral side.
For the first point, we found that even if the matrices are generated from the test where two IMUs had lower correlation for example feet in T6, the result in
Figure 6 is similar with the matrices generated from other tests such as T4 and T5. Since the
is not related to the correlation, it is averaged to compress
Figure 6 to
Table 3.
For the second point, ideally we suppose the body segments to be rigid bodies so that the motion on different sides will be the same. However, in reality the body segments are not ideal rigid bodies therefore the motion on the lateral and frontal sides suffered to different extents from the soft tissue artifact such as the fat under the sensor on lateral waist or the muscle under the sensor on frontal thighs, and/or the bending of body segment such as foot in walking test (T6). The head, which is the most rigid body segment in our experiment, achieves that highest correlation (all over 0.995, except 0.986 in T6). While the correlation is relatively lower for segments prone to soft tissue artifacts for example the waist, or during the tests having fast movement for example sit-to-stand (T3) and walking (T6). The waist in T2, T3, T4 is affected by the artifact of soft tissue underneath the lateral sensor when sitting on/onto a chair, and the lower limbs in T6 are affected by soft tissue artifacts because of muscle contraction under the sensors.
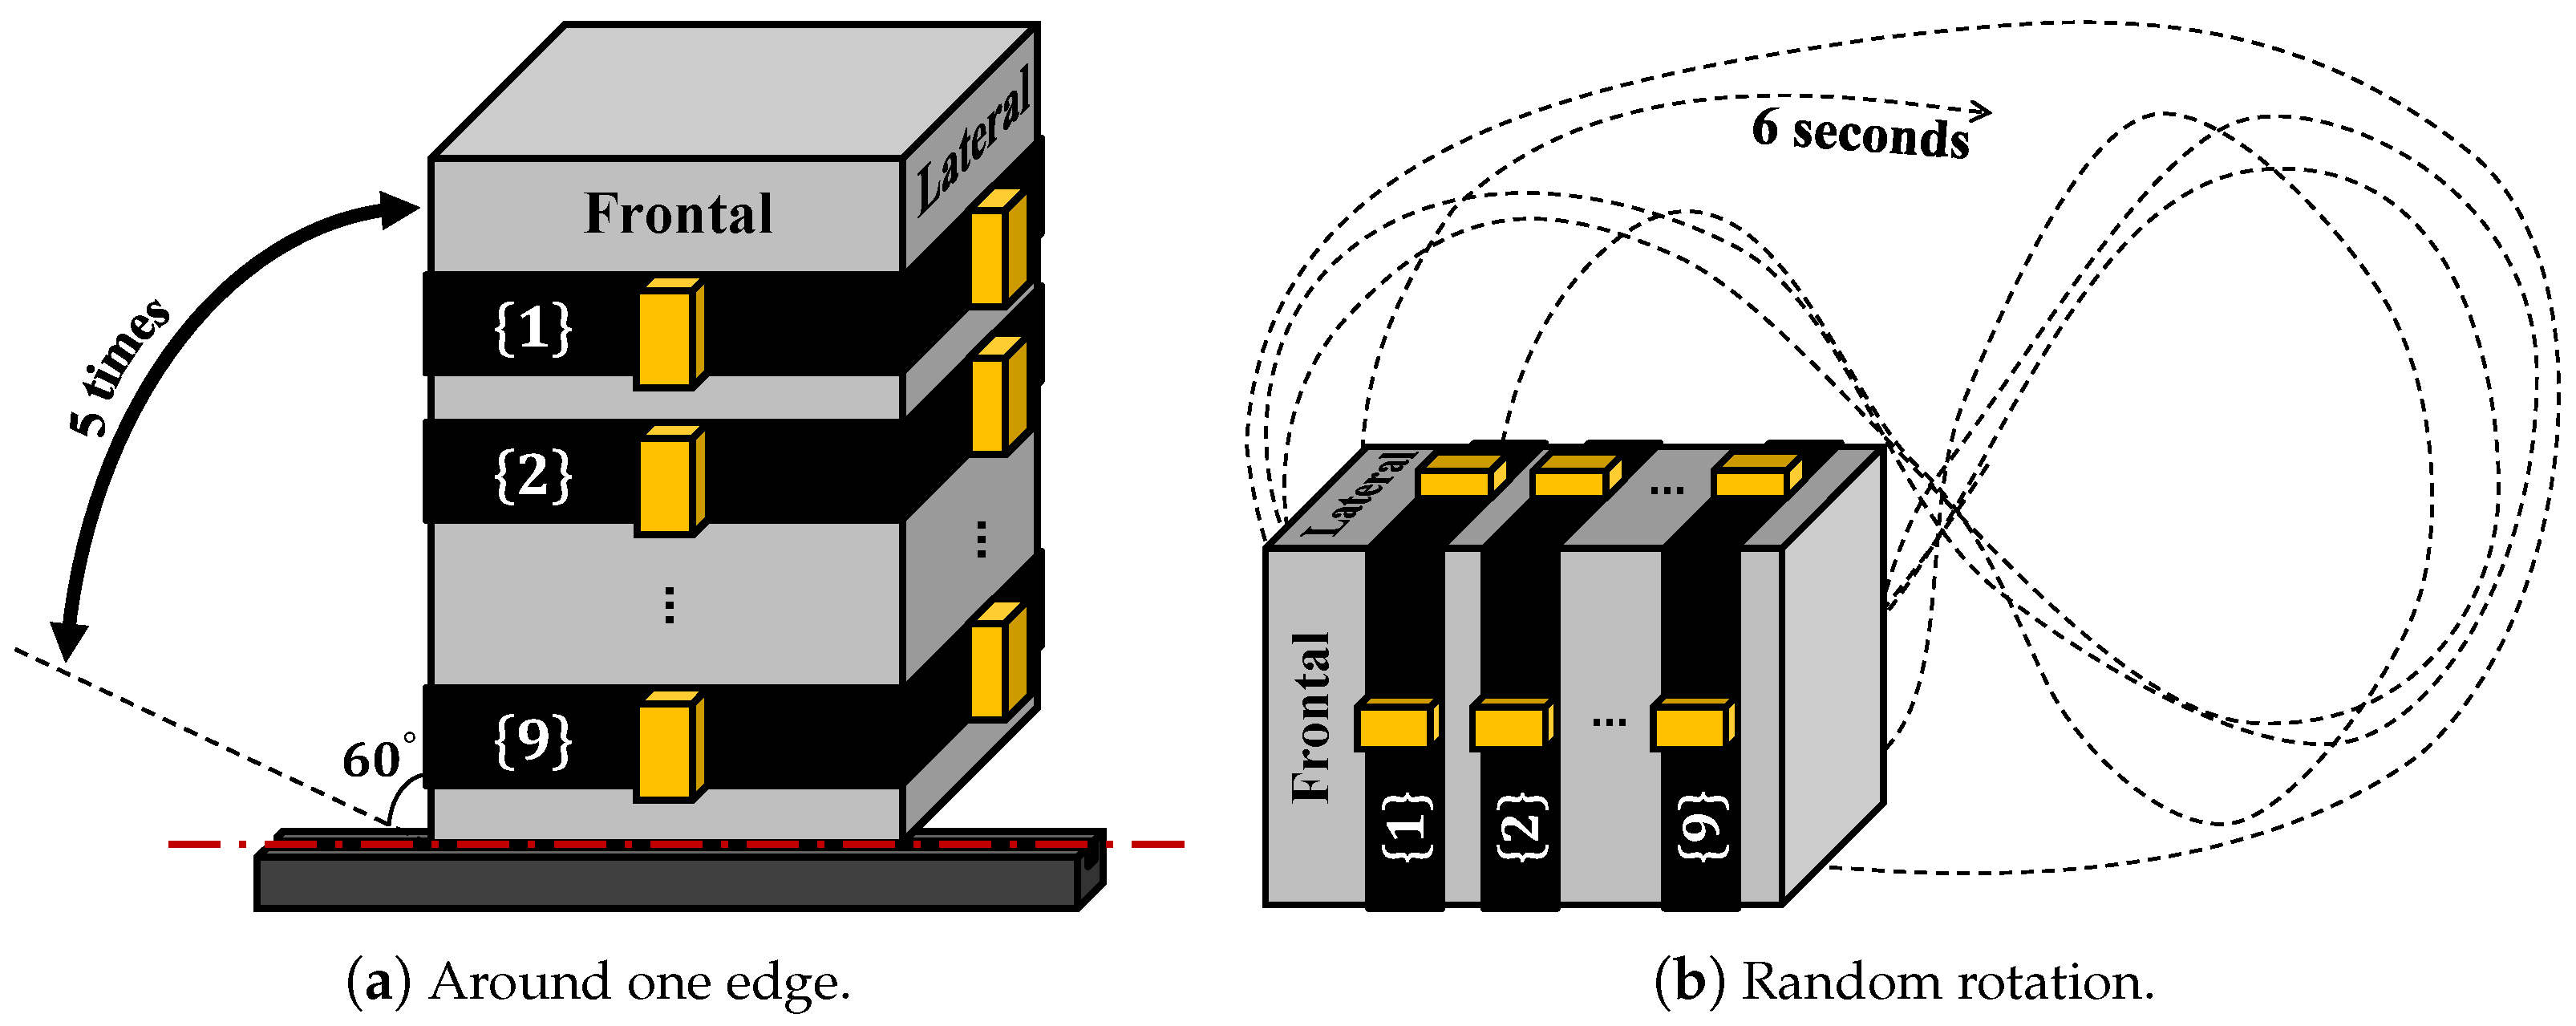
To examine how much correlation can be with a rigid body, the same sets of sensors were placed onto the frontal and lateral sides of an aluminum box and two types of tests (rotate around one edge,
Figure 7a; rotate randomly,
Figure 7b) were conducted with 5 repetitions. The five repetitions of rotation around one axis were then used for generating the anatomical calibration matrix and applied on rotation around one axis test and random rotation test, repeating the same data processing used for human subjects. The results (
Table 4) show high correlation between the frontal lateral sensor pairs, especially when rotation around one axis (correlation larger or equal to 0.998). The lower acceleration correlation (around 0.97) in the random rotation is due to centrifugal acceleration, because the distances from the two IMUs to the rotation axis are neither constant nor equal. This can be seen from the high correlation on angular velocity in
Table 5.
3.2. Objective 2
For Objective 2: Check the alignment between coordinates frames of different sensors on different body segments when these segments moves together as a rigid body, the purpose through this objective is to confirm that after the anatomical calibration, the coordinates frames of different body segments are closely aligned. In order to verify that, we asked the experiment participants to move their upper body in T1 and T2 and their lower limbs in T4 and T5 as much as they could as one rigid body, to obtain the similar movement among the body segments. Suppose the coordinates frames of different segments are aligned, the projection of the movement to these frames should be highly correlated.
However, the accuracy and reliability of this verification are limited to two factors: first, the relative movement between segments because the participants fail to keep multiple segments as one rigid body; second, the difference of centrifugal acceleration because the distances from different sensors to the rotation axis are not equal.
To minimize the impact of these two factors on the verification of our objective, we exclude waist and feet from the analysis and focused on the correlation between the head and chest, and between the thighs and shanks. Also, T4 is removed from the analysis of Objective 2 because it involves only the comparison between shanks and feet. The first reason to exclude waist and feet is because we find that participants are particularly difficult to move the waist and feet with the rest part of upper body and lower limbs, respectively, together as one rigid body. The waist is easily deformed in T1 and T2 when bowing forward, while the feet tends to rotate with respect to the shank in order to avoid the feet from hitting the ground when swinging shanks or legs in T4 and T5. The second reason to exclude waist and feet is to minimize the difference of centrifugal acceleration. The waist is much closer to the rotation axis when bowing forward compared with the head and chest, and the feet are much farther to rotation axes when swinging the shanks (T4) or swinging the legs (T5) compared with the sensors placed on thighs and shanks, between which the distance are only about 15 cm as shown in
Figure 4b.
Similar to Objective 1, we calculate the correlation and check the impact of
,
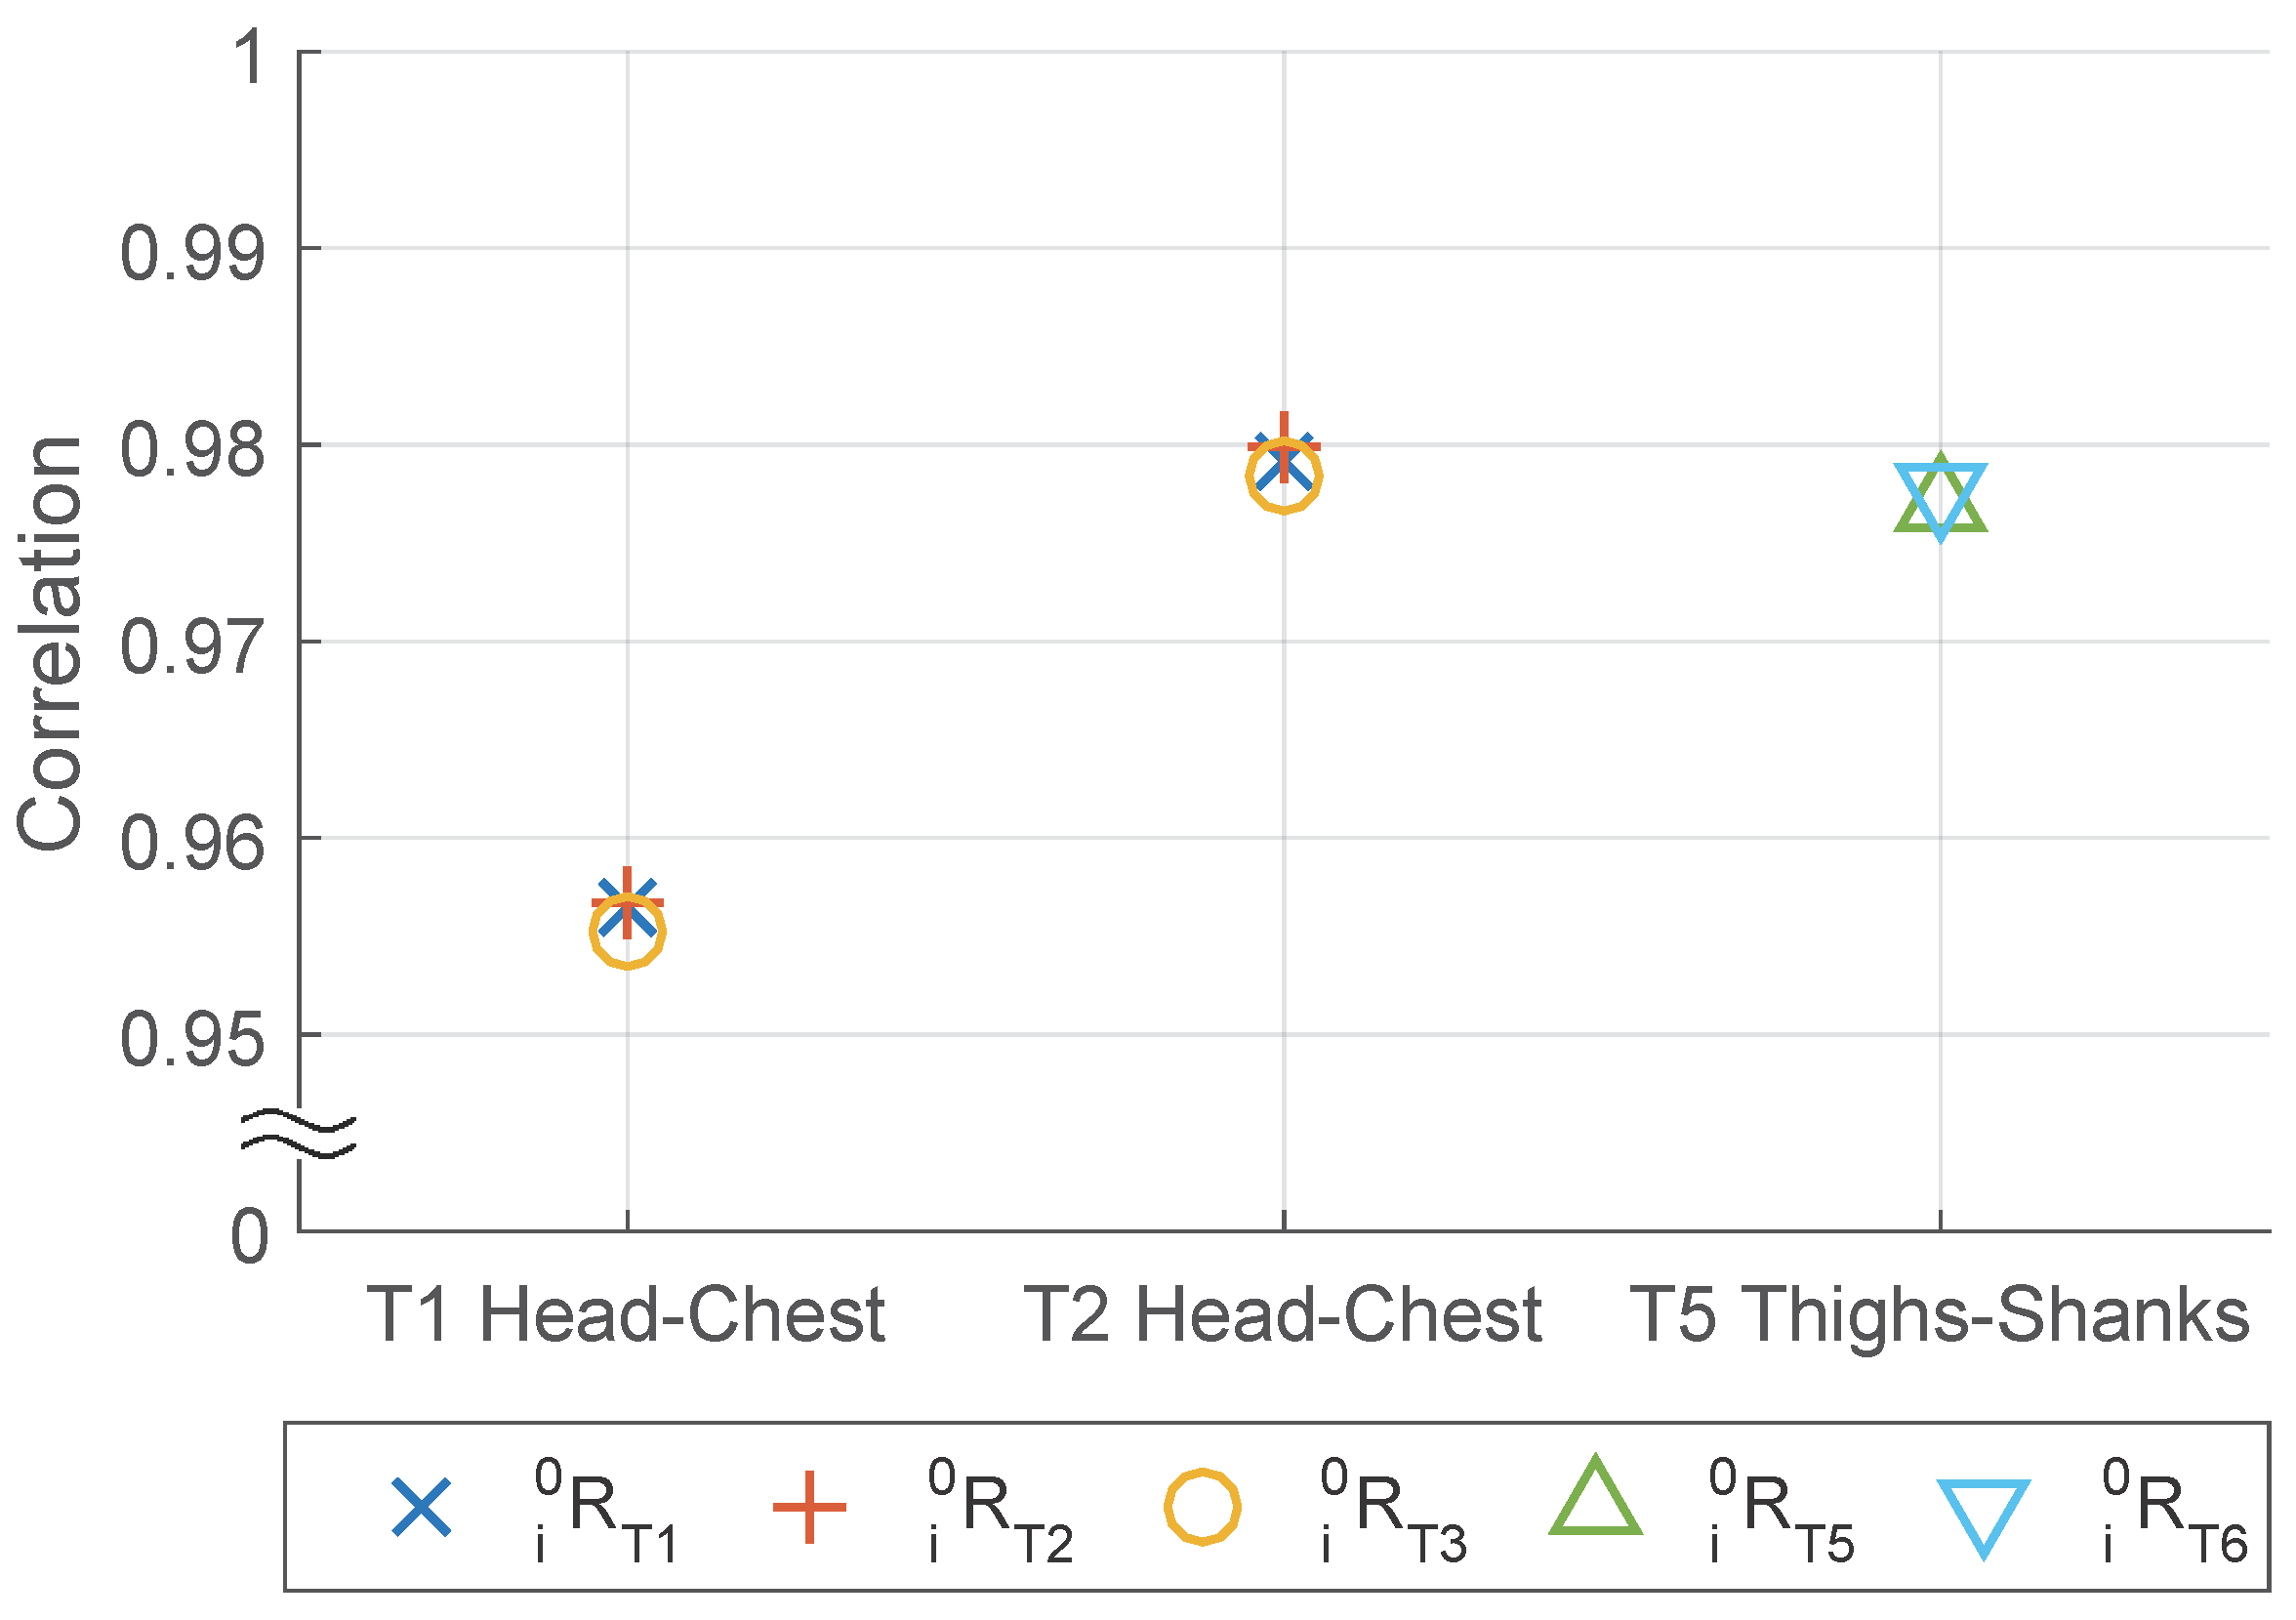
and body segments pairs on it, while the difference is in Objective 2 we check the pairs of sensors placed on different body segments from the same IMU set instead of on the same body segment from different sensor sets. From the result shown in
Figure 8 and
Table 6, we find the similar conclusion in Objective 1: correlation is related strongly with
and body segment but not with
.
Furthermore, concerning the frontal or lateral placement of the sensor, a paired
t-test is performed in
Table 7. The results suggest that the two sets have similar performance on correlation. Although for head-chest body segment pair the Lateral Set is significantly better than the Frontal/back Set in the paired
t-test, the difference in averaged correlation value is marginal.
3.3. Objective 3
For Objective 3: Verify if the reset coordinates frame will approach to a stable frame after several repetitions (Gradualness), the result can suggest how many times of repetitions are needed for different body segments and different to obtain a higher precision.
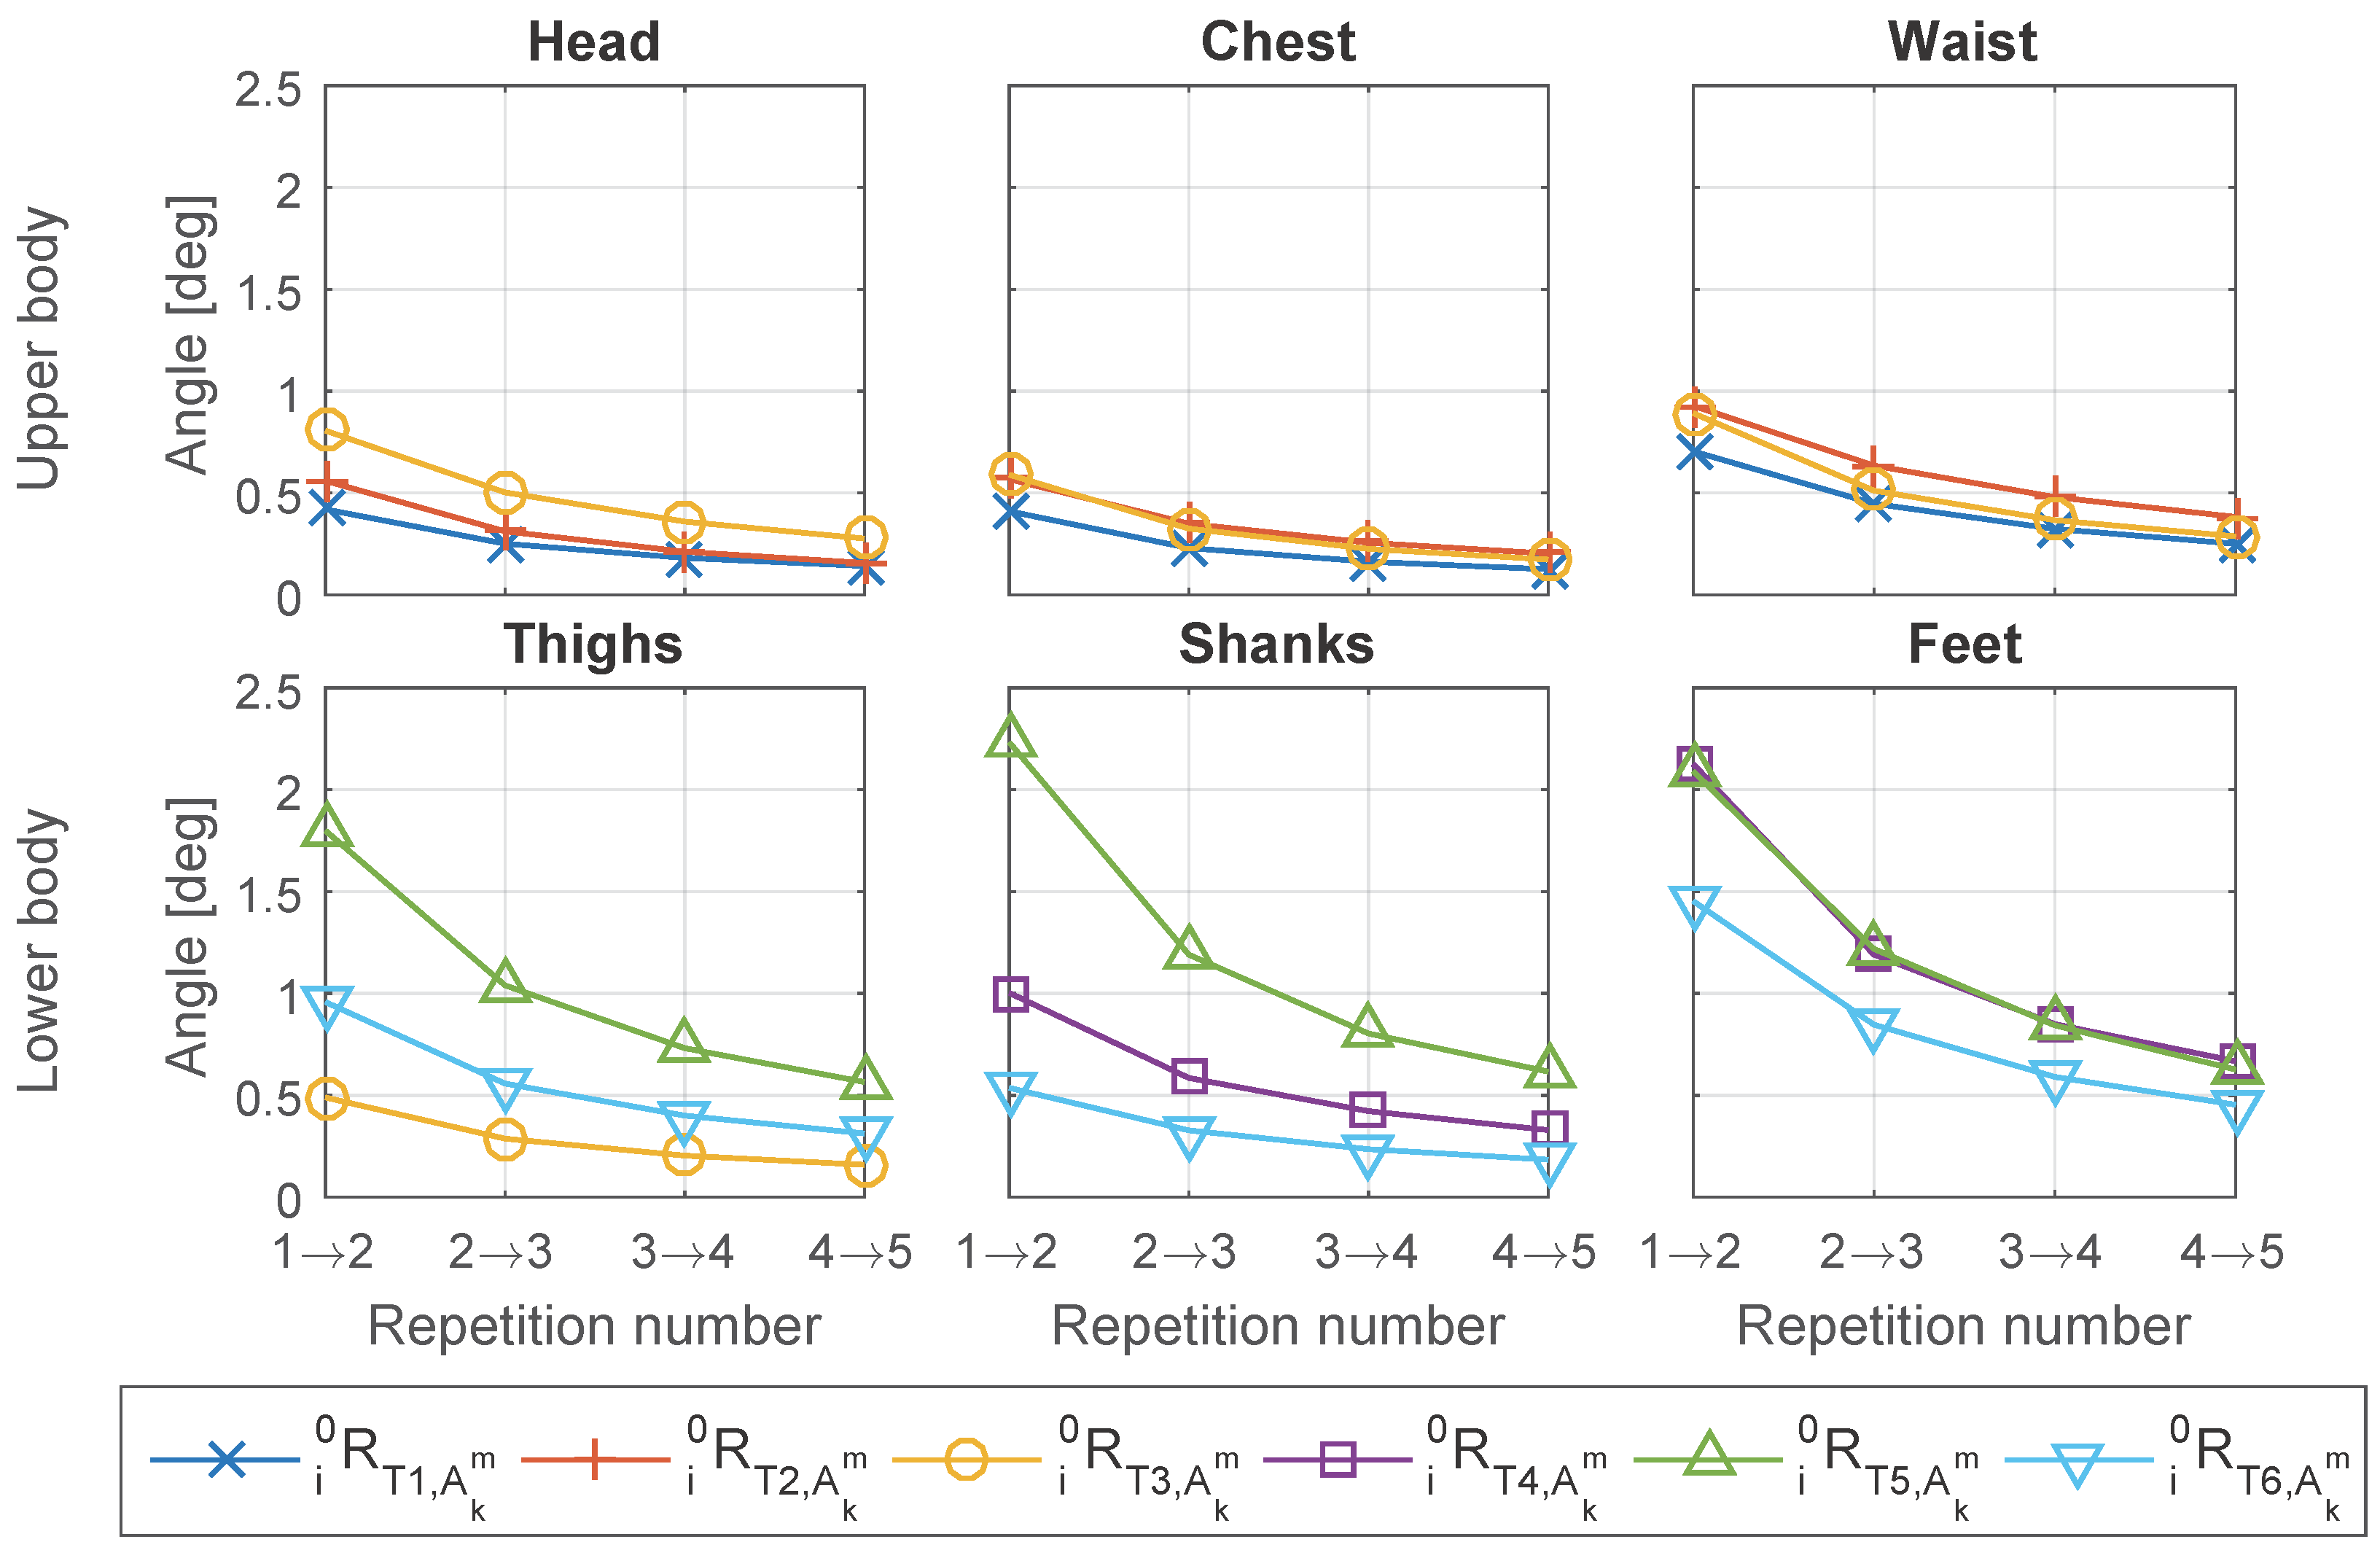
The “incremental” comparison shown in
Figure 9 suggests that the rotation matrix
is gradually converging to zero, and the change in
decreases as increase of the number of repetitions. Besides, the change caused by adding repetitions is small. The maximum of averaged error angle is less than 2.5° for all the
and body segments, and after including three repetitions the change caused by adding one more repetition in
is less than one degree.
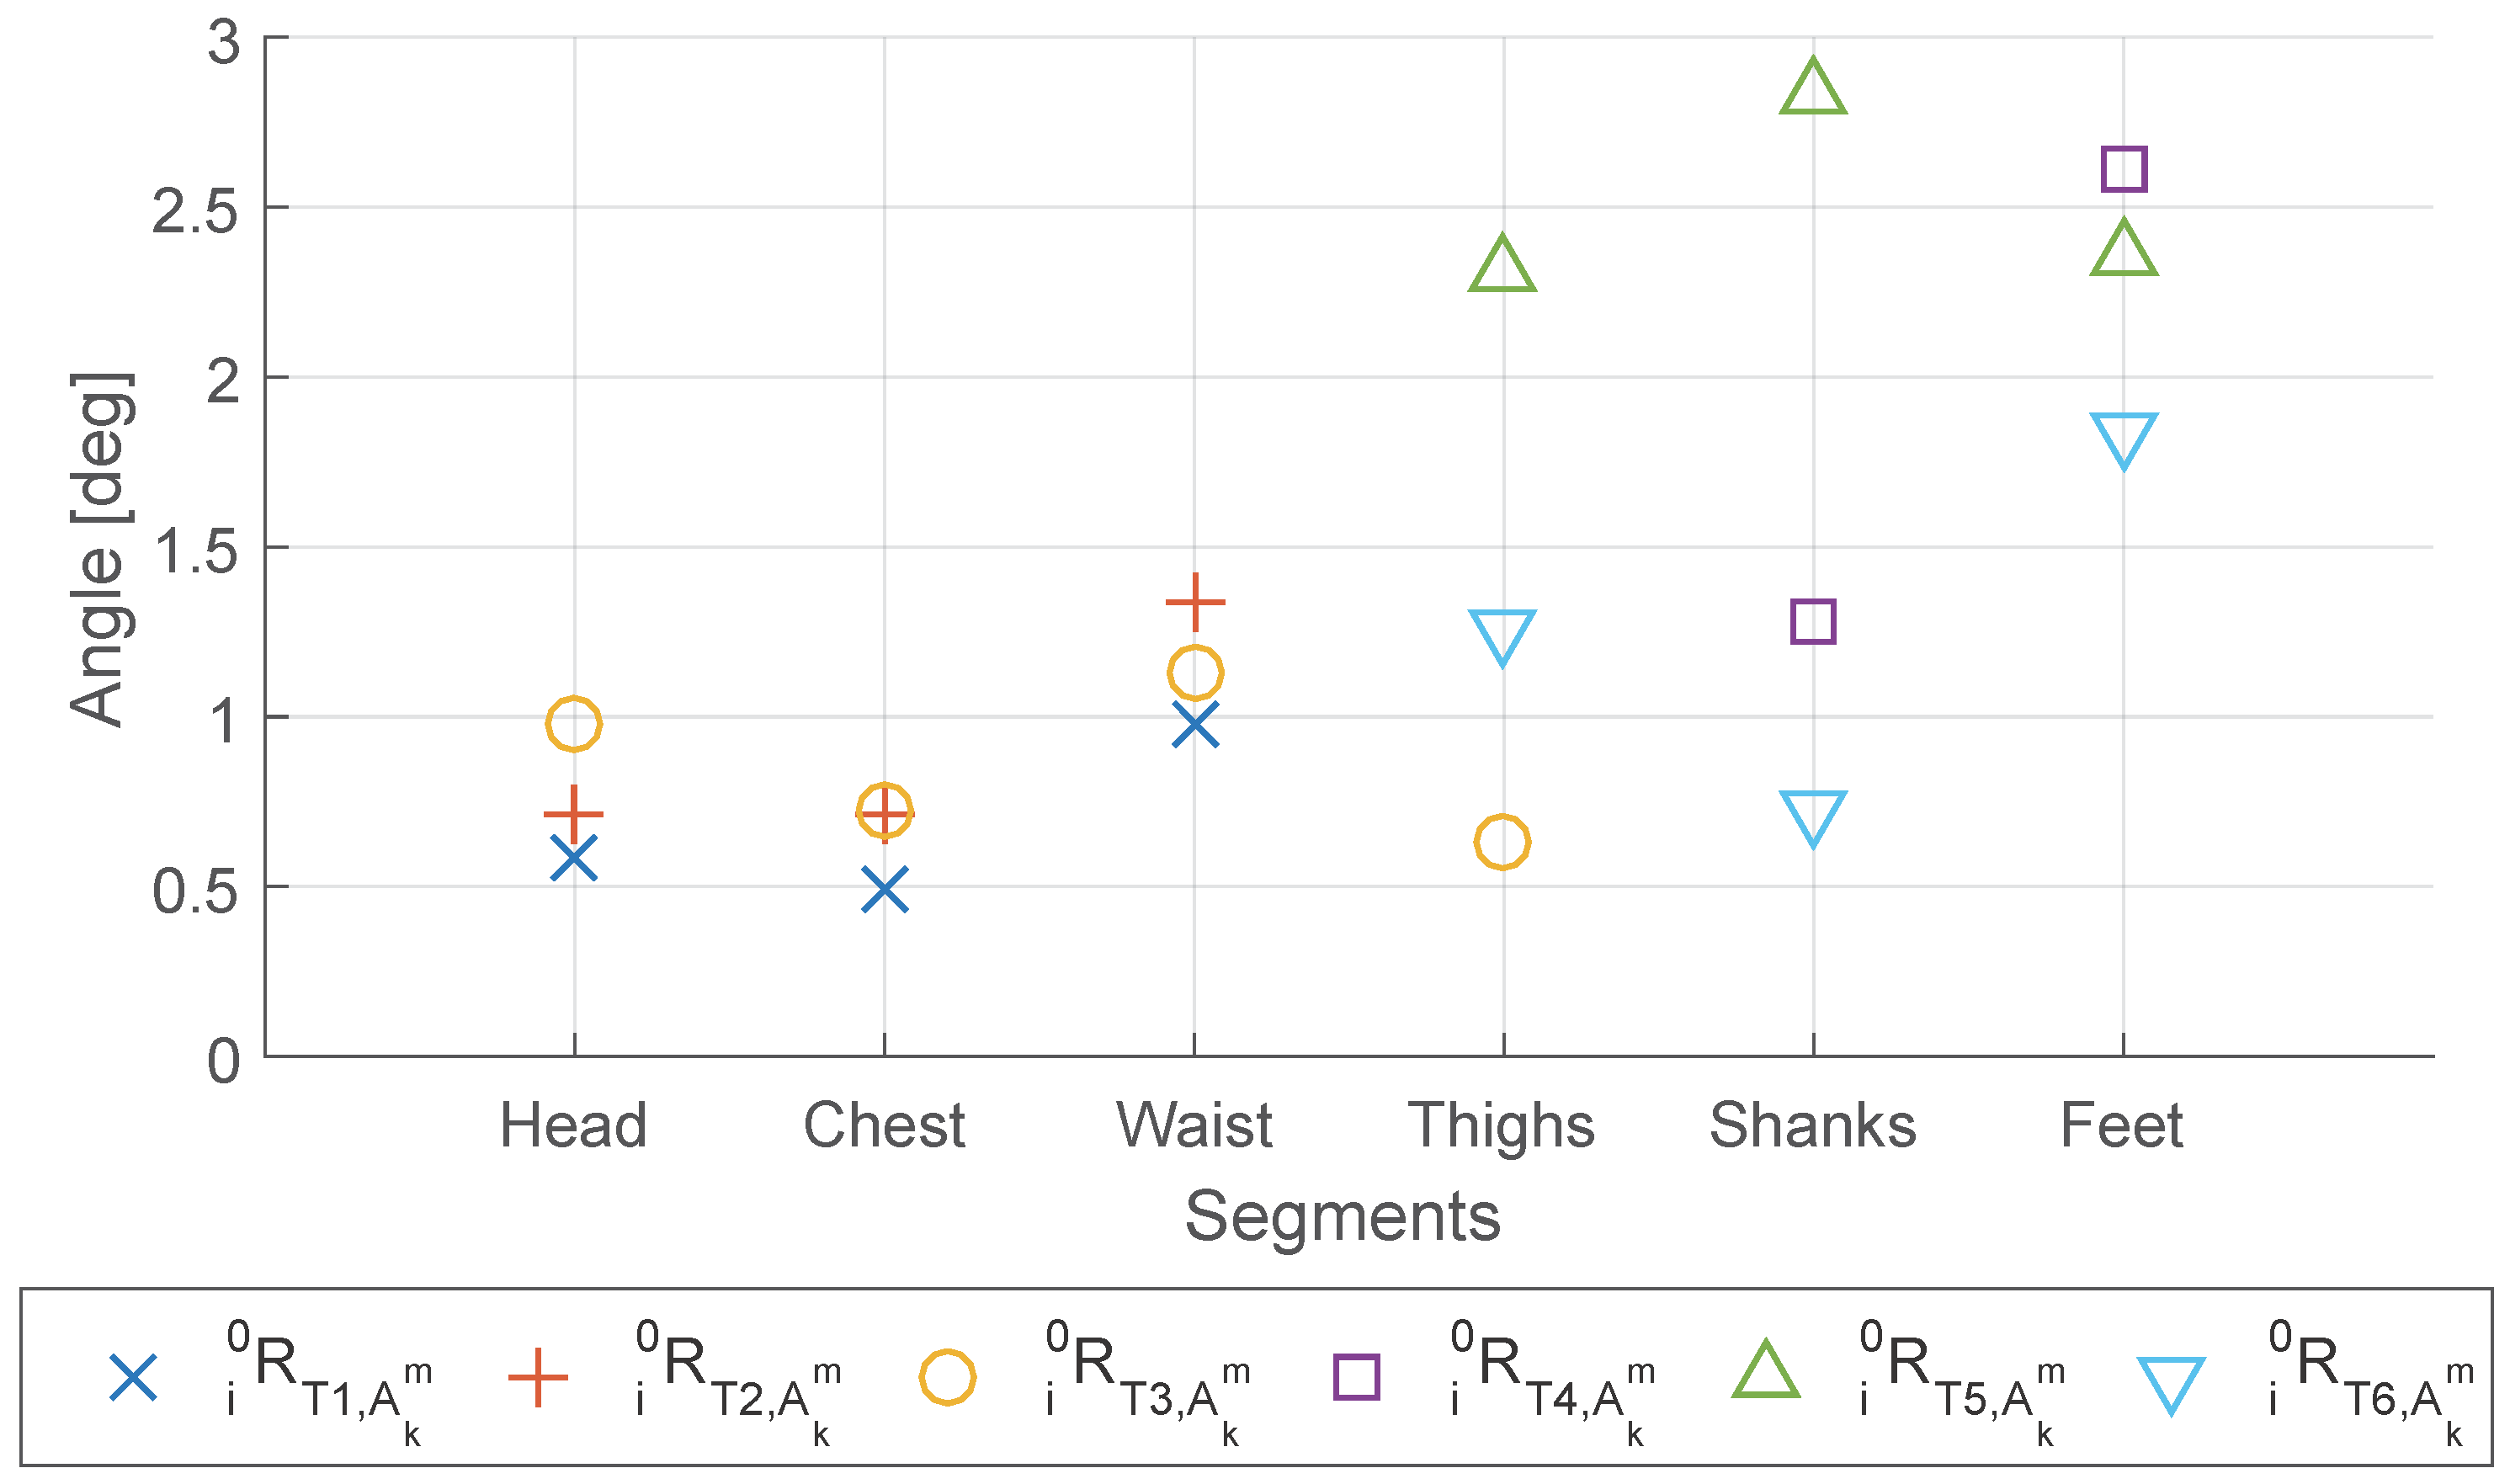
Through the “To last” comparison shown in
Figure 10, we find that the lower limbs (thighs, shanks and feet) showed relatively larger change compared with the upper body, although the maximum change for all segments is still less than 3 degrees. The larger change can be caused by larger variance between different repetitions due to the lower motion repeatability, or by the larger error in matrix estimation from each repetition due to the more divergent distribution of acceleration data. The waist and feet have the highest change within the upper body and the lower limbs, respectively.
Besides, from
Figure 10 we notice that the variance between different
is relatively large compared with their mean, especially for the lower limbs. Interestingly, we find that for all the segments in lower limbs, T6 (7 m walking) has much smaller change compared with T5 (standing and swing legs), when increasing the number of repetitions from 1 to 5. Although compared with T5 the acceleration data distribution of T6 is more divergent and apart from being on one plane for a single repetition, T6 has much less variance between different repetitions and therefore has less change when adding one more repetition.
Concerning the frontal or lateral IMU placement on the same body segment, paired
t-test is conducted between the Frontal/back Set and Lateral Set for the
generated from different number of repetitions and different combinations of repetitions. The result of paired
t-test is shown in
Table 8. The results showed that the Frontal/back Set is better for the upper body, having higher correlation, while the Lateral Set is better for the lower limbs. The reason could be for the upper body the sensors placed on the lateral side of the body are more vulnerable to the soft tissue artifact as the Frontal/back Set is placed close to the bone, and for the lower body the sensors on the lateral side of the body suffered less by the muscle activation because for the motion mainly in the sagittal plane the frontal muscle groups are activated and affected the measurement of the sensor placed on the frontal side of the leg. The exceptions, however, are the thighs calibrated in T3 (chair standing), for which the Frontal/back Set is significantly better (
p value less than 0.001) than the Lateral Set. The reason is that the lateral side of the thighs deform when sitting onto the chair, therefore in this specific case the sensor on the frontal side of the thigh performs better than on the lateral side.
3.4. Objective 4
For Objective 4: Verify if the coordinates frames extracted from different repetitions are similar (Test-retest reliability), calculated from different subsets of three repetitions are compared. The comparison is quantified with angle in axis-angle representation.
The results are summarized in
Table 9, by averaging among the different subsets and IMU sets. From the result, we find that the T5 and the feet had averaged difference larger than 1 degree, which means that they are less reliable therefore more repetitions will be needed in order to improve the reliability. This result agrees with the one we obtained in Objective 3 where T5 and the feet have relatively larger error angle in
Figure 10.
Concerning the IMU placement on different side of the same body segment, the result from Objective 4 is the same as Objective 3. The Frontal/back Set is more reliable for the upper body, while the Lateral Set is more reliable for the lower body except the thighs in T3, see
Table 10.
3.5. Objective 5
For Objective 5: Check the alignment between coordinates frames estimated from different types of anatomical calibration test, where special emphasis was put on the comparison between the alignment matrix estimated from standard motion tests and from the movement in traditional anatomical calibration, rotation matrices generated by different types of tests for the same IMU sensor are compared with each other.
From
Table 11, we find that in general the error angles between
estimated from different
are higher than the ones we obtained in Objective 3 and Objective 4. The reason is because the predominant motion plane differ slightly for different tests. For example, the change of distance and angle between the two feet in sit-to-stance test (T3) would affect the predominant motion planes of both thighs. Therefore, the estimation of sagittal planes would be affected and lead to error compared with T4 and T5.
For the upper body, especially for the head and chest, the difference between the generated from different tests are small. The waist shows slightly larger difference between T1 and T2 or T3, which is because T2 and T3 includes sitting while T1 is standing.
For the lower limbs, we find that the thighs bore large difference (over 10 degrees) between T3 and T5 or T6, while the difference between T5 and T6 is relatively low (less than 5 degrees). The shanks have better results, having all the differences lower than 5 degrees except between T5 and T6. The feet, however, has the differences are ranging from 8 to 10 degrees for all the test pairs (T4-T5, T4-T6, T5-T6), which means the feet are sensitive to the thus anatomical calibration for feet is less reliable.
Finally, the alignment matrices estimated from standard motion tests (T3 and T6) is compared with the ones obtained from movement specially designed for anatomical calibration (T1, T2, T4, T5). For upper body (head, chest, waist), T3 can be competitive with T1 and T2, with the averaged error angle in maximum 5.39 degree. For thighs and shanks, T6 can be competitive with T4 and T5, with the averaged error angle in maximum lower than 5.12 degree. However, it seems to be not desirable to use T3 for thighs’ anatomical calibration. Besides, for feet, the error angles are in average larger than 8.5 degree between all the pairs of T4, T5 and T6, which means the ankle joints were so mobile that the feet were difficult to be accurately calibrated, even with the designed movement for anatomical calibration.
Therefore, we recommend to use StS test (T3) for anatomical calibration of head, chest and waist, and use walking test (T6) for anatomical calibration of thighs and shanks. In such cases, the error angle would be around and less than 5 degrees in average compared with the tests designed for anatomical calibration.
In this work, the error angle is always around the vertical axis (
), because the motion tests (T1 to T6) determine only the horizontal axes (
and
). Therefore, its impact on data analysis depends on the relationship between the predominant motion plane and the plane on which the analysis is done. Specifically, the impact of error angle is negligible when the two planes are identical, but the impact could become considerably large when the two plane are perpendicular. For example, let us suppose that the movements are predominantly on sagittal plane, and the error angle between the sagittal plane and the estimated
-
plane is 15 degree. If we want to analyze the motion on sagittal plane, since the error angle is always around the vertical axis, over 97% (
) of the motion amplitude on sagittal plane will still remain on the estimated
-
plane. So even the error angle is close to the upper boundary of error angle in
Table 11, it does not undermine the analysis. However, if we want to analyze the same motion on frontal plane, we will find that at maximum about 26% (
) of the predominant movements on sagittal plane is projected to the estimated
-
plane, leading to a significant error in the analysis on frontal plane. Since for most of the human movement, especially for lower limbs, the predominant motion plane is the sagittal plane, we recommend to use the anatomical calibration method for the analysis on sagittal plane.
4. Discussion
From Objective 1 and Objective 2, the correlations are overall high between sensors on different sides of the same body segment, and between the sensors on the different body segments when they are moving together, except for the waist and the feet. The correlation is not related with which test is used for generating the alignment matrix () but related with on which body segment and in which test the matrix is applied ().
The verification of Objective 1 and Objective 2 is limited by the artifact and the bending of body segments. However, changing the perspective, this means that, for some of the body segments in some tests, the movements measured by sensors on different sides of body are different. Therefore, the lateral sensor cannot replace the frontal sensor by simply resetting its coordinates frame at the beginning, or vice versa. The segments affected are the easily bendable segments, such as waist and feet, and the tests in which the frontal and lateral movements are different are the ones including bending of these segments or strong muscle activation, such as sit-to-stand (T3) or walking (T6).
Concerning the sensor placement on different sides of the same body segment, we find (Objective 2 to Objective 5) that in general the Frontal/back Set is better for the upper body, while the Lateral Set is better for the lower body.
Moreover, we verify that not too many repetitions were needed for converging the alignment matrix to a stable stage, from three repetitions the matrix changes in average for only less than 1 degree when adding one more repetition (Objective 3), and the averaged difference between the matrices generated from different combinations of three repetitions are less than 2.1 degrees and even less than 1 degree excluding T5 and both feet (Objective 4). More specifically, we find that in more natural movements, such as sit-to-stand (T3) and walking (T6), while the distribution of the accelerations is not a single neat plane, the repeatability of these motions are high. Therefore, fewer repetitions are needed to stabilize the alignment matrix compared with less disperse but more unnatural motions, such as lifting shank in T4 and swinging leg in T5.
Finally, because the motion is performed by humans, the estimated “sagittal plane” or the predominant plane of acceleration distribution in different tests are different. From Objective 5 we know that this difference is close to or less than 5 degree, in exception of the ones related with feet or T3 thighs. Including them, in the extreme case the difference between matrices can be in average as large as 15 degrees. As discussed at the end of
Section 3.5, the impact of this error depends on the motion as well as the analysis. For example, if the predominant movements are on sagittal plane, the analysis on sagittal plane will still be accurate even with the error in coordinates frame alignment, but the analysis on frontal plane may be heavily affected. In fact, in Objective 1 and Objective 2 we observe no large impact due to the error of extracted matrix.
Although in this work the experiments were conducted with healthy young subjects, the algorithm can be applied to pathologic or elderly subjects. However, as mentioned in
Section 2.1, the motion for this anatomical calibration method must satisfies the three characteristics (mainly pitch rotation, on sagittal plane, and having at least 30 degrees of motion range). If the motion of pathologic or elderly subjects does not satisfy the three requirements in normal motion tests, instead of normal motion tests, the motion for anatomical calibration should be the predefined motions such as bowing or swinging the leg. Sometimes some certain types of motion might be difficult to do by the subject. With our approach, the anatomical calibration can be done with an assistant helping the subjects to move their body at a very low speed, because this algorithm depends on acceleration (including gravity) instead of angular velocity, like in previous studies [
10,
13,
19,
20]. Besides, during quiet stance, the pathologic subjects may lean towards one side of body and the elderly subjects may be humpbacked. In such cases, the “whole body” coordinates frame estimated from anatomical calibration may be largely misaligned with the coordinates frames of each body segments.
5. Conclusions
To conclude, in order to conduct anatomical calibration through post-processing the data taken from quiet stance and any standard motion test whose motion is mainly on sagittal plane and has large range of movement, an anatomical calibration method is proposed to align the axes of the sensor coordinates frame to the whole body coordinates frame.
Furthermore, experiments which are conducted with two sets of IMUs placed on frontal/back and lateral sides of head, trunk and lower limbs show that after the proposed anatomical calibration the coordinates frames are closely aligned for sensors placed on different sides of the same body segment.
Moreover, the repeatability and convergence of the proposed method are verified with multiple test repetitions. Finally, the anatomical calibrations performed with motion tests (StS and walking) are similar to the ones obtained with movements specifically designed for upper and lower body anatomical calibration respectively, except for feet.
Compared with the other researches in the literature, the advantage of the proposed anatomical calibration method is that no extra calibration movement or measurement is required during the experiment. This does not only shorten the preparation time before the experiment, but also make it possible to correct the coordinates of the data taken in previous experiments when anatomical calibration is skipped. Besides, the proposed method is based on the predominant motion plane instead of the joint constraint or kinematic model. Therefore, it can be used when only a single IMU is placed on one limb. Furthermore, the method proposed requires only data from accelerometer, while the traditional methods need data from both gyroscope and accelerometer. This makes it possible to conduct anatomical calibration with extremely slow movement, for example moving the limbs of hemiplegic patients by physicians.


