
Fruit and Vegetable Quality Assessment via Dielectric Sensing

 , ,
, ,  , and
, and 
Abstract
:
1. Introduction
2. Dielectric Characterization of Vegetables and Fruits
2.1. Overview

2.2. Dielectric Properties
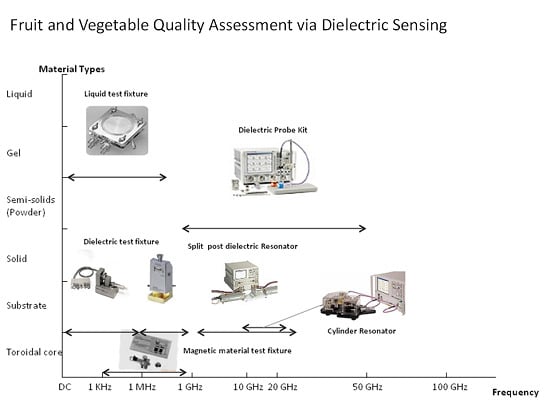
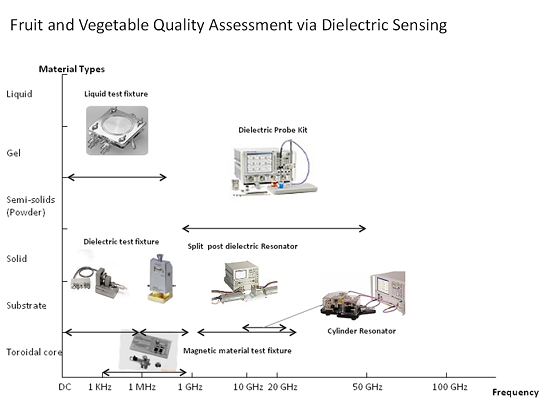
3. Dielectric Sensing Techniques

| Brief Description | Recommended Materials | Frequency Range | Advantages | Disadvantages | |
|---|---|---|---|---|---|
| Parallel plate | Material must be placed between two electrodes to form a capacitor | Material with the ability to be formed as a flat smooth sheet <100 MHz | <100 MHz | Inexpensive, high accuracy | Limited frequency range, sheet sample very thin (<10 mm thick) |
| Lumped circuit | Sample is a part of the insulator in a lumped circuit | All materials with the exception of gazes | <100 MHz | Liquid and solid materials can be measured | Limited frequency range, not suitable for very low loss materials |
| Coaxial probe | A coaxial line cut off forming a flat plane boundary in contact with food. A vector analyser is needed to measure the reflection | Liquids and semi-solids | 200 MHz–20 GHz, even >100 GHz | Easy to use, non-destructive for some materials, sample preparation is not required | Limited accuracy (±5%). Low loss resolution, large samples and solids must show a flat surface |
| Transmission line | Brick-shaped sample fills the cross section of an enclosed transmission line, causing an impedance change | Liquids and solids | <100 MHz | More accurate and sensitive than the probe method | Less accuracy than resonators, sample preparation is difficult and time-consuming |
| Cavity resonator | Sample is introduced in a cavity (a high Q resonant structure), which affects the centre frequency and quality factor of the cavity | Solids | 1 MHz–100 GHz | Easy sample preparation, adaptable for a wide range of temperatures | Broadband frequency data are not provided and analysis may be complex |
| Free space | Antennas are used to direct a MW beam at or through the material. A vector network analyser measures the reflection and transmission coefficients of solids | Solids | MW range | Non-destructive, high temperatures can be used | A large flat, thin, parallel-faced sample and special calibration are required |
| Time domain spectroscopy | Short pulses of THz radiation within a generation and detection scheme that is sensitive to the effect of both the amplitude and phase of the radiation | Homogeneous | 10 MHz–10 GHz. | Fast and high accuracy measurement, small sample | Expensive |
3.1. Time-Domain Spectroscopy
3.2. Radio-Frequency
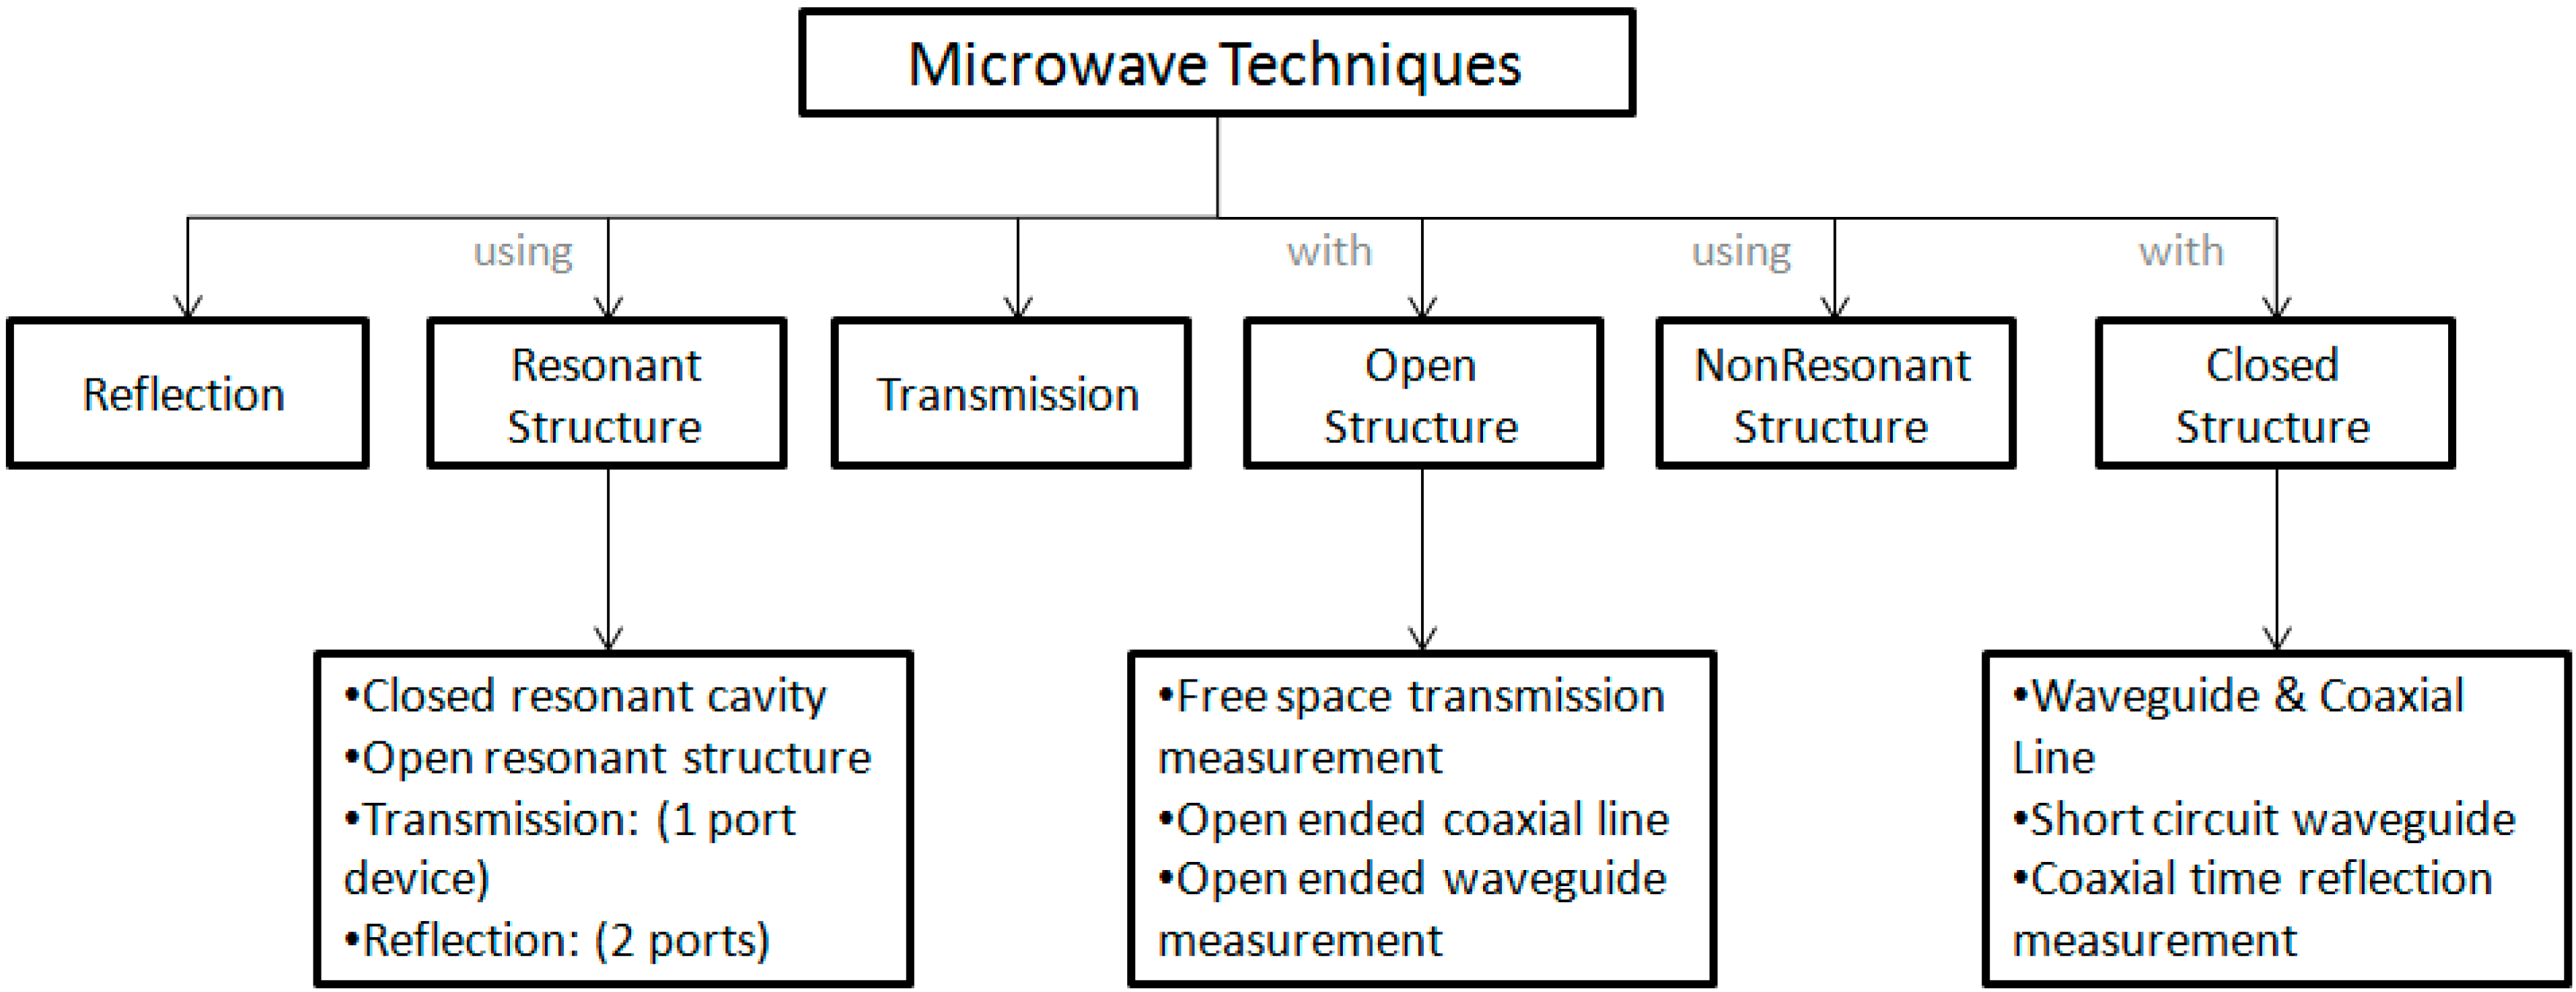
3.3. Microwave

| Illustration | Material Under Test | Frequency | Other Comments | |
|---|---|---|---|---|
| Coaxial Probe |  | Lossy Material (liquids and semi-solids) | Broadband | Non-destructive |
| Transmission Line |  | Lossy to low loss material (machineable solids) | Broadband | |
| Free Space |  | Best for flat sheets, powder high temperature | Broadband | |
| Resonant Cavity |  | Low loss materials, small samples | Single Frequency | Accurate |
| Parallel Plate |  | Flat sheets | Low Frequencies | Thin |
| Inductance measurement |  | Toroidal structures required | Accurate, simple measurement |
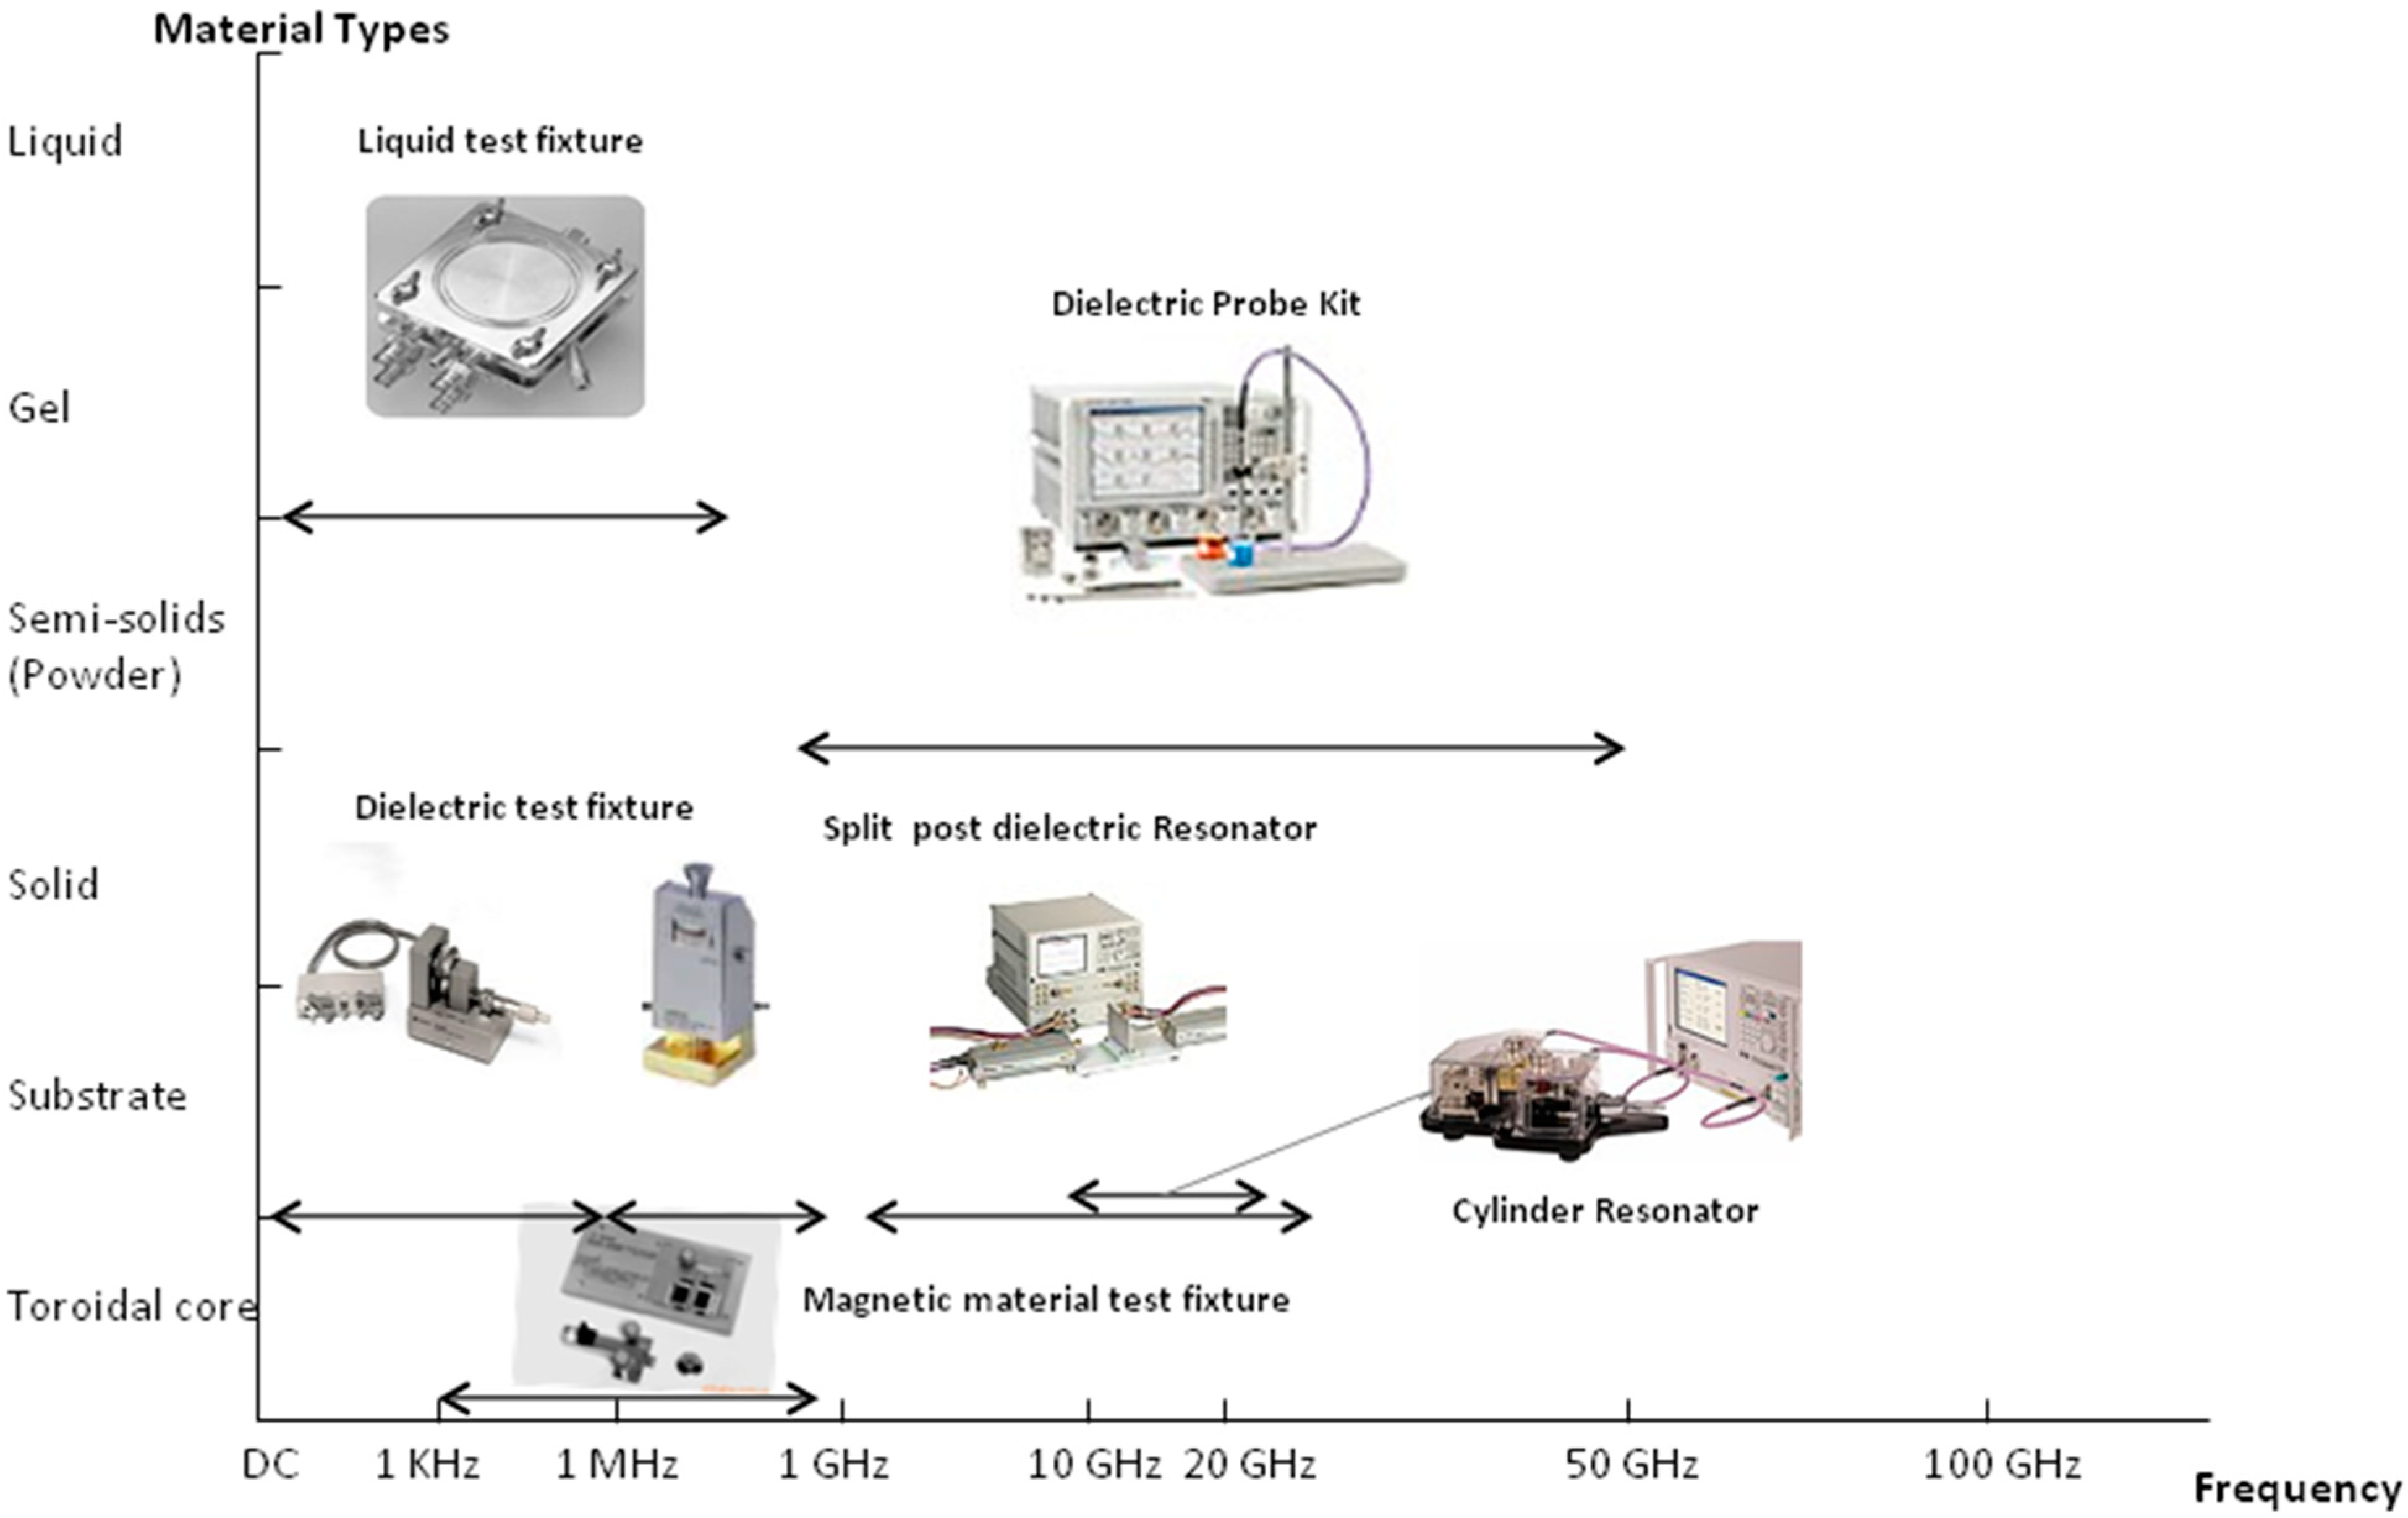
3.4. Dielectric Sample Holder

3.5. Novel Perspective of Dielectric Techniques
4. Dielectric Application Data
4.1. Apple
4.2. Avocado
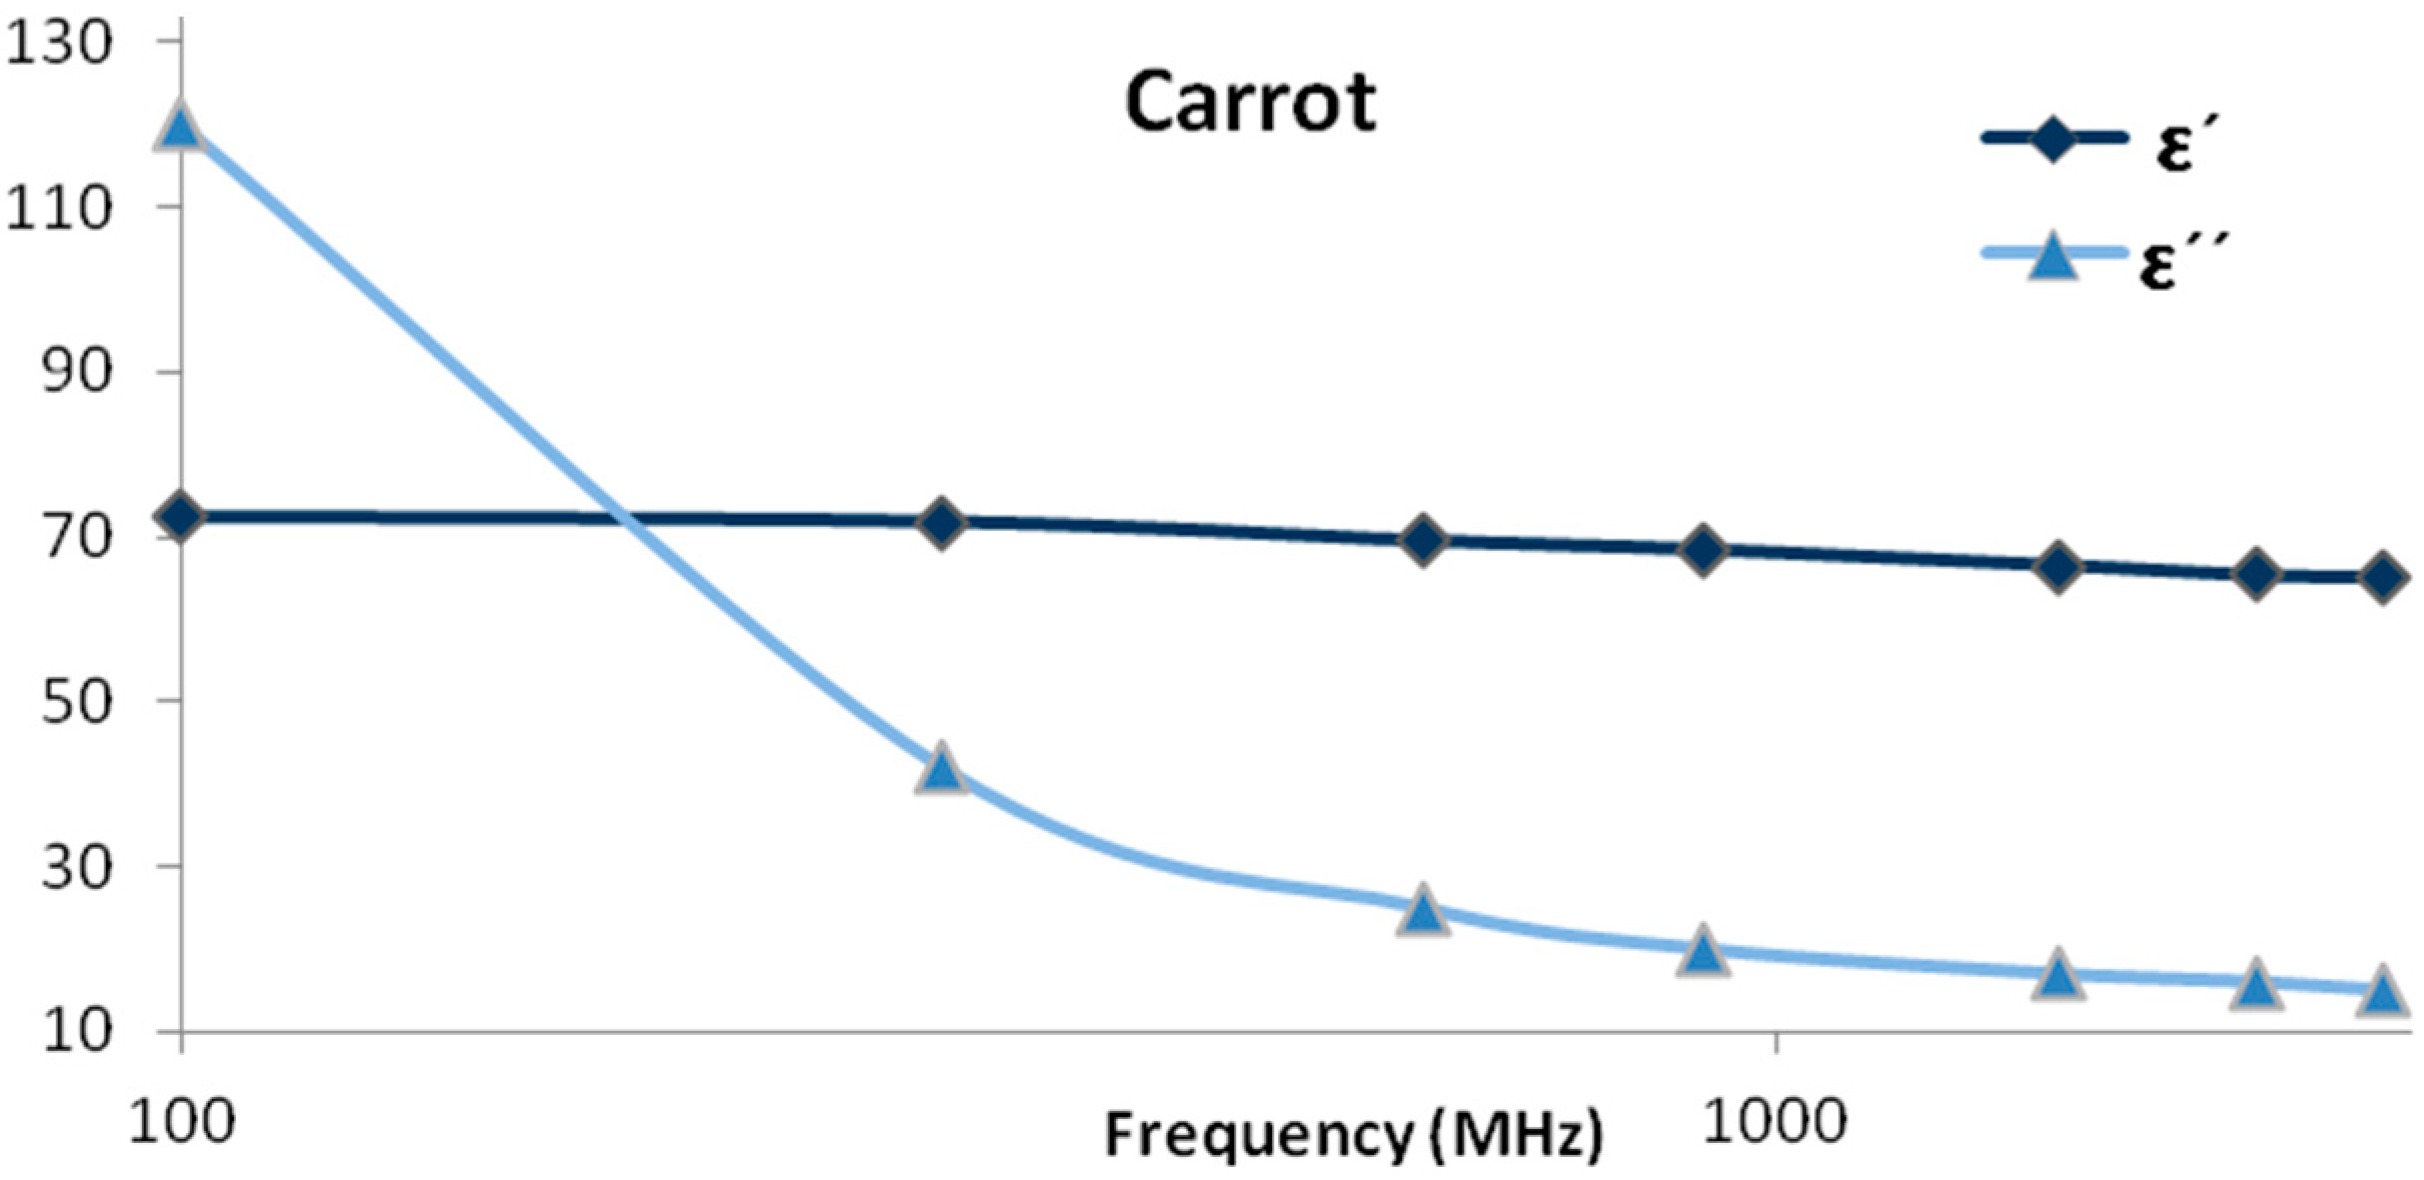
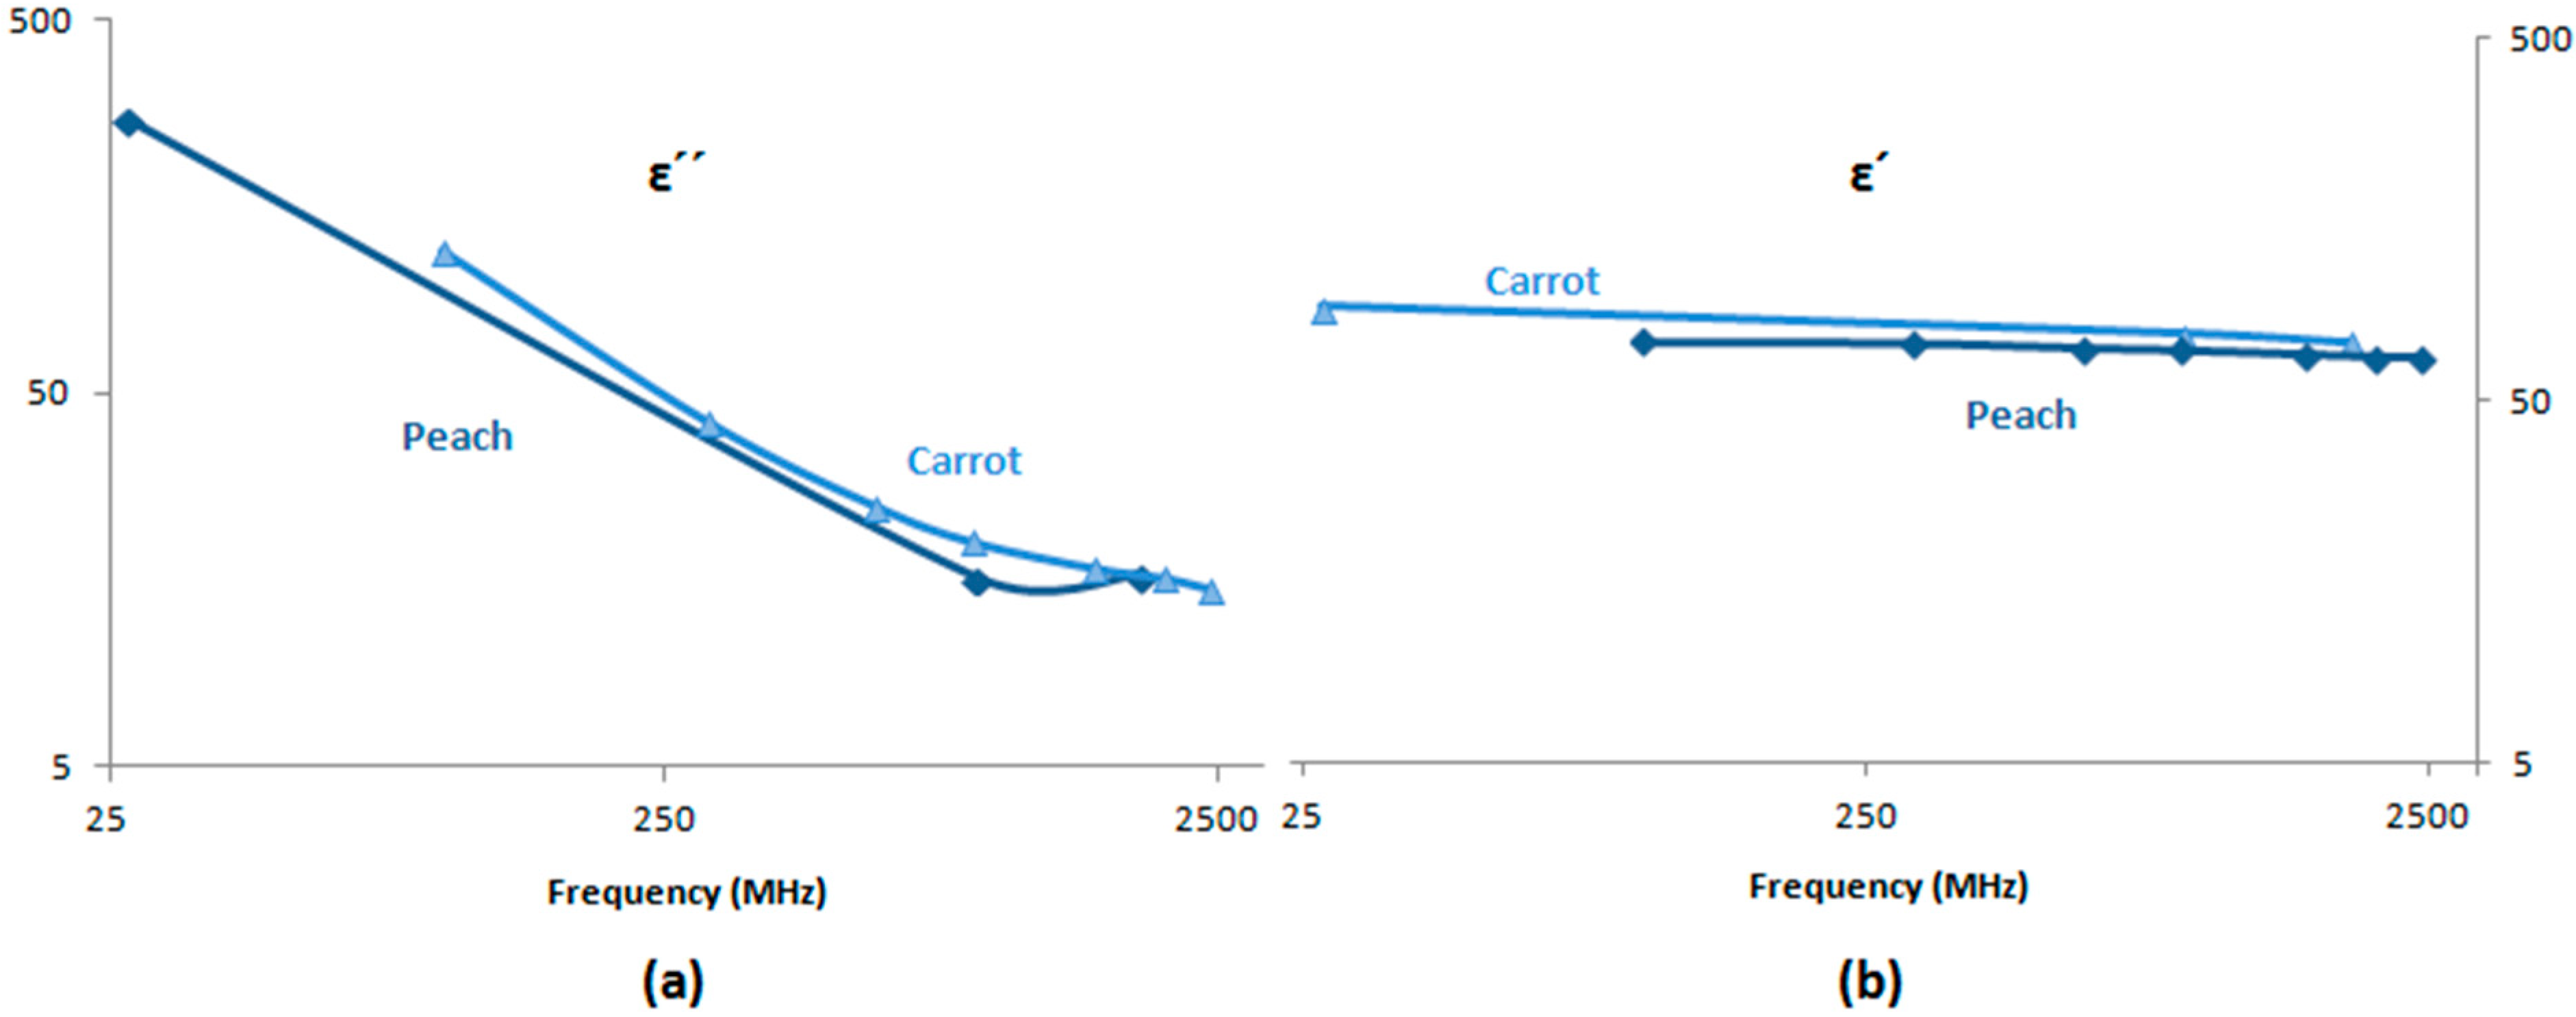
4.3. Carrot
4.4. Coconut Water
4.5. Eggplant (Brinjal)
4.6. Grape
4.7. Guava
4.8. Mango
4.9. Melon
4.10. Orange
4.11. Peach
4.12. Potato
4.13. Tomato
5. Discussion

| Fruit/Vegetable | Frequency | Temperature | Storage Time | Conclusions | ||||||
|---|---|---|---|---|---|---|---|---|---|---|
| ε′ | ε″ | Others | ε′ | ε″ | Others | ε′ | ε″ | Others | ||
| Apple | ∇ | Impedance ∇ Reactance ∇ | No pattern | No pattern | Conductance Δ Firmness Δ pH Δ | Linear decrease with frequency | ||||
| Avocado | At low freq. Δ At high freq. ∇ | At low freq. Δ | Inflection point at Critical edge freq. 100 MHz | |||||||
| Carrot | ∇ | ∇ | Inflection point at Critical edge freq. 100 MHz | |||||||
| Coconut | ∇ | Linear decrease with frequency | ||||||||
| Eggplant | ∇ | Linear decrease with frequency | ||||||||
| Grape | Conductance Δ Capacitance Δ Impedance ∇ | Δ | Equ. Capacitance ∇ Equ. Parallel capacitance Δ conductance Δ | Linear increase with storage time | ||||||
| Guava | ∇ | Energy storage capability ∇ | Relative permittivity Δ | Relative permittivity Δ | Linear decrease with frequency | |||||
| Mango | ∇ | ∇ | Dp ∇ | ∇ | Δ | Dp ∇ | ∇ | ∇ | Linear decrease with frequency | |
| Melon | Frequency linear relationship between 10 and 500 MHz | |||||||||
| Orange | At low freq.Δ | At low freq.Δ | Dispersion shift to higher freq. | Temperature linear increase below 50 MHz | ||||||
| Peach | ∇ & Std. < 2% | V type & Std. < 10% | Dp Δ High correlation of:LR & freq. and LR & fruit firmness | linear ∇ | Frequency and temperature linear decrease | |||||
| Potato | ∇ | ∇ | From −20 °C to 0 °C Δ From 0 °C to 100 °C ∇ | From −20 °C to 0 °C Δ From 0 °C to 100 °C Δ then ∇ | Frequency linear decrease, varying temperature pattern | |||||
| Tomato | Exponential ∇ | ∇ | ∇ then Δ at 915 MHz | Exponential relationship with frequency | ||||||
6. Conclusions
Acknowledgments
Conflicts of Interest
Acronyms
| Nomenclature | Definition |
| α | Quantification of the symmetric broadening of the relaxation distribution |
| τ | Relaxation time |
| σ | Ionic conductivity |
| γ | Quantification of the asymmetric broadening of the relaxation distribution |
| ω | Angular frequency |
| Δ | Increase |
| ∇ | Decrease |
| d | Dipole rotation |
| E | Rms electric field |
| ε* | Complex relative permittivity |
| ε′ | Dielectric constant |
| ε″ | Loss factor |
| Δε | Dielectric length |
| α dispersion | Alpha dispersion |
| β dispersion | Beta dispersion |
| λ dispersion | Gamma dispersion |
| f | Frequency |
| LR | Return loss |
| Mltr | Permittivity maturity index |
| Mp | Permittivity maturity index |
| tan δ | Loss tangent |
| BP | BP network model |
| Dp | Penetration depth |
| ELM | Extreme Learning Machine |
| FAST | Fast clustering based feature subset selection |
| FDS | Frequency domain spectrometer |
| FF | Full Frequency |
| GRNN | Generalized Regression Neural Network |
| LCR | Inductance Capacitance Resistance analyser |
| MW | Microwave |
| P | Power dissipated |
| PCA | Principal Component Analysis |
| PCA-BP | Principal Component Analysis using the BP model |
| PCA-SVR | Principal Component Analysis using the SVR model |
| PCA-SVR | Principal Component Analysis using the SVR model |
| RF | Radio Frequency |
| RMSE | Root Mean Square Error |
| SPA | Successive Projection Algorithm |
| SPA-BP | Successive Projection Algorithm using the BP model |
| SPCA | Sparse Principal Component Analysis |
| SRC | Sparse representation classification |
| SSC | Soluble Solid Content |
| SVM | Support Vector Machine |
| SVR | Support Vector Regression |
| SWR | Standing Wave Ratio |
| UVE-PLS | Uninformative Variation Eliminations |
| WLR | Weight Loss Rate |
References
- González-Araiza, J.R. Impedancia Bio-Electrica Como Técnica No-Destructiva para Medir la Firmeza de la Fresa (Fragaria x Ananassa Duch) y su Relación Con Técnicas Convencionales. Ph.D. Thesis, Universidad Politécnica de Valencia, Valencia, Spain, 2014. [Google Scholar]
- Choi, K.H.; Lee, K.J.; Kim, G. Nondestructive quality evaluation technology for fruits and vegetables using near—Infrared spectroscopy. In Proceedings of the International Seminar on Enhancing Export Competitiveness of Asian Fruits, Bangkok, Thailand, 18–19 May 2006.
- Moreda, G.P.; Ortiz-Cañavate, J.; García-Ramos, F.J.; Ruiz-Altisent, M. Non-destructive technologies for fruit and vegetable size determination—A review. J. Food Eng. 2009, 92, 119–136. [Google Scholar] [CrossRef] [Green Version]
- Cortés-Olmos, C.; Leiva-Brondo, M.; Roselló, J.; Raigón, M.D.; Cebolla-Cornejo, J. The role of traditional varieties of tomato as sources of functional compounds. J. Sci. Food Agric. 2014. [Google Scholar] [CrossRef] [PubMed]
- Shewfelt, R.L. Quality of minimally processed fruits and vegetables. J. Food Qual. 1987, 10. [Google Scholar] [CrossRef]
- Butz, P.; Hauffman, C.; Taushard, B. Recent Developments in Noninvasive Techniques for Fresh Fruit and Vegetable Internal Quality Analysis. J. Food Sci. 2005, 70, 131–141. [Google Scholar] [CrossRef]
- Nelson, S.O.; Forbus, W.R.; Lawrence, K.C. Assessment of MW permittivity for sensing peach maturity. Trans. ASAE 1995, 38, 579–585. [Google Scholar] [CrossRef]
- Pliquett, U. Bioimpedance: A Review for Food Processing. Food Eng. Rev. 2010, 2, 74–94. [Google Scholar] [CrossRef]
- Ortiz Meléndez, A.D.J. Caracterización de nitratos presentes en lechuga (Lactuca sativa L.) mediante el uso de bioimpedancia eléctrica. Ph.D. Thesis, University Autonoma de Queretaro, Santiago de Querétaro, Mexico, 2014. [Google Scholar]
- Chen, P.; Sun, Z. A review of non-destructive methods for quality evaluation and sorting of agricultural products. J. Agric. Eng. Res. 1991, 49, 85–98. [Google Scholar] [CrossRef]
- Żywica, R.; Pierzynowska-Korniak, G.; Wójcik, J. Application of food products electrical model parameters for evaluation of apple purée dilution. J. Food Eng. 2005, 67, 413–418. [Google Scholar] [CrossRef]
- Içier, F.; Baysal, T. Dielectric properties of food materials-2: Measurement Techniques. Crit. Rev. Food Sci. Nutr. 2004, 44, 473–478. [Google Scholar] [CrossRef] [PubMed]
- Tang, J. Dielectric properties of foods. In The MW Processing of Foods; Schubert, H., Regier, M., Eds.; Woodhead Publishing Limited: Cambridge, UK, 2005; pp. 22–38. [Google Scholar]
- Von Hippel, A.R. Dielectric Properties and Waves; John Wiley & Son: New York, NY, USA, 1954. [Google Scholar]
- Mudgett, R.E. Electrical properties of foods. In Engineering Properties of Food, 2nd ed.; Tabulates Electrical and Dielectrical Properties of Food Materials; Rao, M.A., Rizvi, S.S.H., Eds.; Marcel Dekker: New York, NY, USA, 1986; pp. 329–339. [Google Scholar]
- Nelson, S.O.; Kraszewski, A.W. Dielectric properties of materials and measurement techniques. Dry. Technol. 1990, 8, 1123–1142. [Google Scholar] [CrossRef]
- Guan, D.; Cheng, M.; Wang, Y.; Tang, J. Dielectric properties of mashed potatoes relevant to MW and radio-frequency pasteurization and sterilization processes. J. Food Sci. 2004, 69, FEP30–FEP37. [Google Scholar]
- Nelson, S.O. MW dielectric properties of fresh onions. Trans. ASAE 1992, 35, 963–966. [Google Scholar] [CrossRef]
- Guo, W.; Nelson, S.O.; Trabelsi, S.; Kays, S.J. 10–1800-MHz dielectric properties of fresh apples during storage. J. Food Eng. 2007, 83, 562–569. [Google Scholar] [CrossRef]
- Schwan, H.P. Electrical properties of tissues and cell suspensions: Mechanisms and models. Engineering in Medicine and Biology Society. Engineering Advances: New Opportunities for Biomedical Engineers. In Proceedings of the 16th Annual International Conference of the IEEE Engineering in Medicine and Biology Society, Baltimore, MD, USA, 3–6 November 1994; pp. 70–71.
- Asami, K.; Yonezawa, T.; Wakamatsu, H.; Koyanagi, N. Dielectric spectroscopy of biological cells. Bioelectrochem. Bioenerg. 1996, 40, 141–145. [Google Scholar] [CrossRef]
- Grant, E.; Halstead, B.J. Dielectric parameters relevant to MW dielectric heating. Chem. Soc. Rev. 1998, 27, 213–224. [Google Scholar]
- Ramaswamy, H.S.; Voort, F.V.D.; Ghazala, S. An analysis of TDT and Arrhenius methods for handling process and kinetic data. J. Food Sci. 1989, 54, 1322–1326. [Google Scholar] [CrossRef]
- Castro-Giráldez, M.; Botella, P.; Toldrá, F.; Fito, P. Low-frequency dielectric spectrum to determine pork meat quality. Innov. Food Sci. Emerg. Technol. 2010, 11, 376–386. [Google Scholar] [CrossRef]
- Sarbacher, R.I.; Edson, W.A. Hyper and Ultrahigh Frequency Engineering; Wiley: New York, NY, USA, 1943; Volume 19442, p. 174. [Google Scholar]
- Rotman, W. Plasma simulation by artificial dielectrics and parallel-plate media. IRE Trans. Antennas Propag. 1962, 10, 82–95. [Google Scholar] [CrossRef]
- Sanchez, B.; Bandarenka, A.; Vandersteen, G.; Schoukens, J.; Bragos, J. Novel approach of processing electrical bioimpedance data using differential impedance analysis. Med. Eng. Phys. 2013, 35, 1349–1357. [Google Scholar] [CrossRef] [PubMed]
- Zaengl, W.S. Dielectric spectroscopy in time and frequency domain for HV power equipment. I. Theoretical considerations. IEEE Electr. Insul. Mag. 2003, 19, 5–19. [Google Scholar] [CrossRef]
- Castellon, J.; Nguyen, H.N.; Agnel, S.; Toureille, A.; Frechette, M.; Savoie, S.; Schmidt, L.E. Electrical properties analysis of micro and nano composite epoxy resin materials. IEEE Trans. Dielectr. Electr. Insul. 2011, 18, 651–658. [Google Scholar] [CrossRef]
- De los Reyes, R.; Heredia, A.; Fito, P.; de los Reyes, E.; Andrés, A. Dielectric spectroscopy of osmotic solutions and osmotically dehydrated tomato products. J. Food Eng. 2007, 80, 1218–1225. [Google Scholar] [CrossRef]
- Liu, T.; Fothergill, J.; Dodd, S.; Nilsson, U. Dielectric spectroscopy measurements on very low loss cross-linked polyethylene power cables. J. Phys. Conf. Ser. 2009, 183. [Google Scholar] [CrossRef]
- Kremer, F. Dielectric spectroscopy—Yesterday, today and tomorrow. J. Non-Cryst. Solids 2002, 305, 1–9. [Google Scholar] [CrossRef]
- Ikediala, J.N.; Tang, J.; Drake, S.R.; Neven, L.G. Dielectric properties of apple cultivars and codling moth larvae. Trans. ASAE 2000, 43, 1175–1184. [Google Scholar] [CrossRef]
- Metaxas, A.C.; Meredith, R.J. Industrial MW Heating; IEE Power Engineering Series; Peter Peregrinus Ltd.: London, UK, 1993. [Google Scholar]
- Ryynänen, S. The electromagnetic properties of food materials: A review of basic principles. J. Food Eng. 1995, 26, 409–429. [Google Scholar] [CrossRef]
- Nelson, S.O. Dielectric spectroscopy in agriculture. J. Non-Cryst. Solids 2005, 351, 2940–2944. [Google Scholar] [CrossRef]
- Nelson, S.O. Frequency and Temperature permittivities of fresh fruits and vegetables from 0.01 to 1.8 GHz. Trans. ASAE 2003, 39, 281–289. [Google Scholar] [CrossRef]
- Bellamy, W.L.; Nelson, S.O.; Leffler, R.G. Development of a time-domain reflectrometry system for dielectric properties measurement. Trans. ASAE 1985, 28, 1313–1318. [Google Scholar] [CrossRef]
- Einfeldt, J.; Meißner, D.; Kwasniewski, A. Polymerdynamics of cellulose and other polysaccharides in solid state-secondary dielectric relaxation processes. Prog. Polym. Sci. 2001, 26, 1419–1472. [Google Scholar] [CrossRef]
- Kwok, B.P.; Nelson, S.O.; Bahar, E. Time-domain measurements for determination of dielectric properties of agricultural materials. IEEE Trans. Instrum. Meas. 1979, 28, 109–112. [Google Scholar] [CrossRef]
- Feldman, Y.D.; Zuev, Y.F.; Polygalov, E.A.; Fedotov, V.D. Time domain dielectric spectroscopy. A new effective tool for physical chemistry investigation. Colloid Polym. Sci. 1992, 270, 768–780. [Google Scholar] [CrossRef]
- Asami, K. Characterization of heterogeneous systems by dielectric spectroscopy. Prog. Polym. Sci. 2002, 27, 1617–1659. [Google Scholar] [CrossRef]
- Schwan, H.P. Determination of biological impedances. In Physical Techniques in Biological Research; Academic Press: New York, NY, USA, 1963; Volume 4, pp. 323–407. [Google Scholar]
- Nelson, S.O. Agricultural applications of dielectric measurements. IEEE Trans. Dielectr.Electr. Insul. 2006, 13, 688–702. [Google Scholar] [CrossRef]
- Nelson, S.O.; Soderholm, L.H.; Yung, F.D. Determining the dielectric properties of grain. Agric. Eng. 1953, 34, 608–610. [Google Scholar]
- Jorgensen, J.L.; Edison, A.R.; Nelson, S.O.; Stetson, L.E. Bridge method for dielectric measurements of grain and seed in the 50-to 250-MHz range. Trans. ASAE 1970, 13, 18–20. [Google Scholar] [CrossRef]
- Stetson, L.E.; Nelson, S.O. A method for determining dielectric properties of grain and seed in the 200- to 500-MHz Range. Trans. ASAE 1970, 13, 491–495. [Google Scholar]
- Venkatesh, M.S.; Raghavan, G.S.V. An overview of dielectric properties measuring techniques. Can. Biosyst. Eng. 2005, 47, 15–30. [Google Scholar]
- Kuang, W.; Nelson, S.O. Low-frequency dielectric properties of biological tissues: A review with some new insights. Trans. ASAE 1998, 41, 173–184. [Google Scholar] [CrossRef]
- Wakamatsu, H. A dielectric spectrometer for liquid using the electromagnetic induction method. Hewlett-Packard J. 1997, 48, 37–44. [Google Scholar]
- Nelson, S.O. Improved sample holder for Q-meter dielectric measurements. Trans. ASAE 1979, 22, 950–954. [Google Scholar] [CrossRef]
- Corcoran, P.T.; Nelson, S.O.; Stetson, L.E.; Schlaphoff, C.W. Determining Dielectric properties of grain and seed in the audio frequency range. Trans. ASAE 1970, 13, 348–351. [Google Scholar] [CrossRef]
- Lawrence, K.C.; Nelson, S.O.; Kraszewski, A.W. Automatic system for dielectric properties measurements from 100 kHz to 1 GHz. Trans. ASAE 1989, 32, 304–308. [Google Scholar] [CrossRef]
- Bussey, H.E. Dielectric measurements in a shielded open circuitline. IEEE Trans. Instrum. Meas. 1980, 29, 120–124. [Google Scholar] [CrossRef]
- Jones, R.N.; Bussey, H.E.; Little, W.E.; Metzker, R.F. Electrical Characteristics of Corn, Wheat, and Soya in the 1–200 MHz Range; US Department of Commerce, National Bureau of Standards: Washington, DC, USA, 1979.
- Mätzler, C. Applications of the interaction of microwaves with the natural snow cover. Remote Sens.Rev. 1987, 2, 259–387. [Google Scholar] [CrossRef]
- Nelson, S.O. Electrical properties of agricultural products—A critical review. Trans. ASAE 1976, 16, 384–400. [Google Scholar] [CrossRef]
- Kraszewski, A. MW aquametry—A review. J. MW Power 1980, 15, 209–220. [Google Scholar]
- Afsar, M.N.; Birch, J.R.; Clarke, R.N.; Chantry, G.W. The measurement of the properties of materials. Proc. IEEE 1986, 74, 183–199. [Google Scholar] [CrossRef]
- Nelson, S.O.; Charity, L.F. Frequency dependence of energy absorption by insects and grain in electric fields. Trans. ASAE 1972, 15, 1099–1102. [Google Scholar]
- Roberts, S.; von Hippel, A. A new method for measuring dielectric constant and loss in the range of centimeter waves. J. Appl. Phys. 1946, 17, 610–616. [Google Scholar] [CrossRef]
- Nelson, S.O. Dielectric properties of some fresh fruits and vegetables at frequencies of 2.45 to 22 GHz. Trans. ASAE 1983, 26, 613–616. [Google Scholar] [CrossRef]
- Nelson, S.O.; Stetson, L.E.; Schlaphoff, C.W. A general computer program for precise calculation of dielectric properties from short-circuited waveguide measurements. IEEE Trans. Instrum. Meas. 1974, 23, 455–460. [Google Scholar] [CrossRef]
- Kraszewski, A.; Stuchly, S.S.; Stuchly, M.A. ANA calibration method for measurement of dielectric properties. IEEE Trans. Instrum. Meas. 1983, 32, 385–386. [Google Scholar] [CrossRef]
- Waters, D.G.; Brodwin, M.E. Automatic material characterization at MW frequencies. IEEE Trans. Instrum. Meas. 1988, 37, 280–284. [Google Scholar] [CrossRef]
- Tran, V.N.; Stuchly, S.S.; Kraszewski, A. Dielectric properties of selected vegetables and fruits 0.1–10 GHz. J. MW Power 1984, 19, 251–258. [Google Scholar]
- Bosisio, R.; Akyel, C.; Labelle, R.C.; Wang, W. Computeraided permittivity measurements in strong RF Fields (Part II). IEEE Trans. Instrum. Meas. 1986, 35, 606–611. [Google Scholar] [CrossRef]
- Rzepecka, M.A. A cavity perturbation method for routine permittivity measurements. J. MW Power 1973, 8, 3–11. [Google Scholar]
- Kraszewski, W.; Nelson, S.O. Resonant-cavity perturbation measurement for mass determination of the perturbing object. In Proceedings of the IEEE Instrumentations and Measurements, Technology Conference, Hamamatsu, Japan, 10–12 May 1994; pp. 1261–1264.
- Böhmer, R.; Diezemann, G. Principles and applications of pulsed dielectric spectroscopy and nonresonant dielectric hole burning. In Broadband Dielectric Spectroscopy; Kermer, F., Schönhals, A., Eds.; Springer: Berlin/Heidelberg, Germany, 2003; pp. 523–569. [Google Scholar]
- Bauer, C.; Böhmer, R.; Moreno-Flores, S.; Richert, R.; Sillescu, H.; Neher, D. Capacitive scanning dilatometry and frequency-dependent thermal expansion of polymer films. Phys. Rev. E 2006, 61. [Google Scholar] [CrossRef]
- Fukao, K.; Miyamoto, Y. Glass transition temperature and dynamics of α-process in thin polymer films. Europhys. Lett. 1999, 46. [Google Scholar] [CrossRef]
- Hartmann, L.; Kratzmuller, T.; Braun, H.G.; Kremer, F. Molecular dynamics of grafted PBLG in the swollen and in the dried state. Macromol. Rapid Commun. 2000, 21, 814–819. [Google Scholar] [CrossRef]
- Seaman, R.; Seals, J. Fruit pulp and skin dielectric properties for 150 MHz TO 6400 MHz. J. MW Power Electromagn. Energy 1991, 26, 72–81. [Google Scholar]
- Fito, P.; Castro-Giráldez, M.; Fito, P.J.; Chenoll, C. Development of a dielectric spectroscopy technique for the determination of apple (Granny Smith) maturity. Innov. Food Sci. Emerg. Technol. 2010, 11, 749–754. [Google Scholar]
- Castro-Giráldez, M.; Fito, P.J.; Chenoll, C.; Fito, P. Development of a dielectric spectroscopy technique for determining key chemical components of apple maturity. J. Agric. Food Chem. 2010, 58, 3761–3766. [Google Scholar] [CrossRef] [PubMed]
- Ma, H.; Feng, M.; Zheng, J. Properties of Fuji apples superficial scald in the 100 Hz to 3.98 MHz range. Trans. Chin. Soc. Agric. Mach. 2010, 41, 105–109. [Google Scholar]
- Guo, W.; Zhu, X.; Nelson, S.O.; Yue, R.; Liu, H.; Liu, Y. Maturity effects on dielectric properties of apples from 10 to 4500 MHz. Food Sci. Technol. 2011, 44, 224–230. [Google Scholar] [CrossRef]
- Guo, W.; Zhu, X.; Yue, R.; Liu, H.; Liu, Y. Dielectric properties of fuji apples from 10 to 4500 MHz during storage. J. Food process. Preserv. 2011, 35, 884–890. [Google Scholar] [CrossRef]
- Yovcheva, T.; Vozáry, E.; Bodurov, I.; Viraneva, A.P.; Marudova, M.; Exner, G. Investigation of apples aging by electric impedance spectroscopy. Bulg. Chem. Commun. 2013, 45, 68–72. [Google Scholar]
- Cai, C.; Li, Y.; Ma, H.; Li, X. Nondestructive classification of internal quality of apple based on dielectric feature selection. Trans. Chin. Soc. Agric. Eng. 2013, 29, 279–287. [Google Scholar]
- Ma, F.; Guo, Y. Influence experiment and mechanism analysis of high-voltage pulsed on dielectric properties of fruits and vegetables. Trans. Chin. Soc. Agric. Mach. 2013, 44, 177–180. [Google Scholar]
- Guo, W.; Shang, L.; Wang, M.; Zhu, X. Soluble solids content detection of postharvest apples based on frequency spectrum of dielectric parameters. Trans. Chin. Soc. Agric. Mach. 2013, 44, 132–137. [Google Scholar]
- Li, Y.; Cai, C.; Ma, H. Nondestructive Fuji apple internal quality classification with Dielectric feature selection. ICIC Express Lett. 2014, 8, 145–149. [Google Scholar]
- Guo, W.; Shang, L.; Zhu, X.; Nelson, S.O. Nondestructive Detection of Soluble Solids Content of Apples from Dielectric Spectra with ANN and Chemometric Mehtods. Food Bioprocess Technol. 2015, 8, 1126–1138. [Google Scholar] [CrossRef]
- Zdunek, A.; Cybulska, J. Relation of Biospeckle Activity with Quality Attributes of Apples. Sensors 2011, 11, 6317–6327. [Google Scholar] [CrossRef] [PubMed]
- Adamiak, A.; Zdunek, A.; Rutkowski, K. Application of the Biospeckle Method for monitoring Bull’s eye Rot Development and Quality Changes of Apples Subjected to Various Storage Methods-Preliminary Studies. Sensors 2012, 12, 3215–3227. [Google Scholar] [CrossRef] [PubMed]
- Coronel, P.; Simunovic, J.; Sandeep, K.P.; Kumar, P. Dielectric properties of pumpable food materials at 915 MHz. Int. J. Food Prop. 2008, 11, 508–518. [Google Scholar] [CrossRef]
- Cheuyglinstase, K.; Morison, K.R. Carrot Fiber as a Carrier in Spray Drying of Fructose. In Water Properties in Food, Health, Pharmaceutical and Biological Systems: ISOPOW 10; Centre for Formulation Engineering, Chemical Engineering, University of Birmingham: Birmingham, UK, 2010; p. 191. [Google Scholar]
- Kundu, A.; Gupta, B. Broadband dielectric properties measurements of some vegetables and fruits using open ended coaxial probe technique. In Proceedings of the International Conference on Control, Instrumentation, Energy and Communication, Calcutta, India, 31 January–2 February 2014; pp. 480–484.
- Bian, H.; Tu, P. Influence of fall height and storage time on dielectric properties of red globe grape. In Proceedings of the International Conference on Energy and Power Engineering, Hong Kong, China, 26–27 April 2014; pp. 209–213.
- Sosa-Morales, M.E.; Tiwari, G.; Wang, S.; Tang, J.; Garcia, H.S.; Lopez-Malo, A. Dielectric heating as a potential post-harvest treatment of disinfesting mangoes, Part I: Relation between dielectric properties and ripening. Biosyst. Eng. 2009, 103, 297–303. [Google Scholar] [CrossRef]
- Yoiyod, P.; kaririskh, M. Analysis of a Cost-effective Remote Sensing System for Fruit Monitoring. In Proceedings of the IEEE Antennas and Propagation Society International Symposium (APSURSI), Orlando, FL, USA, 7–13 July 2013.
- Nelson, S.O.; Guo, W.; Trabelsi, S.; Kays, S.J. Dielectric spectroscopy of watermelons for quality sensing. Meas. Sci. Technol. 2007, 18, 1887–1892. [Google Scholar] [CrossRef]
- Nelson, S.O. Dielectric properties of agricultural products and some applications. Res. Agric. Eng. 2008, 54, 104–112. [Google Scholar]
- Nelson, S.O.; Trabelsi, S. Examination of dielectric spectroscopy data for correlations with melón quality. In Proceedings of the American Society of Agricultural and Biological Engineers Annual International Meeting, Louisville, Kentucky, 7–10 August 2011; pp. 5123–5128.
- Hasted, J.B. Aqueous Dielectrics; Chapman and Hall, Ed.; John Wiley & Sons: New York, NY, USA, 1973. [Google Scholar]
- Foster, K.R.; Schwan, H.P. Dielectric properties of tissues and biological materials: A critical review. Crit. Rev. Biomed. Eng. 1988, 17, 25–104. [Google Scholar]
- Forbus, W.R.; Dull, G.G. Delayed light emission as indicator of peach maturity. J. Food Sci. 1990, 55, 1581–1584. [Google Scholar] [CrossRef]
- Guo, W.; Zhu, X.; Guo, K.; Wang, Z. Electrical properties of peaches and its application in sensing freshness. Trans. Chin. Soc. Agric. Mach. 2007, 38, 112–115. [Google Scholar]
- Llero, L.; Ruiz-Altisent, M.; Hernandez, N.; Gutierrez, P. Application of MW return loss for sensing internal quality of peaches. Biosyst. Eng. 2007, 96, 525–539. [Google Scholar]
- Guo, W.; Chen, K. Relationship between dielectric properties from 10 to 4500 MHz and internal quality of peaches. Trans. Chin. Soc. Agric. Mach. 2010, 41, 134–138. [Google Scholar]
- Ling, B.; Tiwari, G.; Wang, S. Pest Control by MW and radio frequency energy: Dielectric properties of stone fruit. Agron. Sustain. Dev. 2014, 35, 233–240. [Google Scholar] [CrossRef]
- Chen, J.; Pitchai, K.; Birla, S.; Gonzalez, R.; Jones, D.; Subbiah, J. Temperature-dependant dielectric and thermal properties of whey protein gel and mashed potato. Trans. Am. Soc. Agric. Biol. Eng. 2013, 56, 1457–1467. [Google Scholar]
- Peng, J.; Tang, J.; Jiao, Y.; Bohnet, S.G.; Barret, D.M. Dielectric properties of tomatoes assisting in the development of MW pasteurization and sterilization processes. Food Sci. Technol. 2013, 54, 367–376. [Google Scholar]
- Keller, G.V.; Licastro, P.H. Dielectric constant and electrical resistivity of natural-state cores. U.S. Geological Survey bulletin, 1052-H. Exp. Theor. Geophys. 1959, IV, 257–285. [Google Scholar]
- Sosa-Morales, M.E.; Valerio-Junco, L.; López-Malo, A.; García, H.S. Dielectric properties of foods: Reported data in the 21st century and their potential applications. LWT Food Sci. Technol. 2010, 43, 1169–1179. [Google Scholar] [CrossRef]
- Guo, W.; Tiwari, G.; Tang, J.; Wang, S. Frequency, moisture and temperature-dependent dielectric properties of chickpea flour. Biosyst. Eng. 2008, 101, 217–224. [Google Scholar] [CrossRef]
- Wang, Y.; Wig, T.; Tang, J.; Hallberg, L. Dielectric properties of food relevant to RF and MW pasteurization and sterilization. J. Food Eng. 2003, 57, 257–268. [Google Scholar] [CrossRef]
- Birla, S.L.; Wang, S.; Tang, J.; Tiwari, G. Characterization of radio frequency heating of fresh fruits influenced by dielectric properties. J. Food Eng. 2008, 89, 390–398. [Google Scholar] [CrossRef]
- Berna, A. Metal Oxide Sensors for Electronic Noses and Their Application to Food Analysis. Sensors 2010, 10, 3882–3910. [Google Scholar] [CrossRef] [PubMed]
© 2015 by the authors; licensee MDPI, Basel, Switzerland. This article is an open access article distributed under the terms and conditions of the Creative Commons Attribution license (http://creativecommons.org/licenses/by/4.0/).
Share and Cite
Khaled, D.E.; Novas, N.; Gazquez, J.A.; Garcia, R.M.; Manzano-Agugliaro, F. Fruit and Vegetable Quality Assessment via Dielectric Sensing. Sensors 2015, 15, 15363-15397. https://doi.org/10.3390/s150715363
Khaled DE, Novas N, Gazquez JA, Garcia RM, Manzano-Agugliaro F. Fruit and Vegetable Quality Assessment via Dielectric Sensing. Sensors. 2015; 15(7):15363-15397. https://doi.org/10.3390/s150715363
Chicago/Turabian StyleKhaled, Dalia El, Nuria Novas, Jose A. Gazquez, Rosa M. Garcia, and Francisco Manzano-Agugliaro. 2015. "Fruit and Vegetable Quality Assessment via Dielectric Sensing" Sensors 15, no. 7: 15363-15397. https://doi.org/10.3390/s150715363