1. Introduction
The extensive use of pesticides for agricultural and non-agricultural purposes means that it is almost impossible to avoid daily exposure to a number of pesticides contained in both food and water [
1,
2,
3,
4]. The triazine herbicides are among the most widely used weedkillers, as triazine herbicides such as atrazine, simazine and other triazine compounds are currently applied to corn, wheat, barley and legumes and several fruit crops for the purpose of broadleaf weed control. The European Community Directive sets a maximum admissible concentration of 0.1 µg·L
−1 for any single herbicide in water intended for human consumption. In USA, the Environmental Protection Agency (EPA) allows an upper limit of 3.0 µg·L
−1 for atrazine in drinking water. Most often, triazine residues are analyzed by chromatographic techniques, such as thin layer chromatography [
5,
6], gas-chromatography (GC) [
7,
8], liquid-chromatography (LC), or mass-spectrometry (MS) [
9,
10].
These methods are undoubted highly sensitive and routinely used in the chemical laboratory, but nevertheless these important techniques are not cheap, and they are time-consuming and not suitable for on-site analysis, as they generally require sample pre-treatment and involve complex and expensive equipment [
5,
6,
7,
8,
9,
10,
11]. On the contrary, biosensor methods (and thus also immunosensors) are usually rapid, inexpensive and suitable for
in situ analysis [
12,
13,
14,
15,
16,
17]. Therefore several enzymatic electrode-based methods for pesticide detection have been developed which utilize the inhibition of an enzyme, such as tyrosinase [
18] or butyrylcholinesterase [
19]. Our research group has worked on inhibition biosensors, in particular tyrosinase biosensors, designed to analyse triazine and benzotriazine compounds [
19,
20]. In recent years, our team has investigated the development of conventional immunosensors [
21,
22,
23,
24], or screen-printed methods [
25,
26] above all because they were found to be more selective for the different classes of pesticide. In this framework the aim of the present research was to compare the analytical features of a new SPR device with two conventional or screen-printed amperometric immunosensor devices. The k
aff values were also evaluated and compared. Lastly, these immunosensors were used to test triazine pesticides and to apply recovery tests from common real matrices such as several bovine milk samples.
3. Discussion
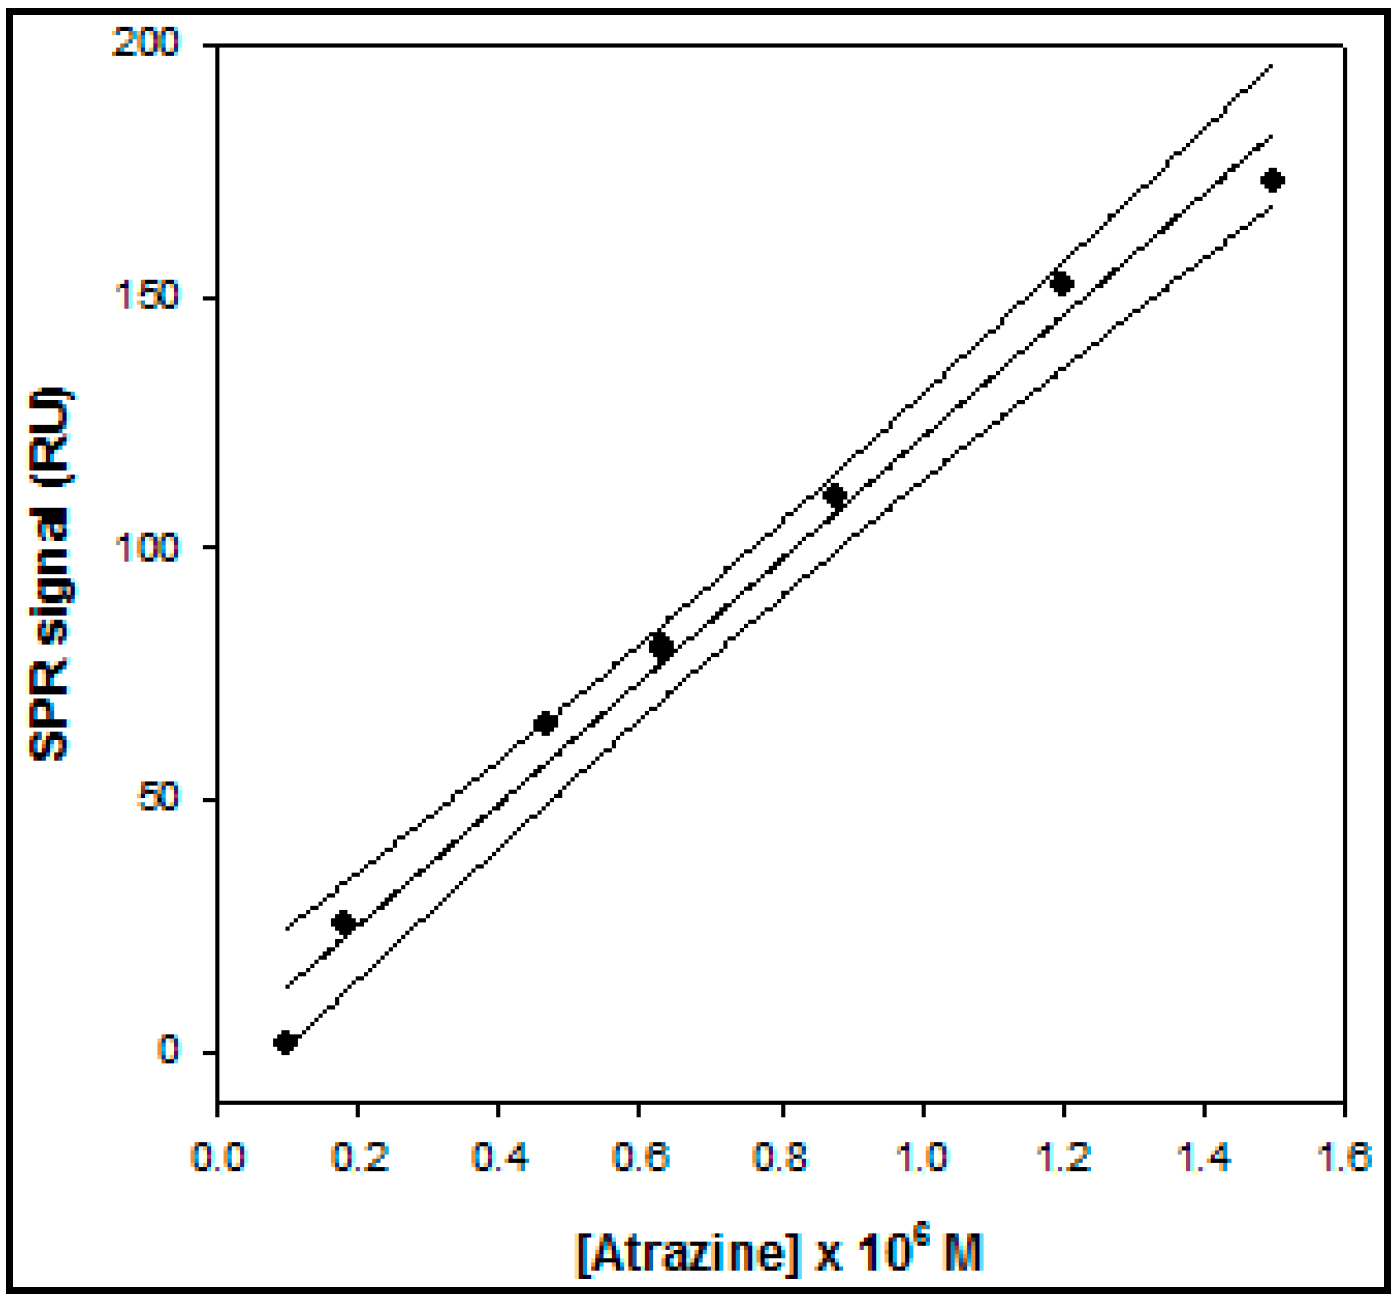
In the case of the SPR device the calibration curve for atrazine (
Figure 4) showed a linearity range of 1.0 × 10
−7 to 1.5 × 10
−6 M and with a LOD value of approximately 5 × 10
−8 M. The response of the conventional amperometric device for increasing atrazine concentration and the relative calibration curve are displayed in
Figure 5 and
Figure 6, respectively.
Figure 4.
Calibration curve, obtained by the direct method, based on Surface Plasmon Resonance (SPR), operating in flow mode, for atrazine determination.
Figure 4.
Calibration curve, obtained by the direct method, based on Surface Plasmon Resonance (SPR), operating in flow mode, for atrazine determination.
Figure 5.
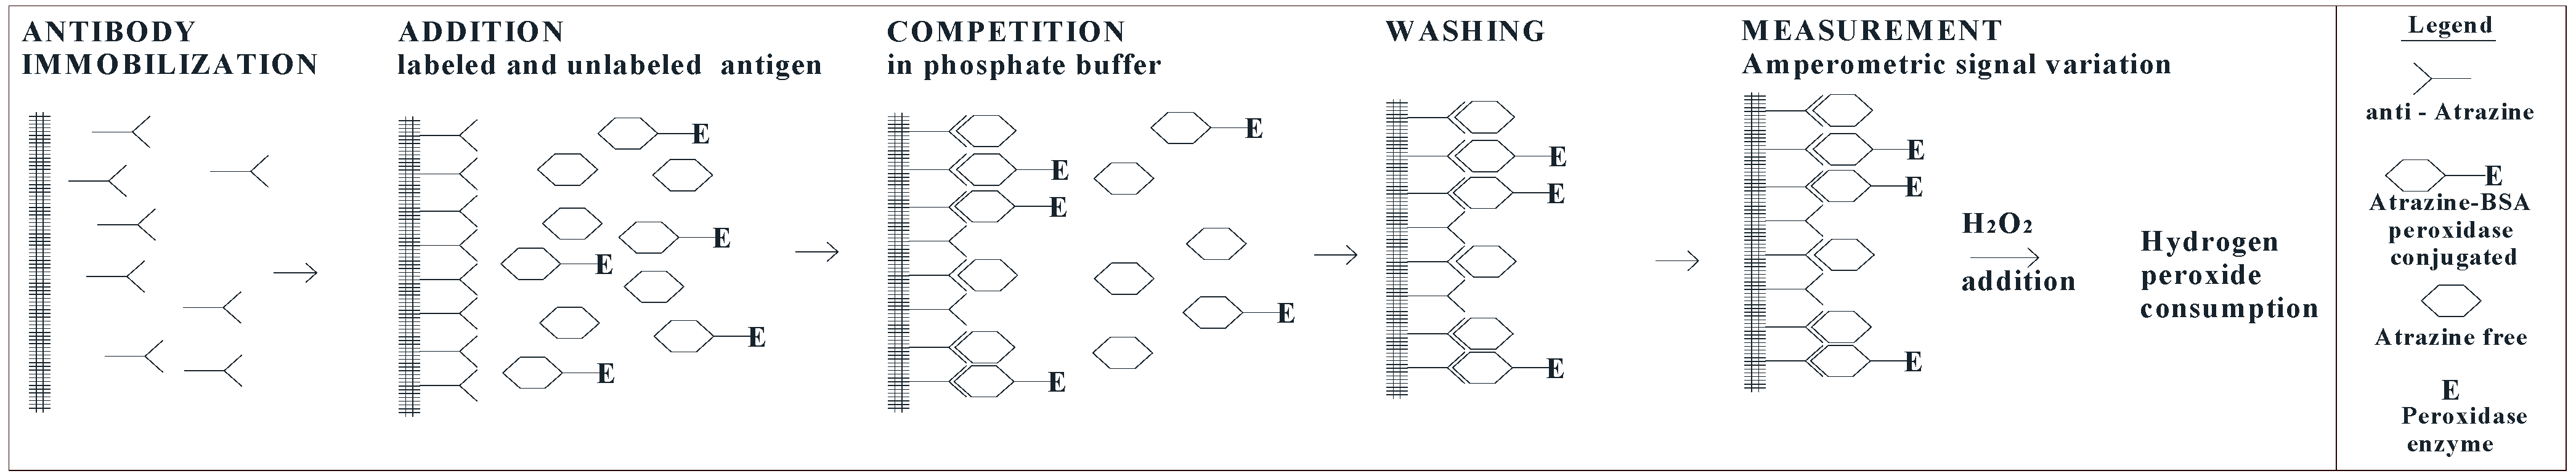
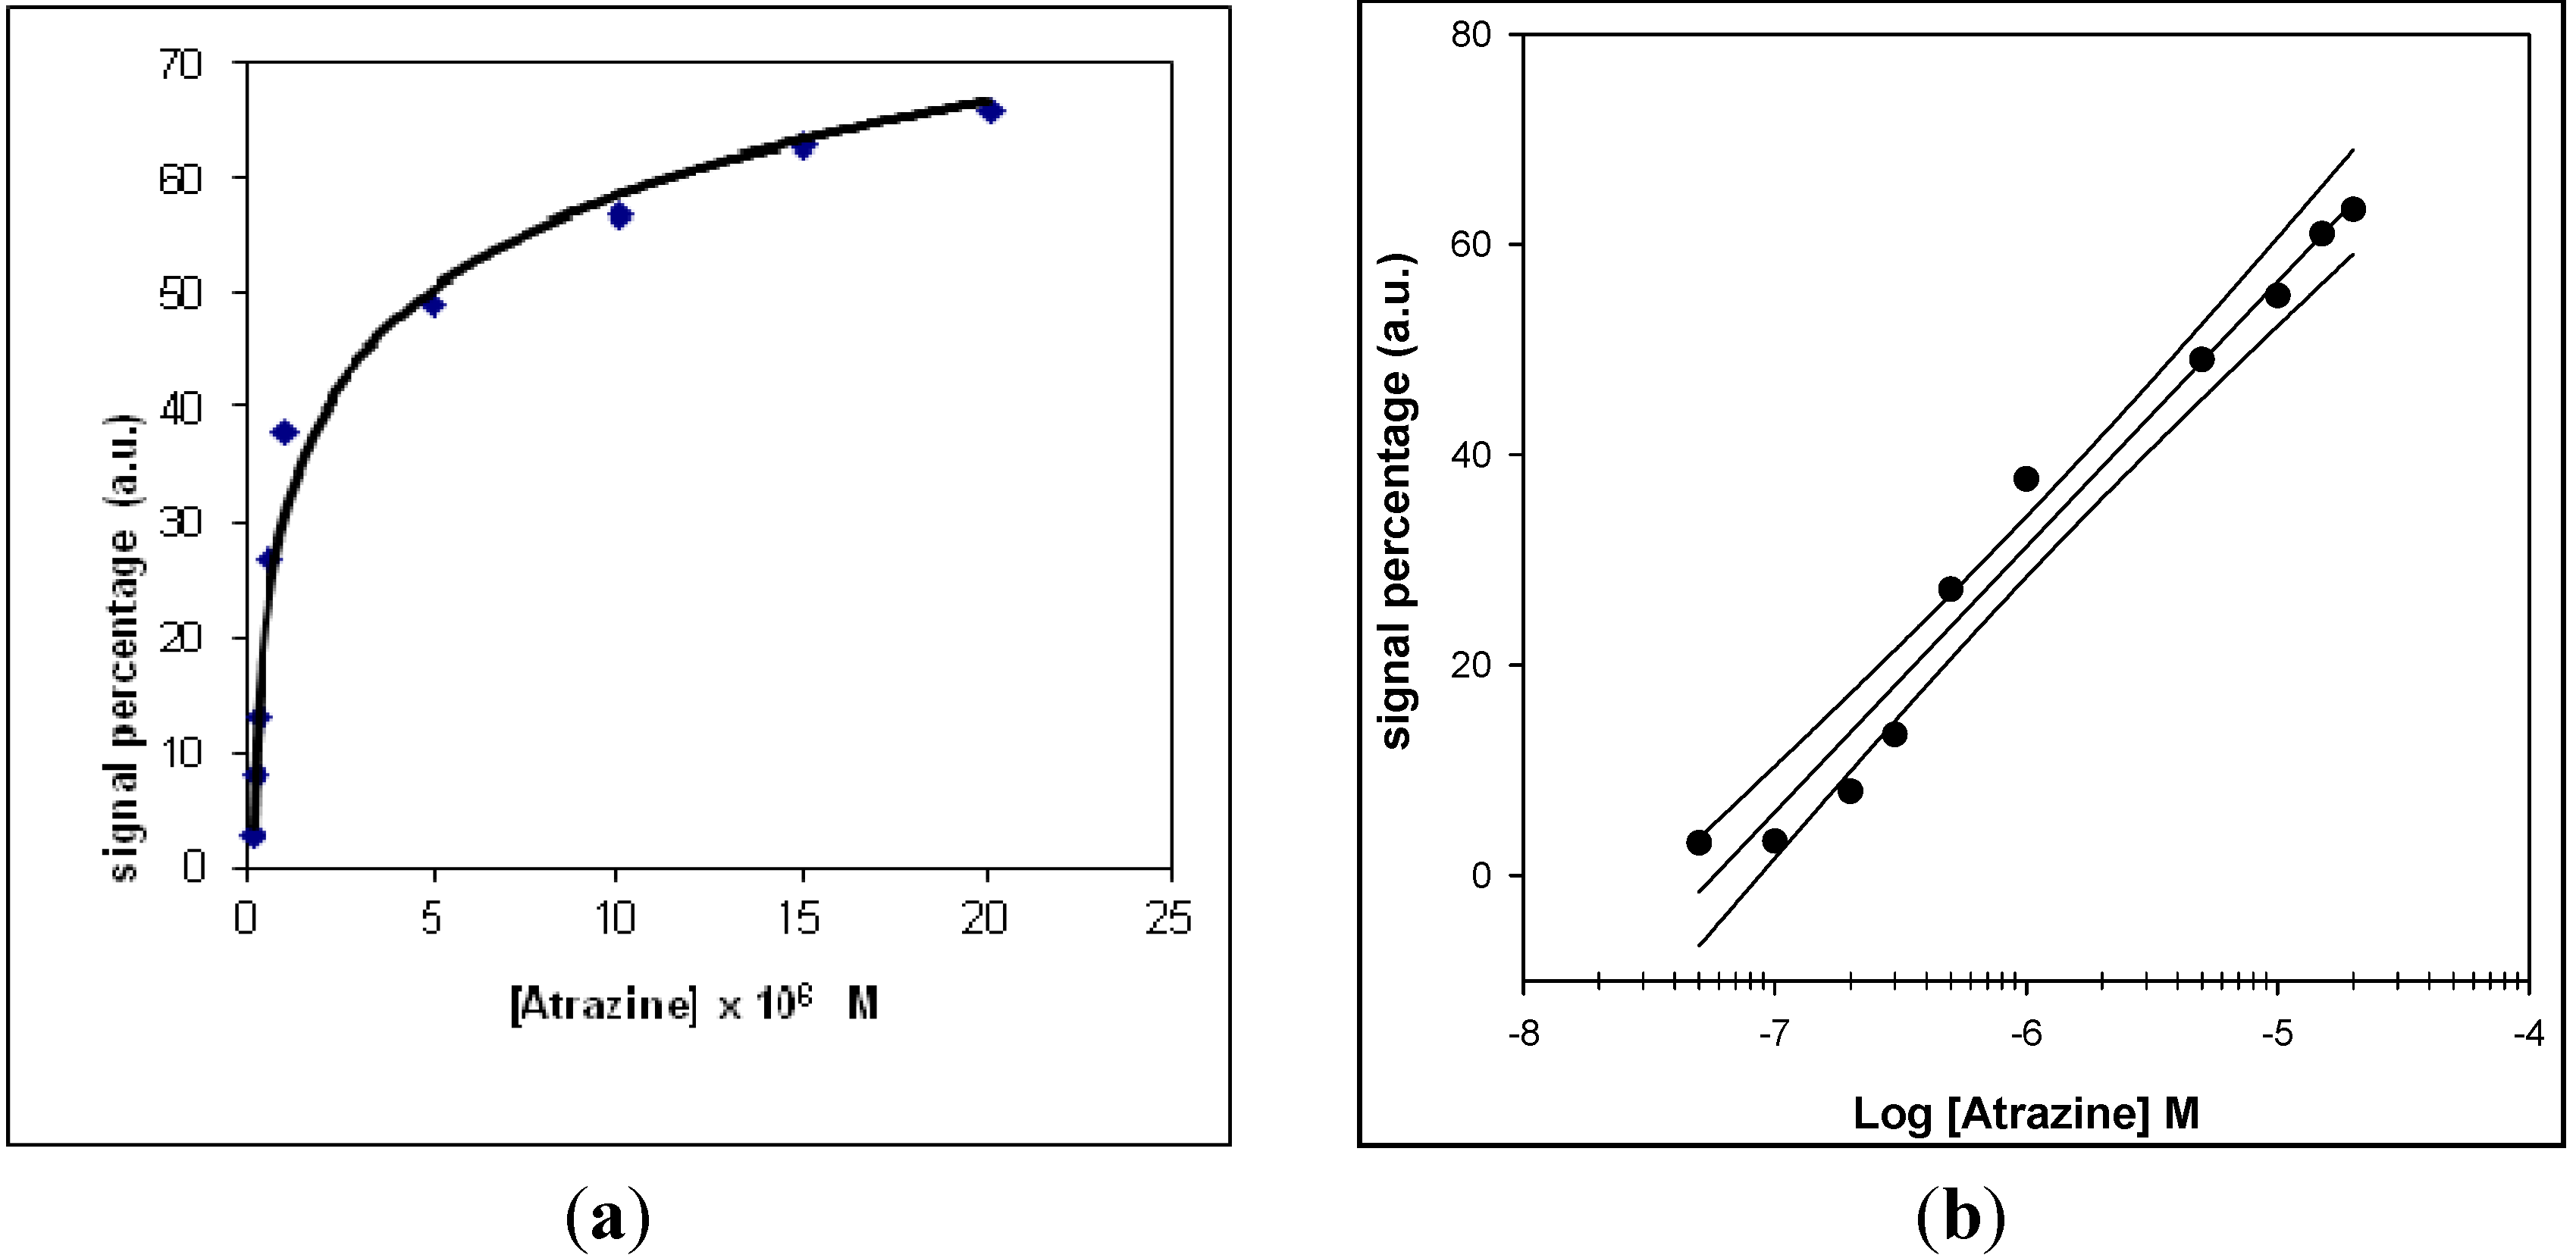
(a) Behaviour of the conventional amperometric immunosensor response as a function of increasing atrazine concentration, using an H2O2 electrode as transducer and peroxidase enzyme as marker; (b) corresponding calibration curve and confidence interval for atrazine determination, obtained using a semilogarithmic scale.
Figure 5.
(a) Behaviour of the conventional amperometric immunosensor response as a function of increasing atrazine concentration, using an H2O2 electrode as transducer and peroxidase enzyme as marker; (b) corresponding calibration curve and confidence interval for atrazine determination, obtained using a semilogarithmic scale.
Figure 6.
(a) Behaviour of the screen-printed immunosensor response as a function of increasing atrazine concentration, using peroxidase enzyme as marker and an amperometric electrode for H2O2 as transducer; (b) corresponding calibration curve and confidence interval for atrazine determination, obtained using a semilogarithmic scale.
The main analytical data, obtained using the immunosensor device and based on surface plasmon resonance were compared with those obtained using both conventional and screen-printed immunodevices (
Table 1). In this table a detailed comparison was made of the main analytical features of the new SPR devices with those of two other immunosensors, so that the advantages and disadvantages of the new SPR method could be evaluated. The linear range of the screen-printed and conventional devices was about three and five decades, respectively, and the LOD values about 10
−8 M and 5 × 10
−11 M, respectively. The linear range of the SPR device was just over one decade larger and the LOD of the same order of magnitude as that of the conventional immunosensor, although higher than that of the screen-printed device. Therefore, the most attractive aspect of the method using the SPR device was the measurement time, which was found to be about half that required in the case of the two competitive methods.
Using SPR experiment it was also possible to obtain important parameters about the kinetica of the antigen-antibody interaction. The SPR signal, during the binding process, expressed as a function of time, contains kinetic information and this allowed a full kinetic characterization of the interaction between atrazine and anti-atrazine. The binding reaction equation of antigen (A) and antibody (B) for one-to-one binding reaction can be written as:
where k
a is the association rate constant in M
−1·s
−1 and k
d is the dissociation rate constant in s
−1. K
D is the equilibrium dissociation constant and in this study it was found to be 0.48 ± 0.5 M. Based on the equilibrium dissociation constant K
D and the dissociation rate, the association rate constant can be calculated as k
a = k
d/K
D. Using nonlinear fitting of the data in the analytical response at equilibrium as a function of concentration, the k
d can be calculated. In this study, the value of k
a was found to be 7.5 ± 0.6 M
−1 s
−1 and k
d was found to be 3.59 ± 0.5 s
−1, respectively.
Table 1.
Analytical characterization of immunosensor method for atrazine determination, by SPR, conventional and screen-printed immunodevices using the direct method in the first case and competition procedure in the last two cases.
Table 1.
Analytical characterization of immunosensor method for atrazine determination, by SPR, conventional and screen-printed immunodevices using the direct method in the first case and competition procedure in the last two cases.
| Methods | Atrazine Determination by Means of SPR Immunosensor | Atrazine Determination by Means of Conventional Immunosensor | Atrazine Determination by Means of Screen-Printed Immunosensor |
|---|
| Regression equation (Y = a.u., X = M) | y = 121.0 (±6.4) + 0.8 (± 0.5) | y = 34.1 (±0.8) log x + 408.8 (±6.2) | y = 10.9 (±1.3) log x + 31.2 (±0.6) |
| level of confidence (1 − α) = 0.95; | (n − ν) = 7; (t = 2.12) | (n − v) = 16; (t = 2.12) | (n − v) = 8; (t = 2.78) |
| Linear range (M) | 1.0 × 10⁻⁷–1.5 × 10⁻⁶ | 1.0 × 10⁻¹⁰–2.8 × 10⁻⁵ | 5.0 × 10⁻⁸–2.0 × 10⁻⁵ |
| Correlation coefficient (R2) | 0.9857 | 0.9891 | 0.9736 |
| Repeatability of the measurement (as pooled SD %) | 5.5 | 5.3 | 7.2 |
| Low detection limit (LOD) (M) | 5.3 × 10⁻⁸ | 5.0 × 10⁻¹¹ | 2.3 × 10⁻⁸ |
| Analysis time | ≈1 h | ≈1 h | ≈25 min |
In
Table 2 a comparison between the selectivity toward several triazine and non triazine pesticides both for the conventional and the screen-printed and SPR immunosensors is shown. The chemical structure of several compounds belonging to the triazine pesticide group is very similar (several triazine pesticides have structural formulae similar to that of the atrazine), so that considering the selectivity of SPR device, the atrazine antibody used in the present research displays the best reactivity to atrazine (100%), but also a considerable level of reactivity toward simazine (≈90%), atrazine-desethyl (≈40%) and a little lower toward azinphos-ethyl (≈15%), whereas toward pesticides of the carbamate group such as carbaryl and aldicarb, it was only about 12%. Lastly, the reactivity toward pesticides with a completely different structure, such as 2,4-D, was almost negligible, as may be inferred from the data also set out in
Table 2.
Table 2.
Comparison of selectivity, (%) response to different pesticides both by SPR method and conventional or screen-printed immunosensors. Response to atrazine was taken as 100%.
Table 2.
Comparison of selectivity, (%) response to different pesticides both by SPR method and conventional or screen-printed immunosensors. Response to atrazine was taken as 100%.
| Compound | % Response of SPR Device | % Response of Conventional Immunosensor | % Response of Screen-Printed Immunosensor |
|---|
| Atrazine | 100.0 | 100.0 | 100.0 |
| Simazine | 90.0 | 87.5 | 85.0 |
| Atrazine-desethyl | 40.0 | 42.6 | / |
| Azinphos-ethyl | 15.0 | 9.7 | 12.8 |
| 2,4-D | 8.0 | 28.0 | 20.0 |
| Carbaryl | 5.0 | 3.0 | 8.5 |
| Aldicarb | 5.0 | 2.0 | / |
The same table also shows how selectivity towards pesticides of the triazine class does not differ appreciably in the case of the other immunosensors, which are however less selective toward 2,4-D (reactivity in this case is of the order of 20%–28%). On the other hand, the k
aff values obtained using the conventional, screen-printed and SPR immunosensor methods (see
Table 3) are in all cases of the order of 10
6 M
−1, that is, comparable in value.
Table 3.
IC50 and kaff values obtained using three different immunosensors.
Table 3.
IC50 and kaff values obtained using three different immunosensors.
| Method | IC50 n = 5; RSD% ≤ 5 (M) | kaff n = 5; RSD% ≤ 5 (M−1) |
|---|
| Surface plasmon resonance in flow | 8.0 × 10⁻⁷ | 1.25 × 10⁶ |
| Conventional immunosensor | 6.5 × 10⁻⁷ | 1.54 × 10⁶ |
| Screen printed immunosensor | 1.0 × 10⁻⁶ | 1.00 × 10⁶ |
Lastly some applications and comparisons were carried out on real samples, checking for triazine pesticides in bovine milk samples. In
Figure 7, a typical measurement recorded for the detection of atrazine in bovine milk by SPR detection is reported as an example. The dashed curve and the dotted curve were obtained simultaneously using the two-channel BioSuplar 400, running suitably diluted raw milk through the first channel (dotted curve) and milk fortified with atrazine through the second channel (dashed curve); the unbroken curve represents the difference between the two signals. As can be seen, after stabilization for about 10 min, the sample addition produces a signal increase in both cases but which is much more pronounced for the fortified sample. The successive washing with buffer leads to a signal decrease down to baseline only in the case of raw milk, which indicates the absence of atrazine in the raw sample, while in the case of the fortified sample the signal attains a constant value higher than the baseline, as expected, taking into account that atrazine stably binds to the antibody immobilized on the sensor chip; this enables this pesticide to be detected and quantified in the real sample.
Figure 7.
Typical measurement recorded for the detection of atrazine in bovine milk by SPR device. Arrows indicated the measurement format.
Figure 7.
Typical measurement recorded for the detection of atrazine in bovine milk by SPR device. Arrows indicated the measurement format.
Six different commercial bovine samples were analyzed for triazinic pesticides concentration using the SPR immunosensor method. In all cases the triazine pesticide concentration level was found lower than the LOD of the method, i.e., 5 × 10⁻⁸ M, or 5 × 10⁻¹¹ M, according by the used methods.
The absence of triazine pesticides at a concentration higher than 5 × 10⁻⁸ M in all the commercial milk samples tested was also corroborated by the measurements performed using the other two immunosensors.
Several recovery tests, performed on bovine milk samples using both SPR and conventional or screen-printed amperometric immunosensors performed on all six milk samples, are reported in
Table 4,
Table 5 and
Table 6. Recovery tests were first carried out on the same bovine milk samples spiked only with atrazine. The results of experimental atrazine “recovery” tests obtained using the SPR device are summarized in
Table 4, while the results of several different triazinic pesticide “recovery” tests were reported in
Table 5.
Table 4.
Atrazine recoveries from spiked samples of bovine milk using the SPR immunosensor and the direct method.
Table 4.
Atrazine recoveries from spiked samples of bovine milk using the SPR immunosensor and the direct method.
| Milk Sample Number | Found Atrazine Concentration (M) (n ≥ 3) | Pesticide Added in Bovine Milk | Total Concentration Value after Spiking (M) | Experimental Conc. Value (M) ± SD (n ≥ 3) | % Recovery |
|---|
| 1 | <5.0 × 10⁻⁸ | Atrazine | 1.89 × 10⁻⁷ | (1.89 ± 0.03) × 10−7 | 100.0% |
| 2 | <5.0 × 10⁻⁸ | Atrazine | 1.89 × 10⁻⁷ | (2.01 ± 0.02) × 10−7 | 103.3% |
| 3 | <5.0 × 10⁻⁸ | Atrazine | 2.64 × 10⁻⁷ | (2.40 ± 0.03) × 10−7 | 94.9% |
Table 5.
Recovery data of different triazine pesticides from spiked samples of bovine milk using the SPR immunosensor and the direct method.
Table 5.
Recovery data of different triazine pesticides from spiked samples of bovine milk using the SPR immunosensor and the direct method.
| Milk Sample Number | Found Pesticide Concentration (M) (n ≥ 3) | Pesticide Added in Bovine Milk | Total Concentration Value after Spiking (M) | Experimental Conc. Value (M) ± SD (n ≥ 3) | % Recovery |
|---|
| 4 | <5.0 × 10⁻⁸ | Simazine | 3.00 × 10⁻⁷ | (2.85 ± 0.03) × 10−7 | 95.8 |
| 5 | <5.0 × 10⁻⁸ | Atrazine-desethyl | 3.00 × 10⁻⁷ | (2.79 ± 0.02) × 10−7 | 93.0 |
| 6 | <5.0 × 10⁻⁸ | Azinphos-ethyl | 3.00 × 10⁻⁷ | (2.73 ± 0.03) × 10−7 | 92.6 |
Table 6.
Some pesticide recoveries from spiked samples of bovine milk using the conventional (a) and screen-printed (b) amperometric immunosensors and the competitive format illustrated in
Figure 3.
Table 6.
Some pesticide recoveries from spiked samples of bovine milk using the conventional (a) and screen-printed (b) amperometric immunosensors and the competitive format illustrated in Figure 3.
| Milk Sample Number | Method | Found Pesticide Concentration (M) (n ≥ 3) | Pesticide Added in Bovine Milk | Total Conc. Value after Spiking (M) | Experimental Conc. Value (M) ± SD (n ≥ 3) | % Recovery |
|---|
| 1 | (a) | <5.0 × 10⁻¹¹ | Atrazine | 10.0 × 10⁻⁸ | (9.8 ± 0.10) × 10−8 | 98.5% |
| 2 | (a) | <5.0 × 10⁻¹¹ | Simazine | 10.0 × 10⁻⁸ | (9.7 ± 0.12) × 10−8 | 97.3% |
| 3 | (a) | <5.0 ×10⁻¹¹ | Atrazine-desethyl | 10.0 × 10⁻⁸ | (9.4 ± 0.25) × 10−8 | 94.4% |
| 4 | (a) | <5.0 × 10⁻¹¹ | Azinphos-ethyl | 10.0 × 10⁻⁸ | (9.3 ± 0.10) × 10−8 | 93.3% |
| 5 | (b) | <2.5 × 10⁻⁸ | Atrazine | 10.0 × 10⁻⁸ | (9.6 ± 0.10) × 10−8 | 96.5% |
| 6 | (b) | <2.5 × 10⁻⁸ | Simazine | 10.0 × 10⁻⁸ | (9.8 ± 0.13) × 10−8 | 98.3% |
Examination of the data obtained indicates that the average recovery generally lies between 103.3% and 94.9% for the atrazine, and 95.8% and 92.6% for other triazinic pesticides in the samples tested. Recovery tests involving the same triazine pesticides were then carried out on the same bovine milk samples but using the conventional and screen-printed immunosensors. Results are summarized in
Table 6. In short, satisfactory results were obtained in all the tests; indeed the data obtained indicate that the average recovery is generally between 98.5% and 93.3% for all the triazine pesticides in the samples tested.
4. Materials and Methods
4.1. Samples
All six different samples of commercial fresh bovine milk were purchased in a local supermarket and analyzed without treatment, except (where necessary) for possible dilution with distilled deionized water.
4.2. Reagents and Materials
Anti-atrazine monoclonal antibody and atrazine carboxy derivatives were provided by Eremin (Department of Chemical Enzymology, Faculty of Chemistry, Moscow State University, Russia). 1-Chloro-3-ethylamino-5-isopropylamino-2,4,6-triazine (atrazine), 2-chloro-4-ethylamino-6-isopropyl-amino-1,3,5-triazine (atrazine-desethyl), 6-chloro-N,N’-diethyl-1,3,5-triazine-2,4-diamine (simazine), 3-(diethoxyphosphinothioylsulfanylmethyl)-1,2,3-benzotriazin-4-one (i.e., azinphos-ethyl), 2-methyl-2-(methylthio)propanal (aldicarb) and 1-naphthylmethylcarbamate (or carbaryl) were provided by Pestanal Sigma-Aldrich (St. Louis, MO, USA). Potassium chloride, hydrogen peroxide 30% (w/v); dibasic and monobasic anhydrous potassium phosphate RPE, chloroform PE, dichloromethane RPE and diethylether RPE were supplied by Carlo Erba Reagents (Milan, Italy). Ny+ Immobilon Affinity membrane (porosity 0.65 µm) was provided by the Millipore Corporation (catalog number INYC08550; New York, NY, USA).
4.3. Materials for SPR Measurements
Monobasic sodium phosphate, dibasic sodium phosphate, potassium chloride, sodium chloride, 1,1-mercaptoundecanoic acid (MUA) (95%), N-(3-dimethylaminopropyl)-N'-ethylcarbodiimide hydrochloride (EDC, commercial grade), N-hydroxysuccinimide (NHS, 98%) were purchased from Sigma-Aldrich. All solutions were prepared using ultrapure deionized water (resistance: 18.2 mΩ × cm at 25 °C; TOC < 10 g·mL−1) obtained using a Direct-Q UV3 Merck Millipore system (Billerica, MA, USA).
4.4. Apparatus for SPR Measurements
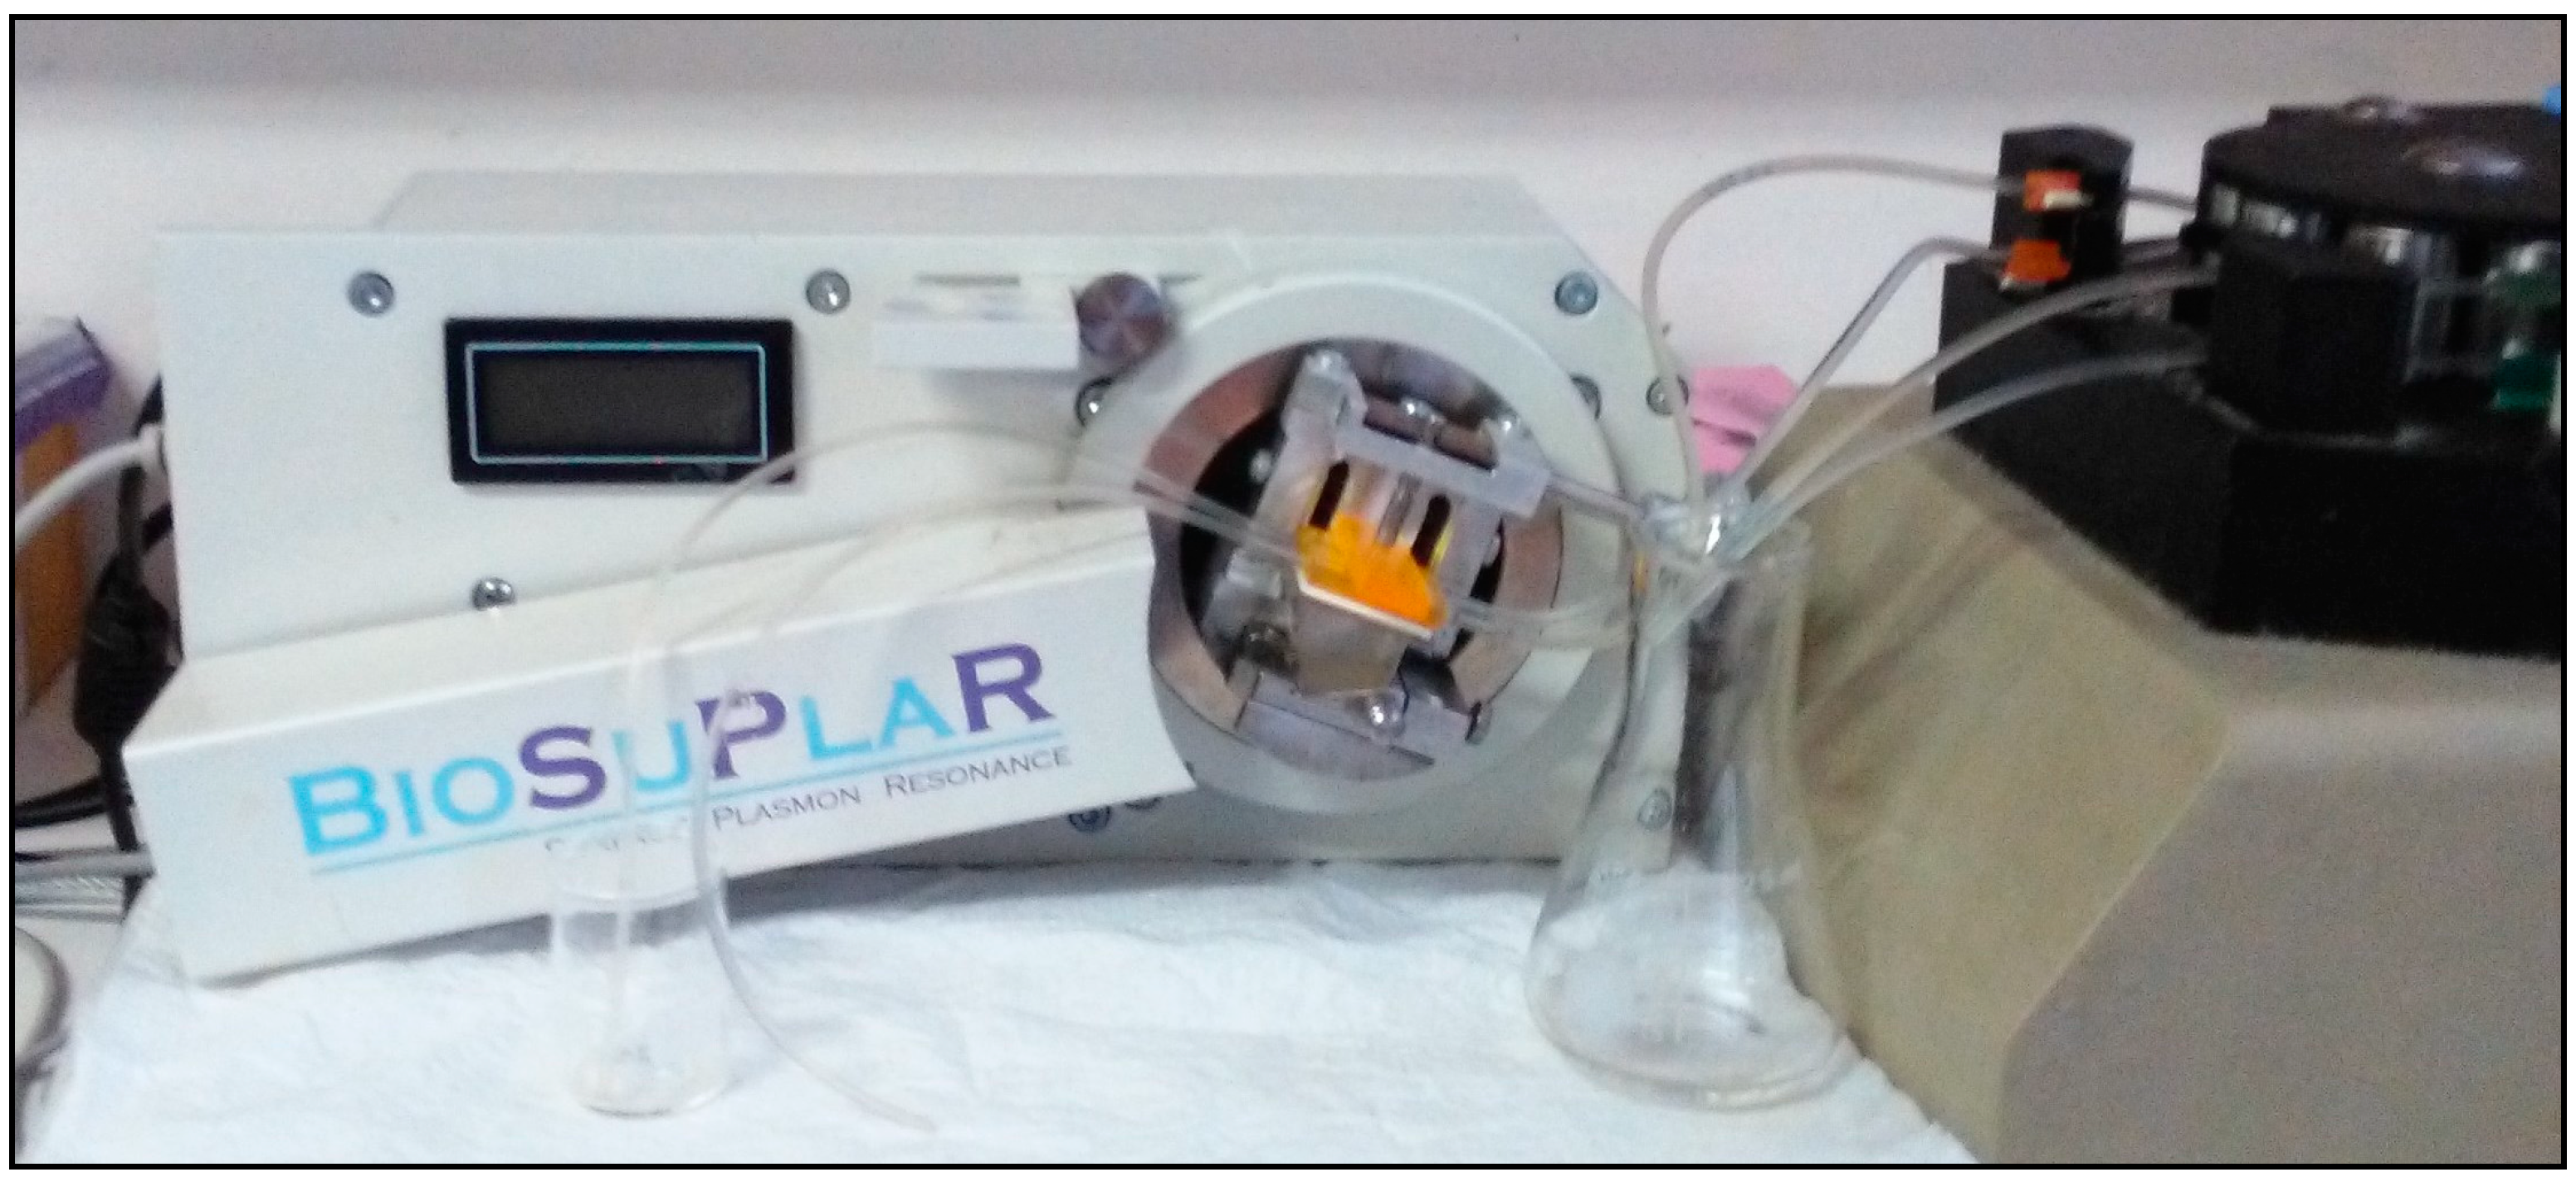
The Sensordisc AU bare gold disks for SPR analysis was purchased from XanTec Bioanalytics GmbH (Duesseldorf, Germany). For the SPR measurements, performed using the flow operating mode (see
Figure 1), a BioSuplar 400T (Analytical µ-Systems—Dep. of Mivitec GmbH, Sinzing, Germany), was used.
4.5. Apparatus for Conventional and Screen-Printed Immunosensors
For triazine pesticide analysis a mod. 551 VADetector Amel srl (Milan, Italy) potentiostat was used connected to an amperometric hydrogen peroxide electrode from Universal Sensor Inc., (New Orleans, LA, USA), Mod. 4006a and to a mod. d51262 Omniscribe (by Bausch & Lomb Incorporated, Rochester, UK) analog recorder. The test solution was contained in a thermostated cell at 23 °C and under constant magnetic stirring by an Amel srl mod. 291/lf apparatus.
For the amperometric screen printed measurements a wafer made of corundum ceramic was used as support and both working and counter electrodes were made of platinum. A Pt working electrode was modified with electrodeposited Prussian Blue, thus enabling H2O2 amperometric detection when polarized at 0 mV vs. Ag/AgCl/Cl− reference electrode. At the end of the sensor there was a contacting field connected to the active part by silver conducting paths, which were covered by a dielectric protection layer, while the bio-chemically active antibody immobilized on the Immobilon membrane was fixed to the working electrode of the sensor. The response of the screen-printed device increasing atrazine concentration was recorded.
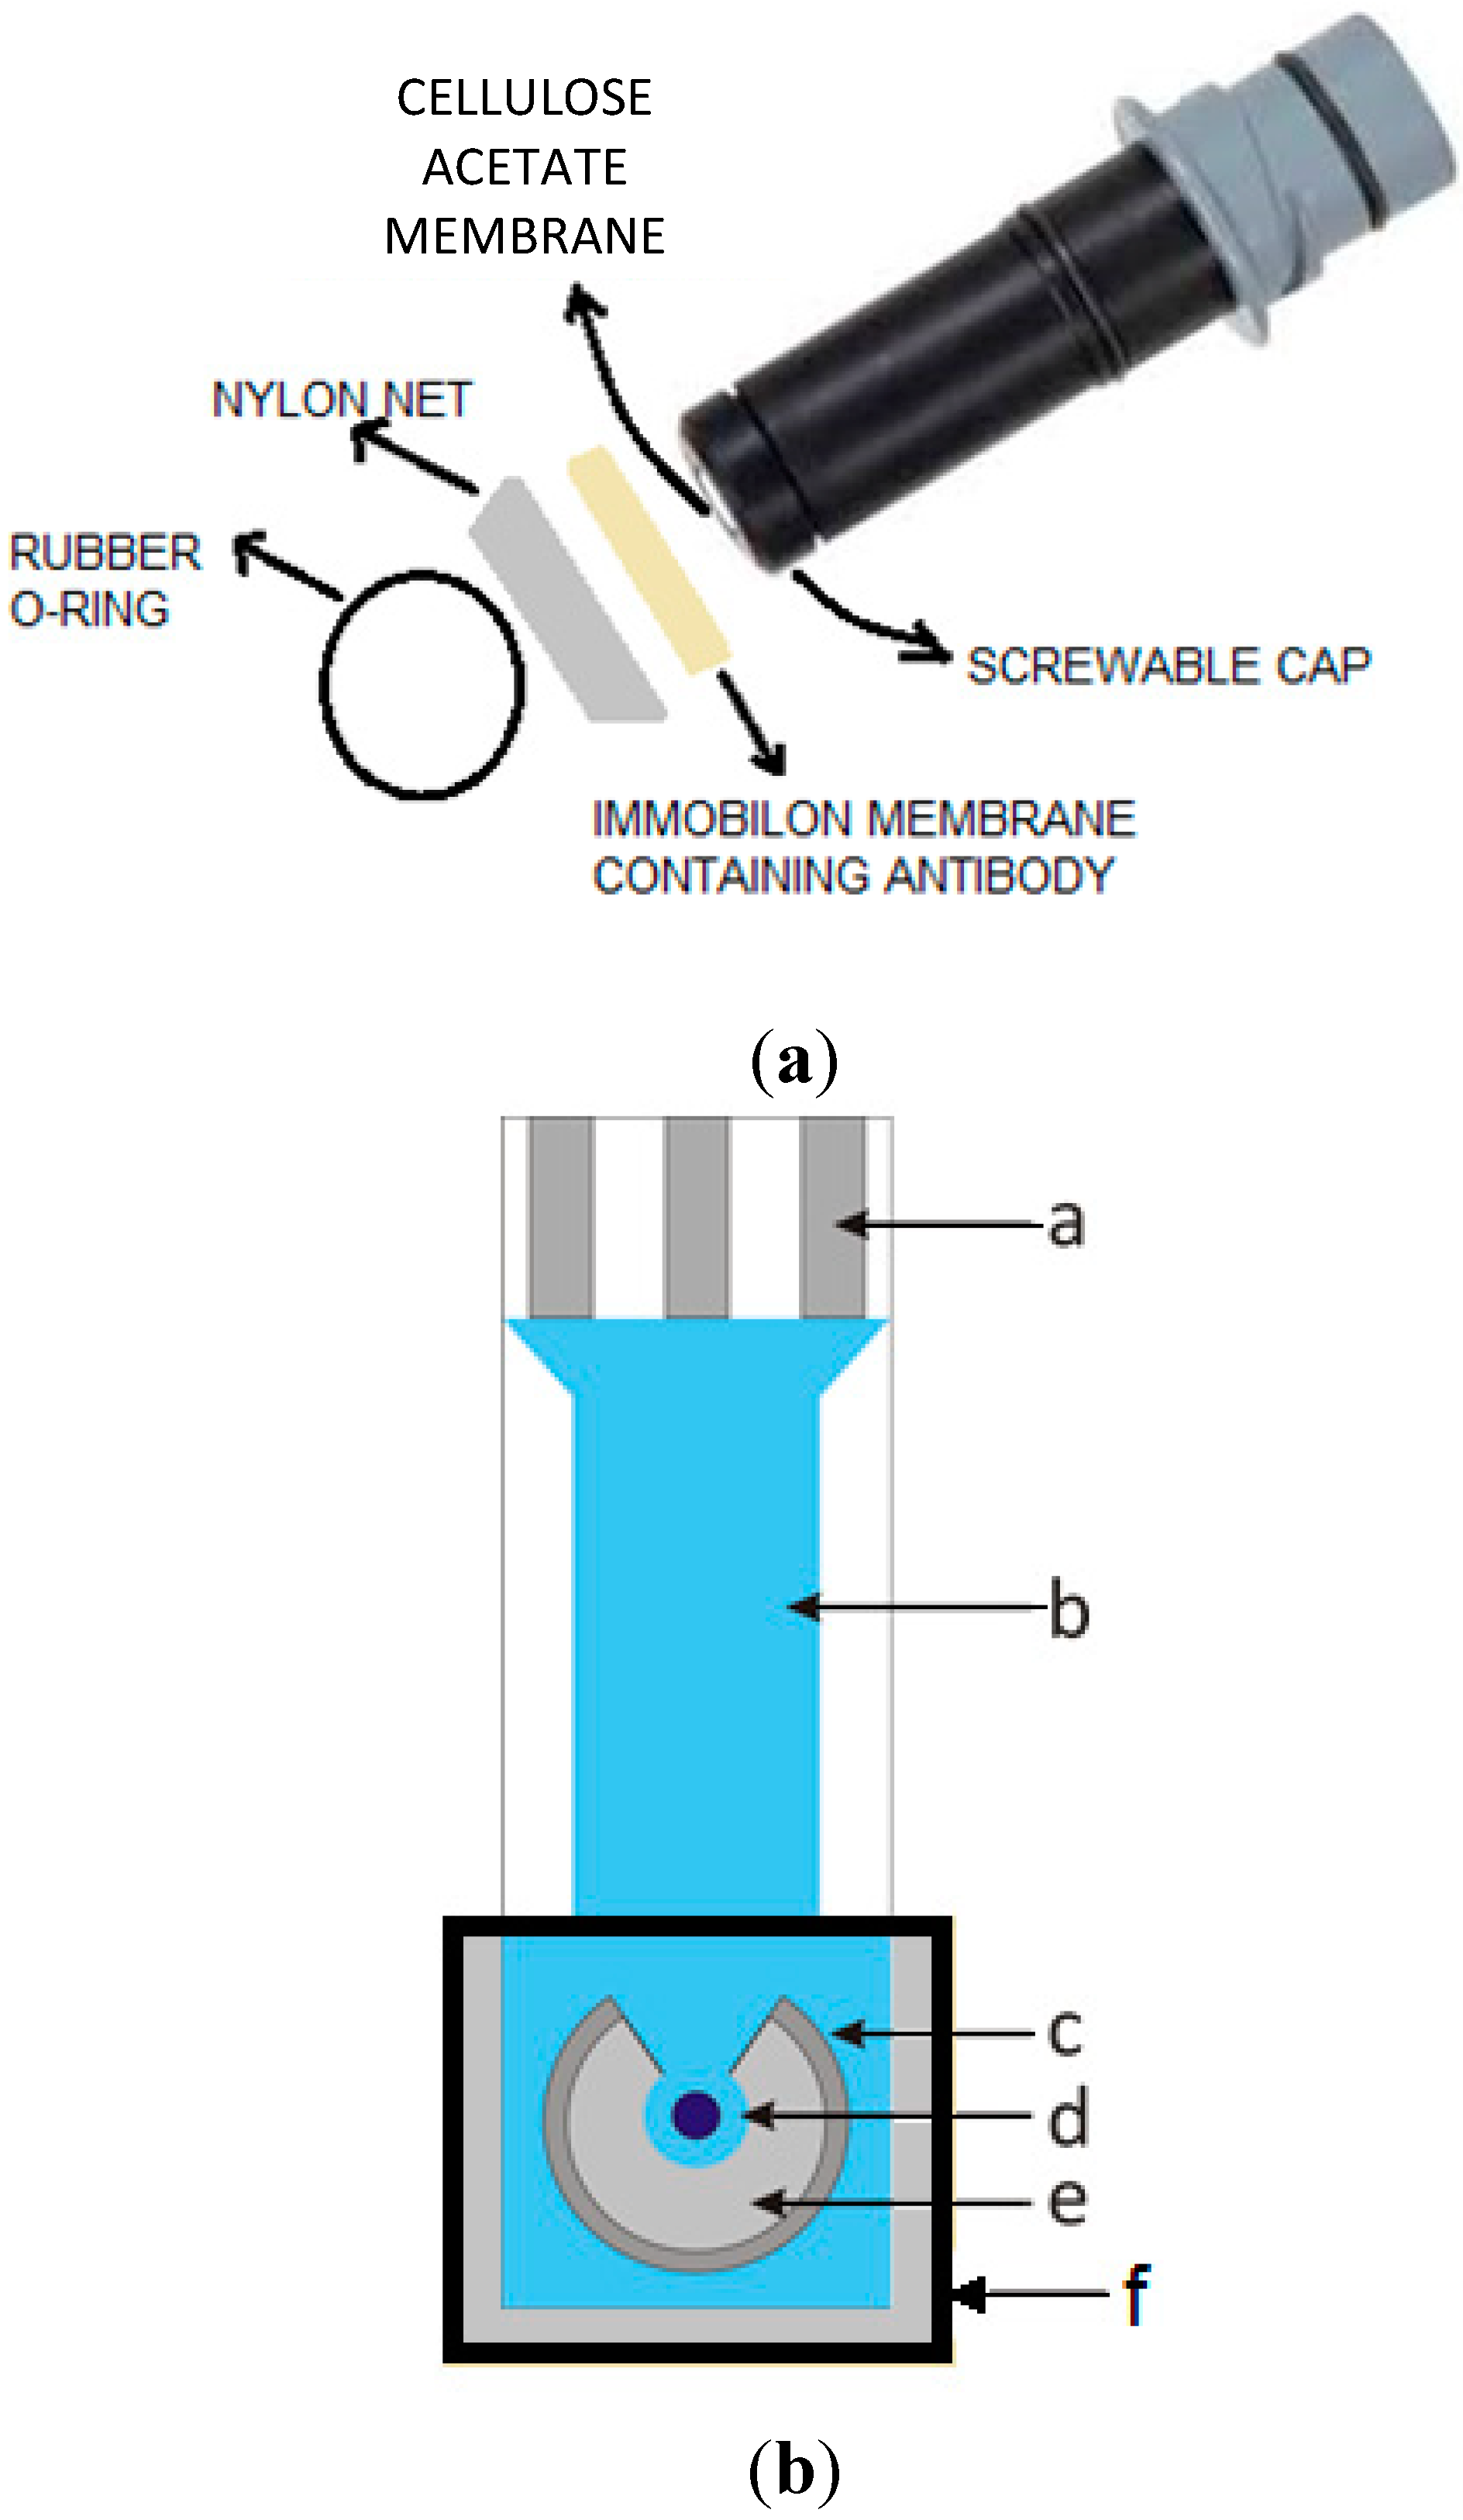
For screenprinted measurements an amperometric screenprinted transducer, fabricated as shown in
Figure 2b and with Pt working electrode modified by electrodeposited Prussian Blue polarized at +0.0 mV
vs. reference electrode Ag/AgCl/Cl
−, was purchased from BVT Technologies (Praha, Czech Republic), and connected for the measurements to a PalmSens Electrochemical Interface (PalmSens BV, Utrecht, The Netherlands). The hydrogen peroxide screen-printed electrode employed was modified using an Immobilon membrane (containing the immobilized anti-atrazine antibody) in close contact with the surface of the electrode itself [
25,
26].
4.6. Biotinylation Materials
The biotinylation kit, supplied by Sigma Immunochemicals (St. Louis, MO, USA), was composed of biotinylation Reagent (BAC-SulfoNHS, namely biotinamido hexanoic acid 3-sulfo-N-hydroxysuccinide ester), 5 M sodium chloride solution, micro-spin column (2 mL; in practice, a small empty cylindrical vessel prepackaged with Sephadex G-50), 0.1 M sodium phosphate buffer pH 7.2, 0.01 M phosphate buffer saline (PBS) pH 7.4 (reconstituted with 1 L of deionized water to give 0.01 M phosphate buffer, 0.138 M NaCl, 2.7 mM KCl, pH 7.4); and ExtrAvidin® peroxidase (containing 0.2 mL of ExtrAvidin Peroxidase conjugate at 2.0 mg·mL−1, supplied with 0.01% thimerosal). Dialysis membrane (art. D-9777), 1-ethyl-3 (3-dimethylaminopropyl) carbodiimide, albumin (from bovine serum) (BSA) and TRIS (hydroxymethyl-aminomethane) and TWEEN® 20 provided by Sigma Aldrich.


 ,
, 


