
Wavelength-Adaptive Dehazing Using Histogram Merging-Based Classification for UAV Images


Abstract
: Since incoming light to an unmanned aerial vehicle (UAV) platform can be scattered by haze and dust in the atmosphere, the acquired image loses the original color and brightness of the subject. Enhancement of hazy images is an important task in improving the visibility of various UAV images. This paper presents a spatially-adaptive dehazing algorithm that merges color histograms with consideration of the wavelength-dependent atmospheric turbidity. Based on the wavelength-adaptive hazy image acquisition model, the proposed dehazing algorithm consists of three steps: (i) image segmentation based on geometric classes; (ii) generation of the context-adaptive transmission map; and (iii) intensity transformation for enhancing a hazy UAV image. The major contribution of the research is a novel hazy UAV image degradation model by considering the wavelength of light sources. In addition, the proposed transmission map provides a theoretical basis to differentiate visually important regions from others based on the turbidity and merged classification results.1. Introduction
Acquisition of high-quality images is an important issue in securing visual information of unmanned aerial vehicle (UAV) platforms. However, most UAV images are subject to atmospheric degradation. Among various factors of image degradation, haze or fog in the atmosphere results in color distortion, which can lead to erroneous analysis of important object regions. In reviewing the literature, dark channel prior-based defogging methods are first analyzed. We then address issues of the limitations and problems of the dark channel prior-based methods and justify the need of the wavelength-adaptive model of hazy image formulation.
A major approach to dehazing utilizes the dark channel prior that decomposes an image into the hazy and haze-free regions. The dark channel prior is a kind of statistics of the haze-free outdoor images. It is based on the assumption that most local patches in a haze-free outdoor image contain some pixels that have very low intensities in at least one color channel [1]. In order to solve the color distortion problem of He's method, Yoon et al. proposed an edge-based dark channel prior and corrected color distortion using gradient-based tone mapping [2]. Xie et al. used a combined bilateral and denoising filter to generate the transmission map [3]. Gao et al. further reduced halo effects using a guided filter and applied the maximum visibility to control the turbidity [4]. Park applied the weighted least squares-based edge-preserving smoothing filter to the dark channel prior and performed multi-scale tone manipulation [5]. Kil et al. combined the dark channel prior and local contrast enhancement to remove haze and correct color at the same time [6]. Yeh et al. proposed a fast dehazing algorithm by analyzing the haze density based on pixel-level dark and bright channel priors [7]. He et al. extended their original work by introducing the atmospheric point spread function to restore sharper dehazed images [8]. Shi estimated the amount of hazy components by detecting the sky region using the dark channel prior [9]. Although the proposed method shares a similar framework with Shi's method, it detects the sky region using various features instead of the dark channel prior. In addition, wavelength-adaptive enhancement is another contribution of the proposed work. Long et al. proposed an improved dehazing algorithm using the dark channel prior and a low-pass Gaussian filter for remote sensing images [10].
Although the dark channel prior has played an important role in various dehazing algorithms, the related methods suffer from color distortion and edge degradation, since they do not consider the wavelength characteristics in the image degradation model. In order to solve these problems, there were various dehazing algorithms without using the dark channel prior. Narasimhan et al. acquired two differently-exposed images for the same scene to estimate the amount of light penetration and the depth [11,12]. Shwartz et al. used two differently-polarized filters to reduce the polarized hazy component [13]. The use of two images makes these algorithms computationally expensive and impossible to be implemented in real-time. Schechner et al. proved that noise is amplified in a distant object region, because of the low transmission ratio [14]. Fattal measured the reflection ratio and performed dehazing under the assumption that directions of reflection should be identical at the same location [15]. Tan observed that the amount of haze or fog and contrast depend on the distance from the camera [16], and Kratz estimated statistically-independent components of image albedo and distance using Markov random fields [17]. Although three-dimensional (3D) geometry provides more reliable intensity of haze or fog, the related algorithms cannot be implemented in real-time video systems, because of the complex geometric transformation steps. Additional dehazing algorithms based on physical characteristics of haze or geometric information of the imaging process were proposed in [18, 19].
The third group of dehazing algorithms can be categorized as an application-specific approach. Gibson applied the dehazing algorithm before and after video compression to reduce coding artifacts [20], and Chiang utilized the characteristics of the underwater image to modify the dark channel prior and proposed a dehazing algorithm with color and wavelength correction [21]. Pei proposed a combined color correction and guided filtering to remove blue shift in the night image [22]. Wen computed the scattering and transmission factors of light in underwater images and successfully removed haze using the difference of light attenuation Yoon et al. proposed color preserved defogging algorithms by considering the wavelength dependency [23, 24].
The common challenge of existing dehazing methods includes color distortion and the associated high computational load to correct colors without considering the wavelength dependency. In order to solve this problem, we first present a wavelength-adaptive hazy UAV image degradation model, and a spatially-adaptive transmission map is generated using geometric classes and dynamic merging according to the model. The proposed wavelength-adaptive transmission removes hazy components without color distortion. As a result, the proposed algorithm needs neither additional optical equipment nor a priori distance estimation. The proposed dehazing method can significantly increase the visual quality of an atmospherically-degraded UAV image in the sense of preserving color distortion without the halo effect. Although the proposed model is established primarily for UAV images, it can be used to enhance any aerial hazy photography, video surveillance systems, driving systems and remote sensing systems.
This paper is organized as follows. Section 2 describes the wavelength-adaptive UAV image formation model, and Section 3 presents the proposed single image-based dehazing approach. Experimental results are given in Section 4, and Section 5 concludes the paper.
2. Wavelength-Adaptive UAV Image Formation Model
Rayleigh's law of atmospheric scattering provides the relationship between the scattering coefficient β and the wavelength λ, which is defined as [11]:
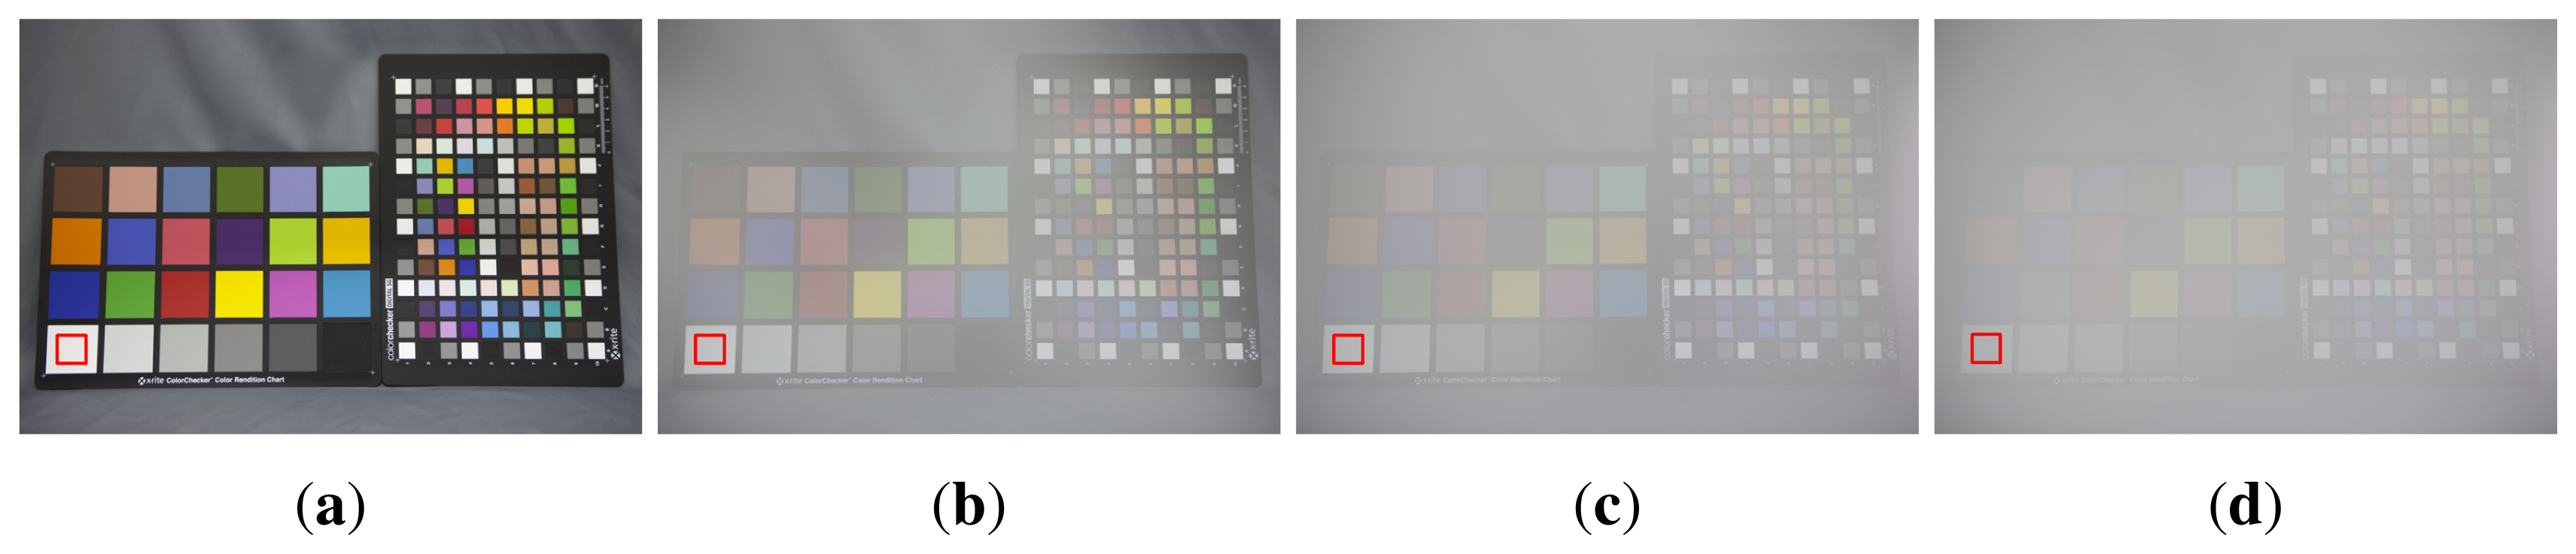
If there is a sufficiently large amount of fog or haze, the amount of scattering light is assumed to be uniform regardless of the wavelength. This assumption is proved by the simple experiment based on the theory of Narasimhan [11,12]. In order to observe the wavelength-dependent scattering, Figure 1 shows four images acquired from the same indoor scene with different turbidities generated by the different amount of steam using a humidifier.
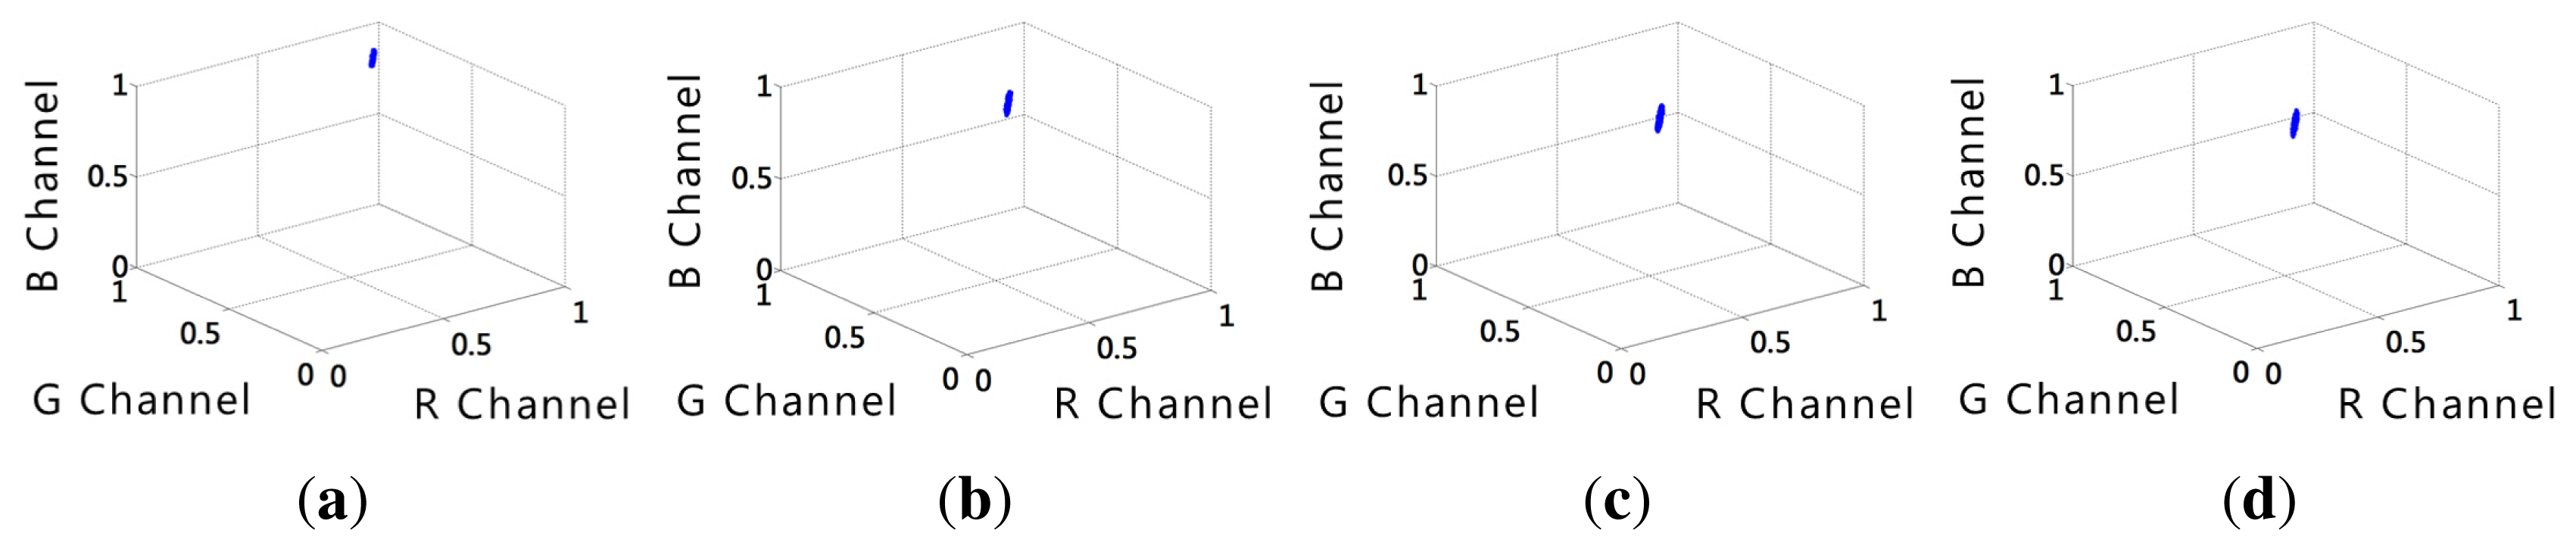
In Figure 1, the white region enclosed by the red rectangles contain the pure white color, and color distributions of the red rectangular regions in the four images were used. Theoretically, pure white regions, as shown in Figure 1a, have unity in all RGB color channels. However, the real values are not exactly the same as unity, but are close to unity because of noise. The color distribution appears as a “point” in the three-dimensional RGB space, as shown in Figure 2a. On the other hand, as the amount of haze increases in the atmosphere, the distribution becomes elongated ellipsoids, as shown in Figure 2b–d, since the turbidity of haze decreases the brightness of the object by scattering.
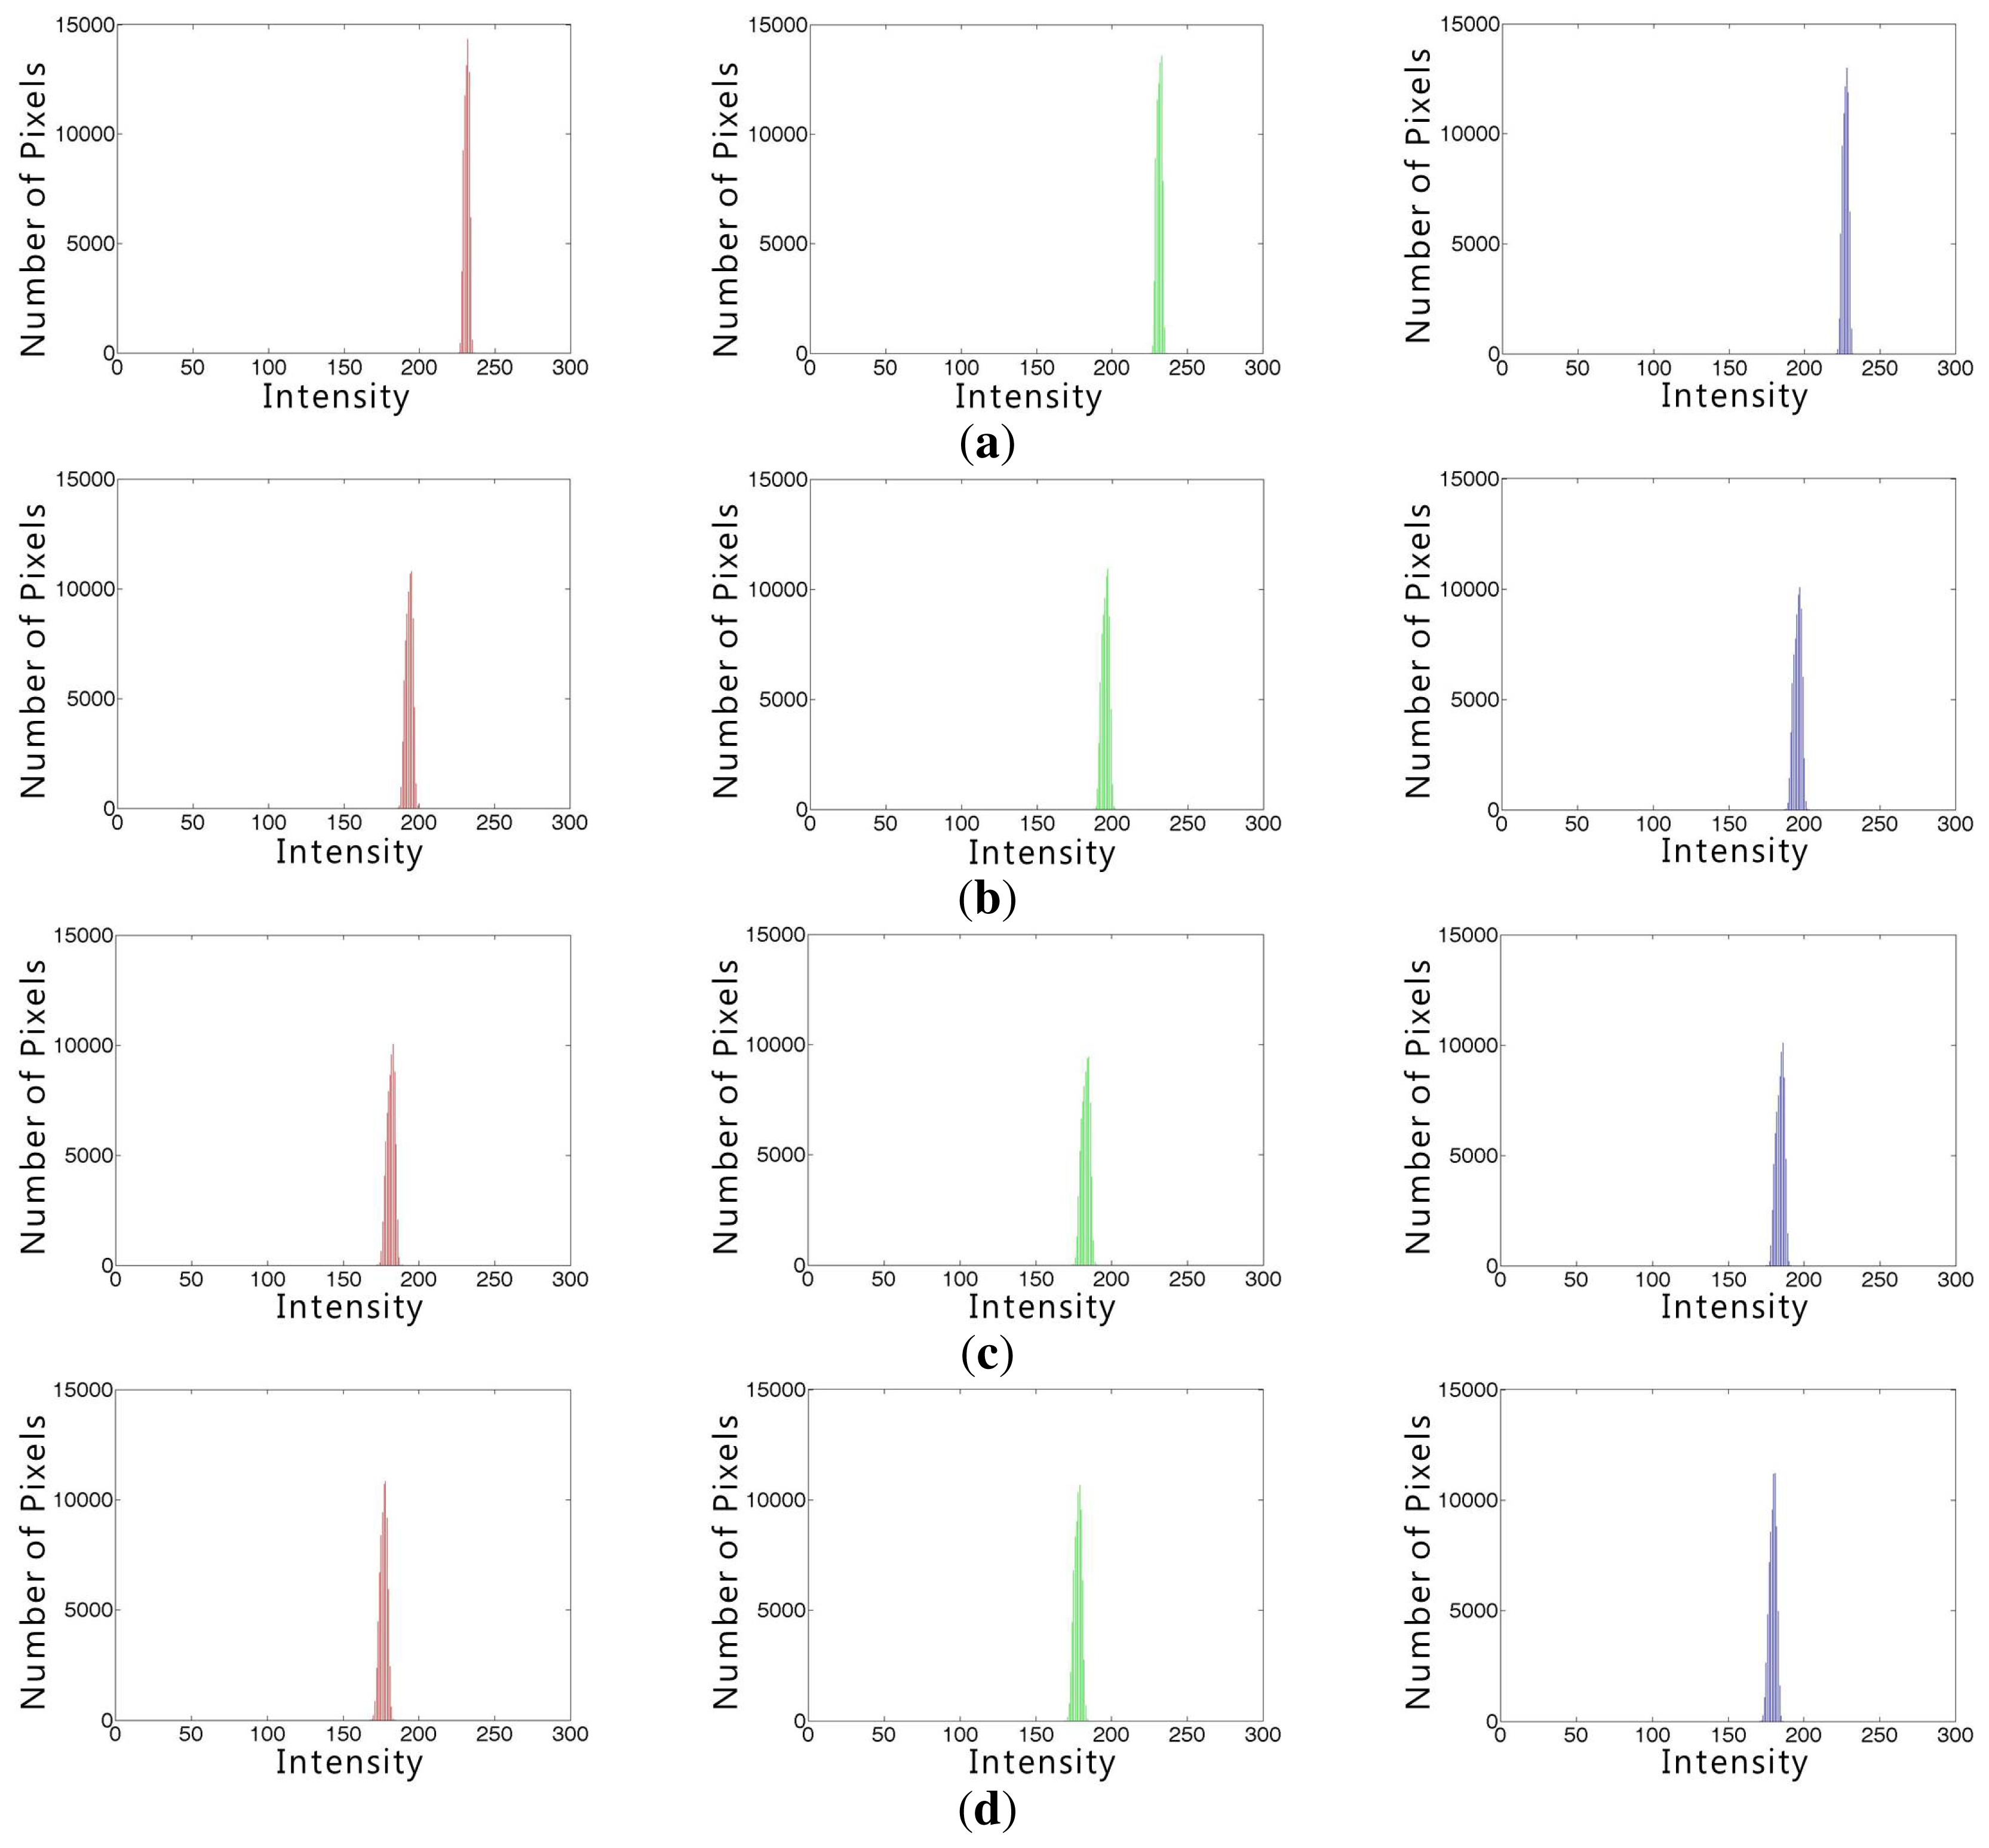
More specifically, Figure 3 shows RGB color histograms in four white regions enclosed by the red rectangle in Figure 1 and supports the observation in Figure 2.
This simple experiment shows that the amount of scattering depends on the turbidity of haze, which follows the observation by Narasimhan [12]. For this reason, restoration of the original color and brightness of an object is a challenging problem in the hazy environment.
Since the turbidity of a hazy image varies by the size of atmospheric particles and the distance of an object, the dehazing process should be performed in a spatially-adaptive manner. Let a small region with homogeneous color and brightness, or simply a cluster, have mean brightness values in RGB color channels as Cr, Cg and Cb. The effect of scattering can be estimated from the quantity of Cr, Cg and Cb using the color alignment measure (CAM) proposed in [25]:
The CAM represents the degree of dispersion among RGB channels and increases if the dispersion becomes more dependent on the wavelength. Table 1 summarizes mean brightness values Cr, Cg and Cb of RGB components and CAM values of four white regions in Figure 1. As shown in the table, the more turbid the atmosphere, the less the scattering is affected by the wavelength.
A white region is suitable to estimate the CAM parameter, since it contains pan-chromatic light. Table 1 summarizes RGB components of mean brightness values, Cr, Cg and Cb and the corresponding CAM values of four white regions in Figure 1. As shown in the table, as the turbidity increases, the scattering amount becomes independent of the wavelength.
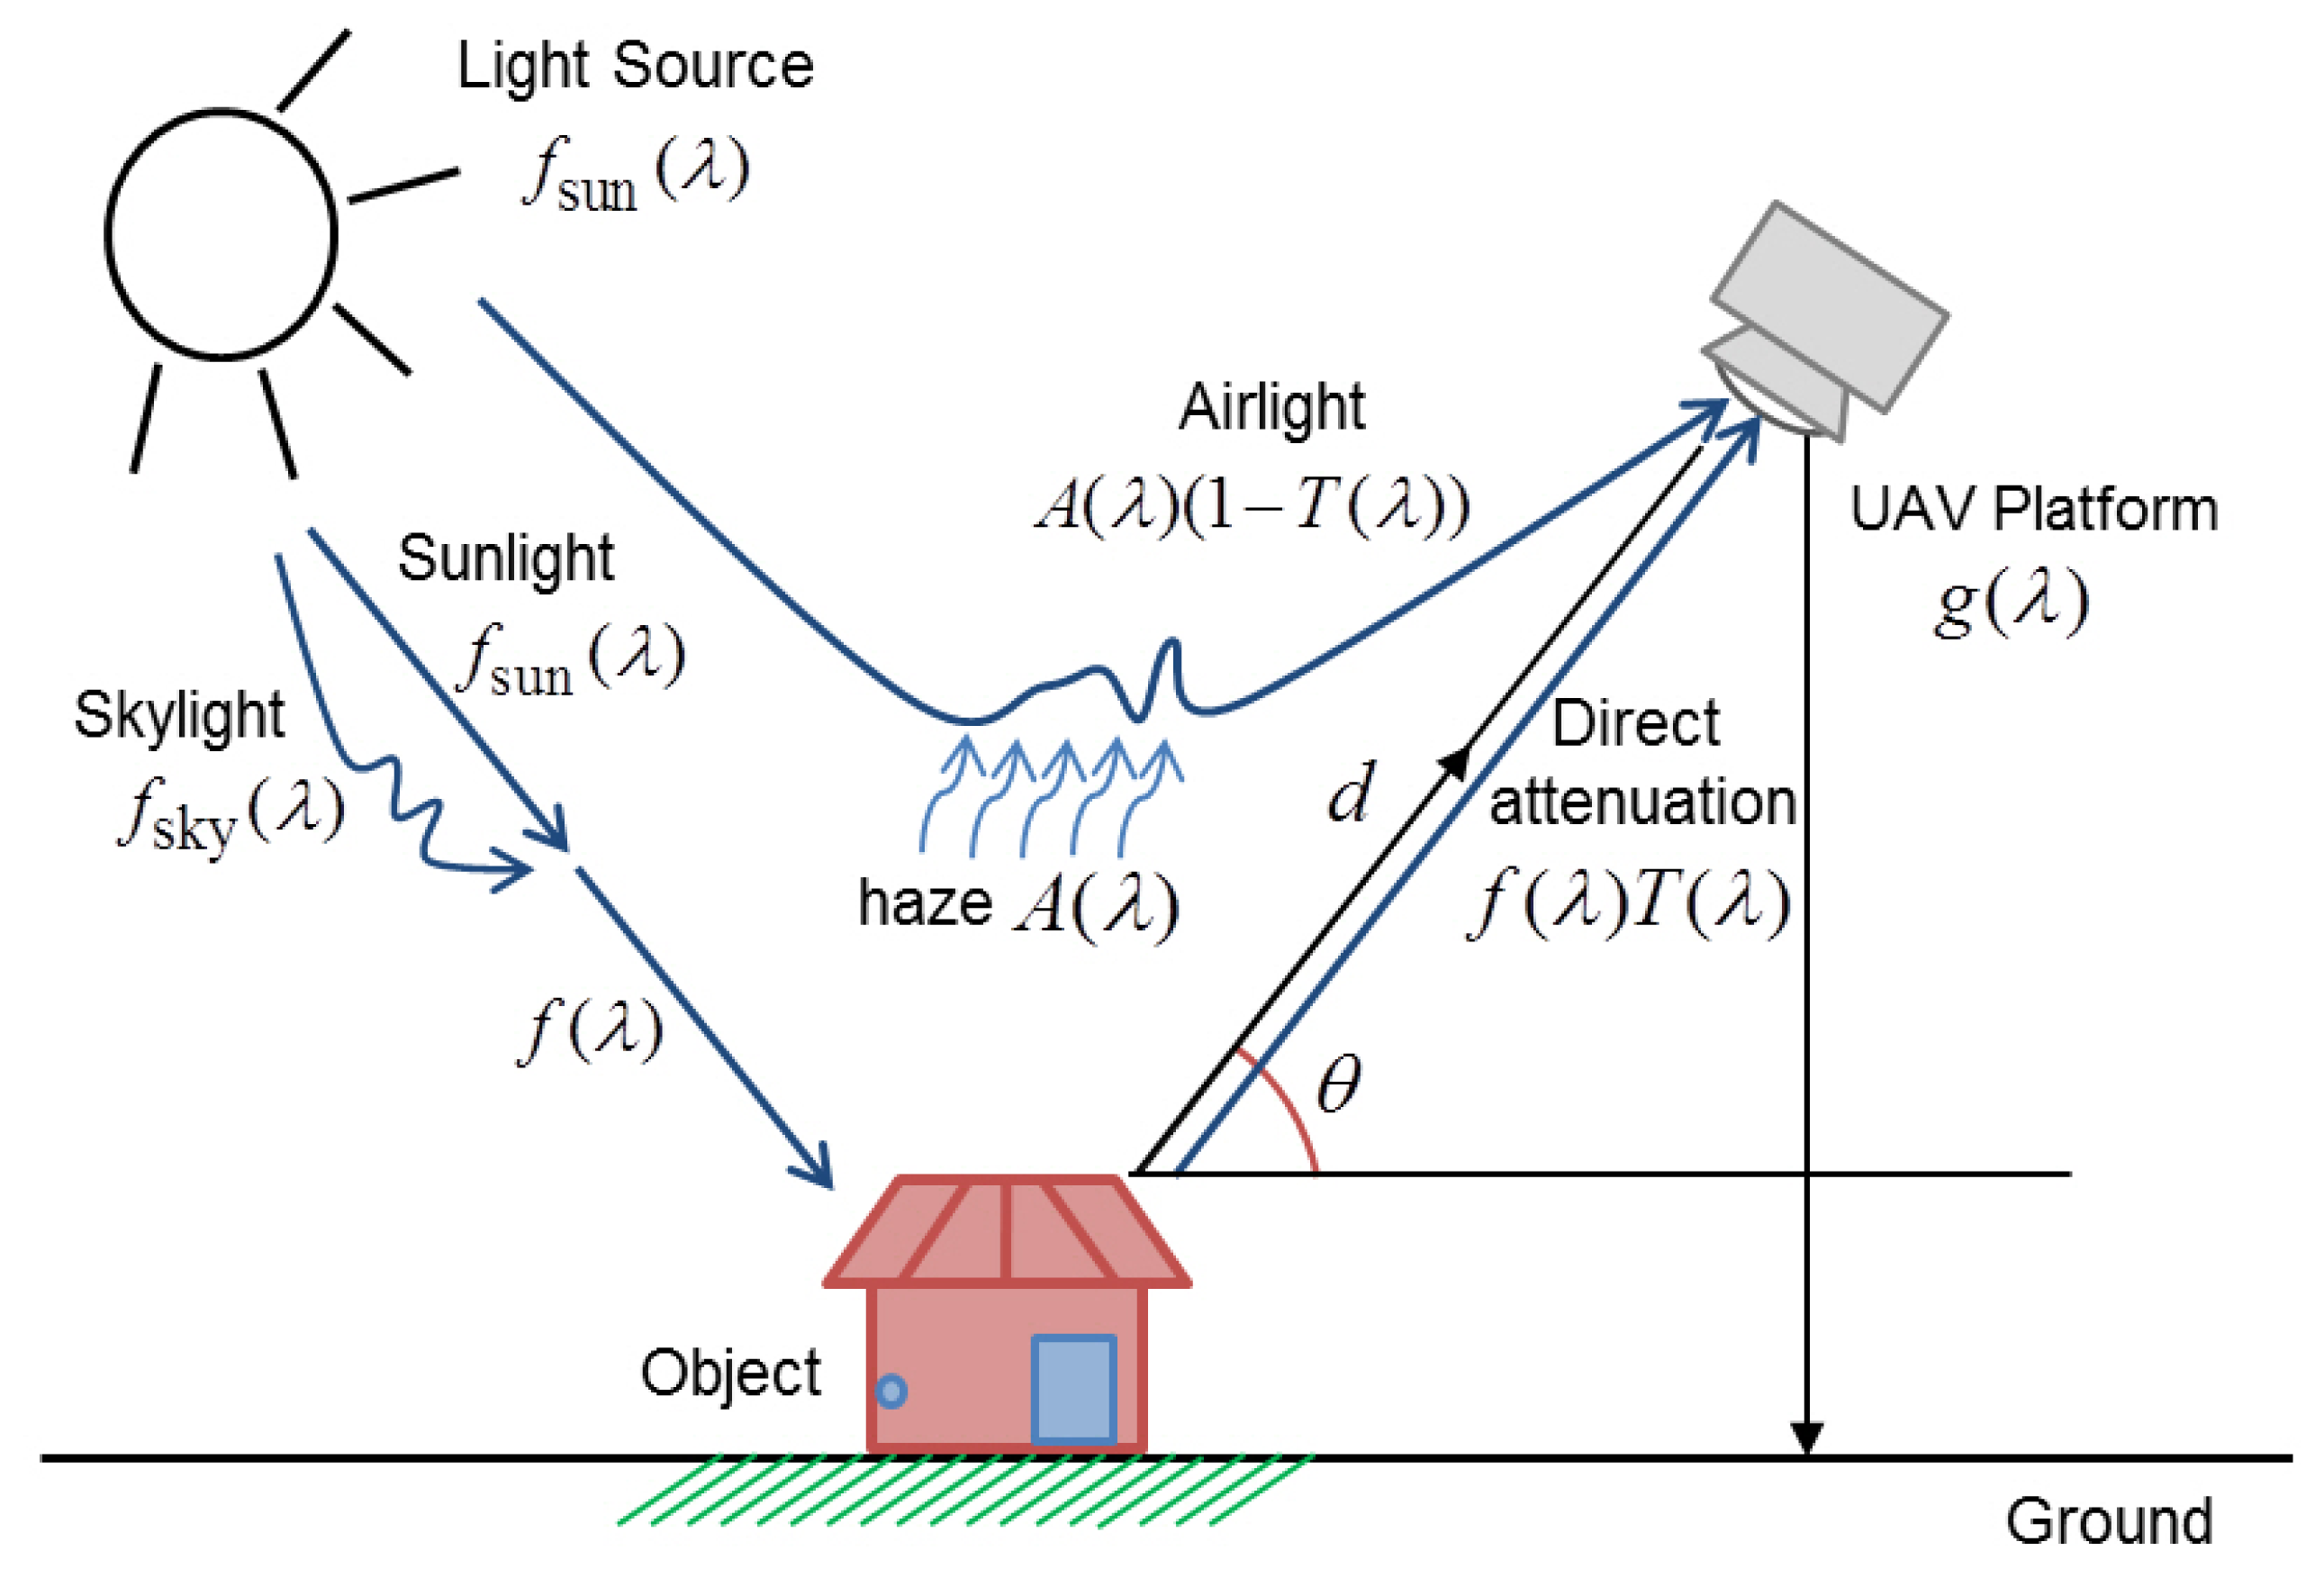
Based on this experimental work, the proposed degradation model of wavelength-dependent hazy unmanned aerial vehicle (UAV) images can be considered as an extended version of Yoon's work in [24], as shown in Figure 4.
The mathematical expression of the proposed UAV image formation model is given as:
In the right-hand side of Equation (3), the first term f(λ)T(λ) represents the direct attenuation component and the second term A(λ)(1 − T(λ)) represents the air light component. The former describes the decayed version of f(λ) in the atmosphere or the space, while the latter results from scattering by haze and color shifts. The proposed degradation model given in Equation (3) can be considered as a wavelength-extended version of the original hazy image formation model proposed in [1].
Given the UAV image degradation model, the dehazing problem is to restore f̂(λ) from g(λ) by estimating T(λ) and A(λ). f̂(λ) represents the estimated value of the original haze-free image.
3. The Proposed Single UAV Image-Based Dehazing Approach
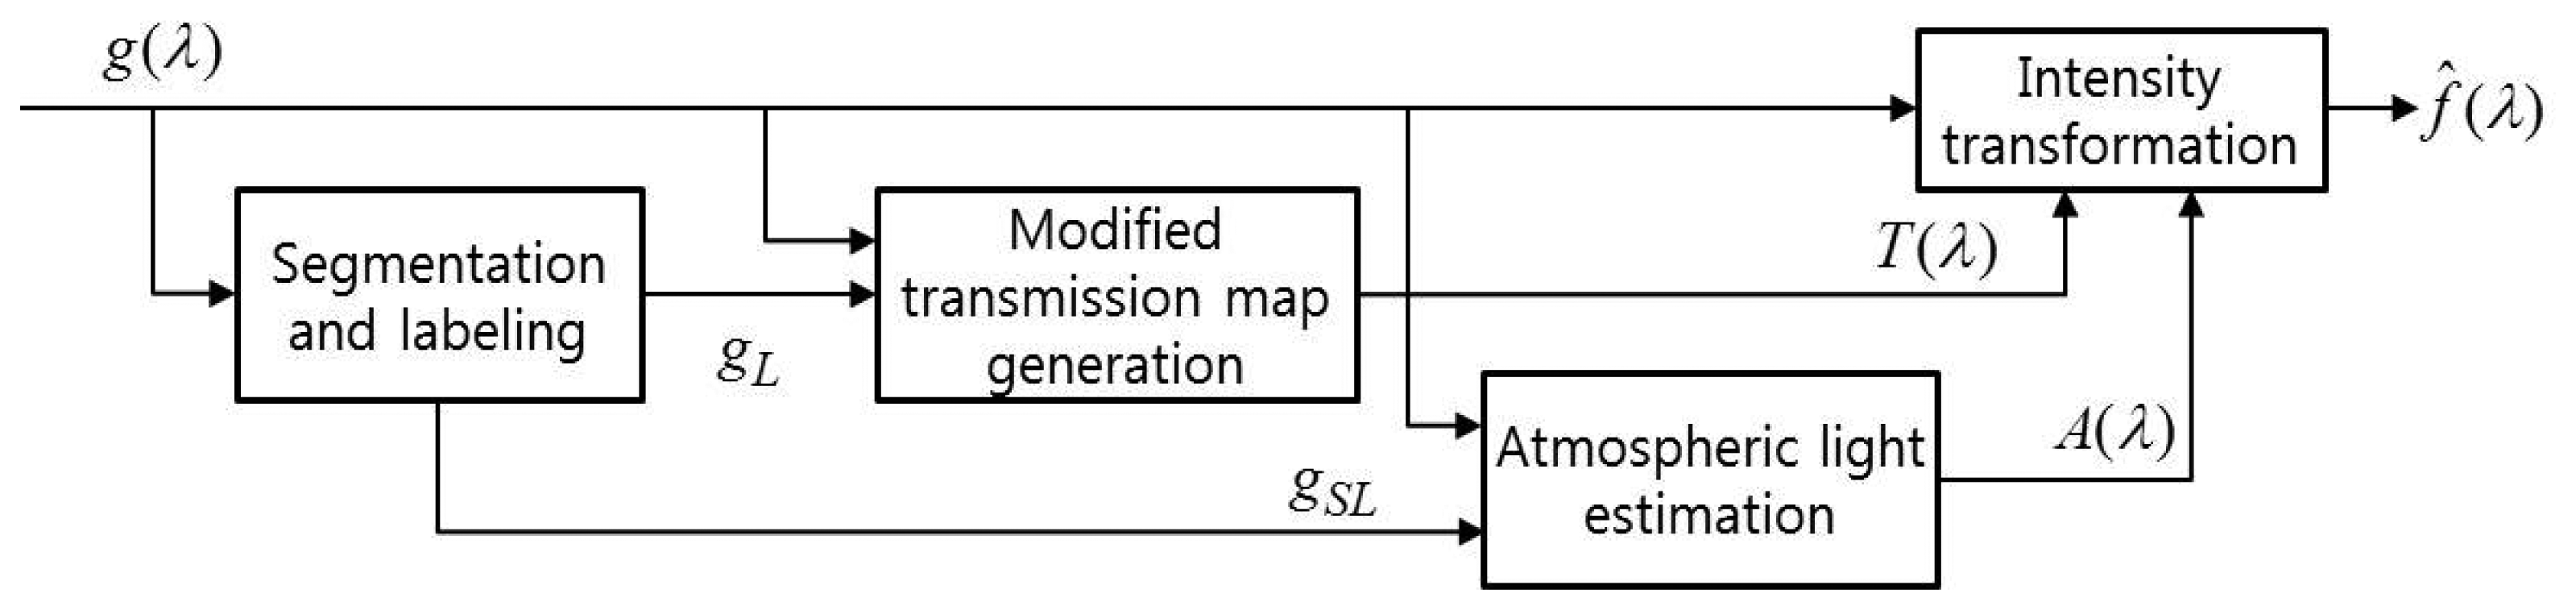
The proposed dehazing algorithm consists of image segmentation and labeling, modified transmission map generation, atmospheric light estimation and intensity transformation modules, as shown in Figure 5.
The label image gL(λ) is first generated using histogram merging-based classification in the hazy image g(λ). Second, the modified transmission map T(λ) is generated based on the wavelength-dependent atmospheric turbidity. The corresponding atmospheric light A(λ) is then estimated in the labeled version of the sky image gSL. Finally, the proposed method can significantly enhance the contrast and visibility of a hazy UAV image using the estimated atmospheric light and modified transmission map. As a result, the enhanced image f̂(λ) is obtained by adaptively removing hazy components.
Although the wavelength-dependent model was already proposed for underwater image enhancement, the effect of the wavelength may be trivial in the visible spectrum of the air for a UAV image. On the other hand, the proposed work pays attention to the dependency of the wavelength together with the object distance and the amount of scattering. The early work of wavelength-dependent vision through the atmosphere can be found in [26].
3.1. Image Segmentation Based on Geometric Classes
The turbidity of the atmosphere varies by the distance of an object and atmospheric degradation factors. Since the conventional transmission map determines the proportion of the light reflected by the object reaching the UAV camera, Tan et al. assumed that light traveling a longer distance is more attenuated, yielding the transmission map defined as [16]:
However, the depth information is difficult to estimate using a single input UAV image. In addition, existing dehazing methods based on the estimation of the atmospheric light and transmission map exhibit various artifacts, such as color distortion, incompletely removed haze and unnaturally enhanced contrast, to name a few [16].
In order to solve these problems, we present a novel transmission map generation method using geometric classes, such as sky, ground and vertical structures. The proposed transmission map provides a theoretical basis to differentiate important regions from the background based on the turbidity and merged classification results.
Existing transmission map generation methods commonly perform image segmentation by minimizing a cost function, such as the ratio cut [27]. Comaniciu et al. proposed an image segmentation algorithm using edge information based on the mean shift [28]. Bao et al. detected the edge of the input image using a modified canny edge detector with scale multiplication [29]. Erisoglu et al. propose a segmentation method to estimate the initial cluster using the K-means algorithm [30]. However, most existing methods could not completely solve the problems of noise amplification and edge blurring.
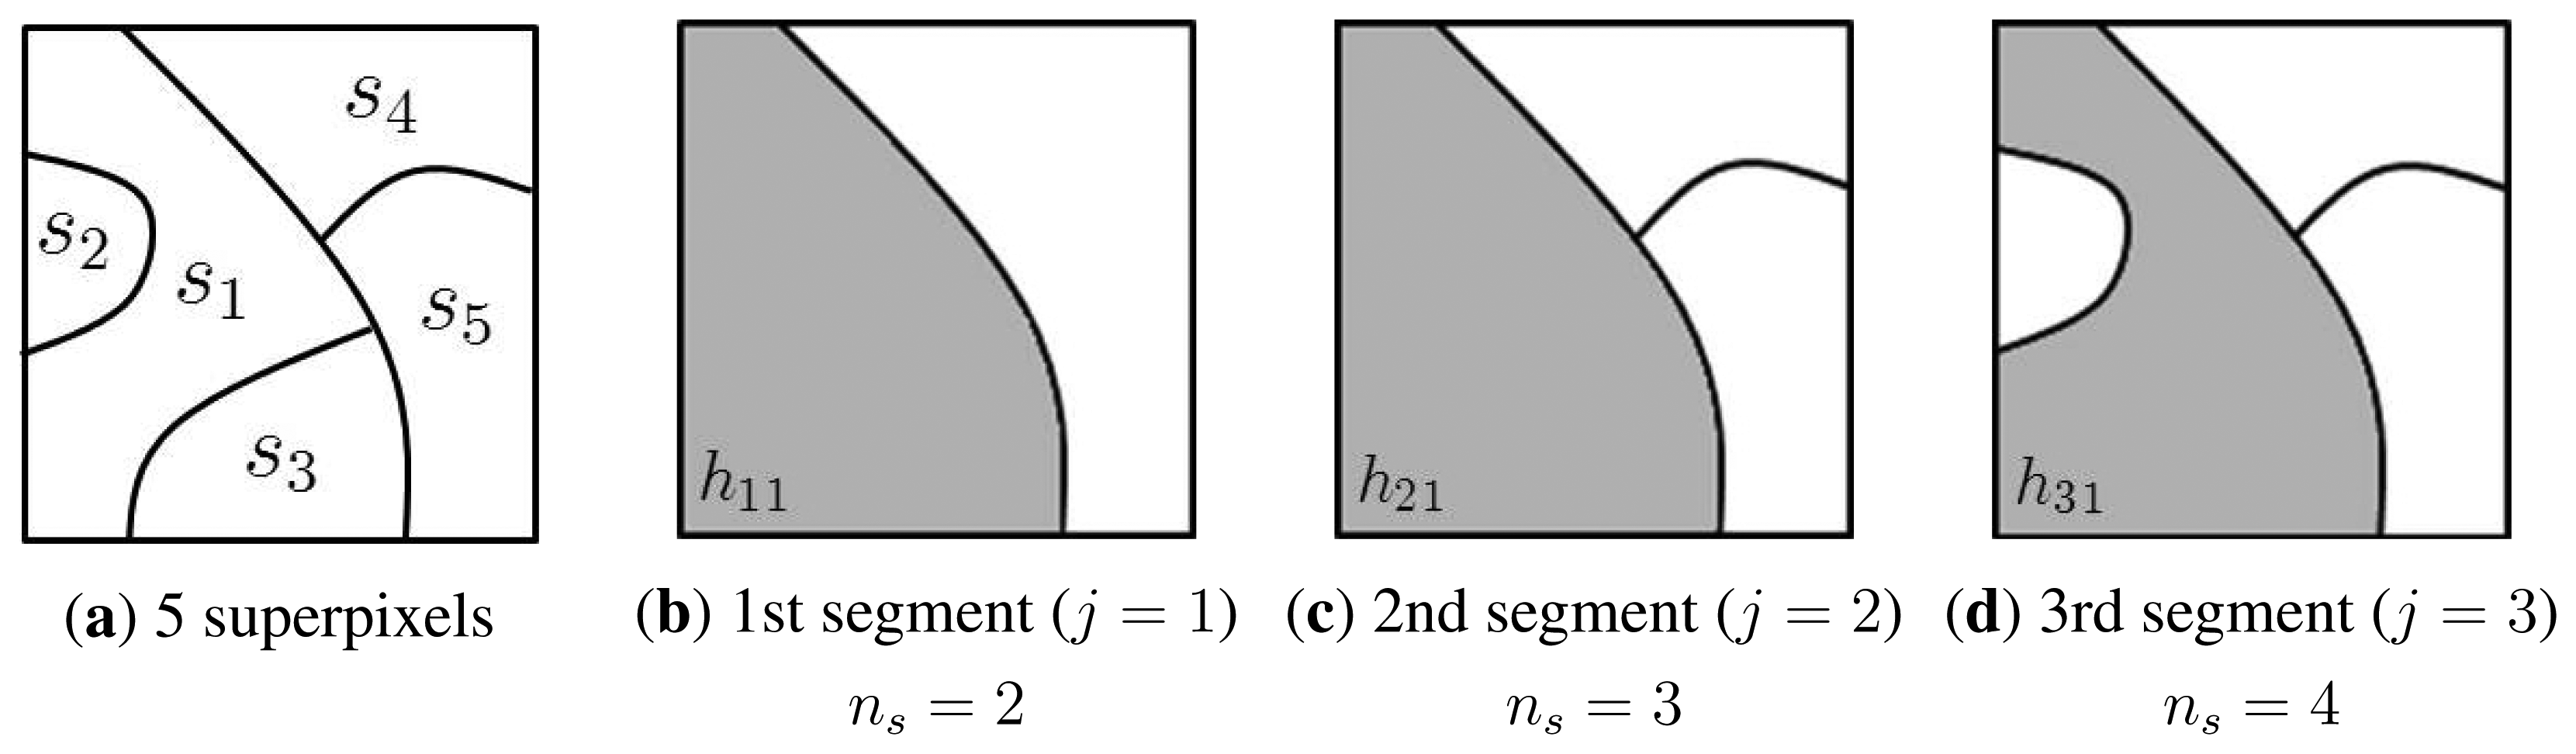
In order to overcome the above-mentioned limitations in existing segmentation methods, the geometric class-based approach in [24] is used for the three-dimensional (3D) context-adaptive processing. The geometric class-based pre-segmentation approach proposed in [24] was inspired by the Hoiem's work in [31], and the proposed approach is an improved version of Yoon's work in [24], where coarse geometric properties are estimated by learning the appearance model of geometric classes. Although Hoiem et al. defined a complete set of geometrical classes for segmenting a general scene in their original works, we present a simplified version by selecting only three classes, sky, vertical and ground. Hoiem uses a complete set of geometrical classes, but it causes extremely high computational complexity and an over-segmentation problem. Figure 6 shows a simple illustration to describe the proposed segmentation algorithm.
Figure 6a shows a sample input image decomposed into five superpixels, si, i = 1,…, 5. In order to assign one of three classes, such as υ ∈ {(S)ky, (V)ertical, (G)round}, to each si, we perform image segmentation multiple times using different hypotheses. For the first superpixel si, Figure 6b–d show regions containing s1 for the j-th hypothesis, such as hj1 for j = 1, 2, 3. Let bi and b̃ji ∈ {S, V, G} respectively represent labels of si and hji; then, the most suitable label for si maximizes the confidence value, defined as:
For example, the confidence that the first superpixel s1 is labeled as sky is computed as:
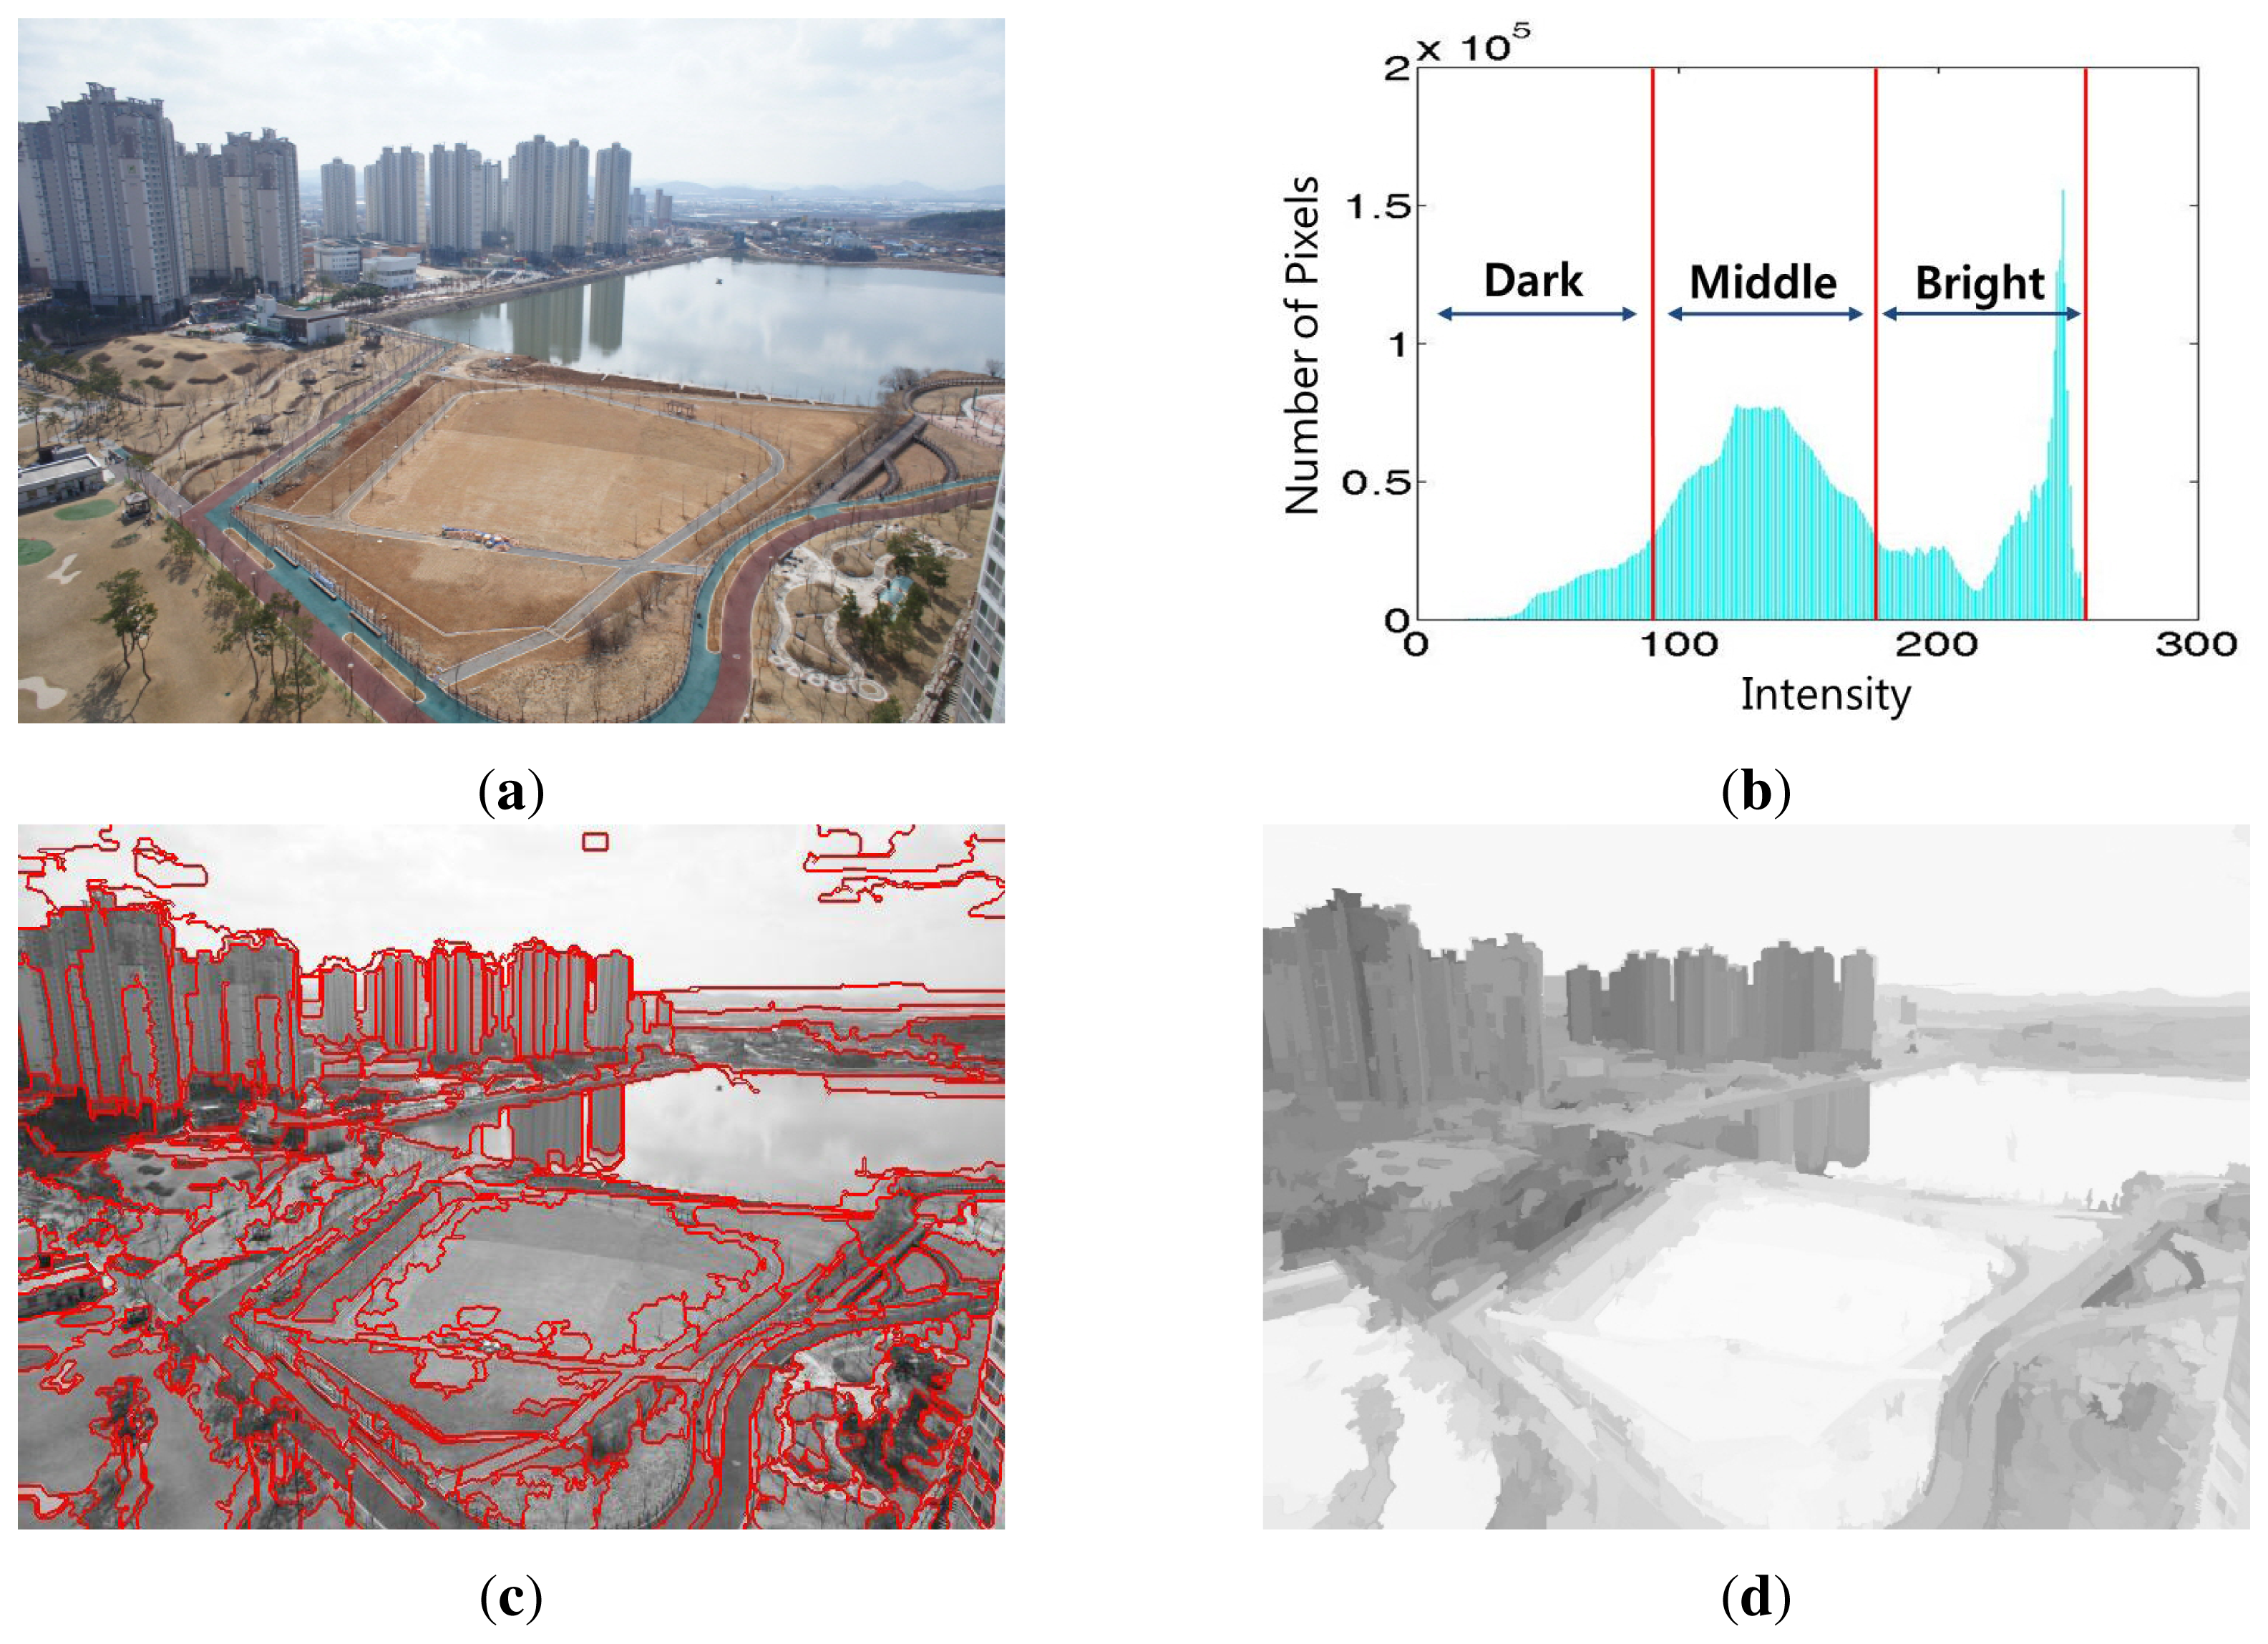
The first step of label generation is to estimate superpixels from small, almost-homogeneous regions in the image. Since superpixel segmentation usually preserves object boundaries at the cost of over-segmentation, it can provide accurate boundary information of a subject. We then merge adjacent regions using histogram classification. Next, we uniformly quantize each color channel into 16 levels and then estimate the histogram of each region in the feature space of 16 × 16 × 16 = 4096 bins. The following step merges the regions based on their three classified intensity ranges, such as dark, middle and bright, as shown in Figure 7b.
The similarity measure ρ(RA, RC) between two regions RA and RC is defined as:
Let RC and RA be respectively a region-of-interest and one of its adjacent regions. If there are K adjacent regions Rk, for k = 1, … , K, RC is definitely equal to one of the Rk's. If ρ(RA, RC) is the maximum among K similarities ρ(RA, Rk), k = 1, …, K, the two regions are merged as [32]:
The proposed segmentation method consists of the following steps: (i) the initial segmentation is performed using superpixels; (ii) the entire histogram is divided into three ranges, as shown in Figure 7b; and (iii) the labeled image is obtained using histogram merging when adjacent segments have similar histograms. In order to simply generate the labeled image, three classes are defined as υ ∈ {(S)ky, (V)ertical, (G)round} using color, texture, shape and location and then computing the probability that a new segment has the same class.
Figure 7a shows an input hazy image. Figure 7b shows three classified regions, dark, middle and bright, in the histogram of the input image, and Figure 7c shows the segmentation result using the proposed algorithm. We can obtain the labeled image gL using the same class of image as shown in Figure 7d.
3.2. Spatially-Adaptive Transmission Map
The conventional dark channel prior-based dehazing method generates the transmission map by searching for the lowest intensity in the patch centered at (x, y), denoted as Ω(x, y), from Equation (3), as [1]:
Since the minimum intensity in a patch of the ideal haze-free image tends to zero, the transmission map can be computed as:
The conventional transmission map results in a halo effect and color distortion in the finally dehazed UAV image, since intensity discontinuity across edges is not considered in the reconstruction process [1]. Although an image matting-based halo effect reduction method has been proposed in the literature, it requires extremely high computational load, which is unsuitable for practical applications. To solve this problem, we generate a modified transmission map by incorporating the classification and labeling results into the conventional transmission map given in Equation (4). The modified transmission map is defined as:
The scattering coefficient is determined by the amount of haze, object distance and camera angle. This work uses a camera angle of 60 degrees [34]. The scattering coefficients are defined as:
In order to generate the transmission map depending on the wavelength, the feature-based labeled image is used. Therefore, the wavelength-dependent transmission map is proposed to adaptively represent hazy images. As a result, the proposed spatially-adaptive transmission map can mitigate the contrast distortion and halo effect problems using the context-adaptive image.
3.3. Estimation of Local Atmospheric Light and Intensity Transformation
Conventional dehazing methods estimate the atmospheric light from the brightest pixel in the dark channel prior of the hazy image. To the best of our knowledge, He et al. [1] were the first to raise the issue of color distortion when the atmospheric light is incorrectly estimated from an undesired region, such as a white car or a white building. To address this problem, we estimate the atmospheric light using the labeled sky image that can be generated from the ‘sky’ class, as shown in Figure 8b. As a result, the atmospheric light can be estimated as:
Given the adaptive global atmospheric light A(λ) and the modified transmission map T(λ), the dehazed image is finally restored as:
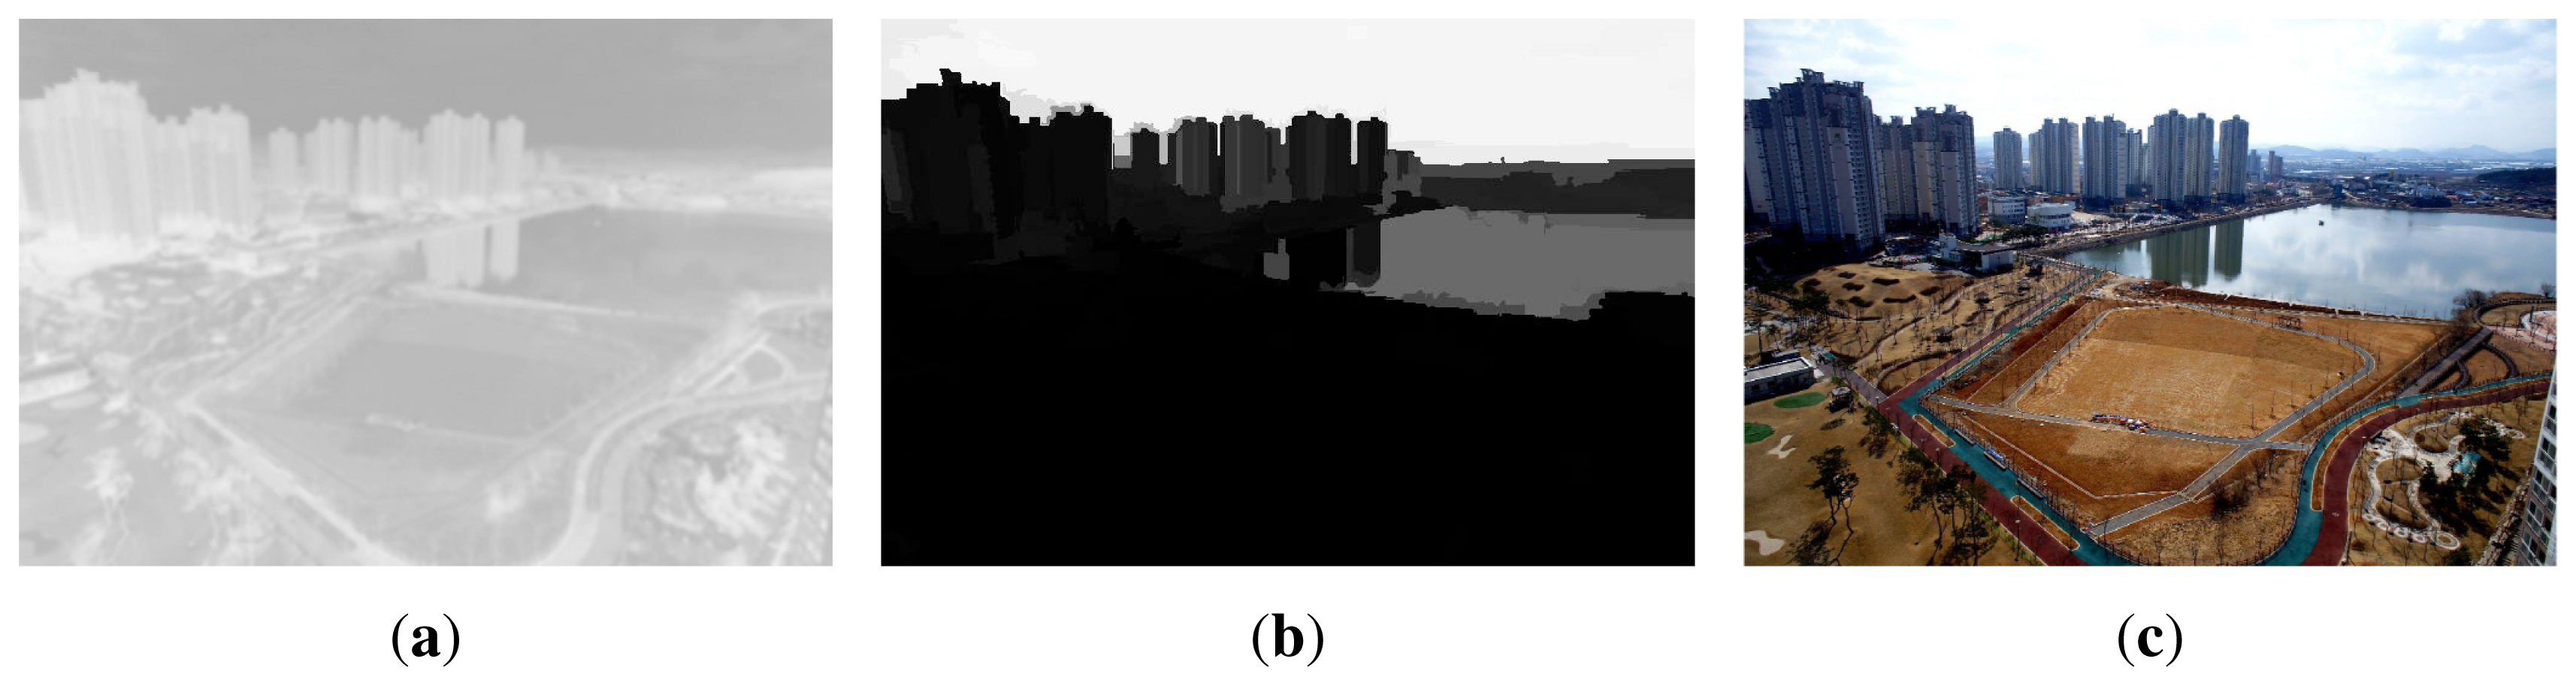
Figure 8a shows the proposed transmission map of Figure 7a. As a result, the proposed spatially-adaptive transmission map has continuous intensity values in the neighborhood of boundaries. Figure 8b shows the labeled sky image using the proposed segmentation method. Figure 8c shows the dehazed image using the modified transmission map in Figure 8a. As shown in Figure 8c, the proposed method significantly enhanced the contrast of the hazy image without color distortion or unnatural contrast amplification.
4. Experimental Results
In this section, we show the experimental results to compare the performance of the proposed dehazing algorithm with conventional methods.
In order to demonstrate the performance of original color restoration, a set of hazy images are first generated by simulation. The test images are then enhanced using the proposed dehazing algorithm to evaluate the accuracy of color restoration, as shown in Figure 9.
Figure 10a shows three hazy unmanned aerial vehicle (UAV) images; Figure 10b shows the modified transmission map using the proposed method; and Figure 10c shows the dehazed results using the proposed method. As shown in Figure 10c, the proposed dehazing method preserves fine details without color distortion. If there are no sky regions in an image, as shown in Figure 10, the atmospheric light can be simply estimated using the maximum intensity value.
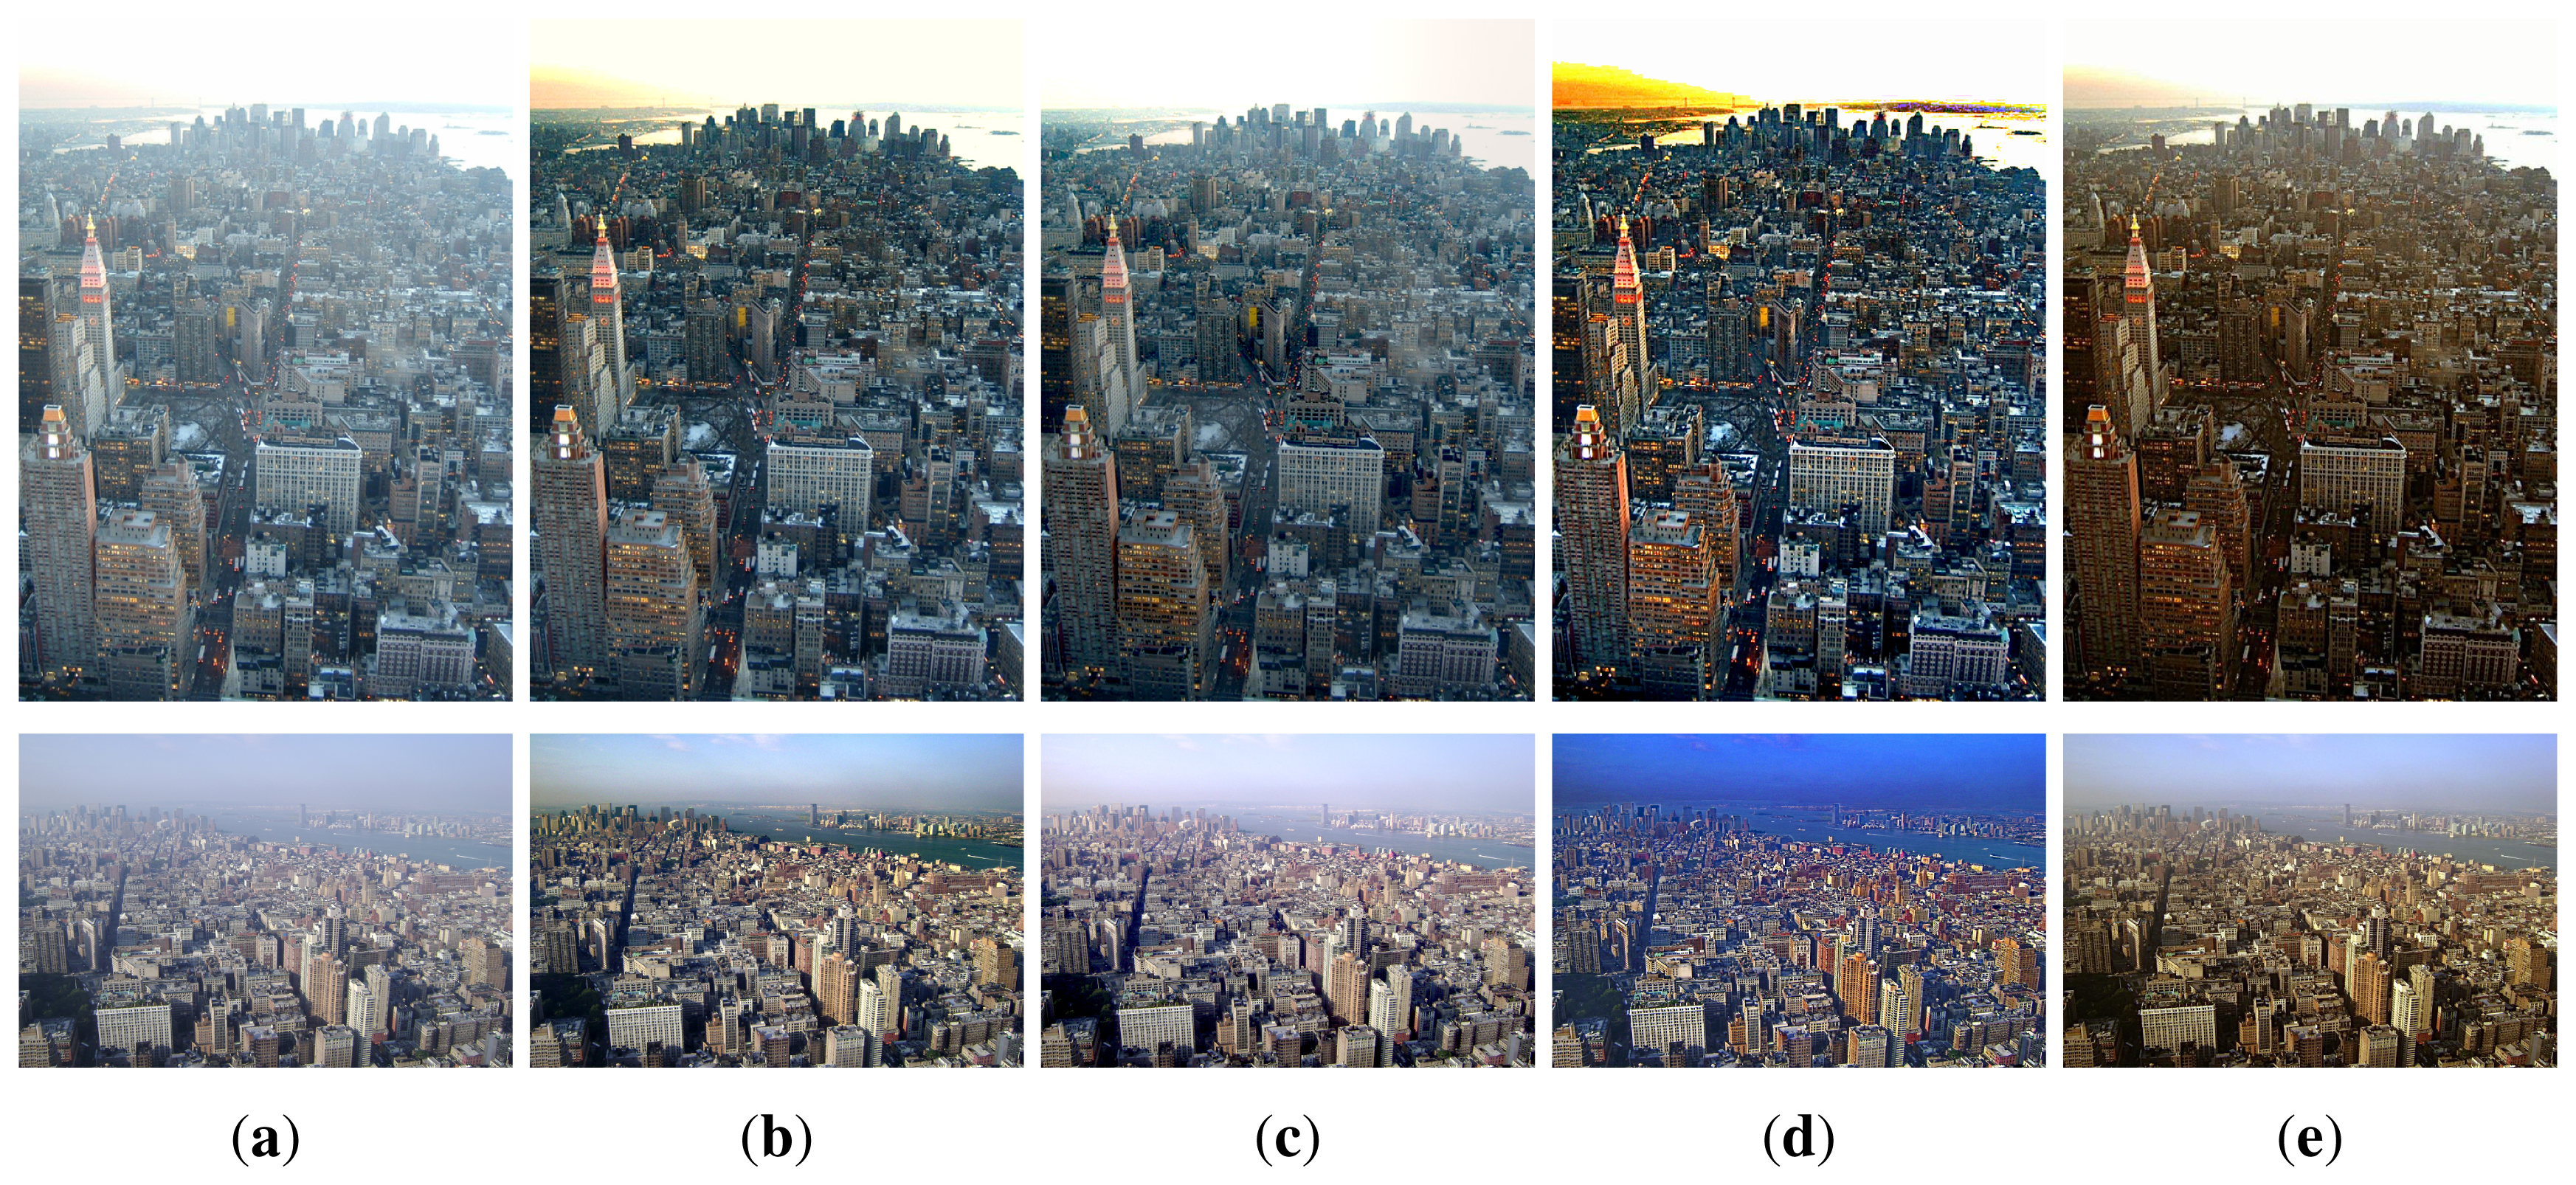
The performance of the proposed dehazing algorithm is compared with three existing dehazing methods. Figure 11a shows two hazy images, and Figure 11b shows the dehazed images using the conventional dark channel prior-based method [1], where the hazy components were removed at the cost of color distortion in the sky region. Figure 11c shows dehazed images using Fattal's method proposed in [15], where the haze is not completely removed in regions far from the camera. Figure 11d shows dehazed results using Tan's method proposed in [16], where color distortion is visible. As shown in Figure 10e, the dehazed image using the proposed method shows significantly improved image quality without color distortion or unnaturally amplified contrast. Furthermore, the proposed method maintains the haze in the sky and removes haze surrounding the buildings.
In order to justify the performance of dehazing, Tarel et al. compared a number of enhancement algorithms [35]. On the other hand, the proposed work is evaluated in the sense of both subjective and objective manners using visual comparison in Figure 11 and quantitative evaluation in Table 2, respectively. We compared the performance of the proposed dehazing algorithm with three existing state-of-the-art methods in the sense of the visibility metric proposed by Zhengguo. The visibility metric is used to calculate the contrast-to-noise ratio (CNR) of dehazed images.
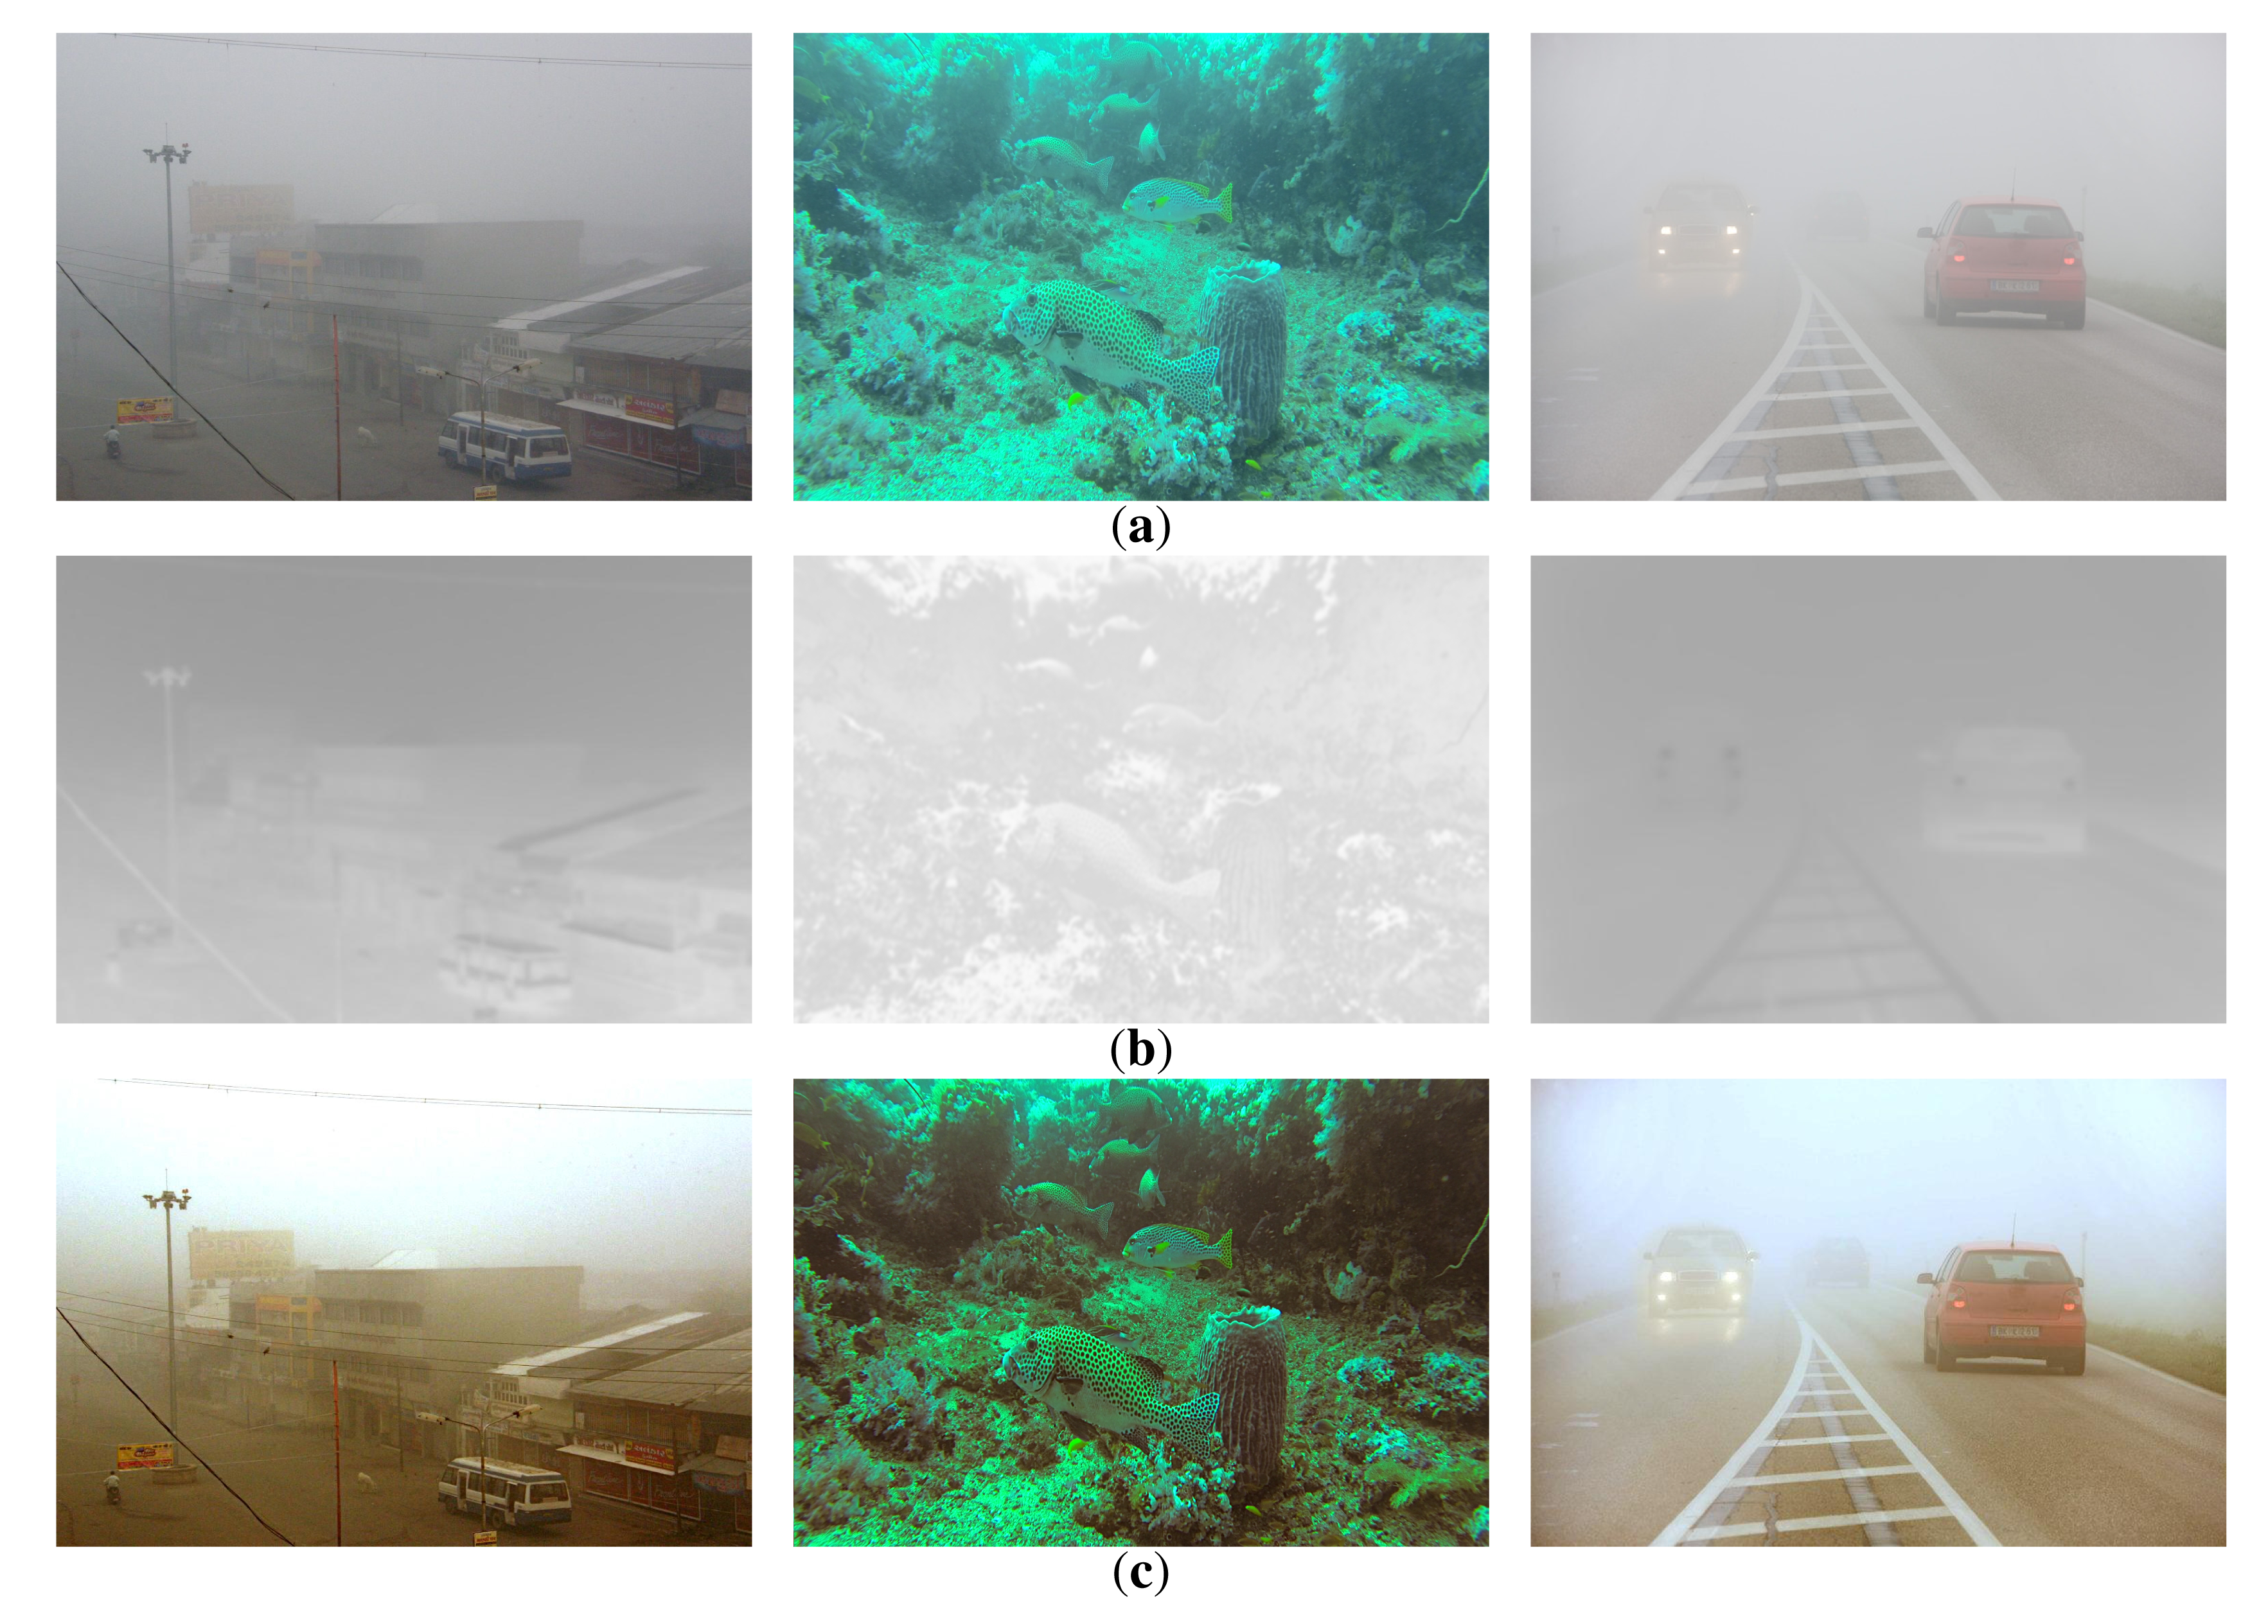
Figure 12a shows hazy images acquired by a video surveillance camera, an underwater camera and a vehicle black box camera. Figure 12b shows the modified transmission maps using the proposed method, and the results of the proposed dehazing method are shown in Figure 12c. Based on the experimental results, the proposed dehazing method can successfully restore the original color of the scene with a moderately hazy atmosphere, but its dehazing performance is limited with a severe amount of haze in the atmosphere.
Figure 13a shows three satellite images acquired by the Korea Aerospace Research Institute (KARI). Figure 13b shows the modified transmission maps, and Figure 13c shows the dehazed results using the proposed method. Based on the experimental results, the proposed dehazing method can successfully restore the original color of the scene with a moderately hazy atmosphere, except with an excessive amount of haze, such as thick cloud.
5. Conclusions
In this paper, we presented a spatially-adaptive dehazing algorithm based on a wavelength-adaptive hazy image formation model. As a major contribution, the proposed wavelength-based dehazing method can mitigate the color distortion problem in conventional methods. By incorporating the wavelength characteristics of light sources into the UAV image degradation model, the proposed transmission map removes hazy components in the input image. Another contribution is that the proposed algorithm needs neither additional optical equipment nor a priori distance estimation.
Experimental results show that the proposed dehazing algorithm can successfully restore the original color of the scene containing the wavelength-dependent scattering of atmosphere. This proposed algorithm can be used for various applications, such as video surveillance systems, intelligent driver assistant systems and remote sensing systems. The proposed wavelength-adaptive dehazing algorithm is particularly suitable for preprocessing multispectral registration of satellite images for enhancing aerial images with various types of haze, fog and cloud.
Acknowledgements
This work was supported by the Korea Aerospace Research Institute (KARI), the ICT R&D program of MSIP/IITP. [14-824-09-002, Development of global multi-target tracking and event prediction techniques based on real-time large-scale video analysis, and the Technology Innovation Program (Development of Smart Video/Audio Surveillance SoC & Core Component for Onsite Decision Security System) under Grant 10047788.
Author Contributions
Inhye Yoon initiated the research and designed the experiments; Seokhwa Jeong performed experiments; Jaeheon Jeong and Doochun Seo analyzed the data; Joonki Paik wrote the paper.
Conflicts of Interest
The authors declare no conflict of interest.
References
- He, K.; Sun, J.; Tang, X. Single image haze removal using dark channel prior. Proceedings of the IEEE Conference on Computer Vision and Pattern Recognition, Miami, FL, USA, 20–26 June 2009; pp. 1956–1963.
- Yoon, I.; Jeon, J.; Lee, J.; Paik, J. Spatially adaptive image defogging using edge analysis and gradient-based tone mapping. Proceedings of the IEEE International Conference on Consumer Electronics, Las Vegas, NV, USA, 9–12 January 2011; pp. 195–196.
- Xie, B.; Guo, F.; Cai, Z. Universal strategy for surveillance video defogging. Opt. Eng. 2012, 51, 1–7. [Google Scholar]
- Gao, R.; Fan, X.; Zhang, J.; Luo, Z. Haze filtering with aerial perspective. Proceedings of the IEEE International Conference on Image Processing, Orland, FL, USA, 30 September 2012; pp. 989–992.
- Park, D.; Han, D.; Ko, H. Single image haze removal with WLS-based edge-preserving smoothing filter. Proceedings of the IEEE International Conference on Acoustics, Speech, and Signal Processing, Vancouver, BC, Canada, 26–31 May 2013; pp. 2469–2473.
- Kil, T.; Lee, S.; Cho, N. A dehazing algorithm using dark channel prior and contrast enhancement. Proceedings of the IEEE International Conference on Acoustics, Speech, and Signal Processing, Vancouver, BC, Canada, 26–31 May 2013; pp. 2484–2487.
- Yeh, C.; Kang, L.; Lee, M.; Lin, C. Haze effect removal from image via haze density estimation in optical model. Opt. Express 2013, 21, 27127–27141. [Google Scholar]
- He, R.; Wang, Z.; Fan, Y.; Feng, D. Multiple scattering model based single image dehazing. Proceedings of the IEEE Conference on Industrial Electronics and Applications, Melbourne, Australia, 19–21 June 2013; pp. 733–737.
- Shi, Z.; Long, J.; Tang, W.; Zhang, C. Single image dehazing in inhomogeneous atmosphere. Opt. Int. J. Light Electron Opt. 2014, 15, 3868–3875. [Google Scholar]
- Long, J.; Shi, Z.; Tang, W.; Zhang, C. Single remote sensing image dehazing. IEEE Geosci. Remote Sens. Lett. 2014, 11, 59–63. [Google Scholar]
- Narasimhan, S.; Nayar, S. Vision and the atmosphere. Int. J. Comput. Vis. 2002, 48, 233–254. [Google Scholar]
- Narasimhan, S.; Nayer, S. Contrast restoration of weather degraded images. IEEE Trans. Pattern Anal. Mach. Intell. 2003, 25, 713–724. [Google Scholar]
- Shwartz, S.; Namer, E.; Schecher, Y. Blind haze separation. Proceedings of the IEEE International Conference on Computer Vision, Pattern Recognition, New York, NY, USA, 17–22 October 2006; pp. 1984–1991.
- Schechner, Y.; Averbuch, Y. Regularized image recovery in scattering media. Pattern Anal. Mach. Intell. 2007, 29, 1655–1660. [Google Scholar]
- Fattal, R. Single image dehazing. ACM Trans. Graph. 2008, 27, 1–9. [Google Scholar]
- Tan, R. Visibility in bad weather from a single image. Proceedings of the IEEE Conference on Computer Vision and Pattern Recognition, Anchorage, AK, USA, 24–26 June 2008; pp. 1–8.
- Kratz, L.; Nishino, K. Factorizing scene albedo and depth from a single foggy image. Proceedings of the IEEE International Conference on Computer Vision, Kyoto, Japan, 29 September 2009; pp. 1701–1708.
- Ancuti, C.; Ancuti, C. Single image dehazing by multi-scale fusion. IEEE Trans. Image Process. 2013, 22, 3271–3282. [Google Scholar]
- Fang, S.; Xia, X.; Xing, H.; Chen, C. Image dehazing using polarization effects of objects and airlight. Opt. Express 2014, 22, 19523–19537. [Google Scholar]
- Gibson, K.; Vo, D.; Nguyen, T. An investigation of dehazing effects on image and video coding. IEEE Trans. Image Process. 2012, 21, 662–673. [Google Scholar]
- Chiang, J.; Chen, Y. Underwater image enhancement by wavelength compensation and dehazing. IEEE Trans. Image Process. 2012, 21, 1756–1769. [Google Scholar]
- Pei, S.; Lee, T. Nighttime haze removal using color transfer pre-processing and dark channel prior. Proceedings of the IEEE International Conference on Image Processing, Orlando, FL, USA, 30 September 2012; pp. 957–960.
- Yoon, I.; Kimg, S.; Kimg, D.; Hayes, M.; Paik, J. Adaptive defogging with color correction in the HSV color space for consumer surveillance system. IEEE Trans. Consum. Electron. 2012, 58, 111–116. [Google Scholar]
- Yoon, I.; Hayes, M.; Paik, J. Wavelength-adaptive image formation model and geometric classification for defogging unmanned aerial vehicle images. Proceedings of the IEEE International Conference on Acoustics, Speech, and Signal Processing, Vancouver, BC, Canada, 26–31 May 2013; pp. 2454–2458.
- Bando, Y.; Chen, B.; Nishita, T. Extracting depth and matte using a color-filtered aperture. ACM Trans. Graph. 2008, 27, 1–9. [Google Scholar]
- Middleton, W. Vision through the atmosphere. In Encyclopedia of Physics, Geophysic II; Springer-Verlag: Berlin, Germany, 1957; Volume 48, pp. 254–287. [Google Scholar]
- Wang, S.; Siskind, J. Image segmentation with ration cut. IEEE Trans. Pattern Anal. Mach. Intell. 2003, 25, 675–690. [Google Scholar]
- Comaniciu, D.; Meer, P. Mean shift: A robust approach toward feature space analysis. IEEE Trans. Pattern Anal. Mach. Intell. 2002, 24, 603–619. [Google Scholar]
- Bao, P.; Zhang, L.; Wu, X. Canny edge detection enhancement by scale multiplication. IEEE Trans. Pattern Anal. Mach. Intell. 2005, 27, 1485–1490. [Google Scholar]
- Erisoglu, M.; Calis, N.; Sakallioglu, S. A new algorithm for initial cluster centers in k-means algorithm. Pattern Recog. Lett. 2001, 32, 1701–1705. [Google Scholar]
- Hoiem, D.; Efros, A.; Hebert, M. Recovering surface layout from an image. Int. J. Comput. Vis. 2007, 75, 151–172. [Google Scholar]
- Ning, J.; Zhang, L.; Zhang, D.; Wu, C. Interactive image segmentation by maximal similarity based region merging. Pattern Recog. 2010, 43, 445–456. [Google Scholar]
- He, K.; Sun, J.; Tang, X. Guided image filtering. Proceedings of the European Conference on Computer Vision, Crete, Greece, 5–11 September 2010; pp. 1–14.
- Preetham, A.; Shirley, P.; Smits, B. A practical analytic model for daylight. Proceedings of the ACM SIGGRAPH, Los Angeles, CA, USA, 8–13 August 1999; pp. 91–100.
- Tarel, J.; Hautiere, N.; Caraffa, L.; Cord, A.; Halmaoui, H.; Gruyer, D. Vision enhancement in homogeneous and heterogeneous fog. IEEE Intell. Transp. Syst. Mag. 2012, 2, 6–20. [Google Scholar]


| Image Type | Cr | Cg | Cb | CAM |
|---|---|---|---|---|
| Figure 1a | 0.9044 | 0.9049 | 0.8884 | 0.0044 |
| Figure 1b | 0.7562 | 0.7640 | 0.7648 | 0.0024 |
| Figure 1c | 0.7089 | 0.7147 | 0.7199 | 0.0021 |
| Figure 1d | 0.6657 | 0.6711 | 0.6743 | 0.0019 |
| Input Image | Dehazing Method | CNR | ME |
|---|---|---|---|
 | Haze Image | 53.0588 | - |
| He's Method [1] | 68.8744 | 15.8156 | |
| Fattal's Method [14] | 71.8029 | 18.7441 | |
| Tan's Method [15] | 84.9931 | 31.9343 | |
| Proposed Method | 72.4338 | 19.3750 | |
 | Haze Image | 58.8830 | - |
| He's Method [1] | 72.8756 | 13.9626 | |
| Fattal's Method [14] | 67.5625 | 8.6795 | |
| Tan's Method [15] | 88.5869 | 29.7039 | |
| Proposed Method | 81.4254 | 22.5424 | |
© 2015 by the authors; licensee MDPI, Basel, Switzerland. This article is an open access article distributed under the terms and conditions of the Creative Commons Attribution license ( http://creativecommons.org/licenses/by/4.0/).
Share and Cite
Yoon, I.; Jeong, S.; Jeong, J.; Seo, D.; Paik, J. Wavelength-Adaptive Dehazing Using Histogram Merging-Based Classification for UAV Images. Sensors 2015, 15, 6633-6651. https://doi.org/10.3390/s150306633
Yoon I, Jeong S, Jeong J, Seo D, Paik J. Wavelength-Adaptive Dehazing Using Histogram Merging-Based Classification for UAV Images. Sensors. 2015; 15(3):6633-6651. https://doi.org/10.3390/s150306633
Chicago/Turabian StyleYoon, Inhye, Seokhwa Jeong, Jaeheon Jeong, Doochun Seo, and Joonki Paik. 2015. "Wavelength-Adaptive Dehazing Using Histogram Merging-Based Classification for UAV Images" Sensors 15, no. 3: 6633-6651. https://doi.org/10.3390/s150306633
APA StyleYoon, I., Jeong, S., Jeong, J., Seo, D., & Paik, J. (2015). Wavelength-Adaptive Dehazing Using Histogram Merging-Based Classification for UAV Images. Sensors, 15(3), 6633-6651. https://doi.org/10.3390/s150306633