<?xml version="1.0" encoding="UTF-8"?>
<!DOCTYPE article PUBLIC "-//NLM//DTD Journal Publishing DTD v2.3 20070202//EN" "journalpublishing.dtd">
<article xmlns:mml="http://www.w3.org/1998/Math/MathML" xmlns:xlink="http://www.w3.org/1999/xlink" xml:lang="en" article-type="research-article">
<front>
<journal-meta>
<journal-id journal-id-type="nlm-ta">Sensors</journal-id>
<journal-title>Sensors</journal-title>
<issn pub-type="epub">1424-8220</issn>
<publisher>
<publisher-name>Molecular Diversity Preservation International (MDPI)</publisher-name></publisher></journal-meta>
<article-meta>
<article-id pub-id-type="doi">10.3390/s120912329</article-id>
<article-id pub-id-type="publisher-id">sensors-12-12329</article-id>
<article-categories>
<subj-group>
<subject>Article</subject></subj-group></article-categories>
<title-group>
<article-title>The Effect of the Thickness of the Sensitive Layer on the Performance of the Accumulating NO<sub>x</sub> Sensor</article-title></title-group>
<contrib-group>
<contrib contrib-type="author">
<name><surname>Groß</surname><given-names>Andrea</given-names></name><xref ref-type="aff" rid="af1-sensors-12-12329"><sup>1</sup></xref></contrib>
<contrib contrib-type="author">
<name><surname>Richter</surname><given-names>Miriam</given-names></name><xref ref-type="aff" rid="af1-sensors-12-12329"><sup>1</sup></xref></contrib>
<contrib contrib-type="author">
<name><surname>Kubinski</surname><given-names>David J.</given-names></name><xref ref-type="aff" rid="af2-sensors-12-12329"><sup>2</sup></xref></contrib>
<contrib contrib-type="author">
<name><surname>Visser</surname><given-names>Jacobus H.</given-names></name><xref ref-type="aff" rid="af2-sensors-12-12329"><sup>2</sup></xref></contrib>
<contrib contrib-type="author">
<name><surname>Moos</surname><given-names>Ralf</given-names></name><xref ref-type="aff" rid="af1-sensors-12-12329"><sup>1</sup></xref><xref ref-type="corresp" rid="c1-sensors-12-12329"><sup>*</sup></xref></contrib></contrib-group>
<aff id="af1-sensors-12-12329">
<label>1</label> University of Bayreuth, Zentrum für Energietechnik, Lehrstuhl für Funktionsmaterialien, Bayreuth 95440, Germany</aff>
<aff id="af2-sensors-12-12329">
<label>2</label> Ford Research and Advanced Engineering, Dearborn, MI 48124, USA</aff>
<author-notes>
<corresp id="c1-sensors-12-12329">
<label>*</label> Author to whom correspondence should be addressed; E-Mail: <email>Functional.Materials@uni-bayreuth.de</email>; Tel.: +49-921-55-7401; Fax: +49-921-55-7405.</corresp></author-notes>
<pub-date pub-type="collection">
<year>2012</year></pub-date>
<pub-date pub-type="epub">
<day>10</day>
<month>09</month>
<year>2012</year></pub-date>
<volume>12</volume>
<issue>9</issue>
<fpage>12329</fpage>
<lpage>12346</lpage>
<history>
<date date-type="received">
<day>02</day>
<month>08</month>
<year>2012</year></date>
<date date-type="rev-recd">
<day>28</day>
<month>08</month>
<year>2012</year></date>
<date date-type="accepted">
<day>31</day>
<month>08</month>
<year>2012</year></date></history>
<permissions>
<copyright-statement>© 2012 by the authors; licensee MDPI, Basel, Switzerland.</copyright-statement>
<copyright-year>2012</copyright-year>
<license>
<p>This article is an open access article distributed under the terms and conditions of the Creative Commons Attribution license (http://creativecommons.org/licenses/by/3.0/).</p></license></permissions>
<abstract>
<p>A novel and promising method to measure low levels of NO<sub>x</sub> utilizes the accumulating sensor principle. During an integration cycle, incoming NO<sub>x</sub> molecules are stored in a sensitive layer based on an automotive lean NO<sub>x</sub> trap (LNT) material that changes its electrical resistivity proportional to the amount of stored NO<sub>x</sub>, making the sensor suitable for long-term detection of low levels of NO<sub>x</sub>. In this study, the influence of the thickness of the sensitive layer, prepared by multiple screen-printing, is investigated. All samples show good accumulating sensing properties for both NO and NO<sub>2</sub>. In accordance to a simplified model, the base resistance of the sensitive layer and the sensitivity to NO<sub>x</sub> decrease with increasing thickness. Contrarily, the sensor response time increases. The linear measurement range of all samples ends at a sensor response of about 30% resulting in an increase of the linearly detectable amount with the thickness. Hence, the variation of the thickness of the sensitive layer is a powerful tool to adapt the linear measurement range (proportional to the thickness) as well as the sensitivity (proportional to the inverse thickness) to the application requirements. Calculations combining the sensor model with the measurement results indicate that for operation in the linear range, about 3% of the LNT material is converted to nitrate.</p></abstract>
<kwd-group>
<kwd>lean NO<sub>x</sub> trap (LNT)</kwd>
<kwd>NO<sub>x</sub> storage and reduction catalyst (NSR)</kwd>
<kwd>low ppm-level NO<sub>x</sub> sensing</kwd>
<kwd>semiconducting gas sensor</kwd>
<kwd>linear measurement range adaption</kwd>
<kwd>carbonate nitrate conversion</kwd></kwd-group></article-meta></front>
<body>
<sec sec-type="intro">
<label>1.</label>
<title>Introduction</title>
<p>Tightened emission and safety regulations have increased the demand for sensitive devices to detect reliably even low levels of NO and NO<sub>2</sub> (NO<sub>x</sub>) over a long measurement period [<xref ref-type="bibr" rid="b1-sensors-12-12329">1</xref>–<xref ref-type="bibr" rid="b3-sensors-12-12329">3</xref>] (e.g., summarized as &lt;100 ppm NO<sub>x</sub> in the automotive exhaust and 0.5–5 ppm NO<sub>2</sub> in the interior by [<xref ref-type="bibr" rid="b1-sensors-12-12329">1</xref>]). In the field of automotive or industrial exhausts or of air quality management, the interest is on the accurate determination of mean values (e.g., 1-h value for air quality monitoring [<xref ref-type="bibr" rid="b4-sensors-12-12329">4</xref>]) or total amounts (e.g., cumulated vehicle emissions in g/km for on-board diagnostics [<xref ref-type="bibr" rid="b5-sensors-12-12329">5</xref>,<xref ref-type="bibr" rid="b6-sensors-12-12329">6</xref>]) rather than on the curve of the actual instantaneous concentration over time. However, most today's gas sensors measure time-continuously the actual analyte concentration [<xref ref-type="bibr" rid="b1-sensors-12-12329">1</xref>]. Cumulated amount mean values are obtained by mathematical averaging (integration). Due to inaccuracies at low analyte levels, long sensor response times and recovery times, as well as due to drifts in the zero point level (baseline), these sensors are subject to errors in the determination of the accumulated analyte levels [<xref ref-type="bibr" rid="b2-sensors-12-12329">2</xref>,<xref ref-type="bibr" rid="b3-sensors-12-12329">3</xref>,<xref ref-type="bibr" rid="b7-sensors-12-12329">7</xref>].</p>
<p>Alternatively the accumulating-type (or integrating-type or dosimeter-type) sensor measures directly the total amounts of analyte gases over a time interval. This novel principle is related to passive samplers being used to determine the cumulated analyte level in two steps. There, over a longer period (e.g., a month) analyte molecules from the ambience are collected in a diffusion controlled process on a sorption material, followed by a quantitative analysis with laboratory gas analysis methods [<xref ref-type="bibr" rid="b8-sensors-12-12329">8</xref>,<xref ref-type="bibr" rid="b9-sensors-12-12329">9</xref>]. Accumulating-type gas sensors presented here are also based on a sensitive layer that collects analyte molecules over a longer period, but in contrast to passive samplers, the analyte level is evaluated instantaneously and time-continuously by electrical means. While chemically sorbing the analyte molecules, the electrical properties of the sensitive layer, e.g., the resistivity, change with the amount of analyte stored. Like in passive samplers, the sorbent material needs to be regenerated periodically as saturation effects occur. The sensor signal of the accumulating NO<sub>x</sub> sensor correlates directly with the total amount of NO<sub>x</sub> (being the sum of NO and NO<sub>2</sub>), whereas the curve of the actual concentration can be obtained from the timely derivative of the sensor signal [<xref ref-type="bibr" rid="b10-sensors-12-12329">10</xref>]. By collecting analyte molecules from the gas stream, even small levels contribute to the sensor signal, enabling accurate analyte detection over an extended time interval. Another important feature is the fact that errors in the sensor's zero level are minimized since the zero-level is redefined after each regeneration step. Both response times and recovery times of the signal derivative as the measurand for the actual concentration are quite low and in the range of the gas exchange time of the setup (&lt;7 s [<xref ref-type="bibr" rid="b10-sensors-12-12329">10</xref>]). The fast sensing characteristics of the accumulating sensor originate from the fact that the change (<italic>i.e.</italic>, the time-based derivative) in the conductivity during NO<sub>x</sub> exposure correlates with the NO<sub>x</sub> concentration. This is in strong contrast to common gas sensors, in which the equilibrium conductivity of the sensor signal is of interest. In the following, the effect of the thickness of the NO<sub>x</sub> storage layer on the NO<sub>x</sub> accumulating sensing properties is addressed.</p></sec>
<sec>
<label>2.</label>
<title>The Accumulating Sensing Concept</title>
<p>The accumulating or integrating-type sensor is intended to detect directly the total amount, <italic>A</italic>, of low levels of analyte by accumulation. Generally, <italic>A</italic> can be calculated according to <xref rid="FD1" ref-type="disp-formula">Equation (1)</xref> from the analyte concentration, <italic>c</italic>(<italic>t</italic>), and the flow rate, <italic>V̇</italic>(<italic>t</italic>). Both may vary with time.</p>
<p>
<disp-formula id="FD1">
<label>(1)</label>
<mml:math id="mm1" display="block">
<mml:semantics id="sm1">
<mml:mrow>
<mml:mi>A</mml:mi>
<mml:mo>=</mml:mo>
<mml:mrow>
<mml:mo>∫</mml:mo>
<mml:mrow>
<mml:mi>c</mml:mi>
<mml:mo stretchy="false">(</mml:mo>
<mml:mi>t</mml:mi>
<mml:mo stretchy="false">)</mml:mo>
<mml:mo>⋅</mml:mo>
<mml:mover accent="true">
<mml:mi>V</mml:mi>
<mml:mo>˙</mml:mo></mml:mover>
<mml:mo stretchy="false">(</mml:mo>
<mml:mi>t</mml:mi>
<mml:mo stretchy="false">)</mml:mo>
<mml:mtext>d</mml:mtext>
<mml:mi>t</mml:mi></mml:mrow></mml:mrow></mml:mrow></mml:semantics></mml:math></disp-formula></p>
<p>In [<xref ref-type="bibr" rid="b11-sensors-12-12329">11</xref>] two setups of the integrating NO<sub>x</sub> sensor are presented. Utilizing a special channel-type setup with a large area of sensitive material compared to the small gas volume inside the channel, all analyte molecules become sorbed and the resulting sensor signal reflects the total amount, <italic>A</italic>, even if the flow rate of the gas varies (amount detector). Contrarily, it was investigated in [<xref ref-type="bibr" rid="b11-sensors-12-12329">11</xref>] that by exposing the sensitive layer of the planar device to a large gas volume, always a constant fraction of the analyte molecules in the gas stream is stored independently on the gas flow rate in a wide range. The sensor signal correlates then with the timely integral of the concentration, ∫<italic>c</italic>(<italic>t</italic>)d<italic>t</italic>. If the flow rate, <italic>V̇</italic>(<italic>t</italic>), remains constant, <italic>A</italic> is directly proportional to the integral of <italic>c</italic>(<italic>t</italic>), <italic>i.e.</italic>, <italic>A</italic> ∝ ∫<italic>c</italic>(<italic>t</italic>)d<italic>t</italic> and the total amount can be determined properly with the planar setup while the signal derivative reflects the curve of <italic>c</italic>(<italic>t</italic>) [<xref ref-type="bibr" rid="b10-sensors-12-12329">10</xref>].</p>
<p>
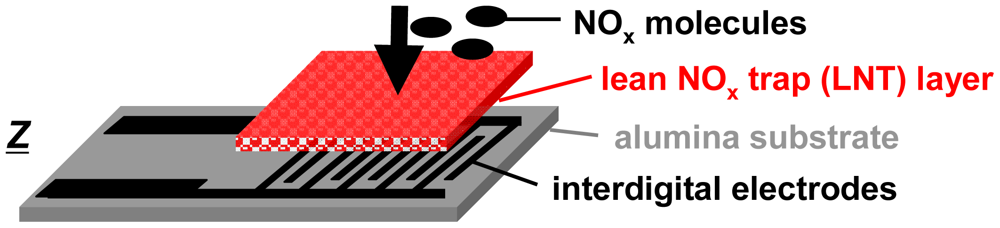
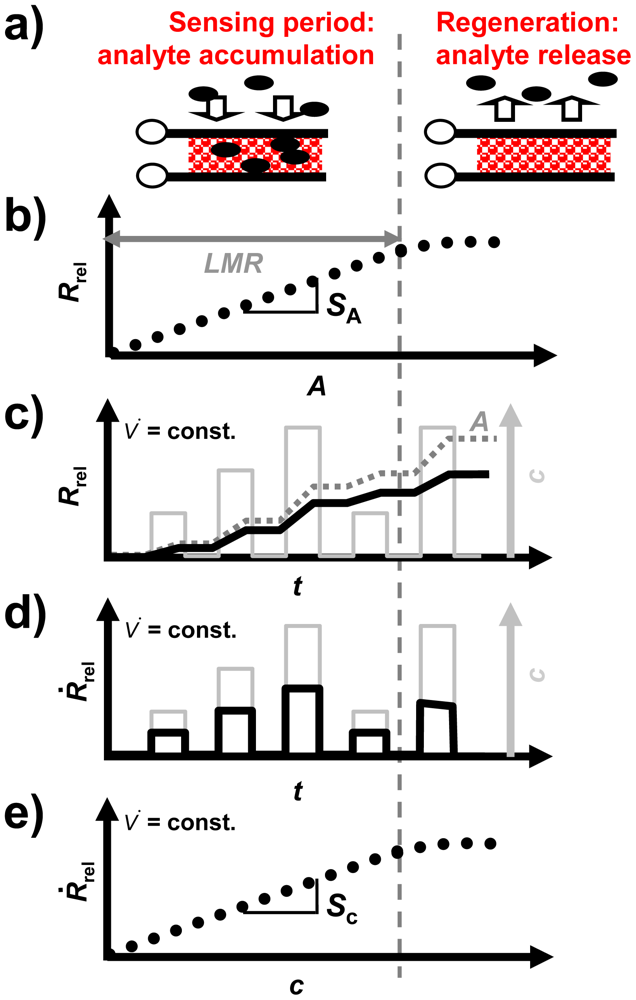
For the accumulating sensing principle sensitive layers of storage materials can be applied. They are able to sorb analyte molecules (e.g., by chemisorption or by a chemical reaction) and thereby they change their electrical properties. As illustrated in <xref ref-type="fig" rid="f1-sensors-12-12329">Figure 1</xref>, the accumulating NO<sub>x</sub> sensor in the planar setup (concentration integrator) consists of a lean NO<sub>x</sub> trap (LNT) layer deposited on an alumina substrate which is equipped with interdigital electrodes (IDEs). It is well known that LNT materials lower their resistivity when transformed from carbonates to nitrates upon NO<sub>x</sub> storage [<xref ref-type="bibr" rid="b12-sensors-12-12329">12</xref>–<xref ref-type="bibr" rid="b15-sensors-12-12329">15</xref>]. Since the accessible sorption sites in the storage material are becoming occupied with proceeding sorption, saturation effects limit the accumulating properties and a regeneration of the sorption sites is required to recover the original sorption capacity. Therefore, as illustrated in <xref ref-type="fig" rid="f2-sensors-12-12329">Figure 2(a)</xref>, in the operation of accumulating sensors the sensing interval during which the sensitive layer (shaded area) accumulates the analyte molecules (black points) from the gas stream alternates with the regeneration interval. The absolute value of the relative resistance change, <italic>R</italic><sub>rel</sub>, calculated by <xref rid="FD2" ref-type="disp-formula">Equation (2)</xref> with <italic>R</italic><sub>0</sub> being the base resistance in the unloaded state, is displayed as the accumulating NO<sub>x</sub> sensor signal:
<disp-formula id="FD2">
<label>(2)</label>
<mml:math id="mm2" display="block">
<mml:semantics id="sm2">
<mml:mrow>
<mml:msub>
<mml:mi>R</mml:mi>
<mml:mrow>
<mml:mtext>rel</mml:mtext></mml:mrow></mml:msub>
<mml:mo>=</mml:mo>
<mml:mfrac>
<mml:mrow>
<mml:mrow>
<mml:mo stretchy="false">|</mml:mo>
<mml:mrow>
<mml:mi mathvariant="normal">Δ</mml:mi>
<mml:mi>R</mml:mi></mml:mrow>
<mml:mo stretchy="false">|</mml:mo></mml:mrow></mml:mrow>
<mml:mrow>
<mml:msub>
<mml:mi>R</mml:mi>
<mml:mn>0</mml:mn></mml:msub></mml:mrow></mml:mfrac>
<mml:mo>=</mml:mo>
<mml:mfrac>
<mml:mrow>
<mml:msub>
<mml:mi>R</mml:mi>
<mml:mn>0</mml:mn></mml:msub>
<mml:mo>−</mml:mo>
<mml:mi>R</mml:mi></mml:mrow>
<mml:mrow>
<mml:msub>
<mml:mi>R</mml:mi>
<mml:mn>0</mml:mn></mml:msub></mml:mrow></mml:mfrac></mml:mrow></mml:semantics></mml:math></disp-formula></p>
<p><italic>R</italic><sub>rel</sub> depends on the loading level which, for low loading states, is proportional to the amount of NO<sub>x</sub> in the gas phase, <italic>A</italic>, as illustrated in <xref ref-type="fig" rid="f2-sensors-12-12329">Figure 2(b)</xref>. The sensor signal on the time scale differs from those of conventional gas sensors due to the stepwise NO<sub>x</sub> accumulation. As shown in <xref ref-type="fig" rid="f2-sensors-12-12329">Figure 2(c)</xref>, <italic>R</italic><sub>rel</sub> (black line) increases in the presence of NO<sub>x</sub>, whereas it remains constant in the NO<sub>x</sub> absence (holding ability)—<italic>R</italic><sub>rel</sub> is proportional to <italic>A</italic> (dark grey line, dotted). In the case of a constant flow rate, <italic>V̇</italic>(<italic>t</italic>), the timely increase of the sensor signal is proportional to the NO<sub>x</sub> concentration <italic>c</italic> (light grey line, right axis). This proportionality enables to determine the curve of the instantaneous concentration using the timely derivative, d<italic>R</italic><sub>rel</sub>/d<italic>t</italic>. In the following, d<italic>R</italic><sub>rel</sub>/d<italic>t</italic> will be denoted as <italic>Ṙ</italic><sub>rel</sub>:
<disp-formula id="FD3">
<label>(3)</label>
<mml:math id="mm3" display="block">
<mml:semantics id="sm3">
<mml:mrow>
<mml:msub>
<mml:mover accent="true">
<mml:mi>R</mml:mi>
<mml:mo>˙</mml:mo></mml:mover>
<mml:mrow>
<mml:mtext>rel</mml:mtext></mml:mrow></mml:msub>
<mml:mo>=</mml:mo>
<mml:mfrac>
<mml:mrow>
<mml:mtext>d</mml:mtext>
<mml:msub>
<mml:mi>R</mml:mi>
<mml:mrow>
<mml:mtext>rel</mml:mtext></mml:mrow></mml:msub></mml:mrow>
<mml:mrow>
<mml:mtext>d</mml:mtext>
<mml:mi>t</mml:mi></mml:mrow></mml:mfrac></mml:mrow></mml:semantics></mml:math></disp-formula></p>
<p><italic>Ṙ</italic><sub>rel</sub> is illustrated as a function of time in <xref ref-type="fig" rid="f2-sensors-12-12329">Figure 2(d)</xref>. As depicted in <xref ref-type="fig" rid="f2-sensors-12-12329">Figure 2(e)</xref>, there is a linear correlation between <italic>Ṙ</italic><sub>rel</sub> and <italic>c</italic>. Hence, to compare the performance of the accumulating sensor with conventional gas sensors, the characteristics of <italic>Ṙ</italic><sub>rel</sub> are appropriate. The sensitivity is commonly defined as the slope of the characteristic line which is the correlation between the sensor signal and the measurand [<xref ref-type="bibr" rid="b16-sensors-12-12329">16</xref>]. Hence, for the accumulating type NO<sub>x</sub> sensor, which is intended to determine <italic>A</italic>, the amount sensitivity, <italic>S</italic><sub>A</sub>, (<xref ref-type="fig" rid="f2-sensors-12-12329">Figure 2(b)</xref>) can be calculated from the correlation between <italic>R</italic><sub>rel</sub> and <italic>A</italic> according to <xref rid="FD4" ref-type="disp-formula">Equation (4)</xref> resulting in the unit %/μL. Additionally, in the case of a constant flow rate, the proportionality between <italic>Ṙ</italic><sub>rel</sub> and <italic>c</italic>, as shown in <xref ref-type="fig" rid="f2-sensors-12-12329">Figure 2(e)</xref>, allows to calculate the concentration sensitivity, <italic>S</italic><sub>c</sub>, according to <xref rid="FD5" ref-type="disp-formula">Equation (5)</xref> which is analogous to the sensitivity known of conventional gas sensors:
<disp-formula id="FD4">
<label>(4)</label>
<mml:math id="mm4" display="block">
<mml:semantics id="sm4">
<mml:mrow>
<mml:msub>
<mml:mi>S</mml:mi>
<mml:mtext>A</mml:mtext></mml:msub>
<mml:mo>=</mml:mo>
<mml:mfrac>
<mml:mrow>
<mml:mtext>d</mml:mtext>
<mml:msub>
<mml:mi>R</mml:mi>
<mml:mrow>
<mml:mtext>rel</mml:mtext></mml:mrow></mml:msub></mml:mrow>
<mml:mrow>
<mml:mtext>d</mml:mtext>
<mml:mi>A</mml:mi></mml:mrow></mml:mfrac></mml:mrow></mml:semantics></mml:math></disp-formula>
<disp-formula id="FD5">
<label>(5)</label>
<mml:math id="mm5" display="block">
<mml:semantics id="sm5">
<mml:mrow>
<mml:msub>
<mml:mi>S</mml:mi>
<mml:mtext>c</mml:mtext></mml:msub>
<mml:mo>=</mml:mo>
<mml:mfrac>
<mml:mrow>
<mml:mtext>d</mml:mtext>
<mml:mo stretchy="false">(</mml:mo>
<mml:mtext>d</mml:mtext>
<mml:msub>
<mml:mi>R</mml:mi>
<mml:mrow>
<mml:mtext>rel</mml:mtext></mml:mrow></mml:msub>
<mml:mo>/</mml:mo>
<mml:mtext>d</mml:mtext>
<mml:mi>t</mml:mi>
<mml:mo stretchy="false">)</mml:mo></mml:mrow>
<mml:mrow>
<mml:mtext>d</mml:mtext>
<mml:mi>c</mml:mi></mml:mrow></mml:mfrac>
<mml:mo>=</mml:mo>
<mml:mfrac>
<mml:mrow>
<mml:mtext>d</mml:mtext>
<mml:msub>
<mml:mover accent="true">
<mml:mi>R</mml:mi>
<mml:mo>˙</mml:mo></mml:mover>
<mml:mrow>
<mml:mtext>rel</mml:mtext></mml:mrow></mml:msub></mml:mrow>
<mml:mrow>
<mml:mtext>d</mml:mtext>
<mml:mi>c</mml:mi></mml:mrow></mml:mfrac></mml:mrow></mml:semantics></mml:math></disp-formula></p>
<p>If one transforms <xref rid="FD4" ref-type="disp-formula">Equation (4)</xref> using <xref rid="FD1" ref-type="disp-formula">Equation (1)</xref>, one obtains:
<disp-formula id="FD6">
<label>(6)</label>
<mml:math id="mm6" display="block">
<mml:semantics id="sm6">
<mml:mrow>
<mml:msub>
<mml:mi>S</mml:mi>
<mml:mtext>A</mml:mtext></mml:msub>
<mml:mo>=</mml:mo>
<mml:mfrac>
<mml:mrow>
<mml:mtext>d</mml:mtext>
<mml:msub>
<mml:mi>R</mml:mi>
<mml:mrow>
<mml:mtext>rel</mml:mtext></mml:mrow></mml:msub></mml:mrow>
<mml:mrow>
<mml:mtext>d</mml:mtext>
<mml:mi>A</mml:mi></mml:mrow></mml:mfrac>
<mml:mo>=</mml:mo>
<mml:mfrac>
<mml:mrow>
<mml:mtext>d</mml:mtext>
<mml:msub>
<mml:mi>R</mml:mi>
<mml:mrow>
<mml:mtext>rel</mml:mtext></mml:mrow></mml:msub>
<mml:mo>/</mml:mo>
<mml:mtext>d</mml:mtext>
<mml:mi>t</mml:mi></mml:mrow>
<mml:mrow>
<mml:mtext>d</mml:mtext>
<mml:mi>A</mml:mi>
<mml:mo>/</mml:mo>
<mml:mtext>d</mml:mtext>
<mml:mi>t</mml:mi></mml:mrow></mml:mfrac>
<mml:mo>=</mml:mo>
<mml:mfrac>
<mml:mrow>
<mml:msub>
<mml:mover accent="true">
<mml:mi>R</mml:mi>
<mml:mo>˙</mml:mo></mml:mover>
<mml:mrow>
<mml:mtext>rel</mml:mtext></mml:mrow></mml:msub></mml:mrow>
<mml:mrow>
<mml:mrow>
<mml:mrow>
<mml:mtext>d</mml:mtext>
<mml:mrow>
<mml:mo>(</mml:mo>
<mml:mrow>
<mml:mrow>
<mml:mo>∫</mml:mo>
<mml:mrow>
<mml:mi>c</mml:mi>
<mml:mo stretchy="false">(</mml:mo>
<mml:mi>t</mml:mi>
<mml:mo stretchy="false">)</mml:mo>
<mml:mo>⋅</mml:mo>
<mml:mover accent="true">
<mml:mi>V</mml:mi>
<mml:mo>˙</mml:mo></mml:mover>
<mml:mo stretchy="false">(</mml:mo>
<mml:mi>t</mml:mi>
<mml:mo stretchy="false">)</mml:mo>
<mml:mtext>d</mml:mtext>
<mml:mi>t</mml:mi></mml:mrow></mml:mrow></mml:mrow>
<mml:mo>)</mml:mo></mml:mrow></mml:mrow>
<mml:mo>/</mml:mo>
<mml:mrow>
<mml:mtext>d</mml:mtext>
<mml:mi>t</mml:mi></mml:mrow></mml:mrow></mml:mrow></mml:mfrac>
<mml:mo>=</mml:mo>
<mml:mfrac>
<mml:mrow>
<mml:msub>
<mml:mover accent="true">
<mml:mi>R</mml:mi>
<mml:mo>˙</mml:mo></mml:mover>
<mml:mrow>
<mml:mtext>rel</mml:mtext></mml:mrow></mml:msub></mml:mrow>
<mml:mrow>
<mml:mover accent="true">
<mml:mi>V</mml:mi>
<mml:mo>˙</mml:mo></mml:mover>
<mml:mo>⋅</mml:mo>
<mml:mi>c</mml:mi></mml:mrow></mml:mfrac></mml:mrow></mml:semantics></mml:math></disp-formula></p>
<p>If <italic>S</italic><sub>c</sub> = const, <italic>i.e.</italic>, <italic>Ṙ</italic><sub>rel</sub> ∝ c, then d<italic>Ṙ</italic><sub>rel</sub>/d<italic>c</italic> can be replaced by <italic>Ṙ</italic><sub>rel</sub>/<italic>c</italic>. Then the relation between <italic>S</italic><sub>c</sub> and <italic>S</italic><sub>A</sub> yields:
<disp-formula id="FD7">
<label>(7)</label>
<mml:math id="mm7" display="block">
<mml:semantics id="sm7">
<mml:mrow>
<mml:msub>
<mml:mi>S</mml:mi>
<mml:mtext>A</mml:mtext></mml:msub>
<mml:mo>=</mml:mo>
<mml:mfrac>
<mml:mn>1</mml:mn>
<mml:mover accent="true">
<mml:mi>V</mml:mi>
<mml:mo>˙</mml:mo></mml:mover></mml:mfrac>
<mml:msub>
<mml:mi>S</mml:mi>
<mml:mi>c</mml:mi></mml:msub></mml:mrow></mml:semantics></mml:math></disp-formula></p>
<p>In other words, the amount-related sensitivity, <italic>S</italic><sub>A</sub>, and the “classical” sensitivity with respect to the concentration, <italic>S</italic><sub>c</sub>, are proportional to each other, as long as the gas flow remains constant. As shown in <xref ref-type="fig" rid="f2-sensors-12-12329">Figure 2(b,e)</xref>, as soon as saturation effects occur and the linear measurement range, <italic>LMR</italic>, is exceeded, <italic>S</italic><sub>A</sub> and <italic>S</italic><sub>c</sub> decrease, and the slope of the signal no longer reflects the concentration (<xref ref-type="fig" rid="f2-sensors-12-12329">Figure 2(b–e)</xref>)—the accumulating sensor demands regeneration.</p>
<p>LNT materials are known from automotive NO<sub>x</sub> storage and reduction catalysts to reduce the NO<sub>x</sub> emissions in the exhaust [<xref ref-type="bibr" rid="b17-sensors-12-12329">17</xref>–<xref ref-type="bibr" rid="b19-sensors-12-12329">19</xref>]. Since NO<sub>x</sub> molecules can be stored in a lean gas atmosphere, whereas they are released and reduced in rich gas compositions, the engine operation cycles between long lean and short rich intervals to ensure low emissions [<xref ref-type="bibr" rid="b5-sensors-12-12329">5</xref>,<xref ref-type="bibr" rid="b17-sensors-12-12329">17</xref>–<xref ref-type="bibr" rid="b19-sensors-12-12329">19</xref>]. LNTs usually consist of alkaline (earth-) oxides or carbonates (e.g., BaCO<sub>3</sub> or K<sub>2</sub>CO<sub>3</sub>) as storage components, finely dispersed precious metal particles to catalyze oxidation and reduction reactions, and support oxides like Al<sub>2</sub>O<sub>3</sub> to provide high surface areas for the catalytic processes [<xref ref-type="bibr" rid="b19-sensors-12-12329">19</xref>,<xref ref-type="bibr" rid="b20-sensors-12-12329">20</xref>]. The storage mechanism is based on the conversion of alkaline (earth-) carbonates MCO<sub>3</sub> or oxides to nitrates M(NO<sub>3</sub>)<sub>2</sub> upon NO<sub>2</sub> exposure according to <xref rid="FD8" ref-type="disp-formula">Equation (8)</xref>. NO needs to be oxidized to NO<sub>2</sub> on the catalytic active particles prior to the nitrate formation according to <xref rid="FD9" ref-type="disp-formula">Equation (9)</xref> [<xref ref-type="bibr" rid="b17-sensors-12-12329">17</xref>,<xref ref-type="bibr" rid="b18-sensors-12-12329">18</xref>,<xref ref-type="bibr" rid="b20-sensors-12-12329">20</xref>]:
<disp-formula id="FD8">
<label>(8)</label>
<mml:math id="mm8" display="block">
<mml:semantics id="sm8">
<mml:mrow>
<mml:mi>M</mml:mi>
<mml:mi>C</mml:mi>
<mml:msub>
<mml:mi>O</mml:mi>
<mml:mn>3</mml:mn></mml:msub>
<mml:mo>+</mml:mo>
<mml:mn>2</mml:mn>
<mml:mi>N</mml:mi>
<mml:msub>
<mml:mi>O</mml:mi>
<mml:mn>2</mml:mn></mml:msub>
<mml:mo>+</mml:mo>
<mml:mfrac>
<mml:mn>1</mml:mn>
<mml:mn>2</mml:mn></mml:mfrac>
<mml:msub>
<mml:mi>O</mml:mi>
<mml:mn>2</mml:mn></mml:msub>
<mml:mo>↔</mml:mo>
<mml:mi>M</mml:mi>
<mml:msub>
<mml:mrow>
<mml:mo stretchy="false">(</mml:mo>
<mml:mi>N</mml:mi>
<mml:msub>
<mml:mi>O</mml:mi>
<mml:mn>3</mml:mn></mml:msub>
<mml:mo stretchy="false">)</mml:mo></mml:mrow>
<mml:mn>2</mml:mn></mml:msub>
<mml:mo>+</mml:mo>
<mml:mi>C</mml:mi>
<mml:msub>
<mml:mi>O</mml:mi>
<mml:mn>2</mml:mn></mml:msub></mml:mrow></mml:semantics></mml:math></disp-formula>
<disp-formula id="FD9">
<label>(9)</label>
<mml:math id="mm9" display="block">
<mml:semantics id="sm9">
<mml:mrow>
<mml:mi>N</mml:mi>
<mml:mi>O</mml:mi>
<mml:mo>+</mml:mo>
<mml:mfrac>
<mml:mn>1</mml:mn>
<mml:mn>2</mml:mn></mml:mfrac>
<mml:msub>
<mml:mi>O</mml:mi>
<mml:mn>2</mml:mn></mml:msub>
<mml:mo>↔</mml:mo>
<mml:mi>N</mml:mi>
<mml:msub>
<mml:mi>O</mml:mi>
<mml:mn>2</mml:mn></mml:msub></mml:mrow></mml:semantics></mml:math></disp-formula></p>
<p>We recently demonstrated the integrating or accumulating NO<sub>x</sub> sensing principle under various gas conditions (base gas composition, temperature) [<xref ref-type="bibr" rid="b10-sensors-12-12329">10</xref>,<xref ref-type="bibr" rid="b21-sensors-12-12329">21</xref>,<xref ref-type="bibr" rid="b22-sensors-12-12329">22</xref>]. Additionally, it was found that the sensitivity to NO is the same as that to NO<sub>2</sub>, thus allowing for total NO<sub>x</sub> detection, and that the sensor is suitable for long-term detection of low levels of NO<sub>x</sub> [<xref ref-type="bibr" rid="b10-sensors-12-12329">10</xref>]. O<sub>2</sub> and CO<sub>2</sub> concentration variations were found to be negligible in a wide range in lean gas containing O<sub>2</sub>, CO<sub>2</sub> and H<sub>2</sub>O [<xref ref-type="bibr" rid="b10-sensors-12-12329">10</xref>,<xref ref-type="bibr" rid="b21-sensors-12-12329">21</xref>].</p>
<p>In order to understand further how NO<sub>x</sub> storage occurs in the catalyst material, the influence of the thickness of the sensitive layer on the performance of the accumulating NO<sub>x</sub> sensor is the focus of this study. This is motivated by the idea that the number of accessible storage sites and hence the fraction of sites occupied by NO<sub>x</sub> upon NO<sub>x</sub> exposure should depend on the thickness of the LNT coating if the LNT coated area remains the same. The obtained results may even be of interest for LNT catalyst research and may help to elucidate more details about the storage reactions.</p></sec>
<sec>
<label>3.</label>
<title>Expected Influence of the Thickness of the Sensitive Layer—Some Pre-Considerations</title>
<p>
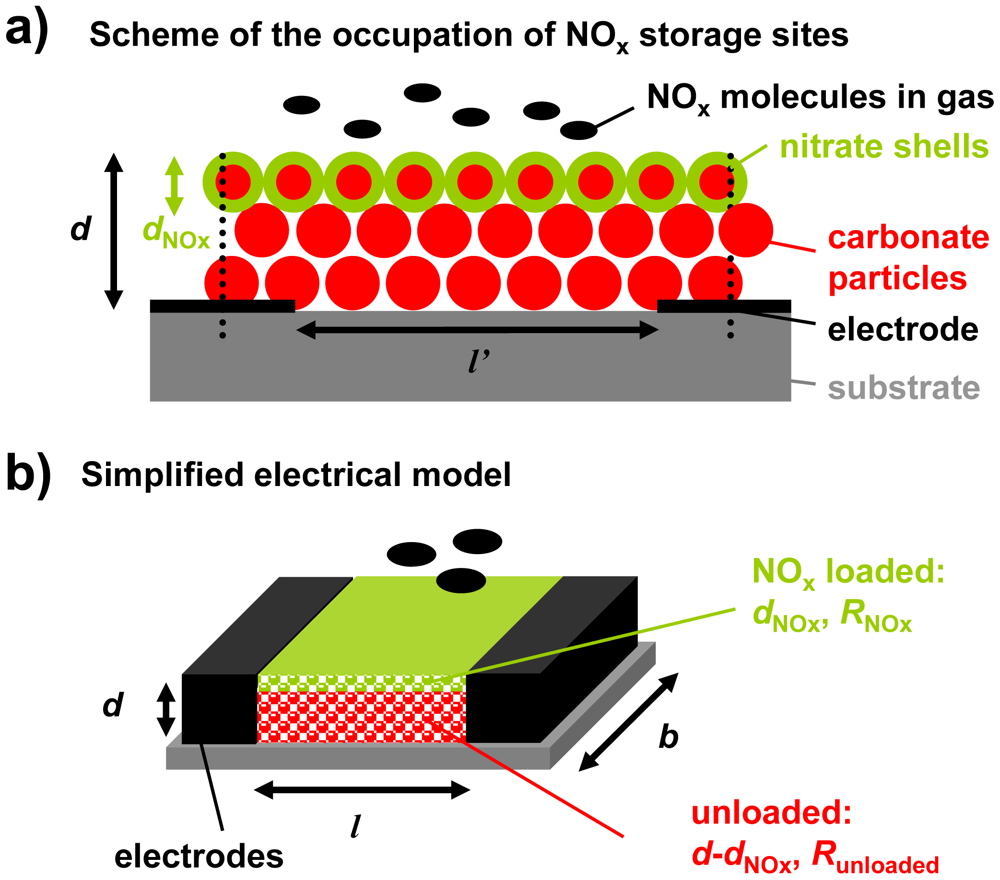
The storage capacity and hence the number of accessible storage sites control the analyte accumulation properties of LNT catalysts. Hence, it is expected that the thickness of the carbonate layer affects the accumulating sensing properties. As described in <xref ref-type="fig" rid="f3-sensors-12-12329">Figure 3</xref>, a simplified model of the configuration containing the storage material (red) and the interdigital electrodes (black) was developed for a rough estimation of this influence.</p>
<p>From catalyst research it has been known that NO<sub>x</sub> storage occurs mainly at the surface of the LNT material that is in contact with the gas phase, resulting in less than 40% utilization of the available storage sites upon saturation [<xref ref-type="bibr" rid="b23-sensors-12-12329">23</xref>–<xref ref-type="bibr" rid="b25-sensors-12-12329">25</xref>]. This means that even in the highly loaded state, only a fraction of the storage sites are involved in the storage process. Additionally, nitrate formation is accompanied by a shrinking of the pore structure since the nitrates have a higher molar volume than the corresponding carbonates [<xref ref-type="bibr" rid="b26-sensors-12-12329">26</xref>]. In the case of K<sub>2</sub>CO<sub>3</sub>, the volume theoretically increases by almost 70% upon storing NO<sub>x</sub>. The decreased diameter of the pores lowers the diffusion of the NO<sub>x</sub> molecules into the carbonate particles and the NO<sub>x</sub> loaded zones can be modeled as dense nitrate shells at the surface of the LNT particles (shrinking core type model [<xref ref-type="bibr" rid="b26-sensors-12-12329">26</xref>,<xref ref-type="bibr" rid="b27-sensors-12-12329">27</xref>]). Since the accumulating NO<sub>x</sub> sensor is exposed to small NO<sub>x</sub> concentrations and is only operated in the low loading state, nitrate shells are expected to form mainly at the upper surface area of the LNT layer, which is in close contact to the analyte gas phase. Hence, the occupation of NO<sub>x</sub> storage sites in the sensitive layer by NO<sub>x</sub> molecules can be illustrated as shown in <xref ref-type="fig" rid="f3-sensors-12-12329">Figure 3(a)</xref>. Thereby, the thickness of the NO<sub>x</sub> loaded area, <italic>d</italic><sub>NOx</sub>, increases with progressive NO<sub>x</sub> exposure. If the distance between the electrodes, <italic>l</italic>′, is much larger than the film thickness, <italic>d</italic>, the electrical field lines between the electrode fingers are parallel and homogenously distributed. Almost the entire flux is inside the material [<xref ref-type="bibr" rid="b28-sensors-12-12329">28</xref>]. Hence, in a simplified model of the sensor setup, the LNT layer can be described as a resistive material in between two parallel electrodes with the distance <italic>l</italic> (<xref ref-type="fig" rid="f3-sensors-12-12329">Figure 3(b)</xref>). The term <italic>l</italic> is related to the distance of the planar electrodes of the IDEs, <italic>l′</italic>. The relation between <italic>l</italic> and <italic>l′</italic> can be calculated which has even been experimentally proven in [<xref ref-type="bibr" rid="b29-sensors-12-12329">29</xref>].</p>
<p>Applying this simplified model of <xref ref-type="fig" rid="f3-sensors-12-12329">Figure 3(b)</xref> for the case of the regenerated state (<italic>d</italic><sub>NOx</sub> = 0), the base resistance of the accumulating NO<sub>x</sub> sensor in the unloaded state, <italic>R</italic><sub>0</sub>, can be calculated from the geometry and the resistivity of the carbonate material, <italic>ρ</italic><sub>0</sub>, by <xref rid="FD10" ref-type="disp-formula">Equation (10)</xref>. Therefore, it is expected that <italic>R</italic><sub>0</sub> correlates with the inverse thickness, 1/<italic>d</italic>:
<disp-formula id="FD10">
<label>(10)</label>
<mml:math id="mm10" display="block">
<mml:semantics id="sm10">
<mml:mrow>
<mml:msub>
<mml:mi>R</mml:mi>
<mml:mn>0</mml:mn></mml:msub>
<mml:mo>=</mml:mo>
<mml:msub>
<mml:mi>ρ</mml:mi>
<mml:mn>0</mml:mn></mml:msub>
<mml:mfrac>
<mml:mi>l</mml:mi>
<mml:mrow>
<mml:mi>b</mml:mi>
<mml:mi>d</mml:mi></mml:mrow></mml:mfrac>
<mml:mo>∝</mml:mo>
<mml:mfrac>
<mml:mn>1</mml:mn>
<mml:mi>d</mml:mi></mml:mfrac></mml:mrow></mml:semantics></mml:math></disp-formula></p>
<p>Upon exposure to NO<sub>x</sub>, it is assumed that surface nitrate is formed. Hence, the corresponding simplified model in the partly loaded state contains a thin nitrate film with the resistance <italic>R</italic><sub>NOx</sub> and the thickness <italic>d</italic><sub>NOx</sub> on top of the remaining unloaded material with the resistance <italic>R</italic><sub>unloaded</sub>, as shown in <xref ref-type="fig" rid="f3-sensors-12-12329">Figure 3(b)</xref>. The resulting resistance of the sensitive layer, <italic>R</italic>, can be calculated as a parallel circuit of both fractions (<italic>R</italic><sub>NOx</sub>‖<italic>R</italic><sub>unloaded</sub>). The sensor signal <italic>R</italic><sub>rel</sub> can then be calculated from the sensor geometry, the resistivity of the sensitive material in the unloaded state, <italic>ρ</italic><sub>0</sub>, and the resistivity of the NO<sub>x</sub> loaded material, <italic>ρ</italic><sub>NOx</sub>, according to <xref rid="FD11" ref-type="disp-formula">Equation (11)</xref>:
<disp-formula id="FD11">
<label>(11)</label>
<mml:math id="mm11" display="block">
<mml:semantics id="sm11">
<mml:mrow>
<mml:msub>
<mml:mi>R</mml:mi>
<mml:mrow>
<mml:mtext>rel</mml:mtext></mml:mrow></mml:msub>
<mml:mo>=</mml:mo>
<mml:mfrac>
<mml:mrow>
<mml:mrow>
<mml:mo stretchy="false">|</mml:mo>
<mml:mrow>
<mml:mi mathvariant="normal">Δ</mml:mi>
<mml:mi>R</mml:mi></mml:mrow>
<mml:mo stretchy="false">|</mml:mo></mml:mrow></mml:mrow>
<mml:mrow>
<mml:msub>
<mml:mi>R</mml:mi>
<mml:mn>0</mml:mn></mml:msub></mml:mrow></mml:mfrac>
<mml:mo>=</mml:mo>
<mml:mfrac>
<mml:mn>1</mml:mn>
<mml:mrow>
<mml:mfrac>
<mml:mi>d</mml:mi>
<mml:mrow>
<mml:msub>
<mml:mi>d</mml:mi>
<mml:mrow>
<mml:mtext mathvariant="italic">NOx</mml:mtext></mml:mrow></mml:msub>
<mml:mo stretchy="false">(</mml:mo>
<mml:msub>
<mml:mi>ρ</mml:mi>
<mml:mn>0</mml:mn></mml:msub>
<mml:mo>/</mml:mo>
<mml:msub>
<mml:mi>ρ</mml:mi>
<mml:mrow>
<mml:mtext>NOx</mml:mtext></mml:mrow></mml:msub>
<mml:mo>−</mml:mo>
<mml:mn>1</mml:mn>
<mml:mo stretchy="false">)</mml:mo></mml:mrow></mml:mfrac>
<mml:mo>+</mml:mo>
<mml:mn>1</mml:mn></mml:mrow></mml:mfrac></mml:mrow></mml:semantics></mml:math></disp-formula><italic>d</italic><sub>NOx</sub> can be assumed to be very small compared to the thickness of the sensitive layer, <italic>d</italic>, since only the lightly loaded state is considered. If it is further considered that the resistivity decreases by at least one order of magnitude in the presence of NO<sub>x</sub>, <xref rid="FD11" ref-type="disp-formula">Equation (11)</xref> can be simplified to <xref rid="FD12" ref-type="disp-formula">Equation (12)</xref> meaning that <italic>R</italic><sub>rel</sub> is proportional to 1/<italic>d</italic>:
<disp-formula id="FD12">
<label>(12)</label>
<mml:math id="mm12" display="block">
<mml:semantics id="sm12">
<mml:mrow>
<mml:msub>
<mml:mi>R</mml:mi>
<mml:mrow>
<mml:mtext>rel</mml:mtext></mml:mrow></mml:msub>
<mml:mo>≈</mml:mo>
<mml:mfrac>
<mml:mrow>
<mml:msub>
<mml:mi>d</mml:mi>
<mml:mrow>
<mml:mtext>NOx</mml:mtext></mml:mrow></mml:msub>
<mml:mo>⋅</mml:mo>
<mml:mo stretchy="false">(</mml:mo>
<mml:msub>
<mml:mi>ρ</mml:mi>
<mml:mn>0</mml:mn></mml:msub>
<mml:mo>/</mml:mo>
<mml:msub>
<mml:mi>ρ</mml:mi>
<mml:mrow>
<mml:mtext>NOx</mml:mtext></mml:mrow></mml:msub>
<mml:mo>−</mml:mo>
<mml:mn>1</mml:mn>
<mml:mo stretchy="false">)</mml:mo></mml:mrow>
<mml:mi>d</mml:mi></mml:mfrac>
<mml:mo>∝</mml:mo>
<mml:mfrac>
<mml:mn>1</mml:mn>
<mml:mi>d</mml:mi></mml:mfrac></mml:mrow></mml:semantics></mml:math></disp-formula></p>
<p>Since <italic>A</italic> is independent of <italic>d</italic> and the same amount of NO<sub>x</sub> is expected to result in the same thickness of the formed NO<sub>x</sub> loaded layer, <xref rid="FD4" ref-type="disp-formula">Equations (4)</xref> and <xref rid="FD12" ref-type="disp-formula">(12)</xref> lead to <xref rid="FD13" ref-type="disp-formula">Equation (13)</xref> and the amount-sensitivity, <italic>S</italic><sub>A</sub>, should correlate with 1/<italic>d</italic> as well:
<disp-formula id="FD13">
<label>(13)</label>
<mml:math id="mm13" display="block">
<mml:semantics id="sm13">
<mml:mrow>
<mml:msub>
<mml:mi>S</mml:mi>
<mml:mtext>A</mml:mtext></mml:msub>
<mml:mo>=</mml:mo>
<mml:mfrac>
<mml:mrow>
<mml:mtext>d</mml:mtext>
<mml:msub>
<mml:mi>R</mml:mi>
<mml:mrow>
<mml:mtext>rel</mml:mtext></mml:mrow></mml:msub></mml:mrow>
<mml:mrow>
<mml:mtext>d</mml:mtext>
<mml:mi>A</mml:mi></mml:mrow></mml:mfrac>
<mml:mo>≈</mml:mo>
<mml:mfrac>
<mml:mrow>
<mml:msub>
<mml:mi>ρ</mml:mi>
<mml:mn>0</mml:mn></mml:msub>
<mml:mo>/</mml:mo>
<mml:msub>
<mml:mi>ρ</mml:mi>
<mml:mrow>
<mml:mtext>NOx</mml:mtext></mml:mrow></mml:msub>
<mml:mo>−</mml:mo>
<mml:mn>1</mml:mn></mml:mrow>
<mml:mi>d</mml:mi></mml:mfrac>
<mml:mo>⋅</mml:mo>
<mml:mfrac>
<mml:mrow>
<mml:mtext>d</mml:mtext>
<mml:mo stretchy="false">(</mml:mo>
<mml:msub>
<mml:mi>d</mml:mi>
<mml:mrow>
<mml:mtext>NOx</mml:mtext></mml:mrow></mml:msub>
<mml:mo stretchy="false">)</mml:mo></mml:mrow>
<mml:mrow>
<mml:mtext>d</mml:mtext>
<mml:mi>A</mml:mi></mml:mrow></mml:mfrac>
<mml:mo>∝</mml:mo>
<mml:mfrac>
<mml:mn>1</mml:mn>
<mml:mi>d</mml:mi></mml:mfrac></mml:mrow></mml:semantics></mml:math></disp-formula></p>
<p>As the resistivity decreases by at least one order upon saturation in NO<sub>x</sub>, (<italic>ρ</italic><sub>0</sub>/<italic>ρ</italic><sub>NOx</sub>−1) ≥ 10 and <xref rid="FD13" ref-type="disp-formula">Equation (13)</xref> can be simplified to <xref rid="FD14" ref-type="disp-formula">Equation (14)</xref>:
<disp-formula id="FD14">
<label>(14)</label>
<mml:math id="mm14" display="block">
<mml:semantics id="sm14">
<mml:mrow>
<mml:msub>
<mml:mi>S</mml:mi>
<mml:mtext>A</mml:mtext></mml:msub>
<mml:mo>=</mml:mo>
<mml:mfrac>
<mml:mrow>
<mml:mtext>d</mml:mtext>
<mml:msub>
<mml:mi>R</mml:mi>
<mml:mrow>
<mml:mtext>rel</mml:mtext></mml:mrow></mml:msub></mml:mrow>
<mml:mrow>
<mml:mtext>d</mml:mtext>
<mml:mi>A</mml:mi></mml:mrow></mml:mfrac>
<mml:mo>≈</mml:mo>
<mml:mfrac>
<mml:mrow>
<mml:msub>
<mml:mi>ρ</mml:mi>
<mml:mn>0</mml:mn></mml:msub></mml:mrow>
<mml:mrow>
<mml:msub>
<mml:mi>ρ</mml:mi>
<mml:mrow>
<mml:mtext>NOx</mml:mtext></mml:mrow></mml:msub></mml:mrow></mml:mfrac>
<mml:mo>⋅</mml:mo>
<mml:mfrac>
<mml:mn>1</mml:mn>
<mml:mi>d</mml:mi></mml:mfrac>
<mml:mo>⋅</mml:mo>
<mml:mfrac>
<mml:mrow>
<mml:mtext>d</mml:mtext>
<mml:mo stretchy="false">(</mml:mo>
<mml:msub>
<mml:mi>d</mml:mi>
<mml:mrow>
<mml:mtext>NOx</mml:mtext></mml:mrow></mml:msub>
<mml:mo stretchy="false">)</mml:mo></mml:mrow>
<mml:mrow>
<mml:mtext>d</mml:mtext>
<mml:mi>A</mml:mi></mml:mrow></mml:mfrac>
<mml:mo>∝</mml:mo>
<mml:mfrac>
<mml:mn>1</mml:mn>
<mml:mi>d</mml:mi></mml:mfrac></mml:mrow></mml:semantics></mml:math></disp-formula></p>
<p>Since <italic>S</italic><sub>A</sub> ∝ <italic>S</italic><sub>c</sub> for constant gas flows, even the classical concentration-related sensitivity, <italic>S</italic><sub>c</sub>, is expected to depend on 1/<italic>d</italic> and to increase the thinner the sensing layers are.</p>
<p>This simplified model points out that the thickness of the sensitive layer might be an effective tool to vary the sensing properties (especially the sensitivity) of the accumulating NO<sub>x</sub> sensor. In the following study, the model was validated by exposing samples with various thicknesses to NO<sub>x</sub> containing gas flows and monitoring the sensing performance.</p></sec>
<sec>
<label>4.</label>
<title>Experimental</title>
<p>Samples with coatings of different thicknesses were prepared and exposed to various gas compositions containing NO, NO<sub>2</sub> or total NO<sub>x</sub>. As illustrated in <xref ref-type="fig" rid="f1-sensors-12-12329">Figure 1</xref>, the accumulating NO<sub>x</sub> sensor consists of an LNT layer (potassium-based LNT material provided by Johnson Matthey, composition details given in [<xref ref-type="bibr" rid="b30-sensors-12-12329">30</xref>]) deposited on platinum interdigital electrodes (IDEs) with an area of 5 × 6 mm<sup>2</sup> and an electrode width and spacing of 100 μm on an alumina substrate with a purity of 96%. After drying and milling the catalyst powder, a screen-printable paste was made by adding organic additives (KD 2721, Zschimmer &amp; Schwarz). To obtain samples with sensitive layers in various thicknesses, the IDE area was screen-printed multiple times with the LNT-paste with intermediate drying periods. After firing at 650 °C to remove organic additives, the sensing properties of the samples were analyzed at 380 °C in a sensor test bench. Thereby, lean measurements periods and rich desorption periods were periodically applied. The gas flow was kept constant at <italic>V̇</italic>(<italic>t</italic>) = 2 L/min. The base lean gas consisted of 10% O<sub>2</sub>, 5% CO<sub>2</sub>, and 50% N<sub>2</sub> humidified (by a water bubbler at room temperature) in N<sub>2</sub>, whereas the rich gas for regeneration contained 1.5% H<sub>2</sub>, 5% CO<sub>2</sub>, and 50% N<sub>2</sub> humidified in N<sub>2</sub>. Different NO<sub>x</sub> gas compositions were admixed. The NO and NO<sub>2</sub> concentrations were monitored by a chemiluminescence detector downstream of the sensor sample. The complex impedances of the sensitive devices were measured in the frequency range from 0.1 Hz to 20 MHz. The electrical characteristics of the bulk material can be described by an <italic>R</italic>‖<italic>C</italic> parallel equivalent circuit. In time-continuous measurements, <italic>R</italic> was calculated from the impedance taken at 1 kHz applying the <italic>R</italic>‖<italic>C</italic> model. The thicknesses of the sensitive layers were estimated using SEM micrographs.</p></sec>
<sec sec-type="results|discussion">
<label>5.</label>
<title>Results and Discussion</title>
<sec sec-type="methods">
<label>5.1.</label>
<title>Thickness Determination from SEM Analysis</title>
<p>
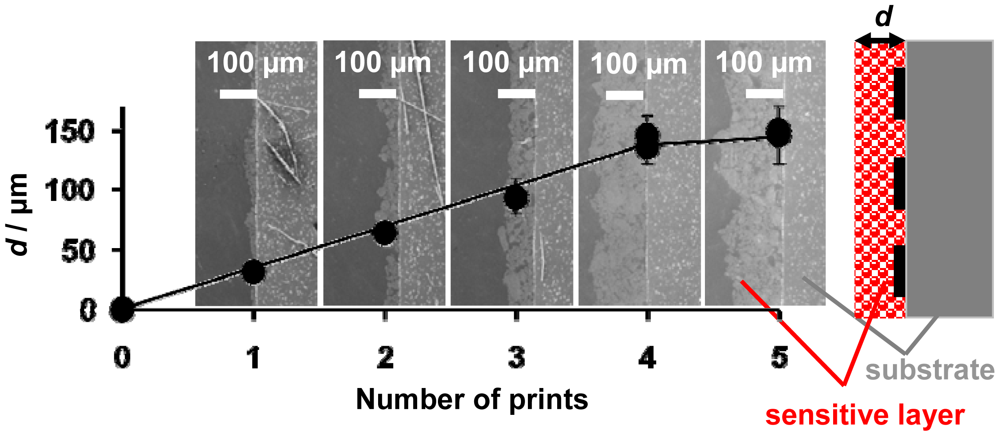
SEM images from the cross sections of the sensor samples printed multiple times with the LNT paste and an illustration for clarification reasons are shown in <xref ref-type="fig" rid="f4-sensors-12-12329">Figure 4</xref>. The microstructure of the sensitive layers is dominated by loose grains of different diameters. The thickness increased with each printing step from about 30 μm (printed only once) to 150 μm (printed five times). The samples printed four and five times had almost the same thickness. This might be due to a densification of the LNT material with successive printing as it is well known when printing porous films or due to a erroneous thickness determination as a result of the increased roughness. In general, the surface is very rough, with an increasing roughness in the case of thicker coatings lowering the accuracy of the thickness evaluation.</p></sec>
<sec>
<label>5.2.</label>
<title>Base Resistance as a Function of the Thickness</title>
<p>
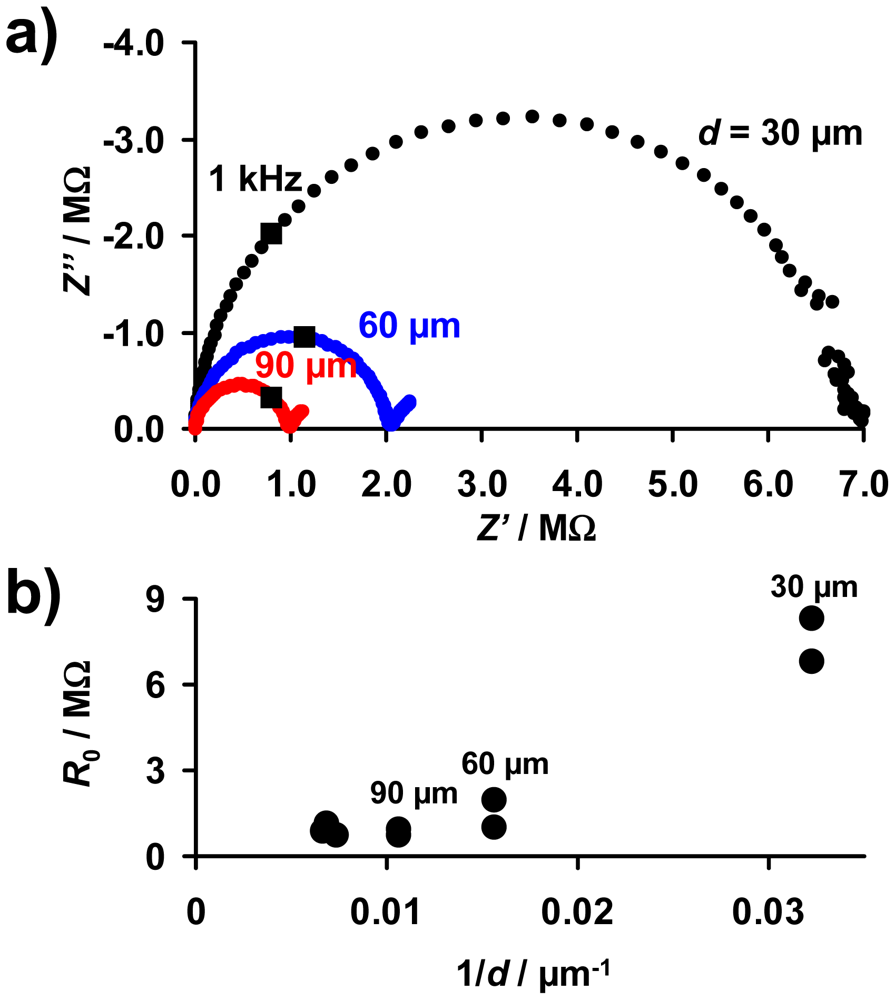
As described above, the base resistance of the sensitive layer in the unloaded state, <italic>R</italic><sub>0</sub>, is expected to be proportional to 1/<italic>d</italic> (<xref rid="FD10" ref-type="disp-formula">Equation (10)</xref>). For an electrical characterization of the sensitive layer, complex impedance plots of the samples with sensitive LNT layers of 30 to 150 μm were taken. The electrical properties of all investigated sensor samples between 10 Hz and 20 MHz can be described by an <italic>R</italic>‖<italic>C</italic> equivalent circuit. <xref ref-type="fig" rid="f5-sensors-12-12329">Figure 5(a)</xref> shows exemplarily Nyquist plots of samples with layers of 30, 60, and 90 μm. The data points measured at 1 kHz are marked. Fitting the spectra by an <italic>R</italic>‖<italic>C</italic> model, the values of <italic>R</italic><sub>0</sub> were obtained and are plotted as a function of 1/<italic>d</italic> in <xref ref-type="fig" rid="f5-sensors-12-12329">Figure 5(b)</xref>. <italic>R</italic><sub>0</sub> increases with decreasing thickness, although no exact 1/<italic>d</italic>-dependency occurs. The resistances of the samples with the thinnest layers (30 μm) are especially high, resulting in deviations from the expected 1/<italic>d</italic>-behavior (<xref rid="FD10" ref-type="disp-formula">Equation (10)</xref>). This may be caused by the loose packing of the catalyst particles in the coating and by inaccuracies in the thickness estimation due to the film unevenness. Furthermore, the simple model depicted in <xref ref-type="fig" rid="f3-sensors-12-12329">Figure 3(a)</xref> that leads to <xref rid="FD10" ref-type="disp-formula">Equation (10)</xref> is only valid if the layers are by far thinner than the distance between the IDE fingers (<italic>d</italic> ≪ <italic>l′</italic>). This was confirmed in [<xref ref-type="bibr" rid="b28-sensors-12-12329">28</xref>] by modeling the electrical flux lines in a system of a highly resistive substrate, metallic IDEs, and a resistive sensitive layer covering the IDEs. Since the distance between the electrodes of the applied IDE samples is 100 μm, it is assumed that in samples with coating of 100 μm and above there are less flux lines in the outer LNT material. Therefore, the outer parts of the LNT layer do not or only slightly contribute to the overall resistance. As a result, these thicker films may no longer exhibit the <italic>R</italic><sub>0</sub> ∝ 1/<italic>d</italic> behavior.</p></sec>
<sec>
<label>5.3.</label>
<title>Direct Accumulative Amount Detection</title>
<p>
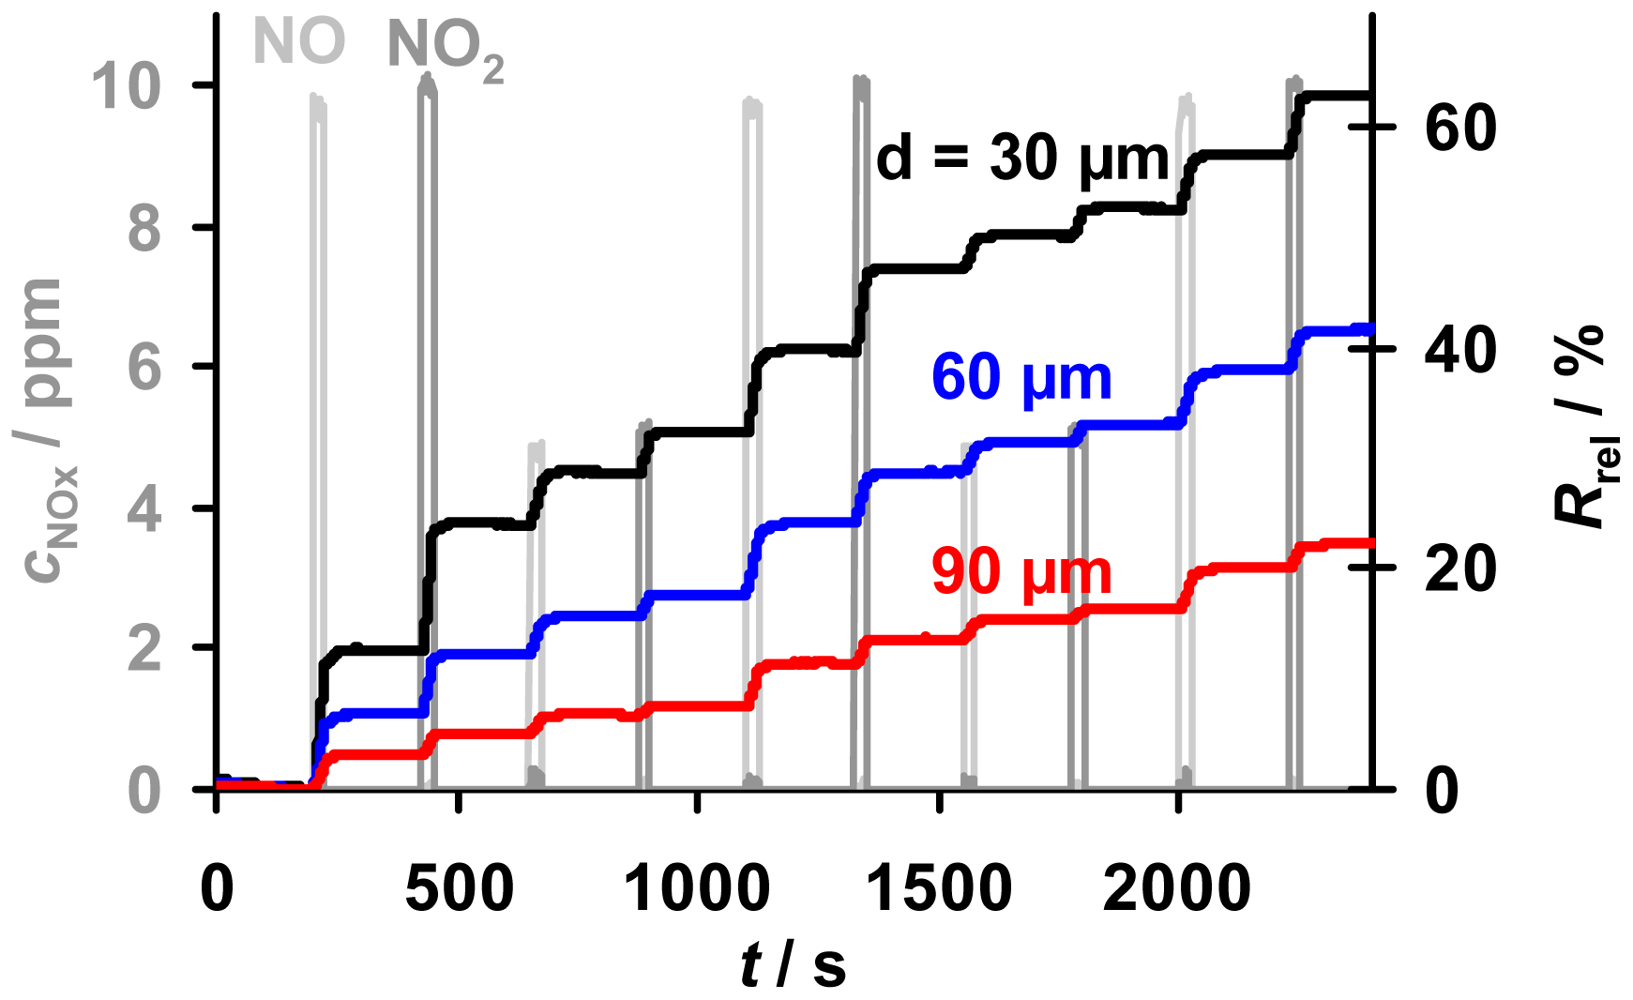
A cyclic test program to investigate the accumulating sensing properties of the samples with various thicknesses in low levels of NO<sub>x</sub> (here 10 ppm and less), especially the holding capability in the absence of NO<sub>x</sub>, is given in <xref ref-type="fig" rid="f6-sensors-12-12329">Figure 6</xref>. Also shown is a comparison of the sensor responses, <italic>R</italic><sub>rel</sub>, towards NO and NO<sub>2</sub>. The samples with layers from 30 to 90 μm were exposed to alternating NO and NO<sub>2</sub> steps of 25 s with concentrations of 5 and 10 ppm interrupted by NO<sub>x</sub> pauses of 200 s. Due to the lower resistivity of the nitrate compared to the carbonate form of the storage material, the resistance decreased during NO<sub>x</sub> loading, yielding an increase in <italic>R</italic><sub>rel</sub> [<xref ref-type="bibr" rid="b10-sensors-12-12329">10</xref>,<xref ref-type="bibr" rid="b13-sensors-12-12329">13</xref>]. For all samples in <xref ref-type="fig" rid="f6-sensors-12-12329">Figure 6</xref>, <italic>R</italic><sub>rel</sub> increases linearly at constant NO<sub>x</sub> concentration, with an almost equal response to NO and NO<sub>2</sub>, while <italic>R</italic><sub>rel</sub> remains constant in 0 ppm NO<sub>x</sub>. It is evident that the sensors are less sensitive to NO<sub>x</sub> the thicker the storage layers are, albeit the samples are exposed to the same NO<sub>x</sub> profile. The constancy of <italic>R</italic><sub>rel</sub> during the 200 s intervals without NO<sub>x</sub> reveals that all sensitive layers are able to keep the stepwise accumulated NO<sub>x</sub> molecules - even in the absence of NO<sub>x</sub>. This indicates that the storage capacities of the samples with various thicknesses are not nearing saturation and that the formed nitrates are highly stable in the applied conditions enabling accumulating NO<sub>x</sub> sensing. Hence, all applied samples with various thicknesses provide accumulating NO<sub>x</sub> sensing properties.</p>
<p>A more detailed analysis of the dependency of the sensitivity, the linear measurement range and the sensor response time on the thickness of the sensitive layer is given in the next sections.</p></sec>
<sec>
<label>5.4.</label>
<title>Concentration Detection by the Signal Derivative
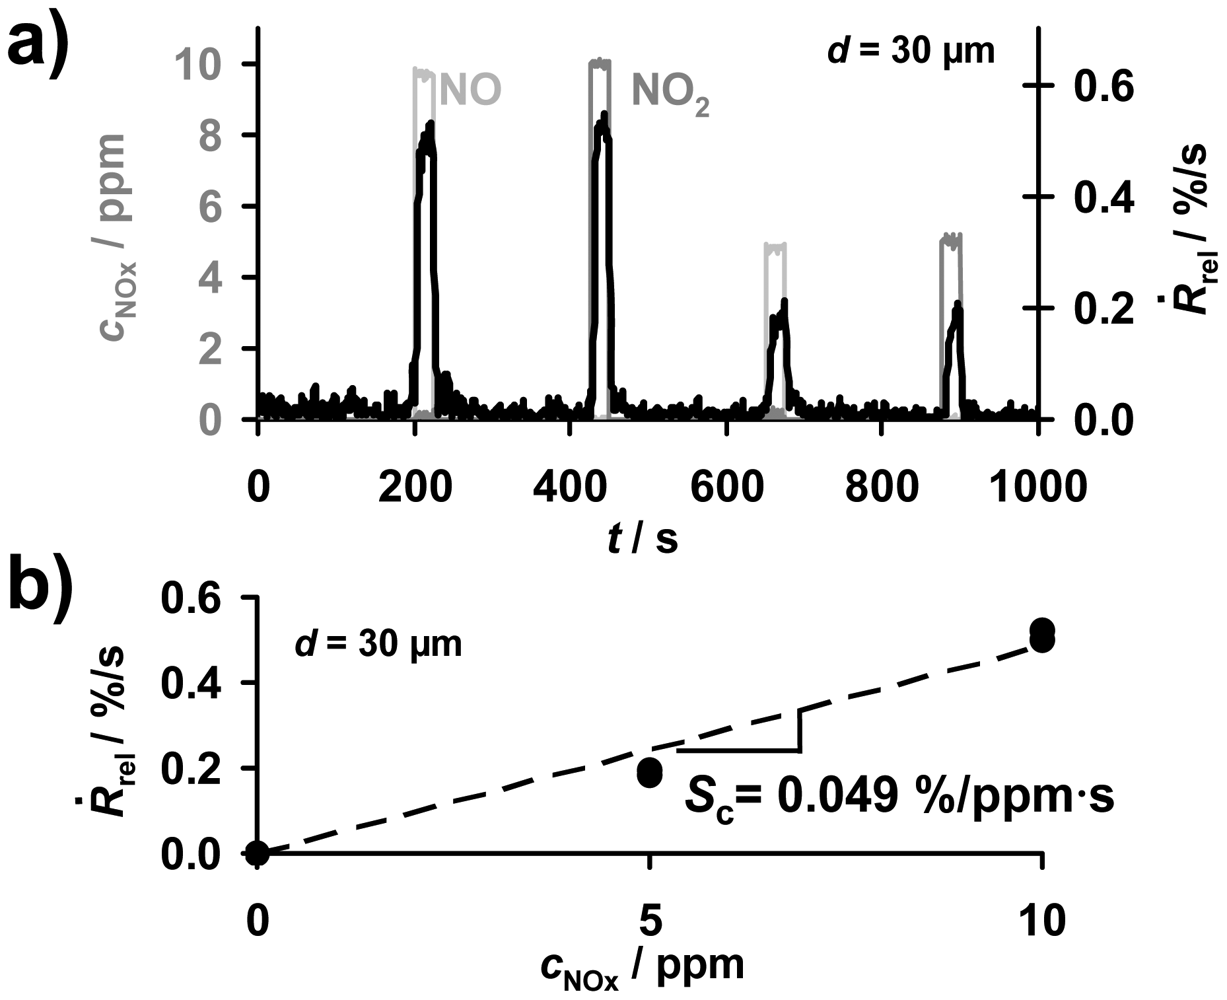
</title>
<p>The progressive accumulation of NO<sub>x</sub> molecules in the sensitive layer in the presence of NO<sub>x</sub> enables the direct detection of the total NO<sub>x</sub> amount. As sketched in <xref ref-type="fig" rid="f2-sensors-12-12329">Figure 2</xref>, in the case of a constant flow rate, the time-based signal derivative, <italic>Ṙ</italic><sub>rel</sub> according to <xref rid="FD3" ref-type="disp-formula">Equation (3)</xref>, of the ideal accumulating sensor in the low loaded state can be applied to obtain information about the actual NO<sub>x</sub> concentration, <italic>c</italic><sub>NOx</sub>. To compare accumulating-type sensors with conventional gas sensors, one has to analyze the concentration sensitivity <italic>S</italic><sub>c</sub>, <italic>i.e.</italic>, the derivative <italic>S<sub>c</sub></italic> = d<italic>Ṙ</italic><sub>rel</sub>/<italic>d<sub>c</sub></italic> according to <xref rid="FD5" ref-type="disp-formula">Equation (5)</xref>. Exemplarily, the corresponding data of the signal derivative <italic>Ṙ</italic><sub>rel</sub> of the sample coated with a 30 μm storage layer are plotted in <xref ref-type="fig" rid="f7-sensors-12-12329">Figure 7(a)</xref>. During the first four NO<sub>x</sub> periods, <italic>Ṙ</italic><sub>rel</sub> reflects the curve of <italic>c</italic><sub>NOx</sub> being the sum of <italic>c</italic><sub>NO</sub> and <italic>c</italic><sub>NO2</sub> allowing for determining the actual NO<sub>x</sub> concentration. The corresponding characteristic line for the concentration detection correlating <italic>Ṙ</italic><sub>rel</sub> and <italic>c</italic><sub>NOx</sub> is given in <xref ref-type="fig" rid="f7-sensors-12-12329">Figure 7(b)</xref>. <italic>Ṙ</italic><sub>rel</sub> increases with an increased NO<sub>x</sub> concentration in the gas. Hence, the NO<sub>x</sub> sensitivity, <italic>S</italic><sub>c</sub>, of the 30 μm sample can be calculated from <xref rid="FD5" ref-type="disp-formula">Equation (5)</xref> and was found to be 0.049%/ppm·s. This means that the resistance decreases by 0.049%/s upon exposure to 1 ppm NO<sub>x</sub>. The analysis of the sensor response times for the concentration detection by <italic>Ṙ</italic><sub>rel</sub> in dependency of the thickness of the sensitive layer will be discussed in detail in Sections 5 and 6. From <italic>Ṙ</italic><sub>rel</sub> in <xref ref-type="fig" rid="f7-sensors-12-12329">Figure 7</xref>, one obtains a sensor response and recovery time of about 5 to 8 s, which is in the range of the gas exchange time of the setup. <xref ref-type="fig" rid="f7-sensors-12-12329">Figure 7</xref> demonstrates that besides detecting directly the total NO<sub>x</sub> amount, the signal derivative of the accumulating NO<sub>x</sub> sensor allows NO<sub>x</sub> concentration monitoring with a high sensitivity and a fast sensor response.</p></sec>
<sec>
<label>5.5.</label>
<title>The Effect of the Thickness on the Sensitivity</title>
<p>
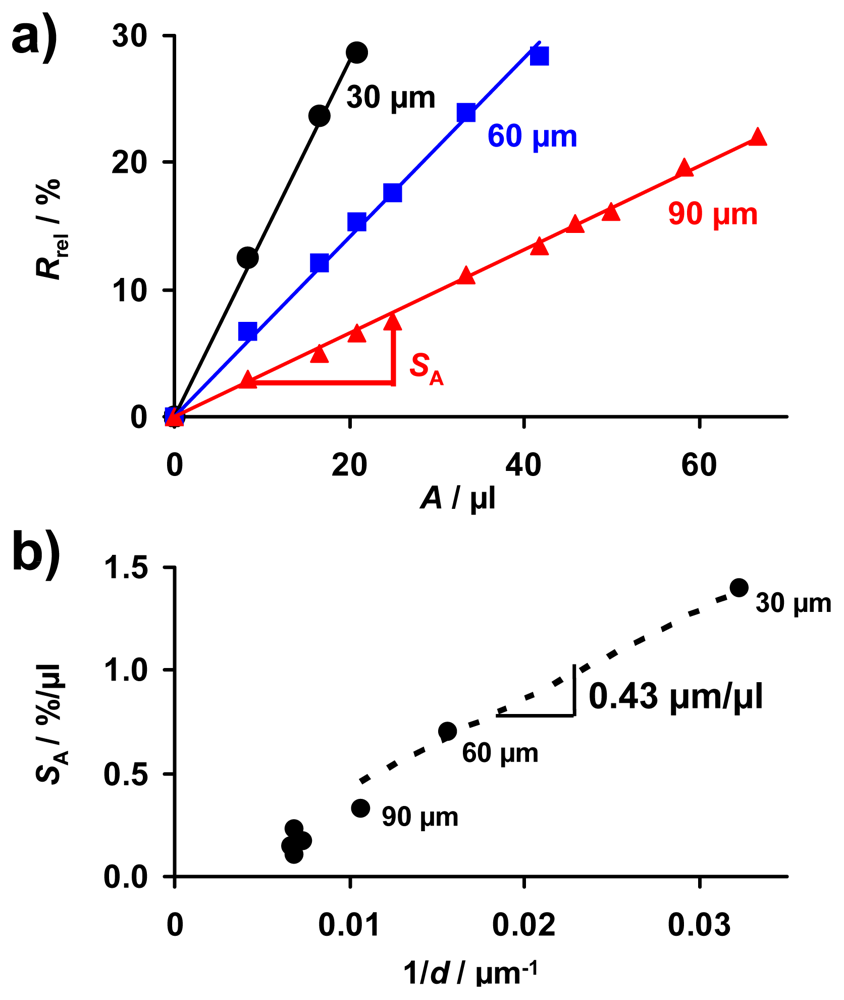
According to the simplified model that is based on the assumption that a thin nitrate layer forms at the surface of the sensitive storage layer upon NO<sub>x</sub> exposure, as shown in <xref ref-type="fig" rid="f3-sensors-12-12329">Figure 3</xref>, and the resulting <xref rid="FD13" ref-type="disp-formula">Equation (13)</xref>, both sensitivities, <italic>S</italic><sub>A</sub> and <italic>S</italic><sub>c</sub>, should increase with 1/<italic>d</italic>. The characteristic lines, correlating <italic>R</italic><sub>rel</sub> with the total NO<sub>x</sub> amount, <italic>A</italic>, extracted from the cyclic measurement data presented in <xref ref-type="fig" rid="f6-sensors-12-12329">Figure 6</xref> are shown in <xref ref-type="fig" rid="f8-sensors-12-12329">Figure 8(a)</xref>. For each sample, the data points of <italic>R</italic><sub>rel</sub> measured at the end of each NO<sub>x</sub> step form straight lines through the origin up to a sensor response of about 30%, independent of the NO<sub>x</sub> concentration or the type of NO<sub>x</sub> (NO or NO<sub>2</sub>). Comparing the characteristic lines for the amount detection of the samples with different thicknesses in <xref ref-type="fig" rid="f8-sensors-12-12329">Figure 8(a)</xref>, it becomes clear that <italic>S</italic><sub>A</sub> decreases when the sensitive layer gets thicker. To evaluate the thickness effect in detail, <italic>S</italic><sub>A</sub> is plotted as a function of 1/<italic>d</italic> in <xref ref-type="fig" rid="f8-sensors-12-12329">Figure 8(b)</xref>. <italic>S</italic><sub>A</sub> increases linearly with 1/<italic>d</italic> with small deviations in the case of layers being 90 μm or thicker (1/<italic>d</italic> ≤ 0.011 μm<sup>−1</sup>).</p>
<p>From the concentration related sensitivity <italic>S</italic><sub>c</sub> ≈ 0.049%/ppm·s of the 30 μm sample determined from <xref ref-type="fig" rid="f7-sensors-12-12329">Figure 7(b)</xref> and the applied gas flow of <italic>V̇</italic> = 2 L/min = 0.033 L/s, the sensitivity S<sub>A</sub> can be calculated. Applying the relationship between <italic>S</italic><sub>A</sub> and <italic>S</italic><sub>c</sub> described by <xref rid="FD7" ref-type="disp-formula">Equation (7)</xref> one obtains <italic>S</italic><sub>A</sub> ≈ 1.48%/μL, which agrees with the value shown in <xref ref-type="fig" rid="f8-sensors-12-12329">Figure 8(b)</xref> for the 30 μm sample. This good agreement verifies that validity of the correlation between <italic>S</italic><sub>A</sub> and <italic>S</italic><sub>c</sub> (<xref rid="FD7" ref-type="disp-formula">Equation (7)</xref>).</p>
<p>These results verify the simplified model as illustrated in <xref ref-type="fig" rid="f3-sensors-12-12329">Figure 3</xref> and demonstrate that the thickness of the accumulating NO<sub>x</sub> storage layer can be used as an effective tool to adapt the sensor sensitivity to the application requirements.</p>
<p>According to <xref rid="FD14" ref-type="disp-formula">Equation (14)</xref> a linear correlation between <italic>S</italic><sub>A</sub> and 1/<italic>d</italic> with a proportionality factor of <italic>ρ</italic><sub>0</sub>/<italic>ρ</italic><sub>NOx</sub>·d(<italic>d</italic><sub>NOx</sub>)/d<italic>A</italic> can be expected from the simplified model. Hence, applying the slope of the correlation in <xref ref-type="fig" rid="f8-sensors-12-12329">Figure 8(b)</xref>, d<italic>S</italic>/d(1/<italic>d</italic>), the thickness of the formed nitrate layer, <italic>d</italic><sub>NOx</sub>, dependent on the exposed amount of NO<sub>x</sub> can be estimated. Since the resistivity of the samples was found to decrease by at least one order upon saturation in NO<sub>x</sub> (result not shown here), <italic>ρ</italic><sub>0</sub>/<italic>ρ</italic><sub>NOx</sub> ≈ 10 is assumed as a minimal value. With the slope d<italic>S</italic>/d(1/<italic>d</italic>) being 0.43 μm/μL (dotted line in <xref ref-type="fig" rid="f8-sensors-12-12329">Figure 8(b)</xref> for samples &lt;100 μm), <italic>d</italic><sub>NOx</sub> increases by less than about 43 nm per μL NO<sub>x</sub> in the gas phase.</p></sec>
<sec>
<label>5.6.</label>
<title>Variations of the Linear Measurement Range
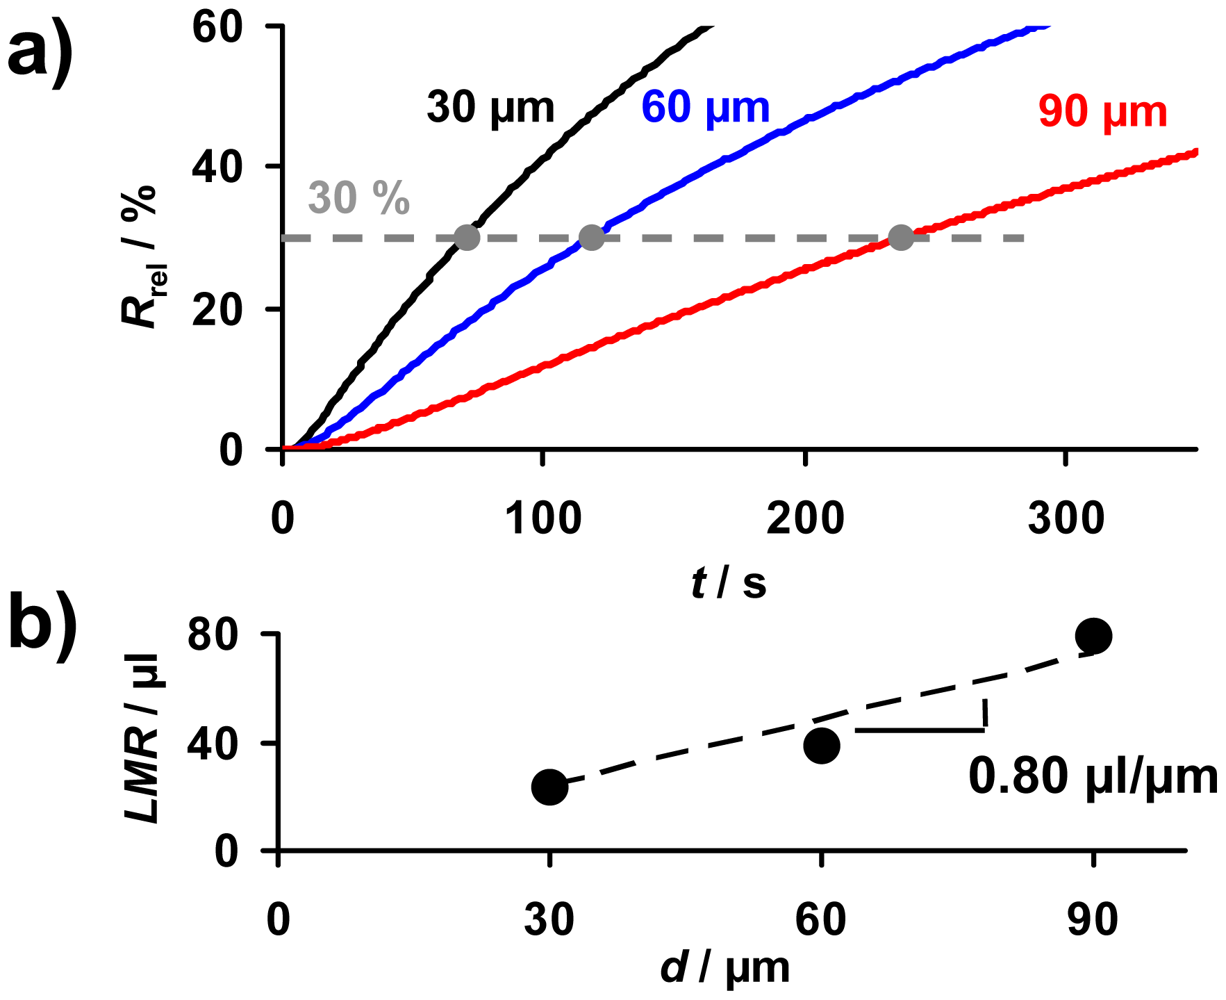
</title>
<p>As sketched in <xref ref-type="fig" rid="f2-sensors-12-12329">Figure 2</xref>, the linear measurement range, <italic>LMR</italic>, is defined as the amount of NO<sub>x</sub> that can be detected when a linear correlation between <italic>R</italic><sub>rel</sub> and <italic>A</italic> exists. The <italic>LMR</italic> ends when saturation effects occur and the sensitivities <italic>S</italic><sub>A</sub> and <italic>S</italic><sub>c</sub> decrease. Therefore, besides the sensitivity and the sensor response time, the <italic>LMR</italic> is an important feature of the accumulating-type sensor. The effect of the sensitive layer thickness on the <italic>LMR</italic> is addressed in <xref ref-type="fig" rid="f9-sensors-12-12329">Figure 9</xref>. In the presence of 10 ppm NO<sub>x</sub> (consisting of 5 ppm NO and 5 ppm NO<sub>2</sub>) in a lean gas mixture, <italic>R</italic><sub>rel</sub> of all samples increases continuously with time (<xref ref-type="fig" rid="f9-sensors-12-12329">Figure 9(a)</xref>). In accordance to <xref rid="FD14" ref-type="disp-formula">Equation (14)</xref>, the sensitivity is higher in the case of thinner sensitive storage layers. From <xref ref-type="fig" rid="f9-sensors-12-12329">Figure 9(a)</xref> it seems that, independent on the sensitive layer thickness, the <italic>LMR</italic> ends at about <italic>R</italic><sub>rel</sub> = 30%. This results in an increase of the <italic>LMR</italic>-amount with the layer thickness as shown in <xref ref-type="fig" rid="f9-sensors-12-12329">Figure 9(b)</xref>. The slope in <xref ref-type="fig" rid="f9-sensors-12-12329">Figure 9(b)</xref> indicates that 0.80 μL NO<sub>x</sub> can be detected linearly per μm LNT layer deposited on the sensor.</p>
<p>In Section 5.5, it was calculated that the thickness of the nitrate fraction of the sensitive layer increases by about 43 nm/μL. This value can be combined with the dependency of the <italic>LMR</italic> on <italic>d</italic> of 0.80 μL/μm from <xref ref-type="fig" rid="f9-sensors-12-12329">Figure 9(b)</xref>. One obtains that if reaching the end of the linear measurement range upon NO<sub>x</sub> exposure 43 nm/μL·0.80 μL/μm = 34 nm nitrate is formed per μm LNT material. In other words, independent of the LNT thickness only about 3% of the sensitive material is converted to nitrate in the case of NO<sub>x</sub> storage in the linear measurement range. This estimated nitrate fraction of the sensitive layer is much less than the values reported for the storage sites utilization of LNT catalysts of maximal 20 to 40% upon saturation [<xref ref-type="bibr" rid="b23-sensors-12-12329">23</xref>–<xref ref-type="bibr" rid="b25-sensors-12-12329">25</xref>]. This difference indicates that the end of the linear measurement range of the accumulating NO<sub>x</sub> sensor might be limited rather by the non-linear relation between resistivity change and NO<sub>x</sub> loading than by the storage capacity of the LNT material.</p></sec>
<sec>
<label>5.7.</label>
<title>Evaluation of the Sensor Response Time</title>
<p>With the accumulating NO<sub>x</sub> sensor the amount of NO<sub>x</sub> is detected by looking on the changes in the electrical properties and not on the equilibrium values like with conventional gas sensors. Hence, no sensor response time of <italic>R</italic><sub>rel</sub> can be defined in the classical way. Instead one has to apply the timely derivative, <italic>Ṙ</italic><sub>rel</sub>, which is a function of the concentration and therefore corresponds to the sensor signal of conventional gas sensors. From the measured data of the samples in 10 ppm NO<sub>x</sub>, the sensor response time of the slope <italic>Ṙ</italic><sub>rel</sub> was analyzed. Therefore, the time to reach 90% of the maximum value of <italic>Ṙ</italic><sub>rel</sub>, <italic>t</italic><sub>90</sub>, is compared for the samples with different coating thicknesses. <xref ref-type="fig" rid="f10-sensors-12-12329">Figure 10</xref> shows that <italic>t</italic><sub>90</sub> increases with <italic>d</italic>. While <italic>t</italic><sub>90</sub> of the sample with a 30 μm storage layer is about 7 s, it is in the range of 30 s in the case of the 90 μm sample. In the case of very thin coatings the sensor response is limited by the gas exchange of the test bench, which is in the range of 7 s. For very thick coatings (<italic>d</italic> ≈ <italic>l</italic>), NO<sub>x</sub> storage occurs in a region far away from the electrodes. Due to the increasingly weaker electrical field lines, NO<sub>x</sub> uptake in this region of the LNT layer is most probably not reflected properly by <italic>R</italic><sub>rel</sub> and <italic>Ṙ</italic><sub>rel</sub>. Additionally, it is expected that the accessibility of the storage sites is dependent on the LNT thickness as with progressive NO<sub>x</sub> loading upcoming NO<sub>x</sub> molecules need to diffuse into the catalyst material to reach unoccupied storage sites [<xref ref-type="bibr" rid="b26-sensors-12-12329">26</xref>,<xref ref-type="bibr" rid="b27-sensors-12-12329">27</xref>,<xref ref-type="bibr" rid="b31-sensors-12-12329">31</xref>]. The analysis of the sensitivity and the sensor response time in <xref ref-type="fig" rid="f8-sensors-12-12329">Figures 8</xref> and <xref ref-type="fig" rid="f10-sensors-12-12329">10</xref> clarifies that for a highly sensitive and fast low level detection of NO<sub>x</sub>, accumulating NO<sub>x</sub> sensors with a thin sensitive layer are preferable.</p></sec></sec>
<sec sec-type="conclusions">
<label>6.</label>
<title>Conclusions</title>
<p>The intent of this study was to investigate the influence of the sensitive layer thickness on the sensing properties of the accumulating NO<sub>x</sub> sensor. In several NO<sub>x</sub> loading experiments it was demonstrated that the general accumulating NO<sub>x</sub> amount sensing properties seem not to be affected by the thickness of the sensitive layer in the studied range (<italic>i.e.</italic>, the increase of the sensor signal in the presence of NO<sub>x</sub> due to NO<sub>x</sub> accumulation, the correlation between the slope and the NO<sub>x</sub> concentration, and the constancy of the sensor signal in the NO<sub>x</sub> absence due to the strength of sorption). The linearity of the sensor signal, <italic>R</italic><sub>rel</sub>, with the total NO<sub>x</sub> amount enables the detection of the actual NO<sub>x</sub> concentration by <italic>Ṙ</italic><sub>rel</sub> with all applied samples.</p>
<p>
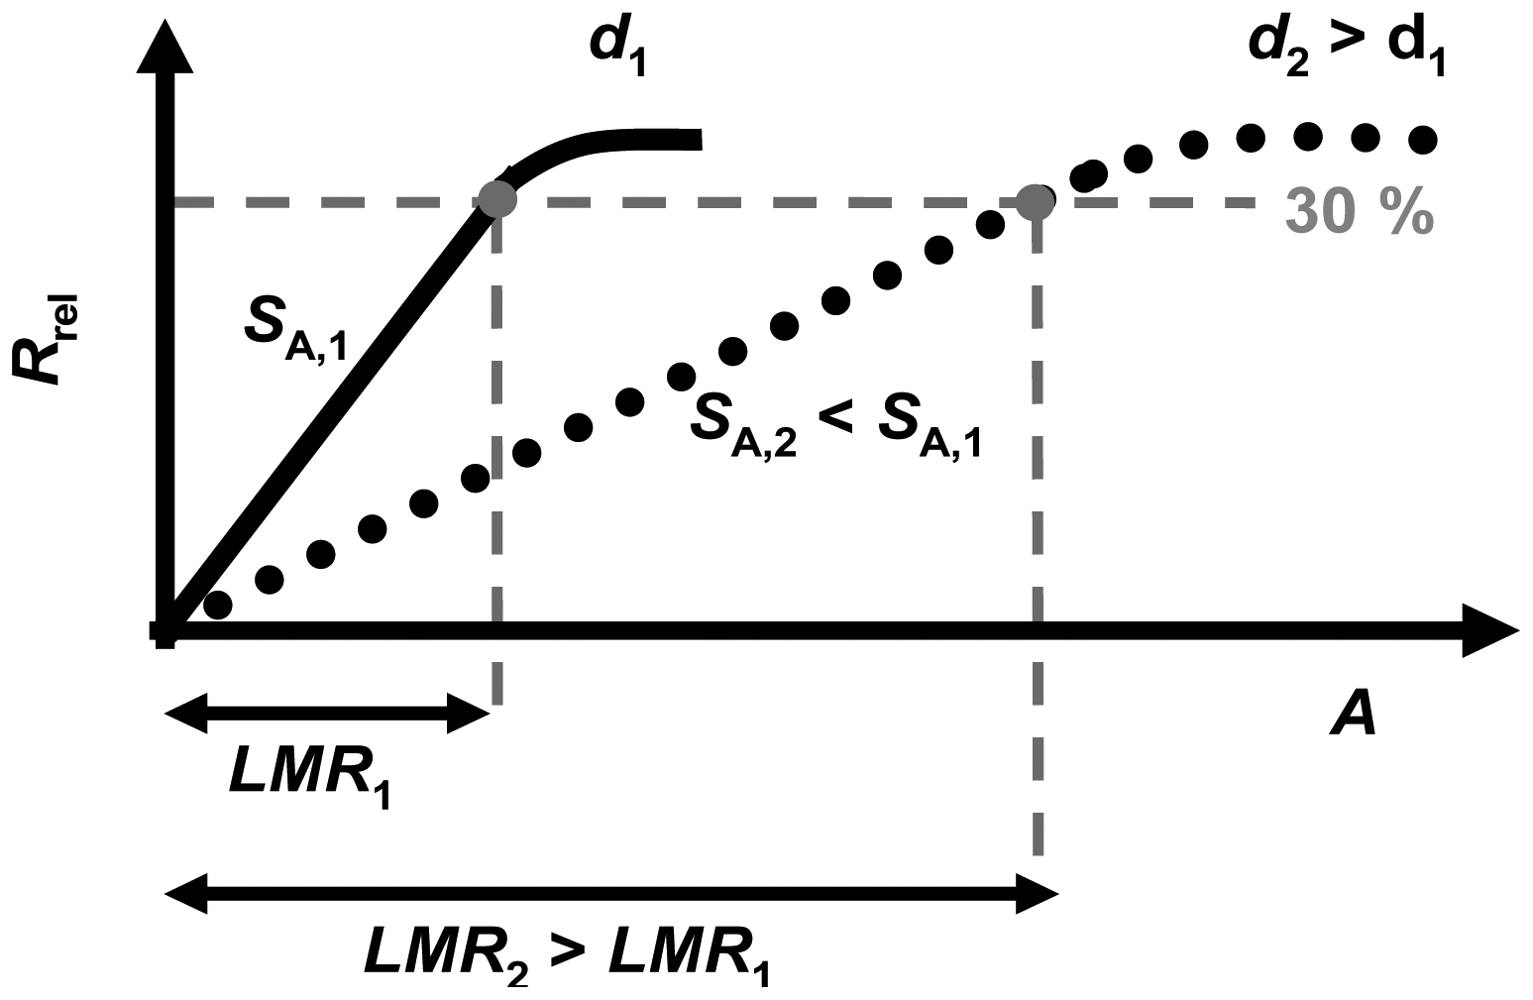
However, like the base resistance, the sensitivity to NO<sub>x</sub> is inversely proportional to the film thickness <italic>d</italic>. This agrees with a simple model concerning nitrate formation at the surface of the sensitive layer. It was demonstrated that NO<sub>x</sub> can be detected linearly until the sensor resistances reaches about 30%. This limit was found to be independent on the thickness of the sensitive layer. This controversial effect of the sensitive layer thickness on the sensitivity, <italic>S</italic><sub>A</sub> (and also on <italic>S</italic><sub>c</sub>), and on the linear measurement range, <italic>LMR</italic>, is illustrated in <xref ref-type="fig" rid="f11-sensors-12-12329">Figure 11</xref> for two samples with two different thicknesses, <italic>d</italic><sub>2</sub> (dark grey line) being higher than <italic>d</italic><sub>1</sub> (light grey line). While <italic>S</italic><sub>1</sub> is higher than <italic>S</italic><sub>2</sub>, the resulting <italic>LMR</italic><sub>2</sub> is larger than <italic>LMR</italic><sub>1</sub>. More particularly, <italic>LMR</italic> increases with <italic>d</italic> allowing for a measurement range adaption depending on the requirements of the application conditions. However, there is a trade-off between a large linear measurement range and a high sensitivity.</p>
<p>The presented measurement results also point out that the timely sensor response characteristic depends on the thickness of the storage material. In the case of very thin layers (30 μm) the sensor response time corresponds to the gas exchange time of the gas flow stand, whereas the sensor signal becomes slower as the thickness increases. An estimation based on the presented simplified model of the sensor setup reveals that, independently on the thickness of the LNT material only a small fraction of the sensitive layer—probably about 3%—is involved in the NO<sub>x</sub> storage process as the accumulating sensor is operated in the linear measurement range.</p></sec></body>
<back>
<ack>
<p>The authors gratefully acknowledge the LNT material preparation by Shadab Mulla, Todd H. Ballinger, Hai-Ying Chen (Johnson Matthey) and the SEM analysis by Angelika Mergner (Lehrstuhl Funktionsmaterialien). Ralf Moos thanks the German Research Foundation (DFG) for supporting this work under grant number MO 1060/15-1. This publication was funded by the German Research Foundation (DFG) and the University of Bayreuth in the funding program “Open Access Publishing”.</p></ack>
<ref-list>
<title>References</title>
<ref id="b1-sensors-12-12329"><label>1.</label><citation citation-type="journal"><person-group person-group-type="author"><name><surname>Afzal</surname><given-names>A.</given-names></name><name><surname>Cioffi</surname><given-names>N.</given-names></name><name><surname>Sabbatini</surname><given-names>L.</given-names></name><name><surname>Torsi</surname><given-names>L.</given-names></name></person-group><article-title>NO<sub>x</sub> sensors based on semiconducting metal oxide nanostructures: Progress and perspectives</article-title><source>Sens. Actuators B Chem.</source><year>2012</year><volume>171–172</volume><fpage>25</fpage><lpage>42</lpage></citation></ref>
<ref id="b2-sensors-12-12329"><label>2.</label><citation citation-type="book"><person-group person-group-type="author"><name><surname>Kim</surname><given-names>Y.-W.</given-names></name><name><surname>van Nieuwstadt</surname><given-names>M.</given-names></name></person-group><source>Threshold Monitoring of Urea SCR Systems</source><comment>SAE Technical Paper 2006-01-3548</comment><publisher-name>SAE 2006 Commercial Vehicle Engineering Congress &amp; Exhibition</publisher-name><publisher-loc>Rosemont, IL, USA</publisher-loc><month>October</month><year>2006</year></citation></ref>
<ref id="b3-sensors-12-12329"><label>3.</label><citation citation-type="book"><person-group person-group-type="author"><name><surname>Sasaki</surname><given-names>H.</given-names></name><name><surname>Scholl</surname><given-names>D.</given-names></name><name><surname>Parsons</surname><given-names>M.</given-names></name><name><surname>Inagaki</surname><given-names>H.</given-names></name><name><surname>Shiotani</surname><given-names>K.</given-names></name><name><surname>Visser</surname><given-names>J.</given-names></name><name><surname>Zawacki</surname><given-names>G.</given-names></name><name><surname>Kawai</surname><given-names>T.</given-names></name><name><surname>Teramoto</surname><given-names>S.</given-names></name><name><surname>Kubinski</surname><given-names>D.</given-names></name></person-group><source>Development of an Al<sub>2</sub>O<sub>3</sub>/ZrO<sub>2</sub>-Composite High-Accuracy NO<sub>x</sub> Sensor</source><comment>SAE Technical Paper 2010-01-0041</comment><publisher-name>SAE 2010 World Congress &amp; Exhibition</publisher-name><publisher-loc>Detroit, MI, USA</publisher-loc><month>April</month><year>2010</year></citation></ref>
<ref id="b4-sensors-12-12329"><label>4.</label><citation citation-type="book"><source>Directive 2008/50/EC of the European Parliament and of the Council of 21 May 2008 on Ambient Air Quality and Cleaner Air for Europe</source><publisher-name>Official Journal of the European Union</publisher-name><year>2008</year><fpage>L152/1</fpage></citation></ref>
<ref id="b5-sensors-12-12329"><label>5.</label><citation citation-type="journal"><person-group person-group-type="author"><name><surname>Alkemade</surname><given-names>U.G.</given-names></name><name><surname>Schumann</surname><given-names>B.</given-names></name></person-group><article-title>Engines and exhaust after treatment systems for future automotive applications</article-title><source>Solid State Ionics.</source><year>2006</year><volume>177</volume><fpage>2291</fpage><lpage>2296</lpage><pub-id pub-id-type="doi">10.1016/j.ssi.2006.05.051</pub-id></citation></ref>
<ref id="b6-sensors-12-12329"><label>6.</label><citation citation-type="journal"><person-group person-group-type="author"><name><surname>Twigg</surname><given-names>M.V.</given-names></name></person-group><article-title>Progress and future challenges in controlling automotive exhaust gas emissions</article-title><source>Appl. Catal. B Environ.</source><year>2007</year><volume>70</volume><fpage>2</fpage><lpage>15</lpage><pub-id pub-id-type="doi">10.1016/j.apcatb.2006.02.029</pub-id></citation></ref>
<ref id="b7-sensors-12-12329"><label>7.</label><citation citation-type="journal"><person-group person-group-type="author"><name><surname>Padilla</surname><given-names>M.</given-names></name><name><surname>Perera</surname><given-names>A.</given-names></name><name><surname>Montoliu</surname><given-names>I.</given-names></name><name><surname>Chaudry</surname><given-names>A.</given-names></name><name><surname>Persaud</surname><given-names>K.</given-names></name><name><surname>Marco</surname><given-names>S.</given-names></name></person-group><article-title>Drift compensation of gas sensor array data by orthogonal signal correction</article-title><source>Chemometr. Intell. Lab. Syst.</source><year>2010</year><volume>100</volume><fpage>28</fpage><lpage>35</lpage><pub-id pub-id-type="doi">10.1016/j.chemolab.2009.10.002</pub-id></citation></ref>
<ref id="b8-sensors-12-12329"><label>8.</label><citation citation-type="journal"><person-group person-group-type="author"><name><surname>Sickles</surname><given-names>J.E.</given-names></name><name><surname>Grohse</surname><given-names>P.M.</given-names></name><name><surname>Hodson</surname><given-names>L.L.</given-names></name><name><surname>Salmons</surname><given-names>C.A.</given-names></name><name><surname>Cox</surname><given-names>K.W.</given-names></name><name><surname>Turner</surname><given-names>A.R.</given-names></name><name><surname>Estes</surname><given-names>E.D.</given-names></name></person-group><article-title>Development of a method for the sampling and analysis of sulfur dioxide and nitrogen dioxide from ambient air</article-title><source>Anal. Chem.</source><year>1990</year><volume>62</volume><fpage>338</fpage><lpage>346</lpage><pub-id pub-id-type="doi">10.1021/ac00203a006</pub-id></citation></ref>
<ref id="b9-sensors-12-12329"><label>9.</label><citation citation-type="journal"><person-group person-group-type="author"><name><surname>Varshney</surname><given-names>C.K.</given-names></name><name><surname>Singh</surname><given-names>A.P.</given-names></name></person-group><article-title>Passive samplers for NO<sub>x</sub> monitoring: A critical review</article-title><source>Environmentalist</source><year>2003</year><volume>23</volume><fpage>127</fpage><lpage>136</lpage><pub-id pub-id-type="doi">10.1023/A:1024883620408</pub-id></citation></ref>
<ref id="b10-sensors-12-12329"><label>10.</label><citation citation-type="journal"><person-group person-group-type="author"><name><surname>Groβ</surname><given-names>A.</given-names></name><name><surname>Beulertz</surname><given-names>G.</given-names></name><name><surname>Marr</surname><given-names>I.</given-names></name><name><surname>Kubinski</surname><given-names>D.J.</given-names></name><name><surname>Visser</surname><given-names>J.H.</given-names></name><name><surname>Moos</surname><given-names>R.</given-names></name></person-group><article-title>Dual mode NO<sub>x</sub> sensor: Measuring both the accumulated amount and instantaneous level at low concentrations</article-title><source>Sensors</source><year>2012</year><volume>12</volume><fpage>2831</fpage><lpage>2850</lpage><pub-id pub-id-type="doi">10.3390/s120302831</pub-id><pub-id pub-id-type="pmid">22736980</pub-id></citation></ref>
<ref id="b11-sensors-12-12329"><label>11.</label><citation citation-type="journal"><person-group person-group-type="author"><name><surname>Beulertz</surname><given-names>G.</given-names></name><name><surname>Groβ</surname><given-names>A.</given-names></name><name><surname>Moos</surname><given-names>R.</given-names></name><name><surname>Kubinski</surname><given-names>D.J.</given-names></name><name><surname>Visser</surname><given-names>J.H.</given-names></name></person-group><article-title>Determining the total amount of NO<sub>x</sub> in a gas stream—Advances in the accumulating gas sensor principle</article-title><source>Sens. Actuators B Chem.</source><year>2012</year><pub-id pub-id-type="doi">10.1016/j.snb.2012.02.017</pub-id></citation></ref>
<ref id="b12-sensors-12-12329"><label>12.</label><citation citation-type="journal"><person-group person-group-type="author"><name><surname>Moos</surname><given-names>R.</given-names></name><name><surname>Wedemann</surname><given-names>M.</given-names></name><name><surname>Spörl</surname><given-names>M.</given-names></name><name><surname>Reiβ</surname><given-names>S.</given-names></name><name><surname>Fischerauer</surname><given-names>G.</given-names></name></person-group><article-title>Direct catalyst monitoring by electrical means: An overview on promising novel principles</article-title><source>Top. Catal.</source><year>2009</year><volume>52</volume><fpage>2035</fpage><lpage>2040</lpage><pub-id pub-id-type="doi">10.1007/s11244-009-9399-6</pub-id></citation></ref>
<ref id="b13-sensors-12-12329"><label>13.</label><citation citation-type="journal"><person-group person-group-type="author"><name><surname>Fremerey</surname><given-names>P.</given-names></name><name><surname>Reiβ</surname><given-names>S.</given-names></name><name><surname>Geupel</surname><given-names>A.</given-names></name><name><surname>Fischerauer</surname><given-names>G.</given-names></name><name><surname>Moos</surname><given-names>R.</given-names></name></person-group><article-title>Determination of the NO<sub>x</sub> loading of an automotive lean NO<sub>x</sub> trap by directly monitoring the electrical properties of the catalyst material itself</article-title><source>Sensors</source><year>2011</year><volume>11</volume><fpage>8261</fpage><lpage>8280</lpage><pub-id pub-id-type="doi">10.3390/s110908261</pub-id><pub-id pub-id-type="pmid">22164074</pub-id></citation></ref>
<ref id="b14-sensors-12-12329"><label>14.</label><citation citation-type="book"><person-group person-group-type="author"><name><surname>Moos</surname><given-names>R.</given-names></name><name><surname>Zimmermann</surname><given-names>C.</given-names></name><name><surname>Birkhofer</surname><given-names>T.</given-names></name><name><surname>Knezevic</surname><given-names>A.</given-names></name><name><surname>Plog</surname><given-names>C.</given-names></name><name><surname>Busch</surname><given-names>M.R.</given-names></name><name><surname>Ried</surname><given-names>T.</given-names></name></person-group><source>Sensor for Directly Determining the State of a No<sub>x</sub> Storage Catalyst</source><comment>SAE Technical Paper 2008-01-0447</comment><publisher-name>SAE World Congress &amp; Exhibition</publisher-name><publisher-loc>Detroit, MI, USA</publisher-loc><month>April</month><year>2008</year><pub-id pub-id-type="doi">10.4271/2008-01-0447</pub-id></citation></ref>
<ref id="b15-sensors-12-12329"><label>15.</label><citation citation-type="journal"><person-group person-group-type="author"><name><surname>Groβ</surname><given-names>A.</given-names></name><name><surname>Bishop</surname><given-names>S.R.</given-names></name><name><surname>Yang</surname><given-names>D.J.</given-names></name><name><surname>Tuller</surname><given-names>H.L.</given-names></name><name><surname>Moos</surname><given-names>R.</given-names></name></person-group><article-title>The electrical properties of NO<sub>x</sub>-storing carbonates during NO<sub>x</sub> exposure</article-title><source>Solid State Ionics.</source><year>2012</year><pub-id pub-id-type="doi">10.1016/j.ssi.2012.05.009</pub-id></citation></ref>
<ref id="b16-sensors-12-12329"><label>16.</label><citation citation-type="book"><person-group person-group-type="author"><name><surname>Morrison</surname><given-names>S.R.</given-names></name><name><surname>Madou</surname><given-names>M.J.</given-names></name></person-group><source>Chemical Sensing with Solid State Devices</source><publisher-name>Academic Press Inc.</publisher-name><publisher-loc>London, UK</publisher-loc><month>May</month><year>1989</year></citation></ref>
<ref id="b17-sensors-12-12329"><label>17.</label><citation citation-type="journal"><person-group person-group-type="author"><name><surname>Epling</surname><given-names>W.S.</given-names></name><name><surname>Campbell</surname><given-names>L.E.</given-names></name><name><surname>Yezerets</surname><given-names>A.</given-names></name><name><surname>Currier</surname><given-names>N.W.</given-names></name><name><surname>Parks</surname><given-names>J.E.</given-names><suffix>II.</suffix></name></person-group><article-title>Overview of the fundamental reactions and degradation mechanism of NO<sub>x</sub> storage/reduction catalysts</article-title><source>Catal. Rev.</source><year>2004</year><volume>46</volume><fpage>163</fpage><lpage>245</lpage><pub-id pub-id-type="doi">10.1081/CR-200031932</pub-id></citation></ref>
<ref id="b18-sensors-12-12329"><label>18.</label><citation citation-type="journal"><person-group person-group-type="author"><name><surname>Roy</surname><given-names>S.</given-names></name><name><surname>Baiker</surname><given-names>A.</given-names></name></person-group><article-title>NO<sub>x</sub> storage-reduction catalysis: From mechanism and materials properties to storage-reduction performance</article-title><source>Chem. Rev.</source><year>2009</year><volume>109</volume><fpage>4054</fpage><lpage>4091</lpage><pub-id pub-id-type="doi">10.1021/cr800496f</pub-id><pub-id pub-id-type="pmid">19456148</pub-id></citation></ref>
<ref id="b19-sensors-12-12329"><label>19.</label><citation citation-type="journal"><person-group person-group-type="author"><name><surname>Liu</surname><given-names>G.</given-names></name><name><surname>Gao</surname><given-names>P.-X.</given-names></name></person-group><article-title>A review of NO<sub>x</sub> storage/reduction catalysts: Mechanism, materials and degradation studies</article-title><source>Catal. Sci. Technol.</source><year>2011</year><volume>1</volume><fpage>552</fpage><lpage>568</lpage><pub-id pub-id-type="doi">10.1039/c1cy00007a</pub-id></citation></ref>
<ref id="b20-sensors-12-12329"><label>20.</label><citation citation-type="journal"><person-group person-group-type="author"><name><surname>Lesage</surname><given-names>T.</given-names></name><name><surname>Saussey</surname><given-names>J.</given-names></name><name><surname>Malo</surname><given-names>S.</given-names></name><name><surname>Hervieu</surname><given-names>M.</given-names></name><name><surname>Hedouin</surname><given-names>C.</given-names></name><name><surname>Blanchard</surname><given-names>G.</given-names></name><name><surname>Daturi</surname><given-names>M.</given-names></name></person-group><article-title>Operando FTIR study of NO<sub>x</sub> storage over a Pt/K/Mn/Al<sub>2</sub>O<sub>3</sub>-CeO<sub>2</sub> catalyst</article-title><source>Appl. Catal. B Environ.</source><year>2007</year><volume>72</volume><fpage>166</fpage><lpage>177</lpage><pub-id pub-id-type="doi">10.1016/j.apcatb.2006.10.013</pub-id></citation></ref>
<ref id="b21-sensors-12-12329"><label>21.</label><citation citation-type="journal"><person-group person-group-type="author"><name><surname>Geupel</surname><given-names>A.</given-names></name><name><surname>Schönauer</surname><given-names>D.</given-names></name><name><surname>Röder-Roith</surname><given-names>U.</given-names></name><name><surname>Kubinski</surname><given-names>D.J.</given-names></name><name><surname>Mulla</surname><given-names>S.</given-names></name><name><surname>Ballinger</surname><given-names>T.H.</given-names></name><name><surname>Chen</surname><given-names>H.-Y.</given-names></name><name><surname>Visser</surname><given-names>J.H.</given-names></name><name><surname>Moos</surname><given-names>R.</given-names></name></person-group><article-title>Integrating nitrogen oxide sensor: A novel concept for measuring low concentrations in the exhaust gas</article-title><source>Sens. Actuators B Chem.</source><year>2010</year><volume>145</volume><fpage>756</fpage><lpage>761</lpage><pub-id pub-id-type="doi">10.1016/j.snb.2010.01.036</pub-id></citation></ref>
<ref id="b22-sensors-12-12329"><label>22.</label><citation citation-type="journal"><person-group person-group-type="author"><name><surname>Geupel</surname><given-names>A.</given-names></name><name><surname>Kubinski</surname><given-names>D.J.</given-names></name><name><surname>Mulla</surname><given-names>S.</given-names></name><name><surname>Ballinger</surname><given-names>T.H.</given-names></name><name><surname>Chen</surname><given-names>H-Y.</given-names></name><name><surname>Visser</surname><given-names>J.H.</given-names></name><name><surname>Moos</surname><given-names>R.</given-names></name></person-group><article-title>Integrating NO<sub>x</sub> sensor for automotive exhausts—A novel concept</article-title><source>Sens. Lett.</source><year>2011</year><volume>9</volume><fpage>311</fpage><lpage>315</lpage><pub-id pub-id-type="doi">10.1166/sl.2011.1471</pub-id></citation></ref>
<ref id="b23-sensors-12-12329"><label>23.</label><citation citation-type="journal"><person-group person-group-type="author"><name><surname>Castoldi</surname><given-names>L.</given-names></name><name><surname>Lietti</surname><given-names>L.</given-names></name><name><surname>Forzatti</surname><given-names>P.</given-names></name><name><surname>Morandi</surname><given-names>S.</given-names></name><name><surname>Ghiotti</surname><given-names>G.</given-names></name><name><surname>Vindigni</surname><given-names>F.</given-names></name></person-group><article-title>The NO<sub>x</sub> storage-reduction on Pt-K/Al<sub>2</sub>O<sub>3</sub> lean NO<sub>x</sub> trap catalyst</article-title><source>J. Catal.</source><year>2010</year><volume>276</volume><fpage>335</fpage><lpage>350</lpage><pub-id pub-id-type="doi">10.1016/j.jcat.2010.09.026</pub-id></citation></ref>
<ref id="b24-sensors-12-12329"><label>24.</label><citation citation-type="journal"><person-group person-group-type="author"><name><surname>Muncrief</surname><given-names>R.L.</given-names></name><name><surname>Khanna</surname><given-names>P.</given-names></name><name><surname>Kabin</surname><given-names>K.S.</given-names></name><name><surname>Harold</surname><given-names>M.P.</given-names></name></person-group><article-title>Mechanistic and kinetic studies of NO<sub>x</sub> storage and reduction on Pt/BaO/Al<sub>2</sub>O<sub>3</sub></article-title><source>Catal. Today</source><year>2004</year><volume>98</volume><fpage>393</fpage><lpage>402</lpage><pub-id pub-id-type="doi">10.1016/j.cattod.2004.08.004</pub-id></citation></ref>
<ref id="b25-sensors-12-12329"><label>25.</label><citation citation-type="journal"><person-group person-group-type="author"><name><surname>Scholz</surname><given-names>C.M.L.</given-names></name><name><surname>Gangwal</surname><given-names>V.R.</given-names></name><name><surname>de Croon</surname><given-names>M.H.J.M.</given-names></name><name><surname>Schouten</surname><given-names>J.C.</given-names></name></person-group><article-title>Influence of CO<sub>2</sub> and H<sub>2</sub>O on NO<sub>x</sub> storage and reduction on a Pt–Ba/γ-Al<sub>2</sub>O<sub>3</sub> catalyst</article-title><source>Appl. Catal. B Environ.</source><year>2007</year><volume>71</volume><fpage>143</fpage><lpage>150</lpage><pub-id pub-id-type="doi">10.1016/j.apcatb.2006.08.018</pub-id></citation></ref>
<ref id="b26-sensors-12-12329"><label>26.</label><citation citation-type="journal"><person-group person-group-type="author"><name><surname>Tuttlies</surname><given-names>U.</given-names></name><name><surname>Schmeiβer</surname><given-names>V.</given-names></name><name><surname>Eigenberger</surname><given-names>G.</given-names></name></person-group><article-title>A mechanistic simulation model for NO<sub>x</sub> storage catalyst dynamics</article-title><source>Chem. Eng. Sci.</source><year>2004</year><volume>59</volume><fpage>4731</fpage><lpage>4738</lpage><pub-id pub-id-type="doi">10.1016/j.ces.2004.08.026</pub-id></citation></ref>
<ref id="b27-sensors-12-12329"><label>27.</label><citation citation-type="journal"><person-group person-group-type="author"><name><surname>Olsson</surname><given-names>L.</given-names></name><name><surname>Blint</surname><given-names>R.J.</given-names></name><name><surname>Fridell</surname><given-names>E.</given-names></name></person-group><article-title>Global kinetic model for lean NO<sub>x</sub> traps</article-title><source>Ind. Eng. Chem. Res.</source><year>2005</year><volume>44</volume><fpage>3021</fpage><lpage>3032</lpage><pub-id pub-id-type="doi">10.1021/ie0494059</pub-id></citation></ref>
<ref id="b28-sensors-12-12329"><label>28.</label><citation citation-type="thesis"><person-group person-group-type="author"><name><surname>Hagen</surname><given-names>G.</given-names></name></person-group><article-title>Impedimetric Zeolite-Based Gas Sensors</article-title><source>Ph.D. Dissertation</source><publisher-name>Universität Bayreuth</publisher-name><publisher-loc>Bayreuth, Germany</publisher-loc><year>2009</year></citation></ref>
<ref id="b29-sensors-12-12329"><label>29.</label><citation citation-type="journal"><person-group person-group-type="author"><name><surname>Schönauer</surname><given-names>D.</given-names></name><name><surname>Moos</surname><given-names>R.</given-names></name></person-group><article-title>Detection of water droplets on exhaust gas sensors</article-title><source>Sens. Actuators B Chem.</source><year>2010</year><volume>148</volume><fpage>624</fpage><lpage>629</lpage><pub-id pub-id-type="doi">10.1016/j.snb.2010.05.060</pub-id></citation></ref>
<ref id="b30-sensors-12-12329"><label>30.</label><citation citation-type="patent"><person-group person-group-type="author"><name><surname>Chen</surname><given-names>H.-Y.</given-names></name><name><surname>Mulla</surname><given-names>S.</given-names></name><name><surname>Ballinger</surname><given-names>T.H.</given-names></name></person-group><article-title>No<sub>x</sub> Storage Materials for Sensor Applications</article-title><patent>U.S. Patent 20,100,146,935</patent><day>17</day><month>June</month><year>2010</year></citation></ref>
<ref id="b31-sensors-12-12329"><label>31.</label><citation citation-type="journal"><person-group person-group-type="author"><name><surname>Rettig</surname><given-names>F.</given-names></name><name><surname>Moos</surname><given-names>R.</given-names></name><name><surname>Plog</surname><given-names>C.</given-names></name></person-group><article-title>Sulfur adsorber for thick-film exhaust gas sensors</article-title><source>Sens. Actuators B Chem.</source><year>2003</year><volume>93</volume><fpage>36</fpage><lpage>42</lpage><pub-id pub-id-type="doi">10.1016/S0925-4005(03)00334-4</pub-id></citation></ref></ref-list>
<sec sec-type="display-objects">
<title>Figures</title>
<fig id="f1-sensors-12-12329" position="float">
<label>Figure 1.</label>
<caption>
<p>Planar sensor setup of the impedimetric accumulating NO<sub>x</sub> sensor based on a lean NO<sub>x</sub> trap layer deposited on interdigital electrodes.</p></caption>
<graphic xlink:href="sensors-12-12329f1.gif"/></fig>
<fig id="f2-sensors-12-12329" position="float">
<label>Figure 2.</label>
<caption>
<p>Scheme of the accumulating sensing principle: (<bold>a</bold>) Operation with alternating sensing and regeneration periods; (<bold>b</bold>) characteristic line to determine the total amount: linear correlation between the sensor response and the amount <italic>A</italic> in the linear measurement range, <italic>LMR</italic>; (<bold>c</bold>) sensor signal on the time scale, <italic>R</italic><sub>rel</sub> (black full line), increases in the presence of NO<sub>x</sub>; amount <italic>A</italic> (dotted grey line) calculated acc. to <xref rid="FD1" ref-type="disp-formula">Equation (1)</xref>; (<bold>d</bold>) signal derivative <italic>Ṙ</italic><sub>rel</sub> reflects the actual concentration <italic>c</italic>; (<bold>e</bold>) correlation between <italic>Ṙ</italic><sub>rel</sub> and <italic>c</italic>.</p></caption>
<graphic xlink:href="sensors-12-12329f2.gif"/></fig>
<fig id="f3-sensors-12-12329" position="float">
<label>Figure 3.</label>
<caption>
<p>Model of the influence of the thickness of the sensitive layer on the electrical properties: (<bold>a</bold>) Mechanism of the storage of NO<sub>x</sub> as nitrate shells on carbonate cores at the surface of the NO<sub>x</sub> storage layer; (<bold>b</bold>) simplified electrical model consisting of a parallel circuit of the NO<sub>x</sub> loaded material and the remaining unloaded layer.</p></caption>
<graphic xlink:href="sensors-12-12329f3.gif"/></fig>
<fig id="f4-sensors-12-12329" position="float">
<label>Figure 4.</label>
<caption>
<p>SEM analysis to estimate the thickness of the sensitive layers as a function of the number of prints.</p></caption>
<graphic xlink:href="sensors-12-12329f4.gif"/></fig>
<fig id="f5-sensors-12-12329" position="float">
<label>Figure 5.</label>
<caption>
<p>Effect of the thickness of the sensitive layer on the electrical properties in the unloaded state: (<bold>a</bold>) Complex impedance plots of samples with 30 μm, 60 μm, and 90 μm (data points at 1 kHz are marked); (<bold>b</bold>) base resistance, <italic>R</italic><sub>0</sub>, as a function of the inverse thickness, 1/<italic>d</italic>.</p></caption>
<graphic xlink:href="sensors-12-12329f5.gif"/></fig>
<fig id="f6-sensors-12-12329" position="float">
<label>Figure 6.</label>
<caption>
<p>Accumulating sensor responses, <italic>R</italic><sub>rel</sub>, of the samples with various thicknesses increasing stepwise during cyclic exposure to 5 or 10 ppm NO (light grey line) or NO<sub>2</sub> (dark grey line) for 25 s each alternating with 0 ppm NO<sub>x</sub> for 200 s.</p></caption>
<graphic xlink:href="sensors-12-12329f6.gif"/></fig>
<fig id="f7-sensors-12-12329" position="float">
<label>Figure 7.</label>
<caption>
<p>Signal derivative, <italic>Ṙ</italic><sub>rel</sub>, of the 30 μm sample during cyclic exposure to NO and NO<sub>2</sub>: (<bold>a</bold>) <italic>Ṙ</italic><sub>rel</sub> of the 30 μm sample corresponding with the actual NO<sub>x</sub> concentration, <italic>c</italic><sub>NOx</sub>; (<bold>b</bold>) resulting correlation between <italic>Ṙ</italic><sub>rel</sub> and <italic>c</italic><sub>NOx</sub>.</p></caption>
<graphic xlink:href="sensors-12-12329f7.gif"/></fig>
<fig id="f8-sensors-12-12329" position="float">
<label>Figure 8.</label>
<caption>
<p>Layer thickness influence on the sensitivity: (<bold>a</bold>) Comparison of the characteristic lines for different coating thicknesses; (<bold>b</bold>) the resulting values of the amount-sensitivity, <italic>S</italic><sub>A</sub>, as a function of 1/<italic>d</italic>.</p></caption>
<graphic xlink:href="sensors-12-12329f8.gif"/></fig>
<fig id="f9-sensors-12-12329" position="float">
<label>Figure 9.</label>
<caption>
<p>The effect of the thickness on the linear measurement range, <italic>LMR</italic>: (<bold>a</bold>) <italic>R</italic><sub>rel</sub> increases linearly in the presence of 5 ppm NO and 5 ppm NO<sub>2</sub> up to about 30%, (<bold>b</bold>) <italic>LMR</italic> as a function of <italic>d</italic>.</p></caption>
<graphic xlink:href="sensors-12-12329f9.gif"/></fig>
<fig id="f10-sensors-12-12329" position="float">
<label>Figure 10.</label>
<caption>
<p>Analysis of the sensor response time, <italic>t</italic><sub>90</sub>, of <italic>Ṙ</italic><sub>rel</sub> in 10 ppm NO<sub>x</sub> as a function of the thickness <italic>d</italic>.</p></caption>
<graphic xlink:href="sensors-12-12329f10.gif"/></fig>
<fig id="f11-sensors-12-12329" position="float">
<label>Figure 11.</label>
<caption>
<p>Illustration of the effect of the thickness of the sensitive layer (<italic>d</italic><sub>1</sub> &lt; <italic>d</italic><sub>2</sub>) on the sensitivity, <italic>S</italic><sub>A</sub>, and the linear measurement range, <italic>LMR</italic>, with the end of the linear measurement range being at 30% signal change.</p></caption>
<graphic xlink:href="sensors-12-12329f11.gif"/></fig></sec></back></article>
