Quantum Cascade Laser Absorption Spectroscopy as a Plasma Diagnostic Tool: An Overview

 ,
,
Abstract
:
1. Introduction
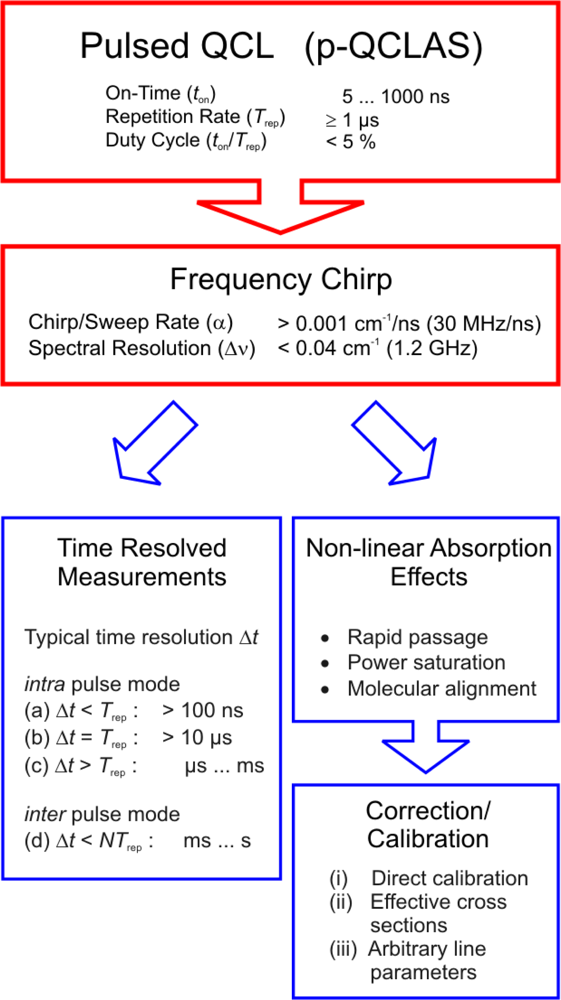
2. Pulsed QCLs
2.1. General Spectroscopic Issues
2.2. Non-Linear Absorption Phenomena
2.3. Quantification of Number Densities
- calibration of individual line strengths S or absorption coefficients σ(Section 2.3.1.),
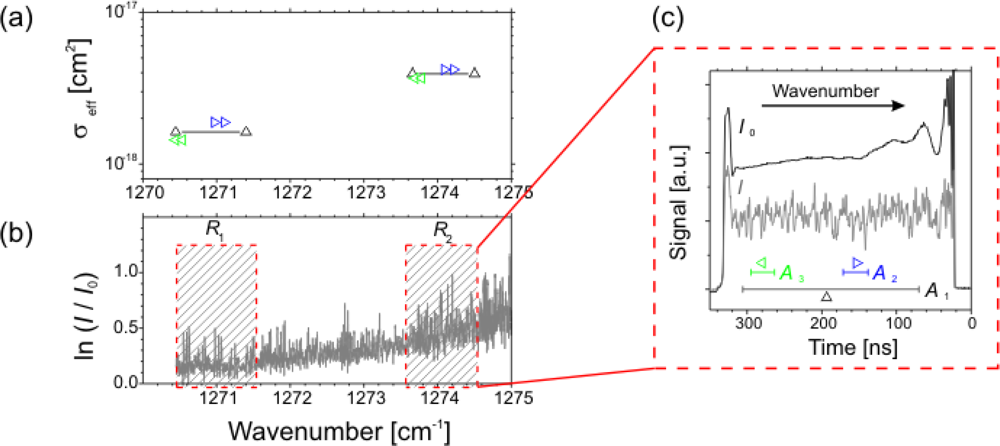
- employing an effective absorption coefficient σeff determined for a specific spectral micro-window <ν> (Section 2.3.2.), or
- using optimized arbitrary line positions and strengths for complex spectra (Section 2.3.3.).
2.3.1. Calibration of individual lines
2.3.2. Effective absorption cross sections
2.3.3. Arbitrary line parameters
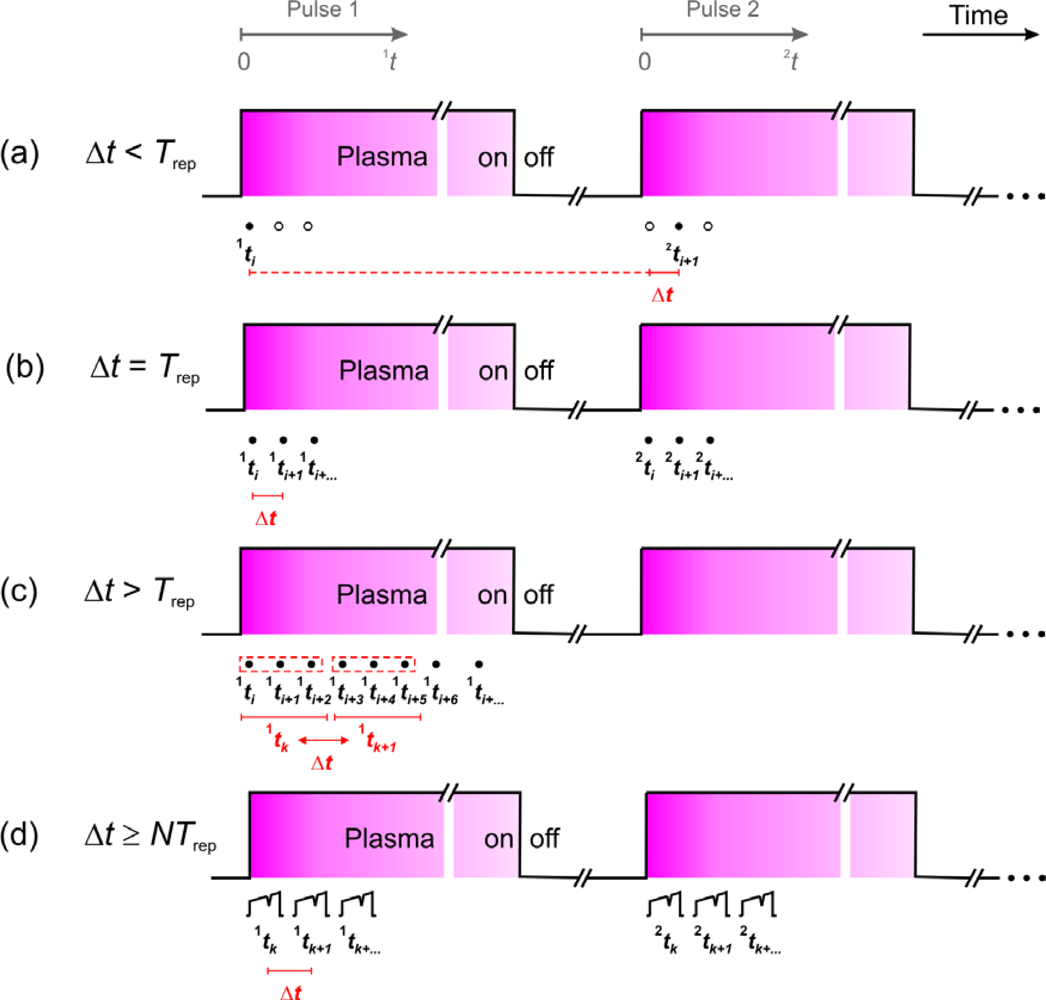
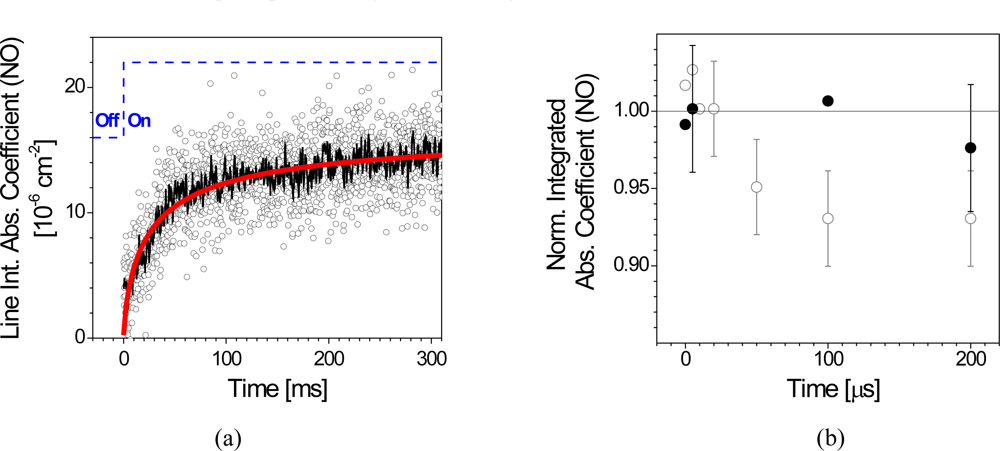
2.4. Time Resolution in p—QCLAS
2.5. Plasma Diagnostics Using p—QCLAS
2.5.1. Evolution of the gas temperature in a pulsed plasma
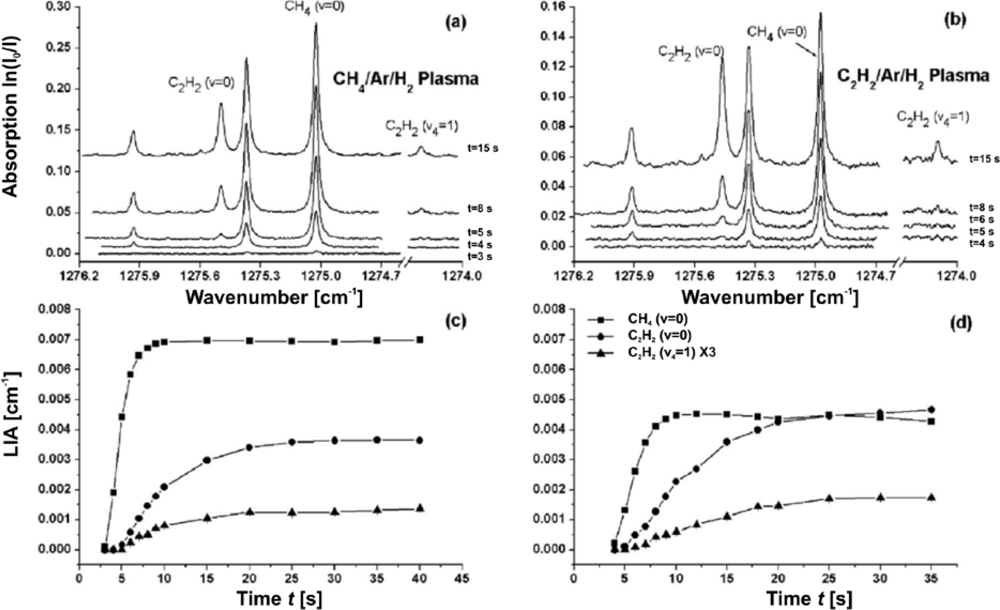
2.5.2. Detection and quantification of hydrocarbons in diamond deposition processes
2.5.3. Diagnostics of flames
- high gas temperatures,
- weaker absorption features due to high temperatures (i.e., reduced cross sections),
- large spatial inhomogeneity,
- small absorption volumes,
- scattering caused by soot formation, and
- turbulent gas flows.
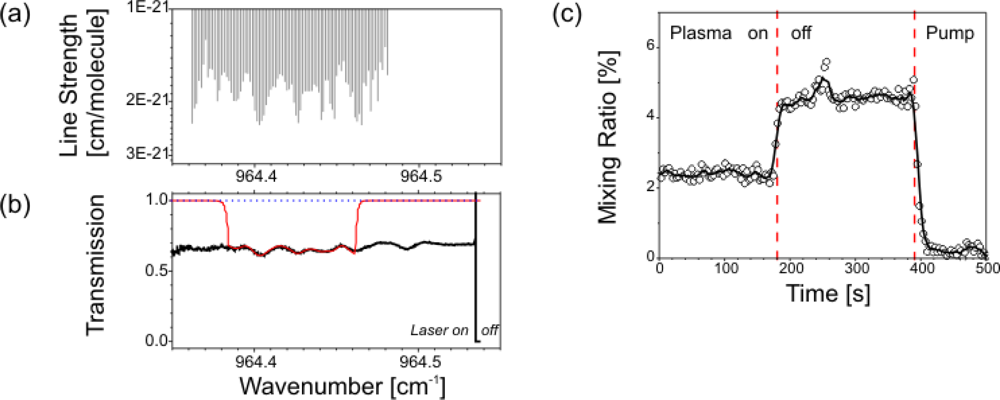
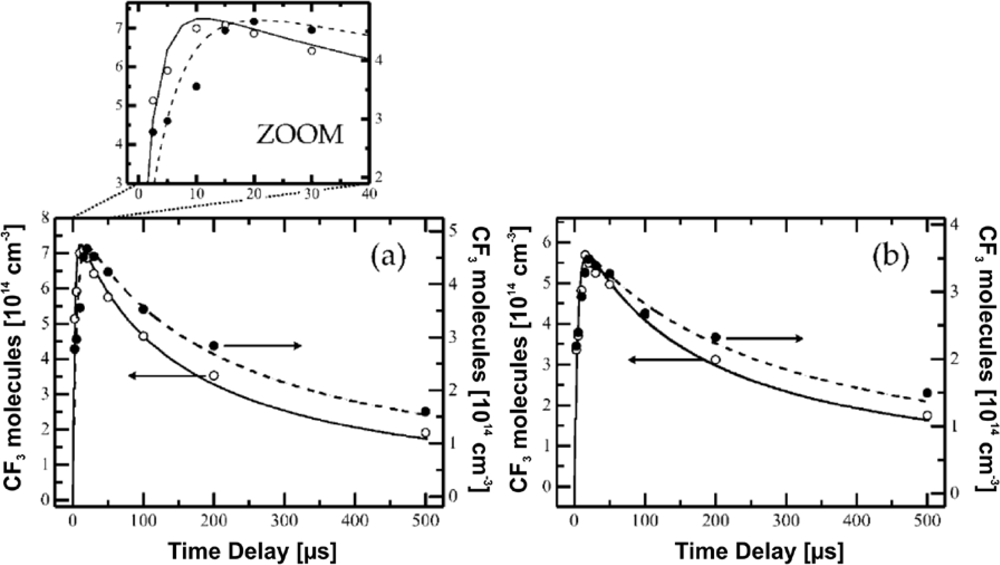
2.5.4. Detection of fluorocarbons under low pressure conditions
- the discrimination between blended complex spectra, and
- non-linear absorption phenomena.
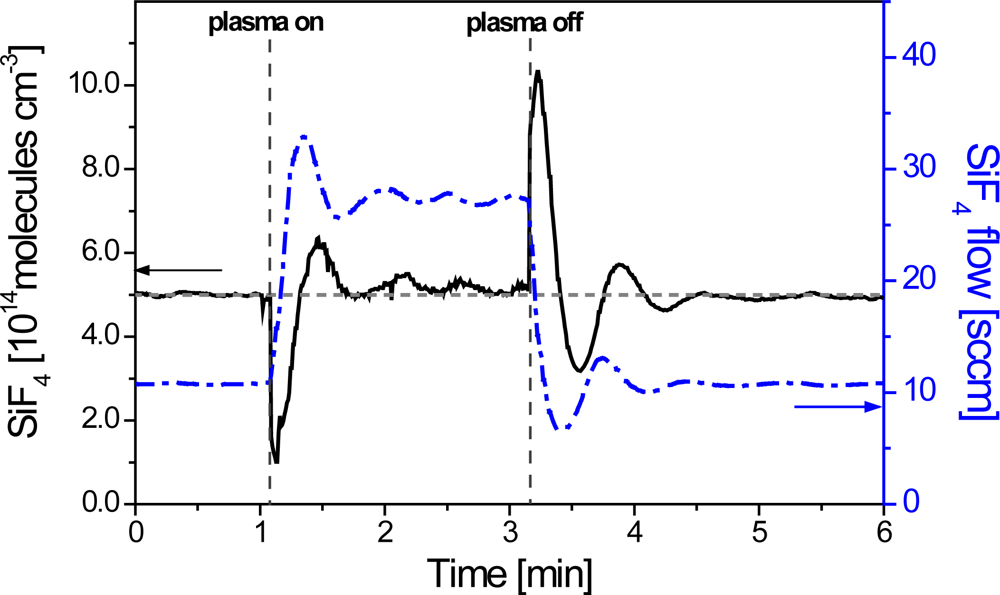
2.5.5. Industrial etch process monitoring
2.5.6. Industrial process control
3. Application of CW-QCLs
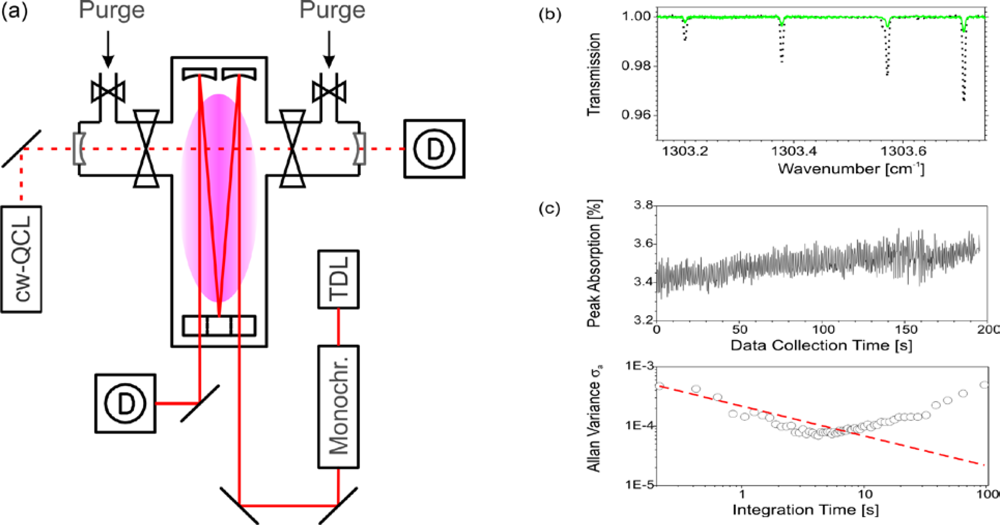
3.1. Direct Absorption Employing cw-QCLAS
3.1.1. Deposition rate and precursor dissociation studies in silane plasmas
3.1.2. CH4 detection in a microwave discharge
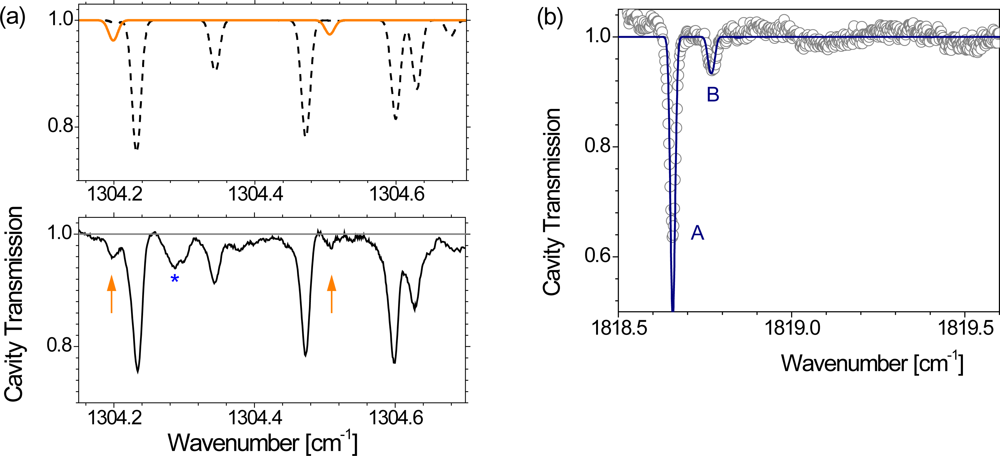
3.2. Chemical Sensing in Plasmas Using Optical Cavities
3.2.1. HCN detection in an Ar-CH4-N2 microwave plasma
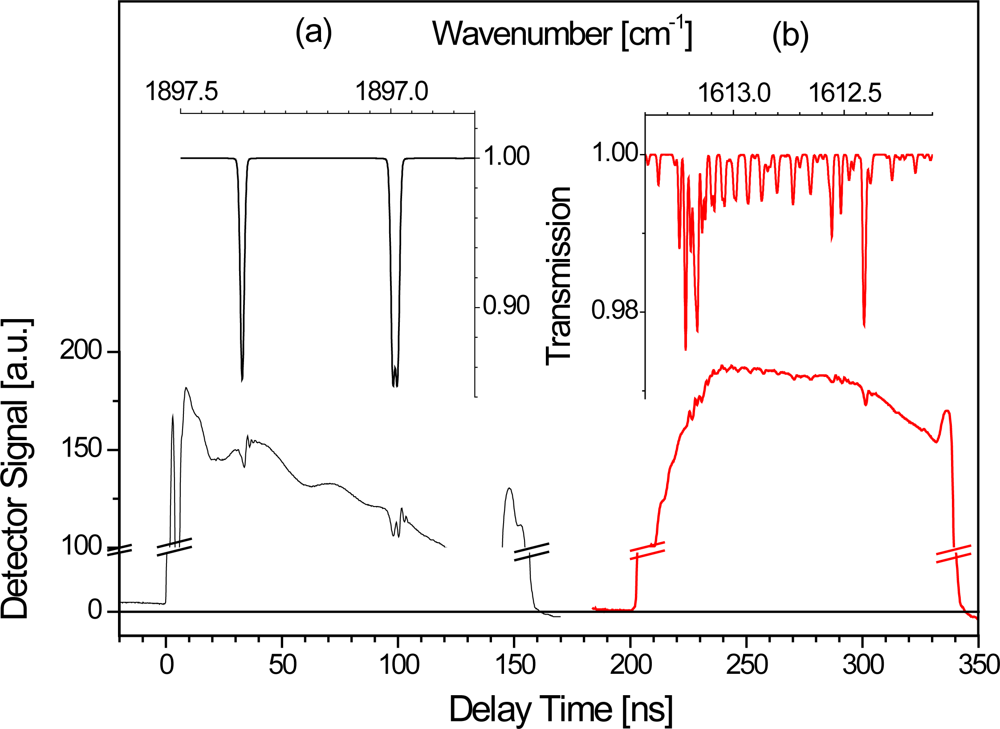
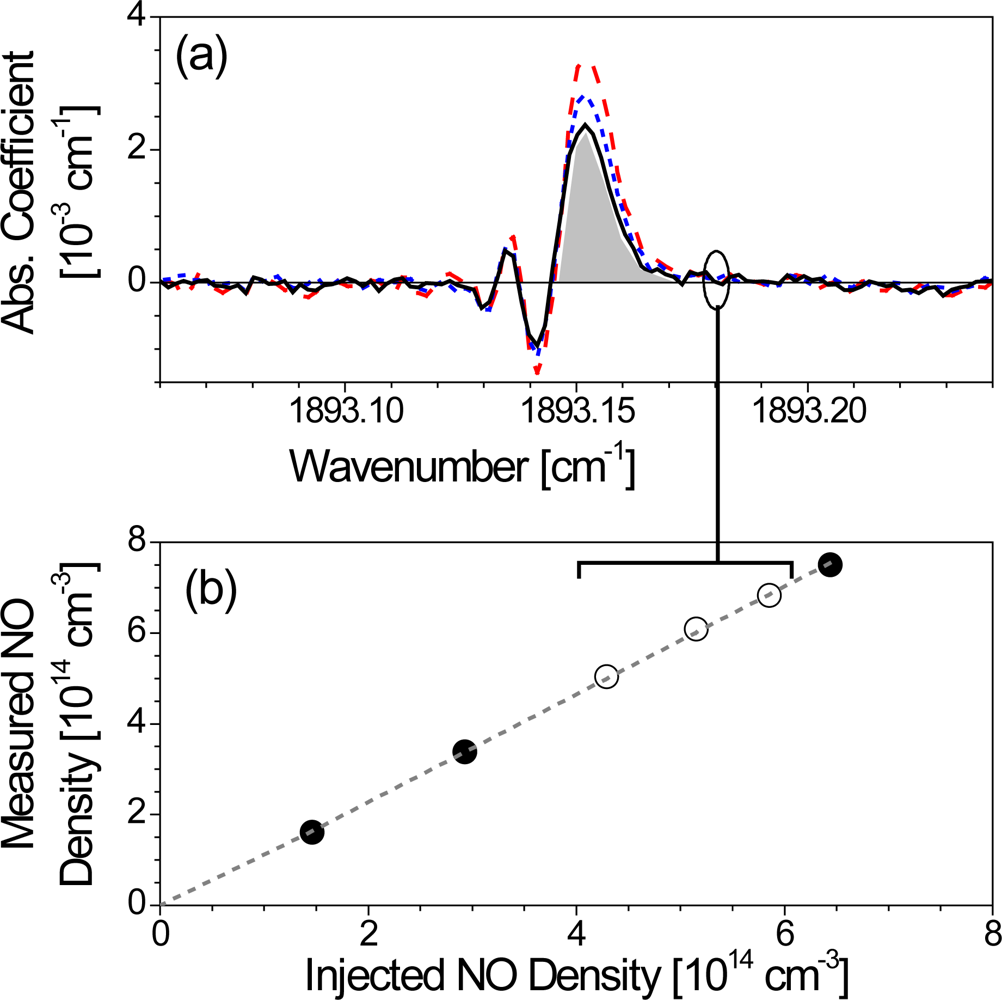
3.2.2. NO detection in an Ar-O2 plasma
4. Conclusions
Acknowledgments
A. Appendix
A.1. Acronyms
| AS | absorption spectroscopy |
| CEAS | cavity enhanced absorption spectroscopy |
| CRDS | cavity ring-down spectroscopy |
| CVD | chemical vapor deposition |
| cw | continuous wave |
| D-AS | direct absorption spectroscopy |
| DC | direct current (discharge) |
| DP | double pass |
| EM | electromagnetic |
| FM | frequency modulation |
| DFB | distributed feedback |
| IR | infrared |
| ICL | inter-band cascade laser |
| ICOS | integrated cavity output spectroscopy |
| LAS | laser absorption spectroscopy |
| LIA | line integrated absorption coefficient |
| MW | microwave (discharge) |
| NICE-OHMS | noise immune cavity enhanced optical heterodyne molecular spectroscopy |
| OA | off-axis |
| OF | optical feedback |
| PE | plasma enhanced |
| QCL | quantum cascade laser |
| QCLAS | quantum cascade laser absorption spectroscopy |
| QE | quartz enhanced |
| cw-QCLAS | quantum cascade laser absorption spectroscopy using cw devices |
| p-QCLAS | quantum cascade laser absorption spectroscopy using pulsed devices |
| PAS | photo-acoustic spectroscopy |
| PS | phase shift |
| ppm | part per million |
| RF | radiofrequency (discharge) |
| sccm | standard cubic centimeters per minute |
| SP | single pass |
| SNR | signal-to-noise ratio |
| TDL | tuneable diode laser |
| TDLAS | tuneable diode laser absorption spectroscopy |
| TE | thermoelectric |
| VHF | very high frequency (discharge) |
| WM | wavelength modulation |
A.2. Chemical formulae
| Ar | Argon |
| BCl3 | Boron trichloride |
| CF | Fluoromethylidyne |
| CF3 | Trifluoromethyl |
| CF4 | Carbon fluoride (Tetrafluoromethane) |
| C2F6 | Perfluoroethane |
| C3F8 | Perfluoropropane |
| C4F6 | Hexafluorocyclobutene |
| CF3I | Trifluoroiodomethane |
| CH4 | Methane |
| C2H4 | Ethylene |
| C2H2 | Acetylene |
| H2 | Hydrogen |
| HCN | Hydrogen cyanide |
| H2O | Water |
| N2 | Nitrogen |
| NO | Nitric oxide |
| NO2 | Nitrogen dioxide |
| O2 | Oxygen |
| NF3 | Nitrogen trifluoride |
| SiF4 | Silicon tetrafluoride |
| SiH4 | Silane |
References
- Hirota, E; Kawaguchi, K. High-resolution infrared studies of molecular-dynamics. Annu. Rev. Phys. Chem 1985, 36, 53–76. [Google Scholar]
- Davies, PB. Diode laser absorption spectroscopy of free radicals, ions and transient molecules. Spectrochim. Acta Pt. a-Mol. Bio 1999, 55, 1987–1997. [Google Scholar]
- Crozet, P; Ross, AJ; Vervloet, M. Gas-phase molecular spectroscopy. Annu. Rep. Prog. Chem. Sect. C 2002, 98, 33–86. [Google Scholar]
- Curl, RF; Tittel, FK. Tunable infrared laser spectroscopy. Annu. Rep. Prog. Chem. Sect. C 2002, 98, 219–272. [Google Scholar]
- Röpcke, J; Lombardi, G; Rousseau, A; Davies, PB. Application of mid-infrared tuneable diode laser absorption spectroscopy to plasma diagnostics: a review. Plas. Sour. Sci. Tech 2006, 15, S148–S168. [Google Scholar]
- Lackner, M. Tunable Diode Laser Absorption Spectroscopy (TDLAS) in the process industries—A review. Rev. Chem. Eng 2007, 23, 65–147. [Google Scholar]
- Tittel, FK; Richter, D; Fried, A. Mid-Infrared Laser Applications in Spectroscopy In Solid-State Mid-Infrared Laser Sources; Sorokina, IT, Vodopyanov, KL, Eds.; Springer: Berlin, Heidelberg, Germany, 2003; Volume 89, pp. 458–529. [Google Scholar]
- Godard, A. Infrared (2–12 μm) solid-state laser sources: A review. C.R. Phys 2007, 8, 1100–1128. [Google Scholar]
- Tacke, M. New developments and application of tunable IR lead salt lasers. Infra. Phys. Techn 1995, 36, 447–463. [Google Scholar]
- Faist, J; Capasso, F; Sivco, DL; Sirtori, C; Hutchinson, AL; Cho, AY. Quantum cascade laser. Science 1994, 264, 553–556. [Google Scholar]
- Meyer, JR; Hoffman, CA; Bartoli, FJ; Rammohan, LR. Type-II Quantum-Well Lasers for the Midwavelength Infrared. Appl. Phys. Lett 1995, 67, 757–759. [Google Scholar]
- Yang, RQ. Infrared laser based on intersubband transitions in quantum wells. Superlattice. Microstruct 1995, 17, 77. [Google Scholar]
- Faist, J; Capasso, F; Sivco, DL; Hutchinson, AL; Chu, SNG; Cho, AY. Short wavelength (lambda similar to 3.4 μm) quantum cascade laser based on strained compensated InGaAs/AlInAs. Appl. Phys. Lett 1998, 72, 680–682. [Google Scholar]
- Faist, J; Tredicucci, A; Capasso, F; Sirtori, C; Sivco, DL; Baillargeon, JN; Hutchinson, AL; Cho, AY. High-power continuous-wave quantum cascade lasers. IEEE J. Quantum. Elect 1998, 34, 336–343. [Google Scholar]
- Hofstetter, D; Beck, M; Aellen, T; Faist, J; Oesterle, U; Ilegems, M; Gini, E; Melchior, H. Continuous wave operation of a 9.3 μm quantum cascade laser on a Peltier cooler. Appl. Phys. Lett 2001, 78, 1964–1966. [Google Scholar]
- Beck, M; Hofstetter, D; Aellen, T; Faist, J; Oesterle, U; Ilegems, M; Gini, E; Melchior, H. Continuous wave operation of a mid-infrared semiconductor laser at room temperature. Science 2002, 295, 301–305. [Google Scholar]
- Capasso, F; Gmachl, C; Paiella, R; Tredicucci, A; Hutchinson, AL; Sivco, DL; Baillargeon, JN; Cho, AY; Liu, HC. New frontiers in quantum cascade lasers and applications. IEEE J. Sel. Top. Quant 2000, 6, 931–947. [Google Scholar]
- Gmachl, C; Capasso, F; Sivco, DL; Cho, AY. Recent progress in quantum cascade lasers and applications. Rep. Prog. Phys 2001, 64, 1533–1601. [Google Scholar]
- Capasso, F; Gmachl, C; Sivco, DL; Cho, AY. Quantum cascade lasers. Phys. Today 2002, 55, 34–40. [Google Scholar]
- Faist, J; Hofstetter, D; Beck, M; Aellen, T; Rochat, M; Blaser, S. Bound-to-continuum and two-phonon resonance quantum-cascade lasers for high duty cycle, high-temperature operation. IEEE. J. Quantum. Elect 2002, 38, 533–546. [Google Scholar]
- Sirtori, C; Nagle, J. Quantum Cascade Lasers: the quantum technology for semiconductor lasers in the mid-far-infrared. Cr. Phys 2003, 4, 639–648. [Google Scholar]
- Razeghi, M; Slivken, S; Bai, Y; Gokden, B; Darvish, SR. High power quantum cascade lasers. N. J. Phys 2009, 11, 125017. [Google Scholar]
- McManus, JB; Nelson, DD; Shorter, JH; Jimenez, R; Herndon, S; Saleska, S; Zahniser, M. A high precision pulsed quantum cascade laser spectrometer for measurements of stable isotopes of carbon dioxide. J. Mod. Optic 2005, 52, 2309–2321. [Google Scholar]
- Hay, KG; Wright, S; Duxbury, G; Langford, N. In-flight measurements of ambient methane, nitrous oxide and water using a quantum cascade laser based spectrometer. Appl. Phys. B-Lasers. Opt 2008, 90, 329–337. [Google Scholar]
- Bauer, C; Sharma, AK; Willer, U; Burgmeier, J; Braunschweig, B; Schade, W; Blaser, S; Hvozdara, L; Muller, A; Holl, G. Potentials and limits of mid-infrared laser spectroscopy for the detection of explosives. Appl. Phys. B-Lasers Opt 2008, 92, 327–333. [Google Scholar]
- McCurdy, MR; Bakhirkin, Y; Wysocki, G; Lewicki, R; Tittel, FK. Recent advances of laser-spectroscopy-based techniques for applications in breath analysis. J. Breath Res 2007, 1, 014001. [Google Scholar]
- Borri, S; Bartalini, S; Galli, I; Cancio, P; Giusfredi, G; Mazzotti, D; Castrillo, A; Gianfrani, L; De Natale, P. Lamb-dip-locked quantum cascade laser for comb-referenced IR absolute frequency measurements. Opt. Express 2008, 16, 11637–11646. [Google Scholar]
- Martini, R; Bethea, C; Capasso, F; Gmachl, C; Paiella, R; Whittaker, EA; Hwang, HY; Sivco, DL; Baillargeon, JN; Cho, AY. Free-space optical transmission of multimedia satellite data streams using mid-infrared quantum cascade lasers. Electron. Lett 2002, 38, 181–183. [Google Scholar]
- Yu, N; Cubukcu, E; Diehl, L; Belkin, MA; Crozier, KB; Capasso, F; Bour, D; Corzine, S; Hofler, G. Plasmonic quantum cascade laser antenna. Appl. Phys. Lett 2007, 91, 173113. [Google Scholar]
- Cheesman, A; Smith, JA; Ashfold, MNR; Langford, N; Wright, S; Duxbury, G. Application of a quantum cascade laser for time-resolved, in situ probing of CH4/H2 and C2H2/H2 gas mixtures during microwave plasma enhanced chemical vapor deposition of diamond. J. Phys. Chem A 2006, 110, 2821–2828. [Google Scholar]
- Welzel, S; Gatilova, L; Röpcke, J; Rousseau, A. Time-resolved study of a pulsed dc discharge using quantum cascade laser absorption spectroscopy: NO and gas temperature kinetics. Plasma. Sources Sci. Technol 2007, 16, 822–831. [Google Scholar]
- Stancu, GD; Lang, N; Röpcke, J; Reinicke, M; Steinbach, A; Wege, S. In-situ monitoring of silicon plasma etching using a quantum cascade laser arrangement. Chem. Vapor. Depos 2007, 13, 351–360. [Google Scholar]
- Lang, N; Röpcke, J; Wege, S; Steinbach, A. In situ diagnostic of etch plasmas for process control using quantum cascade laser absorption spectroscopy. Eur. Phys J-Appl. Phys 2010, 49, 13110. [Google Scholar]
- Tittel, FK; Bakhirkin, Y; Kosterev, AA; Wysocki, G. Recent advances in trace gas detection using quantum and interband cascade lasers. Plasma. Sources Sci. Technol 2006, 34, 275–282. [Google Scholar]
- O'Keefe, A; Deacon, DAG. Cavity ring-down optical spectrometer for absorption-measurements using pulsed laser sources. Rev. Sci. Instrum 1988, 59, 2544–2551. [Google Scholar]
- Engeln, R; Berden, G; Peeters, R; Meijer, G. Cavity enhanced absorption and cavity enhanced magnetic rotation spectroscopy. Rev Sci. Instrum 1998, 69, 3763–3769. [Google Scholar]
- O'Keefe, A. Integrated cavity output analysis of ultra-weak absorption. Chem. Phys. Lett 1998, 293, 331–336. [Google Scholar]
- Ye, J; Ma, LS; Hall, JL. Ultrasensitive detections in atomic and molecular physics: demonstration in molecular overtone spectroscopy. J. Opt. Soc. Am B-Opt. Physics 1998, 15, 6–15. [Google Scholar]
- Berden, G; Engeln, R (Eds.) Cavity ring-down spectroscopy: techniques and applications; John Wiley & Sons: Chichester, UK, 2009.
- Welzel, S; Lombardi, G; Davies, PB; Engeln, R; Schram, DC; Röpcke, J. Trace gas measurements using optically resonant cavities and quantum cascade lasers operating at room temperature. J. Appl. Phys 2008, 104, 093115. [Google Scholar]
- Moyer, EJ; Sayres, DS; Engel, GS; Clair, JMS; Keutsch, FN; Allen, NT; Kroll, JH; Anderson, JG. Design considerations in high-sensitivity off-axis integrated cavity output spectroscopy. Appl. Phys. B-Lasers Opt 2008, 92, 467–474. [Google Scholar]
- Schmidt, F. Laser-based Absorption Spectrometry: Development of NICE-OHMS towards Ultra-Sensitive Trace Species Detection; Umea University: Umea, Sweden, 2007. [Google Scholar]
- Namjou, K; Cai, S; Whittaker, EA; Faist, J; Gmachl, C; Capasso, F; Sivco, DL; Cho, AY. Sensitive absorption spectroscopy with a room-temperature distributed-feedback quantum-cascade laser. Optics Letters 1998, 23, 219–221. [Google Scholar]
- Normand, E; McCulloch, M; Duxbury, G; Langford, N. Fast, real-time spectrometer based on a pulsed quantum-cascade laser. Optics Letters 2003, 28, 16–18. [Google Scholar]
- Beyer, T; Braun, M; Lambrecht, A. Fast gas spectroscopy using pulsed quantum cascade lasers. J. Appl. Phys 2003, 93, 3158–3160. [Google Scholar]
- Gmachl, C; Capasso, F; Kohler, R; Tredicucci, A; Hutchinson, AL; Sivco, DL; Baillargeon, JN; Cho, AY. The sense-ability of semiconductor lasers—Mid-infrared tunable quantum cascade lasers for gas-sensing applications. IEEE Circuits Device 2000, 16, 10–18. [Google Scholar]
- McCulloch, MT; Normand, EL; Langford, N; Duxbury, G; Newnham, DA. Highly sensitive detection of trace gases using the time-resolved frequency downchirp from pulsed quantum-cascade lasers. J. Opt. Soc. Am B-Opt. Physics 2003, 20, 1761–1768. [Google Scholar]
- Duxbury, G; Langford, N; McCulloch, MT; Wright, S. Rapid passage induced population transfer and coherences in the 8 micron spectrum of nitrous oxide. Mol. Phys 2007, 105, 741–754. [Google Scholar]
- Loy, MMT. Observation of population inversion by optical adiabatic rapid passage. Phys. Rev. Lett 1974, 32, 814–817. [Google Scholar]
- Ernst, RR. Sensitivity Enhancement in Magnetic Resonance. In Advances in Magnetic Resonance; Waugh, JS, Ed.; Academic Press: New York, NY, USA, 1966; Volume 2, pp. 1–135. [Google Scholar]
- Duxbury, G; Langford, N; McCulloch, MT; Wright, S. Quantum cascade semiconductor infrared and far-infrared lasers: from trace gas sensing to non-linear optics. Chem. Soc. Rev 2005, 34, 921–934. [Google Scholar]
- Duxbury, G. Infrared Vibration-Rotation Spectroscopy: from Free Radicals to the Infrared Sky; Wiley: Chichester, UK, 2000. [Google Scholar]
- van Helden, JH; Peverall, R; Ritchie, GAD; Walker, RJ. Rapid passage effects in nitrous oxide induced by a chirped external cavity quantum cascade laser. Appl. Phys. Lett 2009, 94, 051116. [Google Scholar]
- McCulloch, MT; Duxbury, G; Langford, N. Observation of saturation and rapid passage signals in the 10.25 micron spectrum of ethylene using a frequency chirped quantum cascade laser. Mol. Phys 2006, 104, 2767–2779. [Google Scholar]
- van Helden, JH; Horrocks, SJ; Ritchie, GAD. Application of quantum cascade lasers in studies of low-pressure plasmas: Characterization of rapid passage effects on density and temperature measurements. Appl. Phys. Lett 2008, 92, 081506. [Google Scholar]
- Ma, J; Cheesman, A; Ashfold, MNR; Hay, KG; Wright, S; Langford, N; Duxbury, G; Mankelevich, YA. Quantum cascade laser investigations of CH4 and C2H2 interconversion in hydrocarbon/H2 gas mixtures during microwave plasma enhanced chemical vapor deposition of diamond. J. Appl. Phys 2009, 106, 033305. [Google Scholar]
- Hancock, G; Horrocks, SJ; Ritchie, GAD; van Helden, JH; Walker, RJ. Time-resolved detection of the CF3 photofragment using chirped QCL radiation. J. Phys. Chem. A 2008, 112, 9751–9757. [Google Scholar]
- Welzel, S; Stepanov, S; Meichsner, J; Röpcke, J. Application of quantum cascade laser absorption spectroscopy to studies of fluorocarbon molecules. J. Phys.: Conf. Ser 2009, 157, 012010. [Google Scholar]
- Harward, CN; Parrish, ME; Plunkett, SE; Banyasz, JL; Shafer, KH. Evaluation of hydrazine acetate filters using in reduction by cellulose infrared tunable diode laser spectroscopy. Anal. Chem 2002, 74, 5871–5881. [Google Scholar]
- Harward, CN; Baren, RE; Parrish, ME. Determination of molecular parameters for 1,3-butadiene and propylene using infrared tunable diode laser absorption spectroscopy. Spectrochimica Acta Part a-Molecular and Biomolecular Spectroscopy 2004, 60, 3421–3429. [Google Scholar]
- Harward, CN; Thweatt, WD; Baren, RE; Parrish, ME. Determination of molecular line parameters for acrolein(C3H4O) using infrared tunable diode laser absorption spectroscopy. Spectrochimica Acta Part a-Molecular and Biomolecular Spectroscopy 2006, 63, 970–980. [Google Scholar]
- Nelson, DD; Shorter, JH; McManus, JB; Zahniser, MS. Sub-part-per-billion detection of nitric oxide in air using a thermoelectrically cooled mid-infrared quantum cascade laser spectrometer. Appl. Phys. B-Lasers Opt 2002, 75, 343–350. [Google Scholar]
- Hempel, F; Artyushenko, V; Weichbrodt, F; Ropcke, J. Application of quantum cascade lasers and infrared-fibres for the monitoring and control of industrial plasma processes. J. Physics: Conf. Ser 2009, 157, 012003. [Google Scholar]
- Lang, N; Röpcke, J; Steinbach, A; Wege, S. Wafer2Wafer Etch Monitor via In Situ QCLAS. IEEE T Plasma Sci 2009, 37, 2335–2341. [Google Scholar]
- Hübner, M. Quantum Cascade Laser Absorption Spectroscopy Study on the Influence of Plasma Stimulated Surface Adsorptions to the NO Destruction Kinetics. Proceedings of Frontiers in Low Temperature Plasma Diagnostics (FLTPD), Blansko, Czech Republic, 2009.
- Quine, ZR; McNesby, KL. Acetylene measurement in flames by chirp-based quantum cascade laser spectrometry. Appl. Opt 2009, 48, 3075–3083. [Google Scholar]
- Duxbury, G; Hay, KG; Black, P; Langford, N. Real-Time Diagnostics in Exhaust Plumes, Flames, and the Atmosphere Using an Intra-Pulse Quantum Cascade Laser Spectrometer. In Laser Applications to Chemical, Security and Environmental Analysis (LACSEA); Optical Society of America (OSA): San Diego, CA, USA, 2010. [Google Scholar]
- Wormhoudt, J. Radical and Molecular Product Concentration Measurements in CF4 and CH4 Radio-Frequency Plasmas by Infrared Tunable Diode-Laser Absorption. J. Vac. Sci. Technol. A 1990, 8, 1722–1725. [Google Scholar]
- Stepanov, S; Welzel, S; Ropcke, J; Meichsner, J. Time resolved QCLAS measurements in pulsed cc-rf CF4/H2 plasmas. J. Physics: Conf. Ser 2009, 157, 012008. [Google Scholar]
- Welzel, S; Stepanov, S; Meichsner, J; Röpcke, J. Time resolved studies on pulsed fluorocarbon plasmas using chirped quantum cascade lasers. J. Phys-D-Appl. Phys 2010, 43, 124014. [Google Scholar]
- Zahniser, MS; Nelson, DD; Mcmanus, JB; Kebabian, PL. Measurement of Trace Gas Fluxes Using Tunable Diode-Laser Spectroscopy. Philos. T. Roy. Soc. A 1995, 351, 371–381. [Google Scholar]
- Bartlome, R; Feltrin, A; Ballif, C. Infrared laser-based monitoring of the silane dissociation during deposition of silicon thin films. Appl. Phys. Lett 2009, 94, 201501. [Google Scholar]
- Röpcke, J; Mechold, L; Käning, M; Fan, WY; Davies, PB. Tunable diode laser diagnostic studies of H2-Ar-O2 microwave plasmas containing methane or methanol. Plasma. Chem. Plasma. P 1999, 19, 395–419. [Google Scholar]
- Hempel, F; Davies, PB; Loffhagen, D; Mechold, L; Röpcke, J. Diagnostic studies of H2-Ar-N2 microwave plasmas containing methane or methanol using tunable infrared diode laser absorption spectroscopy. Plasma Sources Sci. Technol 2003, 12, S98–S110. [Google Scholar]
- Röpcke, J; Mechold, L; Käning, M; Anders, J; Wienhold, FG; Nelson, D; Zahniser, M. IRMA: A tunable infrared multicomponent acquisition system for plasma diagnostics. Rev. Sci. Instrum 2000, 71, 3706–3710. [Google Scholar]
- Zijlmans, RAB; Gabriel, O; Welzel, S; Hempel, F; Röpcke, J; Engeln, R; Schram, DC. Molecule synthesis in an Ar-CH4-O2-N2 microwave plasma. Plasma Sources Sci. Technol 2006, 15, 564–573. [Google Scholar]
- Allan, DW. Statistics of Atomic Frequency Standards. Pr. Inst. Electr. Elect 1966, 54, 221. [Google Scholar]
- Werle, P; Mucke, R; Slemr, F. The limits of signal averaging in atmospheric trace-gas monitoring by tunable diode-laser absorption-spectroscopy (TDLAS). Appl. Phys. B-Lasers Opt 1993, 57, 131–139. [Google Scholar]
- Nelson, DD; McManus, JB; Herndon, SC; Shorter, JH; Zahniser, MS; Blaser, S; Hvozdara, L; Muller, A; Giovannini, M; Faist, J. Characterization of a near-room-temperature, continuous-wave quantum cascade laser for long-term, unattended monitoring of nitric oxide in the atmosphere. Optics Letters 2006, 31, 2012–2014. [Google Scholar]
- Anderson, DZ; Frisch, JC; Masser, CS. Mirror Reflectometer Based on Optical Cavity Decay Time. Applied Optics 1984, 23, 1238–1245. [Google Scholar]
- O'Keefe, A; Deacon, DAG. Cavity Ring-down Optical Spectrometer for Absorption-Measurements Using Pulsed Laser Sources. Rev. Sci. Instrum 1988, 59, 2544–2551. [Google Scholar]
- Bakhirkin, YA; Kosterev, AA; Roller, C; Curl, RF; Tittel, FK. Mid-infrared quantum cascade laser based off-axis integrated cavity output spectroscopy for biogenic nitric oxide detection. Applied Optics 2004, 43, 2257–2266. [Google Scholar]
- Sharpe, SW; Kelly, JF; Hartman, JS; Gmachl, C; Capasso, F; Sivco, DL; Baillargeon, JN; Cho, AY. High-resolution (Doppler-limited) spectroscopy using quantum-cascade distributed-feedback lasers. Optics Letters 1998, 23, 1396–1398. [Google Scholar]
- McManus, JB; Nelson, DD; Herndon, SC; Shorter, JH; Zahniser, MS; Blaser, S; Hvozdara, L; Muller, A; Giovannini, M; Faist, J. Comparison of cw and pulsed operation with a TE-cooled quantum cascade infrared laser for detection of nitric oxide at 1900 cm-1. Appl. Phys. B-Lasers Opt 2006, 85, 235–241. [Google Scholar]
- Rothman, LS; Jacquemart, D; Barbe, A; Benner, DC; Birk, M; Brown, LR; Carleer, MR; Chackerian, C; Chance, K; Coudert, LH; Dana, V; Devi, VM; Flaud, JM; Gamache, RR; Goldman, A; Hartmann, JM; Jucks, KW; Maki, AG; Mandin, JY; Massie, ST; Orphal, J; Perrin, A; Rinsland, CP; Smith, MAH; Tennyson, J; Tolchenov, RN; Toth, RA; Vander Auwera, J; Varanasi, P; Wagner, G. The HITRAN 2004 molecular spectroscopic database. J. Quant. Spectrosc. Rad 2005, 96, 139–204. [Google Scholar]
- Hempel, F; Lang, N; Zimmermann, H; Strämke, S; Röpcke, J. Plasma process monitoring of BCl3 using high resolution infrared laser absorption spectroscopy. Meas. Sci. Technol 2010, 8, 085703. [Google Scholar]
- Bauer, C; Willer, U; Lewicki, R; Pohlkotter, A; Kosterev, A; Kosynkin, D; Tittel, FK; Schade, W. A Mid-infrared QEPAS sensor device for TATP detection. J. Physics: Conf. Ser 2009, 157, 012002. [Google Scholar]
- Wysocki, G; Lewicki, R; Curl, RF; Tittel, FK; Diehl, L; Capasso, F; Troccoli, M; Hofler, G; Bour, D; Corzine, S; Maulini, R; Giovannini, M; Faist, J. Widely tunable mode-hop free external cavity quantum cascade lasers for high resolution spectroscopy and chemical sensing. Appl. Phys. B-Lasers Opt 2008, 92, 305–311. [Google Scholar]
- Mukherjee, N; Patel, CKN. Molecular fine structure and transition dipole moment of NO2 using an external cavity quantum cascade laser. Chem. Phys. Lett 2008, 462, 10–13. [Google Scholar]
- Zahniser, MS; Nelson, DD; McManus, JB; Herndon, SC; Wood, EC; Shorter, JH; Lee, BH; Santoni, GW; Jimenez, R; Daube, BC; Park, S; Kort, EA; Wofsy, SC. Infrared QC laser applications to field measurements of atmospheric trace gas sources and sinks in environmental research: enhanced capabilities using continuous wave QCLs; Quantum Sensing and Nanophotonic Devices VI: San Jose, CA, USA, 2009; SPIE: San Jose, CA, USA, 2009; p. 72220H.
- Castrillo, A; De Tommasi, E; Gianfrani, L; Sirigu, L; Faist, J. Doppler-free saturated-absorption spectroscopy of CO2 at 4.3 μm by means of a distributed feedback quantum cascade laser. Optics Letters 2006, 31, 3040–3042. [Google Scholar]
- Remillard, JT; Uy, D; Weber, WH; Capasso, F; Gmachl, C; Hutchinson, AL; Sivco, DL; Baillargeon, JN; Cho, AY. Sub-Doppler resolution limited Lamb-dip spectroscopy of NO with a quantum cascade distributed feedback laser. Opt. Express 2000, 7, 243–248. [Google Scholar]


| Important Parameters | ||
|---|---|---|
| Chirp (Sweep) Rate | α | |
| Relaxation Rate | γ | |
| Transition Dipole Moment | μ | |
| Electric Field Amplitude | E0 | |
| Normalized Sweep Rate | A = α/γ2 | |
| Saturation Parameter | Σ ∼ μE0/γ2 | |
| Criterion | Effect and Conditions | |
| A ≫ 1 | Rapid Passage (Swept Gain) | |
| • high chirp rate (α) | ||
| • slow relaxation (γ) (e.g., low pressure) | ||
| Σ ≫ 1 | Power Saturation (Optical Pumping) | |
| • strong optical transition (high μ) | ||
| • strong driving electromagnetic (EM) field (E0) | ||
| • slow relaxation (γ) (e.g., low pressure) | ||
| A/Σ ≪ 1 | Adiabatic Rapid Passage | |
| • rapid passage (frequency chirp) | ||
| • strong optical pumping | ||
| ⇒ long interaction time between EM field and transition | ||
| A/Σ ≫ 1 | Linear Rapid Passage | |
| • strong rapid passage (frequency chirp) | ||
| • optical pumping | ||
| ⇒ short interaction time between EM field and transition | ||
| Species | Spectral Range [cm−1] | Type of Plasma | Application1 | Pressue [mbar]2 | Type of QCL | Tuning Method | Method of Absorpt.3 | Time Resolution4 | Year | Ref. |
|---|---|---|---|---|---|---|---|---|---|---|
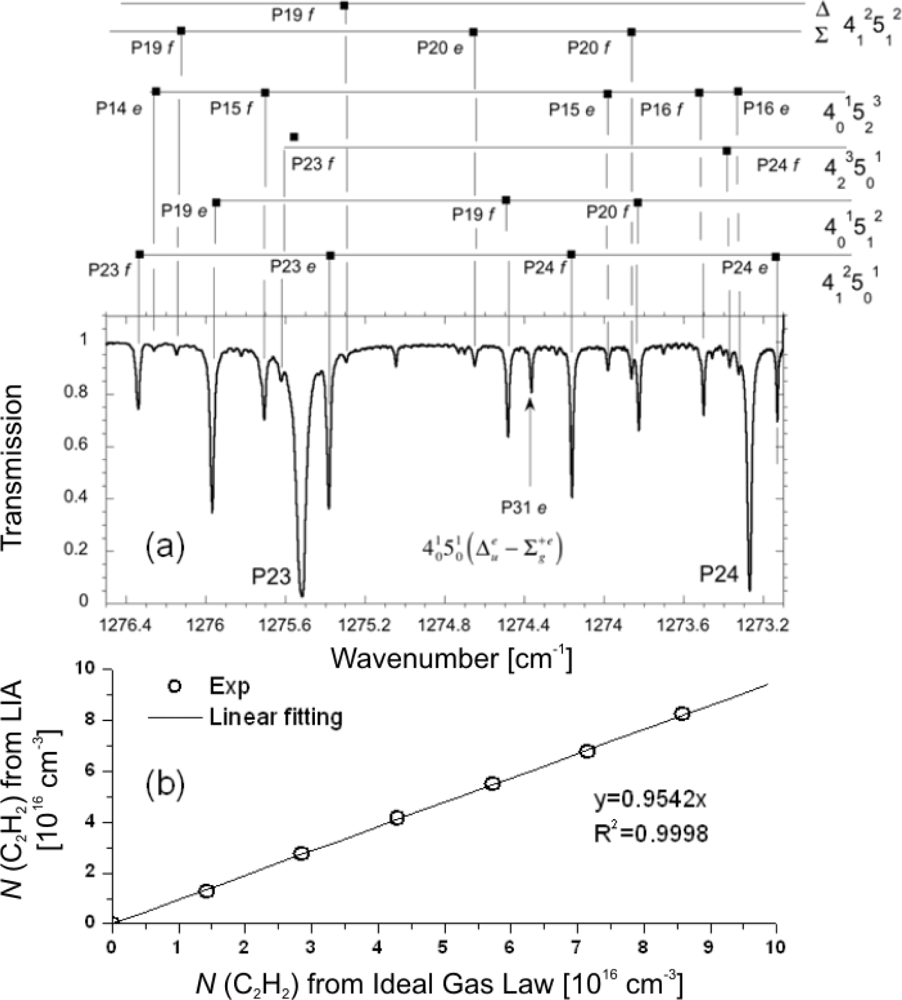
| CH4/C2H2 | ∼ 1275 | MW | Res. | > 50 (199.5) | pulsed | intra | DAS/SP | 1 s | 2006 2009 | [30] [56] |
| CH4 | 1253 | RF | Res. | 0.23 | pulsed | intra | DAS/SP | n.a. | 2008 | [55] |
| C2H2 | ∼ 1275 | Flame | Res. | 1013 | pulsed | intra | DAS/SP | n.a. | 2009 | [66] |
| NO | 1897 | DC | Res. | 2.7 | pulsed | intra | DAS/SP | 5 μs | 2007 | [31] |
| NO/NO2 | 1897 1613 | RF | Res. | 2.7 | pulsed pulsed | intra | DAS/SP | 200 μs | 2009 | [65] |
| CF4/C3F8 | 1271/1274 | RF | Res. | 0.1 | pulsed | intra | DAS/DP | 5 ms | 2009 | [58, 69, 70] |
| CF3 | 1253 | Photolysis | Res. | 2.6 ... 5.4 | pulsed | intra | DAS/SP | 5 μs | 2008 | [57] |
| SiF4 (NF3) | 1028 | RF | Ind. | 0.33 | pulsed | inter | DAS/DP | ∼ 1 s | 2007 2009 | [32] [64] |
| SiF4/C4F6 | 1028 973 | MW | Res. (Ind.) | 0.2 ... 0.3 | pulsed pulsed | inter | DAS/DP | 1 s | 2010 | [33] |
| BCl3 | 964 | MW (DC) | Ind. (Res.) | 2 | pulsed | inter | DAS/DP | 3 s | 2009 2010 | [63] [86] |
| SiH4 | 2244 | 5VHF | Res. (Ind.) | 3.5 ... 4.5 | cw | DAS/SP | n.a. | 2009 | [72] | |
| CH4 | 1303 | MW | Res. | 1.5 | cw | DAS/SP | 0.2 | 2010 | This work | |
| HCN | 1304 | MW | Res. | 1.5 | cw | CEAS | > 1 s | 2010 | This work | |
| NO | 1819 | MW | Res. | 1.5 | cw | CEAS | > 1 s | 2010 | This work |
© 2010 by the authors licensee MDPI, Basel, Switzerland. This article is an open access article distributed under the terms and conditions of the Creative Commons Attribution license (http://creativecommons.org/licenses/by/3.0/).
Share and Cite
Welzel, S.; Hempel, F.; Hübner, M.; Lang, N.; Davies, P.B.; Röpcke, J. Quantum Cascade Laser Absorption Spectroscopy as a Plasma Diagnostic Tool: An Overview. Sensors 2010, 10, 6861-6900. https://doi.org/10.3390/s100706861
Welzel S, Hempel F, Hübner M, Lang N, Davies PB, Röpcke J. Quantum Cascade Laser Absorption Spectroscopy as a Plasma Diagnostic Tool: An Overview. Sensors. 2010; 10(7):6861-6900. https://doi.org/10.3390/s100706861
Chicago/Turabian StyleWelzel, Stefan, Frank Hempel, Marko Hübner, Norbert Lang, Paul B. Davies, and Jürgen Röpcke. 2010. "Quantum Cascade Laser Absorption Spectroscopy as a Plasma Diagnostic Tool: An Overview" Sensors 10, no. 7: 6861-6900. https://doi.org/10.3390/s100706861