Evaluation of Performance and Uncertainty of Infrared Tympanic Thermometers


Abstract
:1. Introduction
2. Equipment and Methods
2.1. Infrared Tympanic Thermometer
2.2. Standard Temperature
2.3. Testing Procedures
2.4. Data Analysis
2.5. Establish the Calibration
3. Sources of the Uncertainty for Infrared Tympanic Thermometer
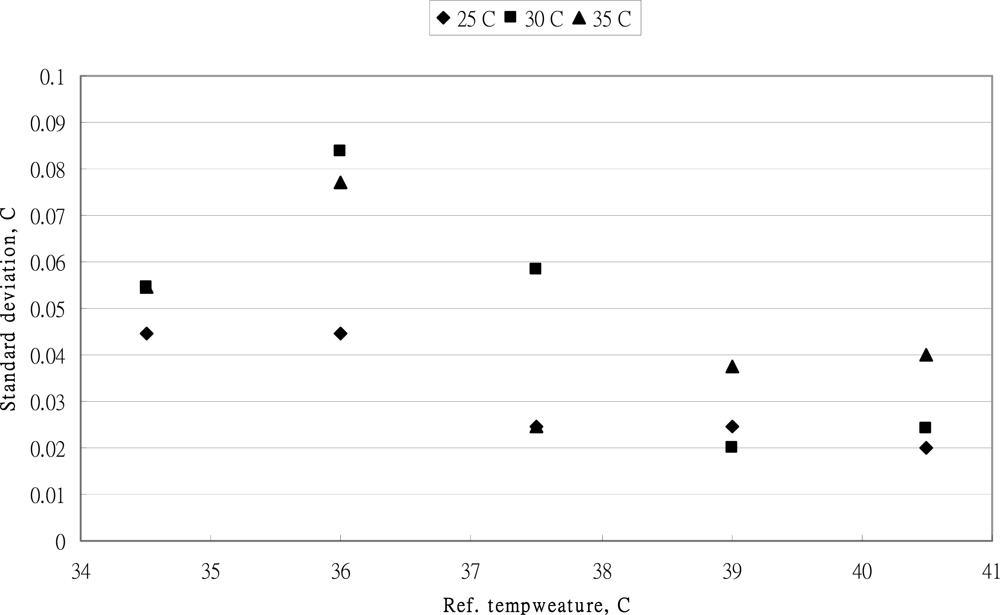
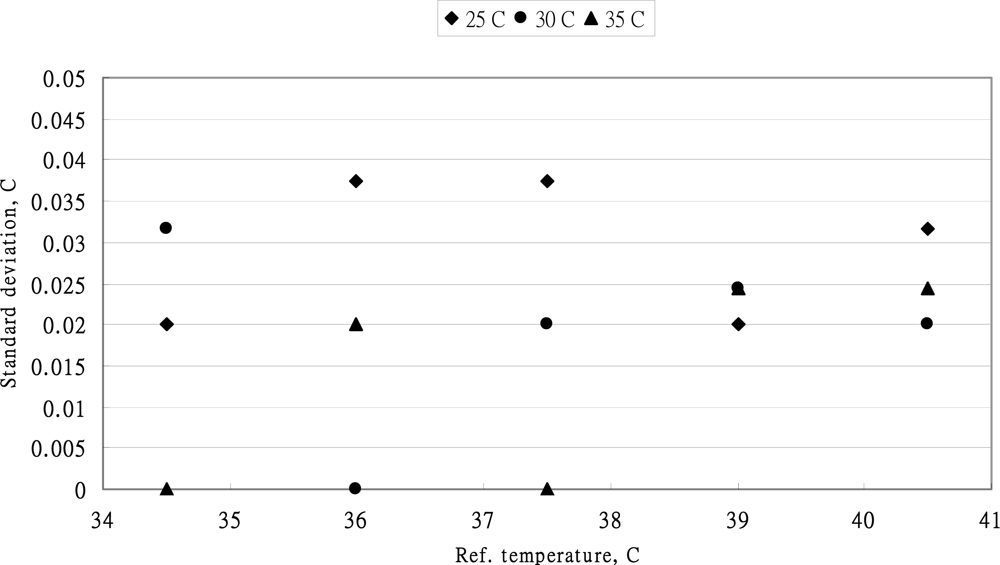
3.1. The Standard Deviation
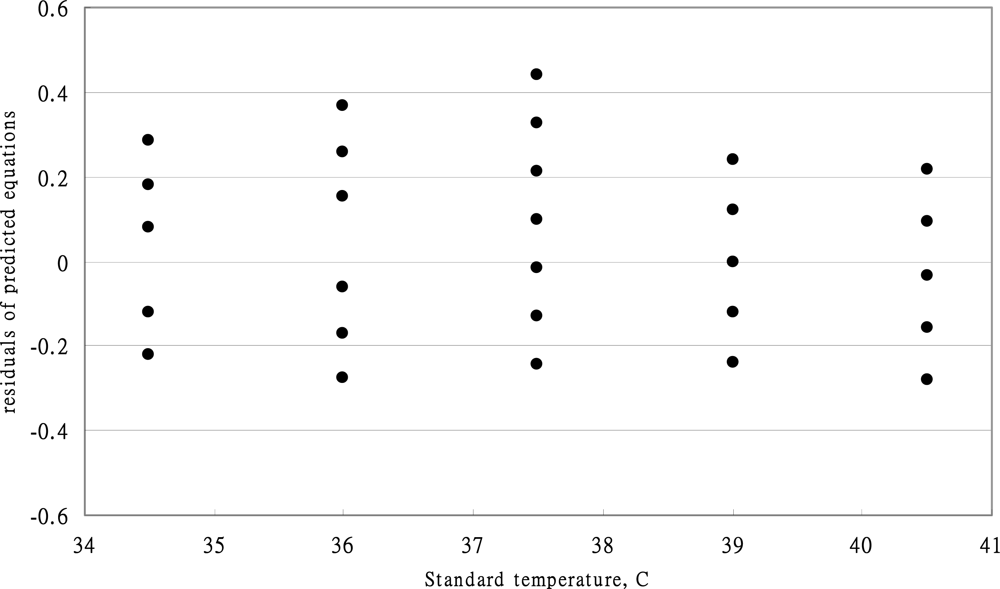
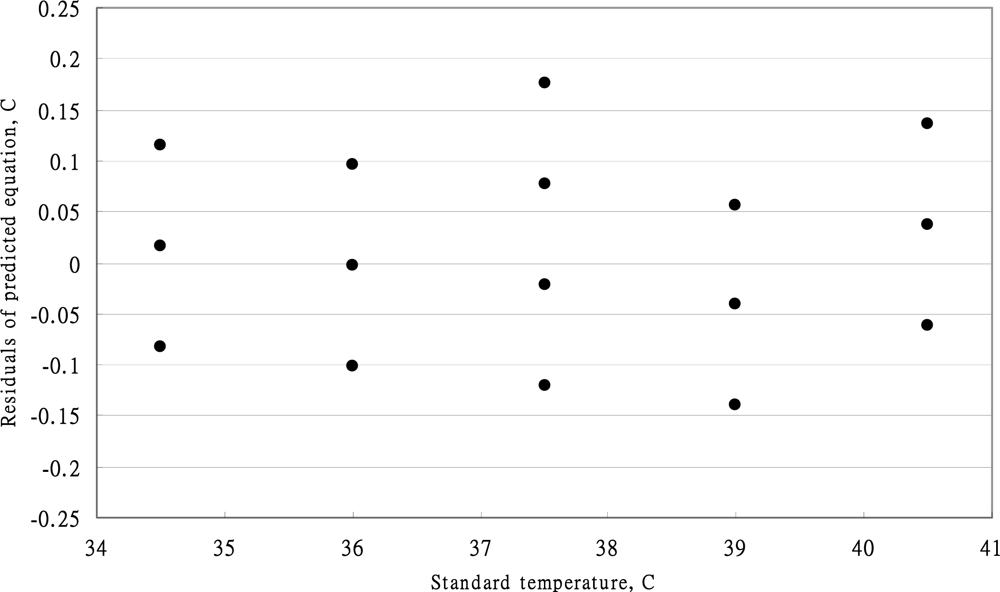
3.2. The Calibration Equation
3.3. Uncertainty of the Reference Temperature
3.4. Uncertainty Due to Nonlinearity and Repeatability
3.5. Uncertainty Due to Resolution
3.6. Uncertainty Due to Ambient Temperature Variation
- Uncertainty estimation of a fixed measuring point.
- Uncertainty estimation include the effect of calibration
4. Results and Discussions
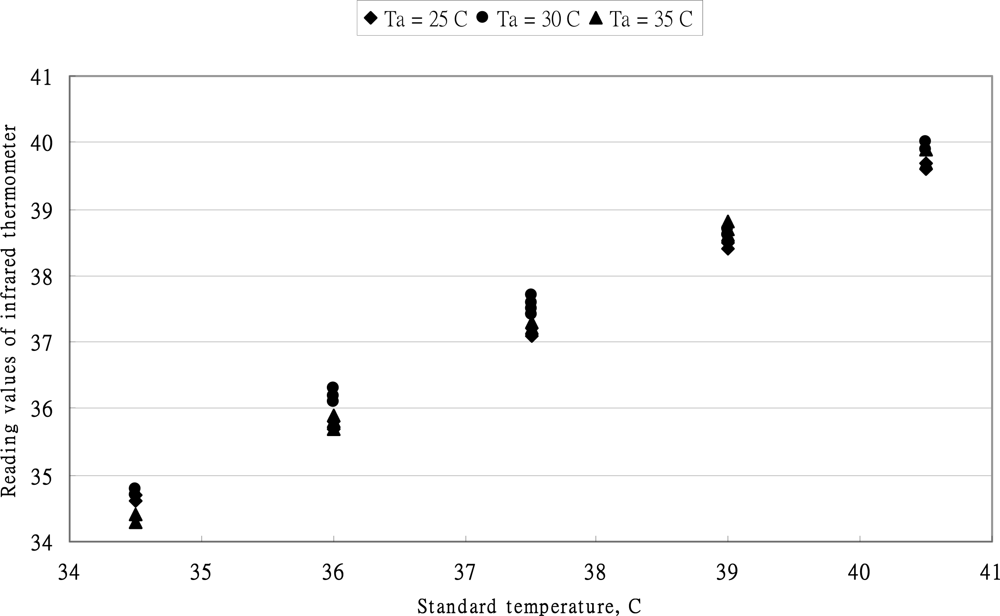
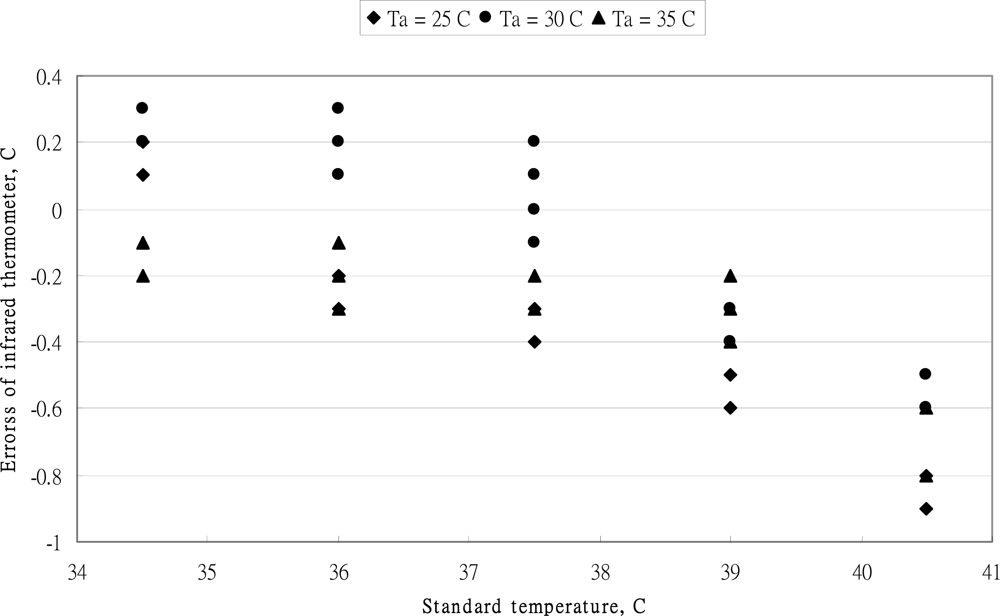
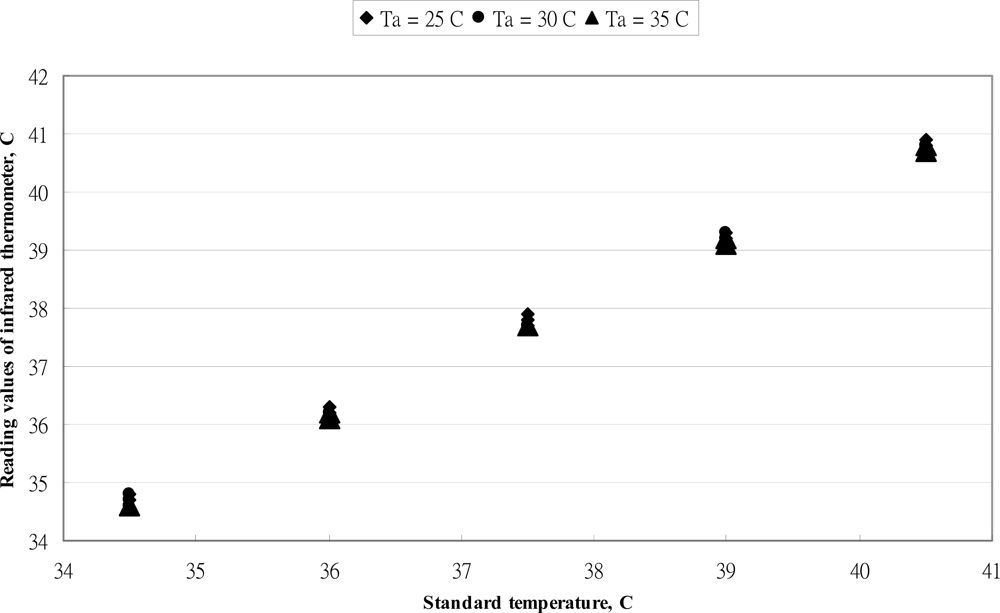
4.1. Performance of OMRON MC-510 Thermometer
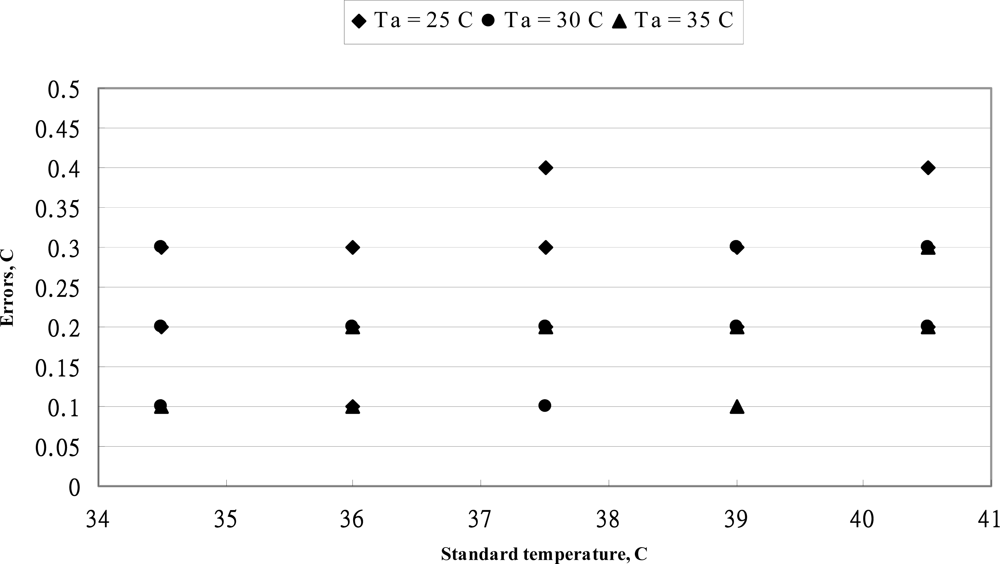
4.2. Performance of BRAUN IRT-3020 Thermometer
4.3. The Replicate of the Infrared Tympanic Thermometer
4.4. Calculation of the Uncertainty of Infrared Tympanic Thermometer
4.5. The Combined Standard Uncertainty
5. Conclusions
Acknowledgments
References
- McCarthy, P.W.; Heusch, A.I. The vagaries of ear temperature assessment. J. Med. Eng. Tech 2006, 30, 242–251. [Google Scholar]
- Cascetta, F. An evaluation of the performance of an infrared tympanic thermometer. Measurement 1995, 16, 239–246. [Google Scholar]
- Pusnik, I.; Simpson, R.; Drnovsek, J. Bilateral comparison of blackbody cavities for calibration of infrared ear thermometers between NPL and FE/LMK. Physiol. Meas 2004, 25, 1239–1247. [Google Scholar]
- Dodd, S.R.; Lancaster, G. A.; Craig, J.V. In a systematic review, infrared ear thermometry for fever diagnosis in children finds poor sensitivity. J. Clin. Epidemiol 2006, 59, 354–257. [Google Scholar]
- Craig, J.V.; Lancaster, G.A.; Taylor, S. Infrared ear thermometry compared with rectal thermometry in children: a systematic review. Lancet 2002, 360, 603–609. [Google Scholar]
- Kistemaker, J.A.; Den Hartog, E.A.; Daanen, H.A.M. Reliability of an infrared forehead skin thermometer for core temperature measurements. J. Med. Eng. Tech 2006, 30, 252–261. [Google Scholar]
- Kocoglu, H.; Goksu, S.; Isik, M. Infrared tympanic thermometer can accurately measure the body temperature in children in an emergency room setting. Int. J. Pediatr. Otorhinolaryngol 2002, 65, 39–43. [Google Scholar]
- Rosenthal, H.M.; Leslie, A. Measuring temperature of NICU patients – A comparison of three devices. J. Neonatal Nurs 2006, 12, 125–129. [Google Scholar]
- Stavem, K.; Saxholm, H.; Smith-Erichsen, N. Accuracy of infrared ear thermometry in adult patients. Intensive Care Med 1997, 23, 100–105. [Google Scholar]
- Heusch, A.I.; Suresh, V.; McCarthy, P.W. The effect of factors such as handedness, sex and age on body temperature measured by an infrared ‘tympanic’ thermometer. J. Med. Eng. Tech 2006, 30, 235–241. [Google Scholar]
- Pusnik, I.; Drnovsek, J. Infrared ear thermometers-parameters influencing their reading and accuracy. Physiol. Meas 2005, 26, 1057–1084. [Google Scholar]
- Pusnik, I.; van der Ham, E.; Drnovsek, J. IR ear thermometers: what do they measure and how do they comply with the EU technical regulation. Physiol. Meas 2004, 25, 699–708. [Google Scholar]
- Simpson, R.; Machin, G.; McEvoy, H. Traceability and calibration in temperature measurement: a clinical necessary. J. Med. Eng. Tech 2006, 30, 212–217. [Google Scholar]
- International Organization for Standardization. Guide to the Expression of Uncertainty in Measurement; ISO: Geneva, Switzerland, 1993. [Google Scholar]
- Eurachem. EURACHEM/CITAC Guide Quantifying Uncertainty in Analytical Measurement; Eurachem: Middlesex, UK, 2000. [Google Scholar]
- Mohamed, M.I.; Aggag, G.A. Uncertainty evaluation of shore hardness testers. Measurement 2003, 33, 251–257. [Google Scholar]
- Fisicano, P.; Adriaens, A.; Ferrara, E. Assessment of the uncertainty budget for the amperometric measurement of dissolved oxygen. Anal. Chim. Acta 2007, 597, 75–81. [Google Scholar]
- Chen, C. Evaluation of measurement uncertainty for thermometers with calibration equations. Accredit. Qual. Assur 2006, 11, 75–82. [Google Scholar]
- Lu, H.; Chen, C. Uncertainty evaluation of humidity sensors calibrated by saturated salt solutions. Measurement 2007, 40, 591–599. [Google Scholar]
- Nicholas, J.V.; White, D.R. Radiation Thermometry Traceable Temperature, 1st ed; Sudenham, P.H., Sussex, T.W., Eds.; John Willey and Sons: Chichester, West Sussex, UK, 1994; pp. 283–326. [Google Scholar]
- Myers, R.H. Classical and Modern Regression with Application, 2nd ed; PWS and Kent Publishing: Boston, MA, USA, 1996. [Google Scholar]
- Bruggemann, L.; Wennrich, R. Evaluation of measurement uncertainty for analytical procedures using a linear calibration function. Accredit. Qual. Assur 2002, 7, 269–273. [Google Scholar]
- Krutchkoff, R.G. Classical and inverse regression methods of calibration. Technometrics 1967, 9, 25–439. [Google Scholar]
- Grientschnig, D. Relationship between prediction errors of inverse and classical calibration. Fresenius J. Anal. Chem 2000, 367, 491–498. [Google Scholar]
- Tellinghuisen, J. Inverse vs. classical calibration for small data sets. Fresenius J. Anal. Chem 2000, 368, 585–588. [Google Scholar]
- Chen, C. Uncertainty evaluation of conductance moisture meters for rough rice. Biosys. Eng 2008, 99, 508–514. [Google Scholar]


| OMRON MC-510 | BRAUN IRT-3020 | |
|---|---|---|
| Sensing element | thermopile | thermopile |
| Measuring range | 34–42.2 °C | 34–42.2 °C |
| Resolution | 0.1 °C | 0.1 °C |
| Nonlinearity and repeatability | 1. 36.0–39 °C, ±0.2 °C 2. (≤36.0, ≥39 °C), ±0.3 °C | 1. 37.0–39 °C, ±0.1 °C 2. (≤37 °C, ≥39 °C), ±0.2 °C |
| Variance | SS | df | MS | F | P-value | F-critical value |
|---|---|---|---|---|---|---|
| Standard temp. | 0.003717 | 4 | 0.000929 | 5.9318 | 0.01614 | 3.8379 |
| Ambient temp | 0.000832 | 2 | 0.000416 | 2.6552 | 0.1305 | 4.4590 |
| Errors | 0.001253 | 8 | 0.000157 | |||
| Total | 0.005802 | 14 |
| Source | SS | df | MS | F | P-value | F-critical value |
|---|---|---|---|---|---|---|
| Standard temp. | 0.000133 | 4 | 3.321E-05 | 0.1926 | 0.9355 | 3.8379 |
| Ambient temp. | 0.000617 | 2 | 0.000309 | 1.7924 | 0.2274 | 4.4590 |
| Errors | 0.001377 | 8 | 0.000172 | |||
| Total | 0.002127 | 14 |
| Calibration equations | yobs of different temperatures | |||||
|---|---|---|---|---|---|---|
| 34.5 | 36.0 | 37.5 | 39.0 | 40.5 | ||
| OMRON | None | 0.1799 | 0.2193 | 0.1767 | 0.1408 | 0.1506 |
| MC-510 | Polynomial equation | 0.2026 | 0.1990 | 0.1986 | 0.1989 | 0.2100 |
| BRAUN | None | 0.0884 | 0.0535 | 0.0567 | 0.0594 | 0.05606 |
| IRT-300 | Linear equation | 0.0711 | 0.0704 | 0.0701 | 0.0703 | 0.0709 |
| Description | Estimate value | Standard uncertainty | Probability distribution |
|---|---|---|---|
| Reference (uref) | 0.03 °C | 0.0153 | Normal |
| Resolution (ures) | 0.1 °C | 0.0289 | Rectangular |
| Nonlinear and repeatability | |||
| Unon1 36–39 °C | 0.2 °C | 0.1155 | Rectangular |
| Unon2 ≤ 36 °C, ≥39 °C | 0.3 °C | 0.1732 |
| Description | Estimate value | Standard uncertainty | Probability distribution |
|---|---|---|---|
| Reference (uref) | 0.03 °C | 0.0153 | Normal |
| Resolution (ures) | 0.1 °C | 0.0289 | Rectangular |
| Nonlinear and repeatability | Rectangular | ||
| Unon1 37–39 °C | 0.1 °C | 0.0577 | |
| Unon2 ≤ 37 °C, ≥39 °C | 0.2 °C | 0.1155 |
| IR thermometer | Calibration equation | yobs of different temperature | ||||
|---|---|---|---|---|---|---|
| 34.5 | 36.0 | 37.5 | 39.0 | 40.5 | ||
| OMRON | None | 0.2 | 0.2 | 0.2 | 0.1 | 0.23 |
| MC-510 | Polynomial equation | 519 | 499 | 136 | 851 | 18 |
| 0.2 | 0.2 | 0.2 | 0.2 | 0.27 | ||
| BRAUN | None | 685 | 324 | 321 | 246 | 41 |
| IRT-300 | Linear equation | |||||
| 0.1 | 0.0 | 0.0 | 0.0 | 0.13 | ||
| 491 | 873 | 872 | 890 | 24 | ||
| 0.1 | 0.0 | 0.0 | 0.0 | 0.13 | ||
| 395 | 965 | 965 | 967 | 94 | ||
© 2010 by the authors; licensee Molecular Diversity Preservation International, Basel, Switzerland. This article is an open-access article distributed under the terms and conditions of the Creative Commons Attribution license ( http://creativecommons.org/licenses/by/3.0/).
Share and Cite
Chung, W.; Chen, C. Evaluation of Performance and Uncertainty of Infrared Tympanic Thermometers. Sensors 2010, 10, 3073-3089. https://doi.org/10.3390/s100403073
Chung W, Chen C. Evaluation of Performance and Uncertainty of Infrared Tympanic Thermometers. Sensors. 2010; 10(4):3073-3089. https://doi.org/10.3390/s100403073
Chicago/Turabian StyleChung, Wenbin, and Chiachung Chen. 2010. "Evaluation of Performance and Uncertainty of Infrared Tympanic Thermometers" Sensors 10, no. 4: 3073-3089. https://doi.org/10.3390/s100403073