Development of an Indoor Location Based Service Test Bed and Geographic Information System with a Wireless Sensor Network

Abstract
:1. Introduction
2. Indoor Positioning Algorithms
2.1. The Nearest Neighbor Algorithm
2.2. The K Weighted Nearest Neighbors Algorithm
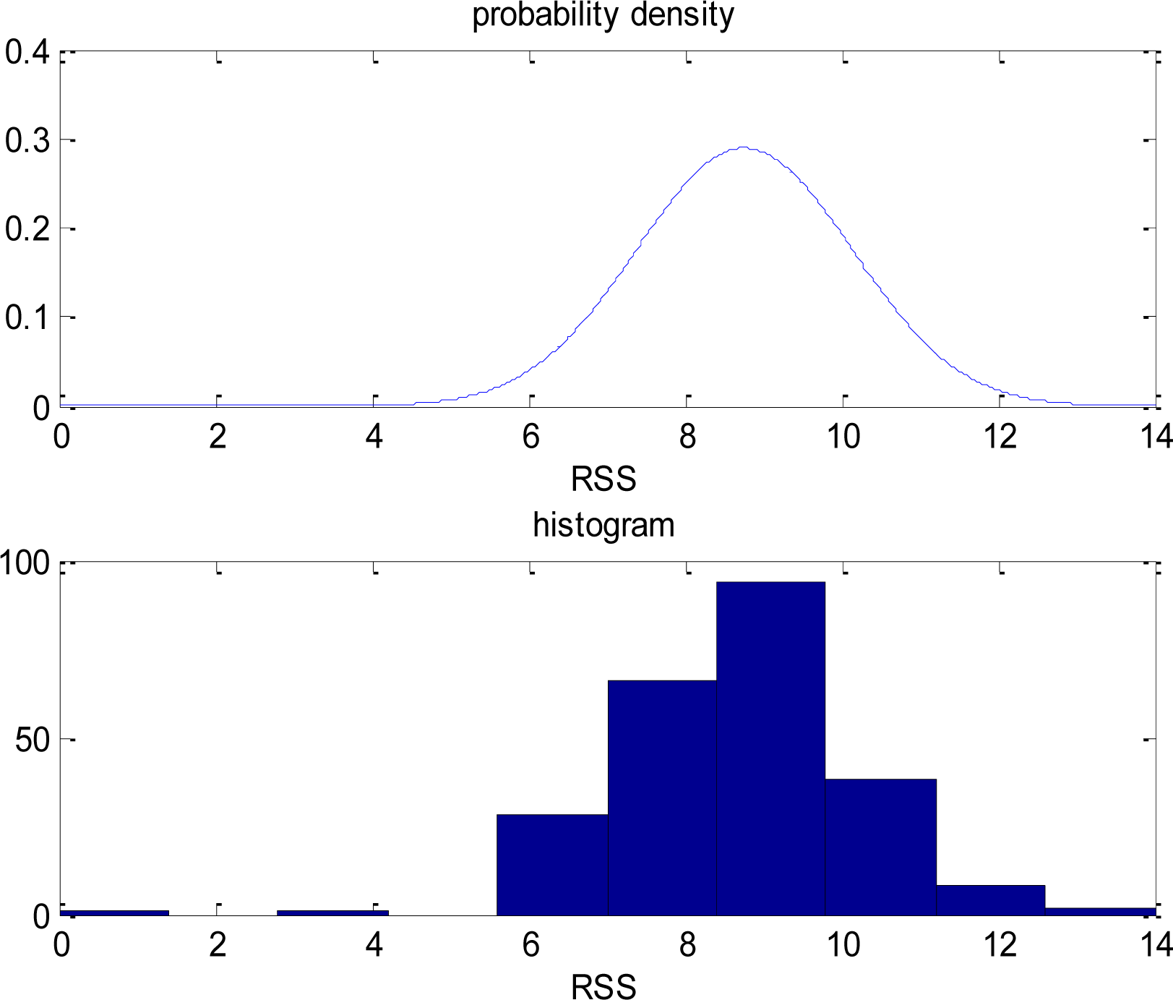
2.3. The Probabilistic Approach
2.4. The Particle Filter
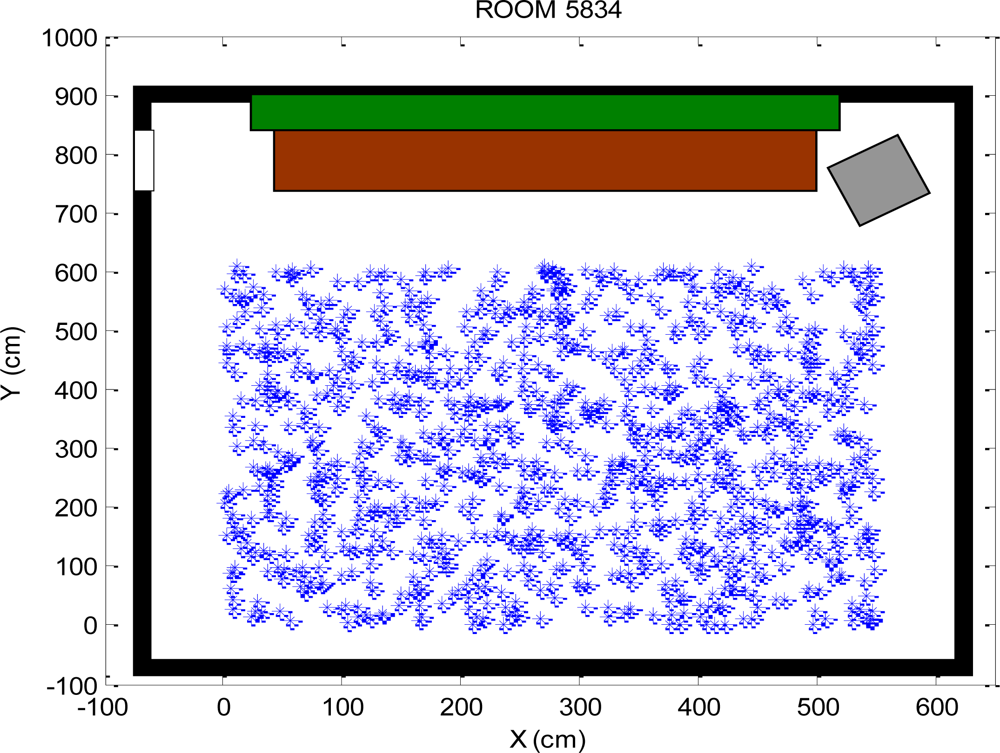
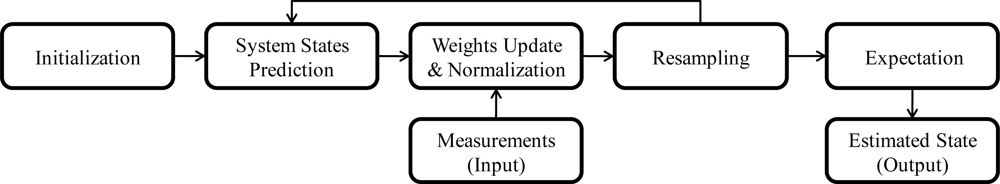
- Step 1: In the initial stage, N random sampling points (particles) is generated at the initial time as , and each particle is associated with the same weight. This paper generates 1000 particles with the equal weights uniformly distributed in the map, as shown in Figure 5.
- Step 2: The evolution of the system states by drawing the from , if the system model can be expressed as Xk = f (Xk−1, vk−1), then . To simplify the estimation, the evolution of the system states through the system model is illustrated as Equation (12).where x and y are the horizontal and vertical position coordinates, respectively, Vx and Vy are the associated velocities, ax and ay are the associated accelerations, and Δt is the time step.
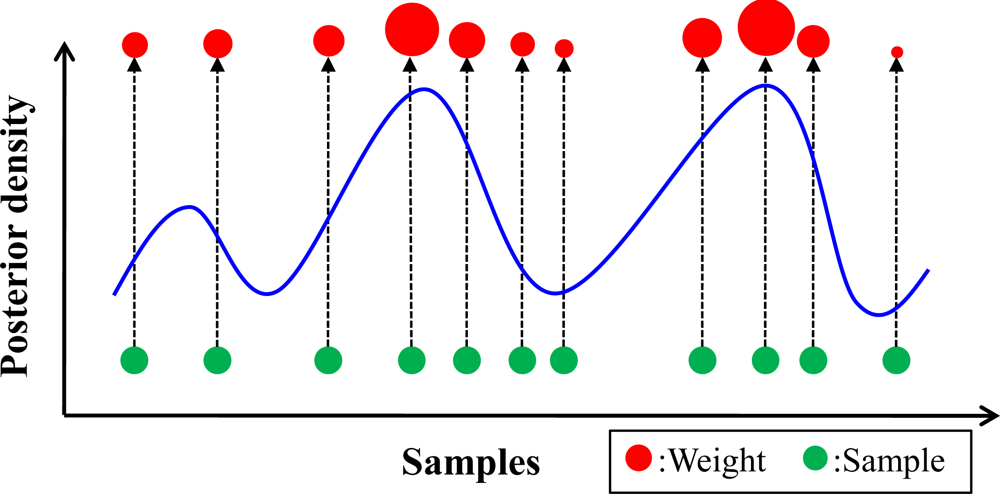
- Step 3: Implement the process of weight update by Equation (11) when the current measurements are available, and assume that the distribution of the likelihood function is a Gaussian distribution. The is 1/N at each time step. Then the weight update is calculated by Equation (13):where the xk,KWNN and yk,KWNN are the positions computed by the KWNN algorithm, and σ is the standard deviation of the positioning error of the KWNN algorithm. The weight is normalized by Equation (14):
- Step 4: To avoid the degeneracy, the resampling process is applied by generating a new set of with probability of .
- Step 5: The states estimation at time k is the expectation value of the regenerated particles in Step 4 (i.e., ).
3. Geographic Information System
4. Experiment Results and Analyses
5. Conclusions
References
- Rao, B.; Minakakis, L. Evolution of mobile location-based services. J. Commun. ACM 2003, 46, 61–65. [Google Scholar]
- van Lammeren, R.; Goossen, M.; Roncken, P. Sensing landscape history with an interactive location based service. Sensors 2009, 9, 7217–7233. [Google Scholar]
- Lloret, J.; Tomas, J.; Garcia, M.; Canovas, A. A hybrid stochastic approach for self-location of wireless sensors in indoor environments. Sensors 2009, 9, 3695–3712. [Google Scholar]
- Ni, L.M.; Liu, Y.; Lau, Y.C.; Patil, A.P. Landmarc: Indoor location sensing using active RFID. Wirel. Netw 2004, 10, 701–710. [Google Scholar]
- Tan, K.M.; Law, C.L. GPS and UWB integration for indoor positioning. Proceedings of the 6th International Conference on Information, Communications and Signal Processing, Singapore, December 10–13, 2007; pp. 1–5.
- Goldsmith, A. Wireless Communications; Cambridge University Press: Cambridge, UK, 2005. [Google Scholar]
- Cubic, I.; Begusic, D.; Mandic, T. Client based wireless LAN indoor positioning. Proceedings of IEEE 8th International Conference on Telecommunications, Zagreb, Croatia, June 15–17, 2005; pp. 335–339.
- LeMaster, E.A.; Rock, S.M. A local-area GPS pseudolite-based navigation system for mars rovers. J. Auton. Robots 2003, 14, 209–224. [Google Scholar]
- Qiu, D.; Lorenzo, D.D.; Lo, S.; Boneh, D.; Enge, P. Physical pseudo random function in radio frequency sources for security. Proceeding of ION ITM 2009, Anaheim, CA, USA, January 26–28, 2009; pp. 84–92.
- Wang, H.; Lenz, H.; Szabo, A.; Bamberger, J.; Hanebeck, U.D. WLAN-based pedestrian tracking using particle filters and low-cost MEMS sensors. Proceedings of 4th Workshop on Positioning, Navigation and Communication, Leibniz University of Hannover, Germany, March 22, 2007; pp. 1–7.
- Roos, T.; Myllymäki, P.; Tirri, H.; Misikangas, P.; Sievänen, J. A probabilistic approach to WLAN user location estimation. Int. J. Wireless Inf. Networks 2002, 9, 155–164. [Google Scholar]
- Li, B.; Wang, Y.; Lee, H.K.; Dempster, A.; Rizos, C. Method for yielding a database of location fingerprints in WLAN. IEE Proc.-Commun 2005, 152, 580–586. [Google Scholar]
- Arulampalam, M.S.; Maskell, S.; Gordon, N.; Clapp, T. A tutorial on particle filters for online nonlinear/non-gaussian bayesian tracking. IEEE Trans. Signal Process 2002, 50, 174–188. [Google Scholar]
- Carey, R.; Bell, G. The Annotated VRML 2.0 Reference Manual; Addison-Wesley Professional: Toronto, ON, Canada, 1997. [Google Scholar]
- Bahl, P.; Padmanabhan, V.N. RADAR: An in-building RF-based user location and tracking system. Proceedings of IEEE INFOCOM 2000, Tel-Aviv, Israel, March 26–30, 2000; pp. 775–784.
- Ristic, B.; Arulampalam, S.; Gordon, N. Beyond the Kalman Filter: Particle Filters for Tracking Applications; Artech House: Boston, MA, USA, 2004. [Google Scholar]
- Widyawan, M.K.; Pesch, D. Influence of predicted and measured fingerprint on the accuracy of RSSI-based indoor location systems. Proceedings of 4th Workshop on Positioning, Navigation and Communication, Leibniz University of Hannover, Germany, March 22, 2007; pp. 145–151.


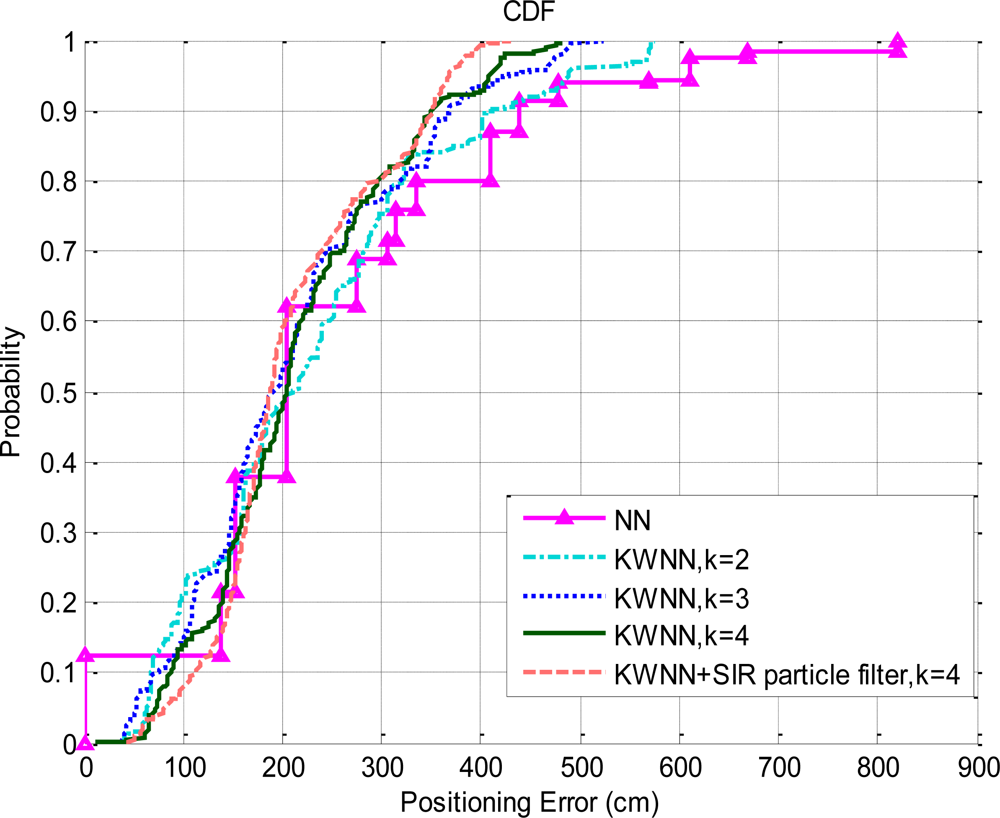
| K | 1 | 2 | 3 | 4 |
|---|---|---|---|---|
| Algorithm | ||||
| KWNN (cm) | 99.86 | 51.44 | 38.36 | 58.33 |
| KWNN + SIR particle filter (cm) | 24.22 | 33.30 | 22.69 | 26.53 |
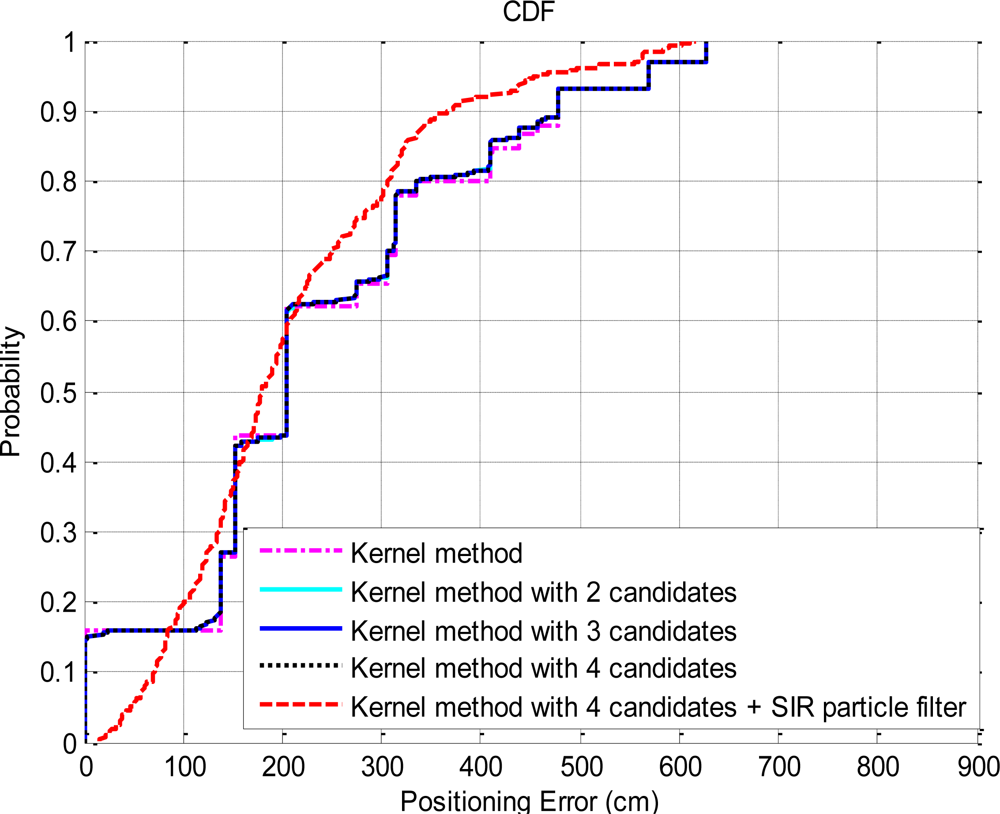
| Candidate | 1 | 2 | 3 | 4 |
|---|---|---|---|---|
| Algorithm | ||||
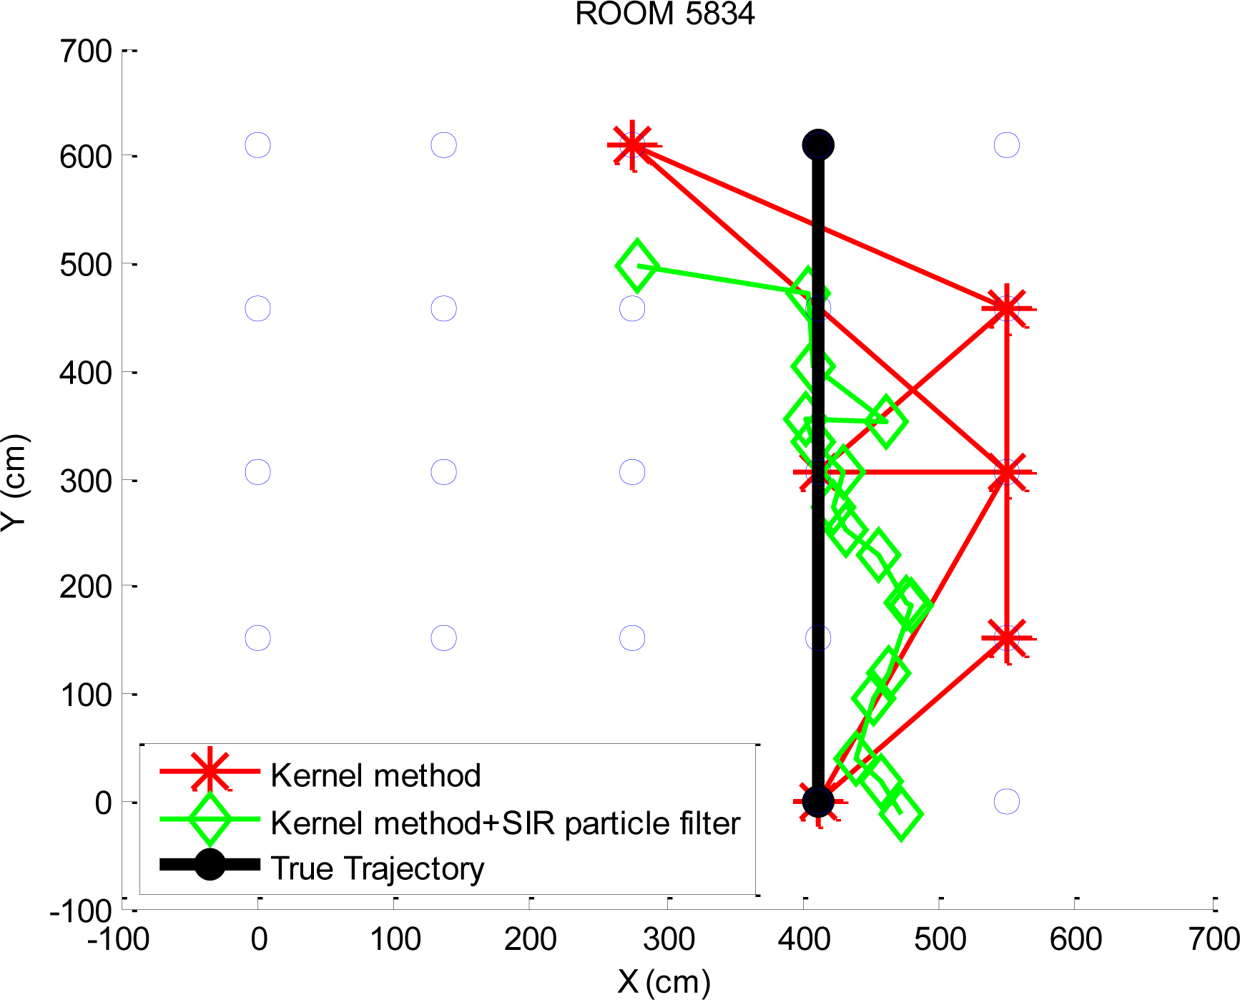
| Kernel method (cm) | 64.46 | 63.97 | 63.89 | 63.89 |
| Kernel method + SIR particle filter (cm) | 32.89 | 32.18 | 33.99 | 29.68 |
© 2010 by the authors; licensee Molecular Diversity Preservation International, Basel, Switzerland. This article is an open-access article distributed under the terms and conditions of the Creative Commons Attribution license ( http://creativecommons.org/licenses/by/3.0/).
Share and Cite
Jan, S.-S.; Hsu, L.-T.; Tsai, W.-M. Development of an Indoor Location Based Service Test Bed and Geographic Information System with a Wireless Sensor Network. Sensors 2010, 10, 2957-2974. https://doi.org/10.3390/s100402957
Jan S-S, Hsu L-T, Tsai W-M. Development of an Indoor Location Based Service Test Bed and Geographic Information System with a Wireless Sensor Network. Sensors. 2010; 10(4):2957-2974. https://doi.org/10.3390/s100402957
Chicago/Turabian StyleJan, Shau-Shiun, Li-Ta Hsu, and Wen-Ming Tsai. 2010. "Development of an Indoor Location Based Service Test Bed and Geographic Information System with a Wireless Sensor Network" Sensors 10, no. 4: 2957-2974. https://doi.org/10.3390/s100402957