Land and Forest Degradation inside Protected Areas in Latin America

Abstract
:1. Introduction
2. Methods

| Country | Number of protected areas |
|---|---|
| Argentina | 166 |
| Belize | 43 |
| Bolivia | 74 |
| Brazil | 563 |
| Chile | 68 |
| Colombia | 38 |
| Costa Rica | 15 |
| Ecuador | 25 |
| El Salvador | 29 |
| French Guiana | 10 |
| Guatemala | 99 |
| Guyana | 1 |
| Honduras | 74 |
| Mexico | 341 |
| Nicaragua | 39 |
| Paraguay | 27 |
| Peru | 56 |
| Suriname | 12 |
| Venezuela | 108 |
| Total | 1788 |
3. Results and Discussion
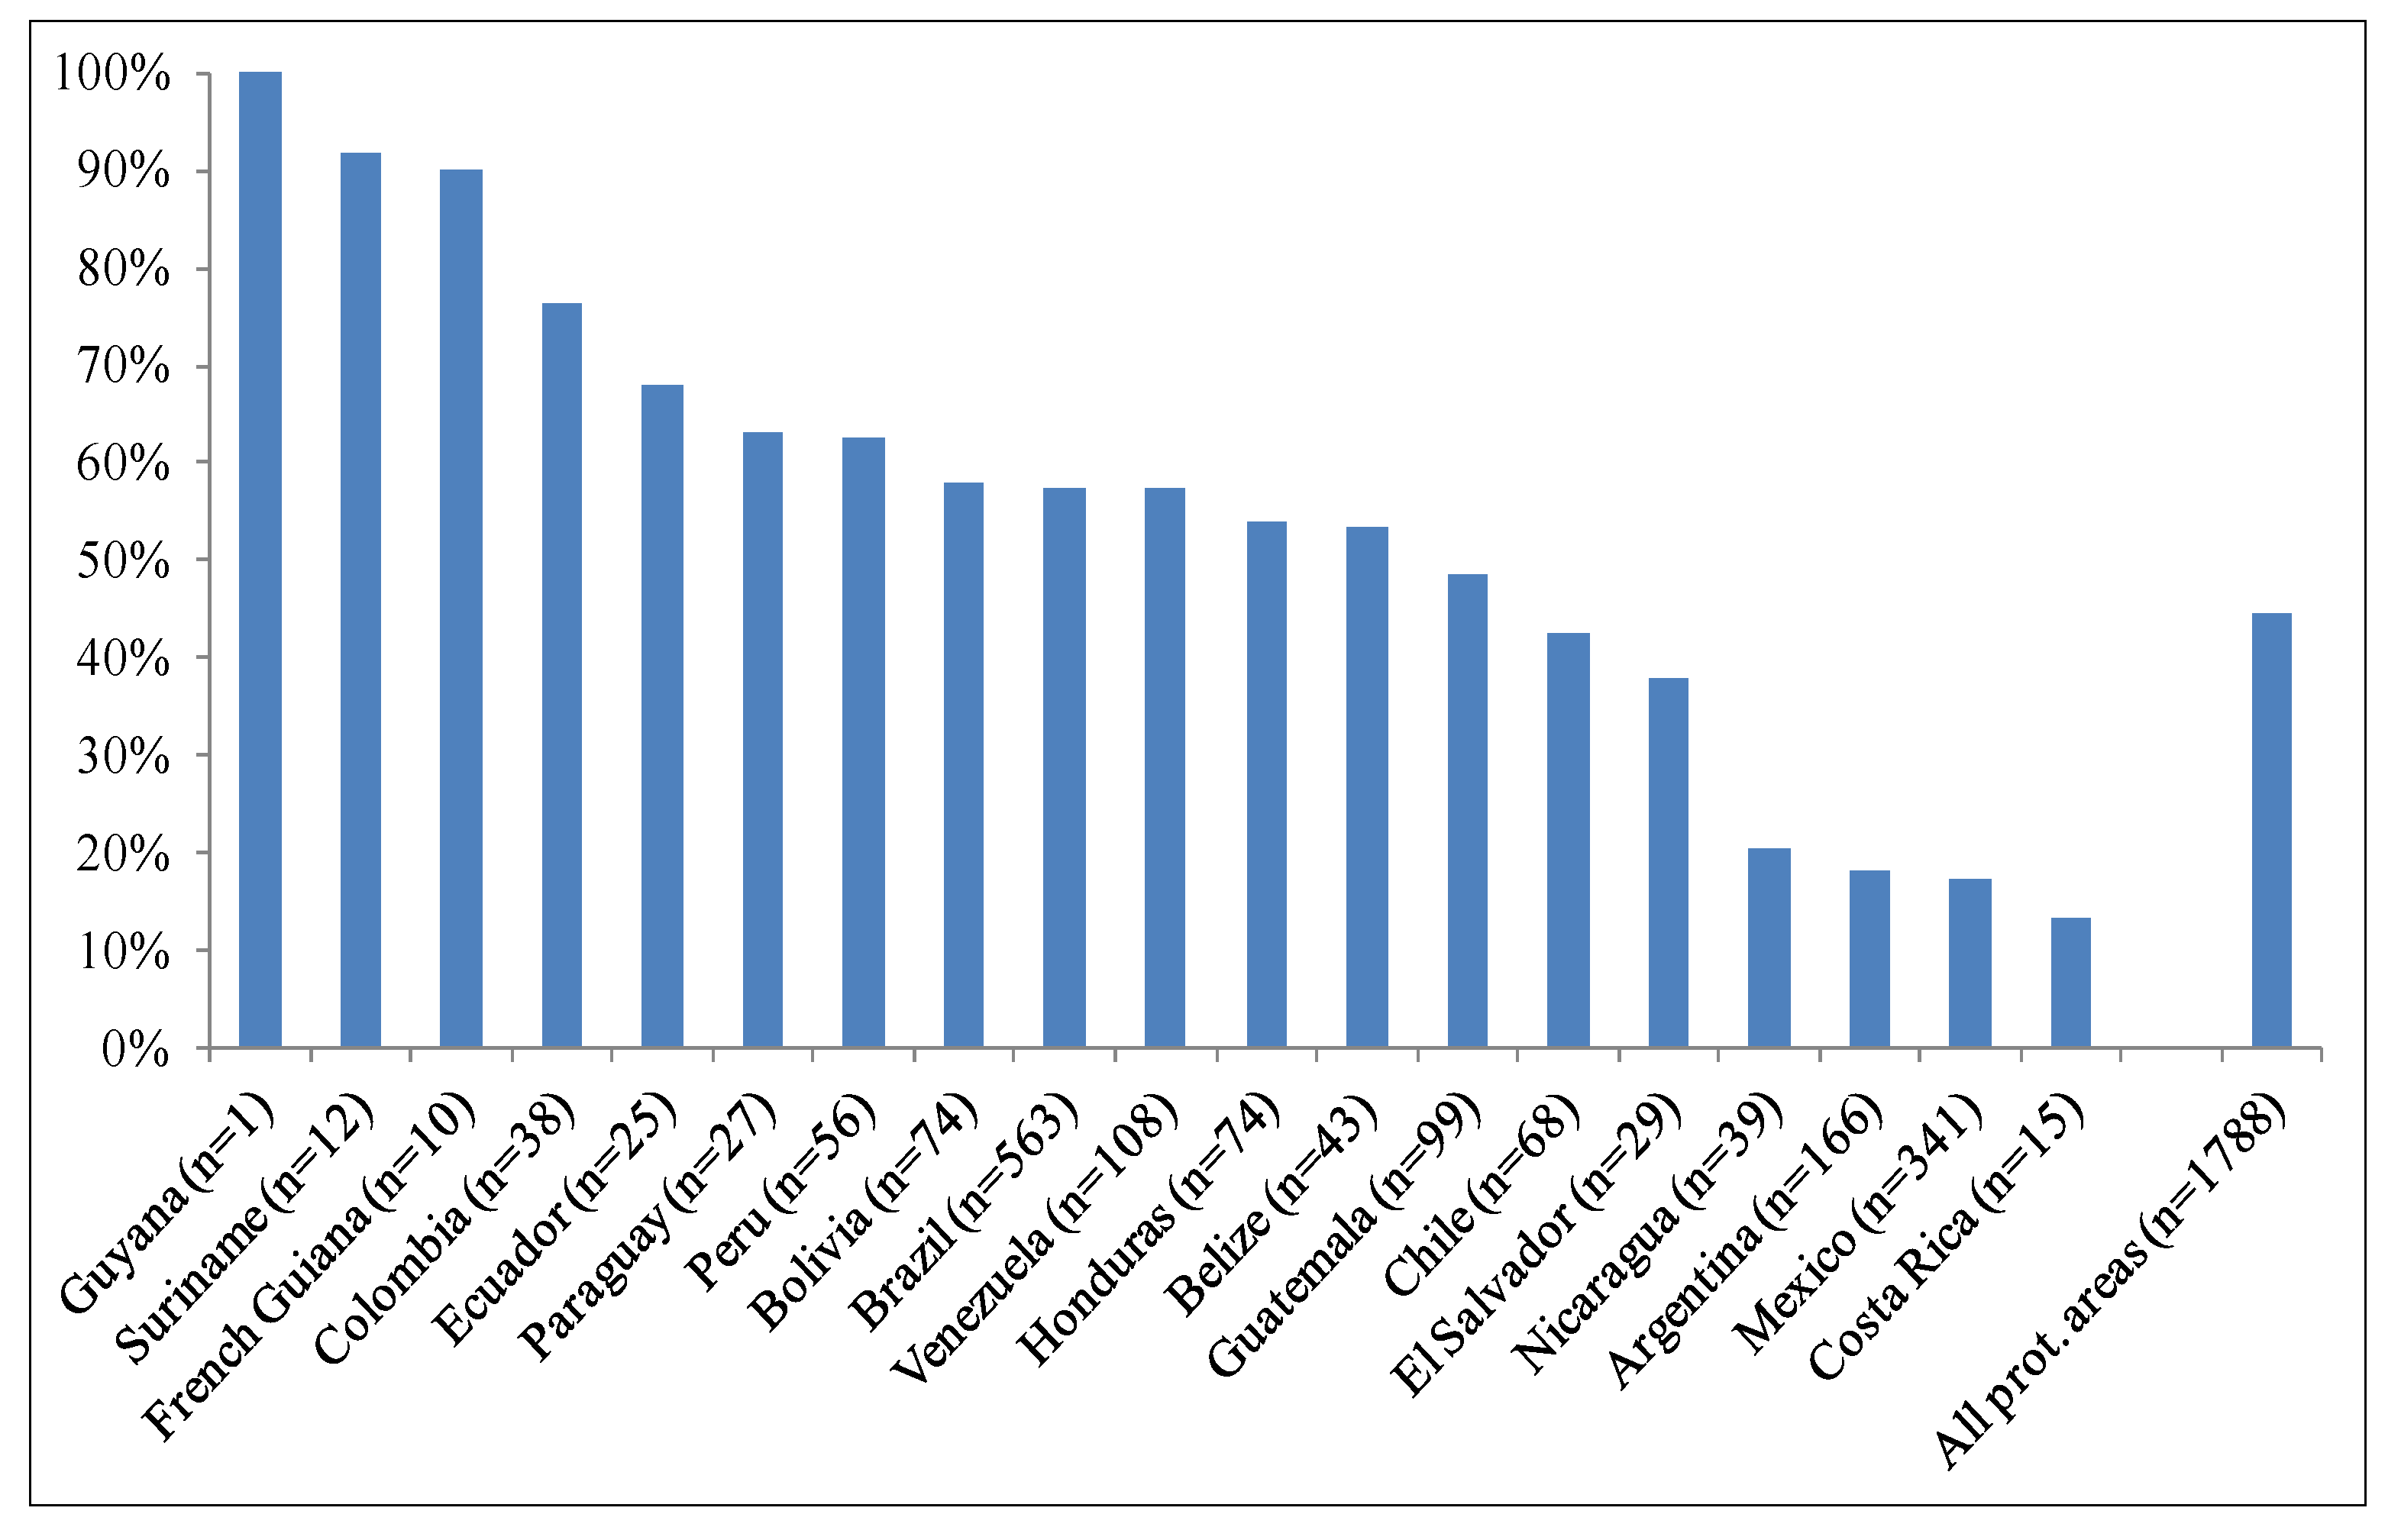
3.1. Differences by Country
| Country | Number of protected areas | Mean annual change in % | Mean annual change in hectares | ||
|---|---|---|---|---|---|
| French Guiana | 10 | 0.231 | (0.465) | 51 | (54) |
| Guatemala | 99 | 0.206 | (0.390) | 228 | (1003) |
| Paraguay | 27 | 0.183 | (0.391) | 71 | (285) |
| El Salvador | 29 | 0.132 | (0.288) | 3 | (8) |
| Brazil | 563 | 0.127 | (0.353) | 156 | (717) |
| Bolivia | 74 | 0.104 | (0.214) | 443 | (1010) |
| Colombia | 38 | 0.086 | (0.118) | 214 | (357) |
| Ecuador | 25 | 0.076 | (0.132) | 82 | (202) |
| Honduras | 74 | 0.067 | (0.163) | 72 | (289) |
| Belize | 43 | 0.054 | (0.101) | 9 | (21) |
| Suriname | 12 | 0.046 | (0.099) | 17 | (23) |
| Argentina | 166 | 0.044 | (0.184) | 13 | (110) |
| Chile | 68 | 0.039 | (0.095) | 15 | (34) |
| Venezuela | 108 | 0.028 | (0.072) | 107 | (325) |
| Costa Rica | 15 | 0.016 | (0.043) | 1 | (5) |
| Guyana | 1 | 0.015 | (n/a) | 69 | (n/a) |
| Peru | 56 | 0.014 | (0.023) | 79 | (297) |
| Nicaragua | 39 | 0.013 | (0.041) | 5 | (23) |
| Mexico | 341 | 0.013 | (0.071) | 4 | (22) |
| All protected areas | 1788 | 0.080 | (0.253) | 102 | (536) |

| Dependent variable: Mean land and forest degradation in % | Coefficient | Std. Error | p value |
|---|---|---|---|
| GDP per capita (2004) | −2.39 × 10⁻⁶ | 1.64 × 10⁻⁵ | 0.884 |
| Average GDP growth (2004–2009) | −7.69 × 10⁻³ | 2.04 × 10⁻² | 0.706 |
| Average rural population density (2004–2009) | 0.0026 | 0.0018 | 0.158 |
| Funding per hectare (2007–2008) | −0.034 * | 0.015 | 0.023 |
| Constant | −0.027 | 0.18 | 0.817 |
3.2. Differences by Protected Area
3.2.1. Major Habitat Type
| Major habitat type | Number of protected areas | Mean annual change in % | Mean annual change in hectares | ||
|---|---|---|---|---|---|
| Flooded grasslands and savannas | 15 | 0.146 | (0.296) | 367 | (1208) |
| Tropical and subtropical moist broadleaf forests | 971 | 0.113 | (0.312) | 167 | (698) |
| Tropical and subtropical grasslands, savannas and shrublands | 149 | 0.108 | (0.270) | 61 | (219) |
| Temperate broadleaf and mixed forests | 62 | 0.043 | (0.099) | 15 | (33) |
| Mangroves | 19 | 0.030 | (0.098) | 2 | (6) |
| Tropical and subtropical dry broadleaf forests | 203 | 0.029 | (0.098) | 13 | (79) |
| Deserts and xeric shrublands | 164 | 0.019 | (0.085) | 6 | (31) |
| Temperate grasslands, savannas and shrublands | 57 | 0.016 | (0.098) | 3 | (15) |
| Montane grasslands and shrublands | 51 | 0.015 | (0.083) | 22 | (138) |
| Tropical and subtropical coniferous forests | 77 | 0.011 | (0.057) | 0 | (2) |
| Mediterranean forests, woodlands and scrub | 19 | 0 | (0) | 0 | (0) |
| Indeterminate habitat type | 1 | n/a | n/a | ||
| All protected areas | 1788 | 0.080 | (0.253) | 102 | (536) |
3.2.2. Management Categories
| IUCN management category | Number of protected areas | Mean annual change in % | Mean annual change in hectares | ||
|---|---|---|---|---|---|
| Category VI | 363 | 0.125 | (0.286) | 179 | (681) |
| Category III | 60 | 0.091 | (0.263) | 84 | (311) |
| Category I | 148 | 0.084 | (0.249) | 174 | (692) |
| Category V | 83 | 0.075 | (0.217) | 31 | (143) |
| Category II | 403 | 0.074 | (0.260) | 86 | (301) |
| Category IV | 169 | 0.052 | (0.180) | 43 | (365) |
| No specified category | 562 | n/a | n/a | ||
| All protected areas | 1788 | 0.080 | (0.253) | 102 | (536) |
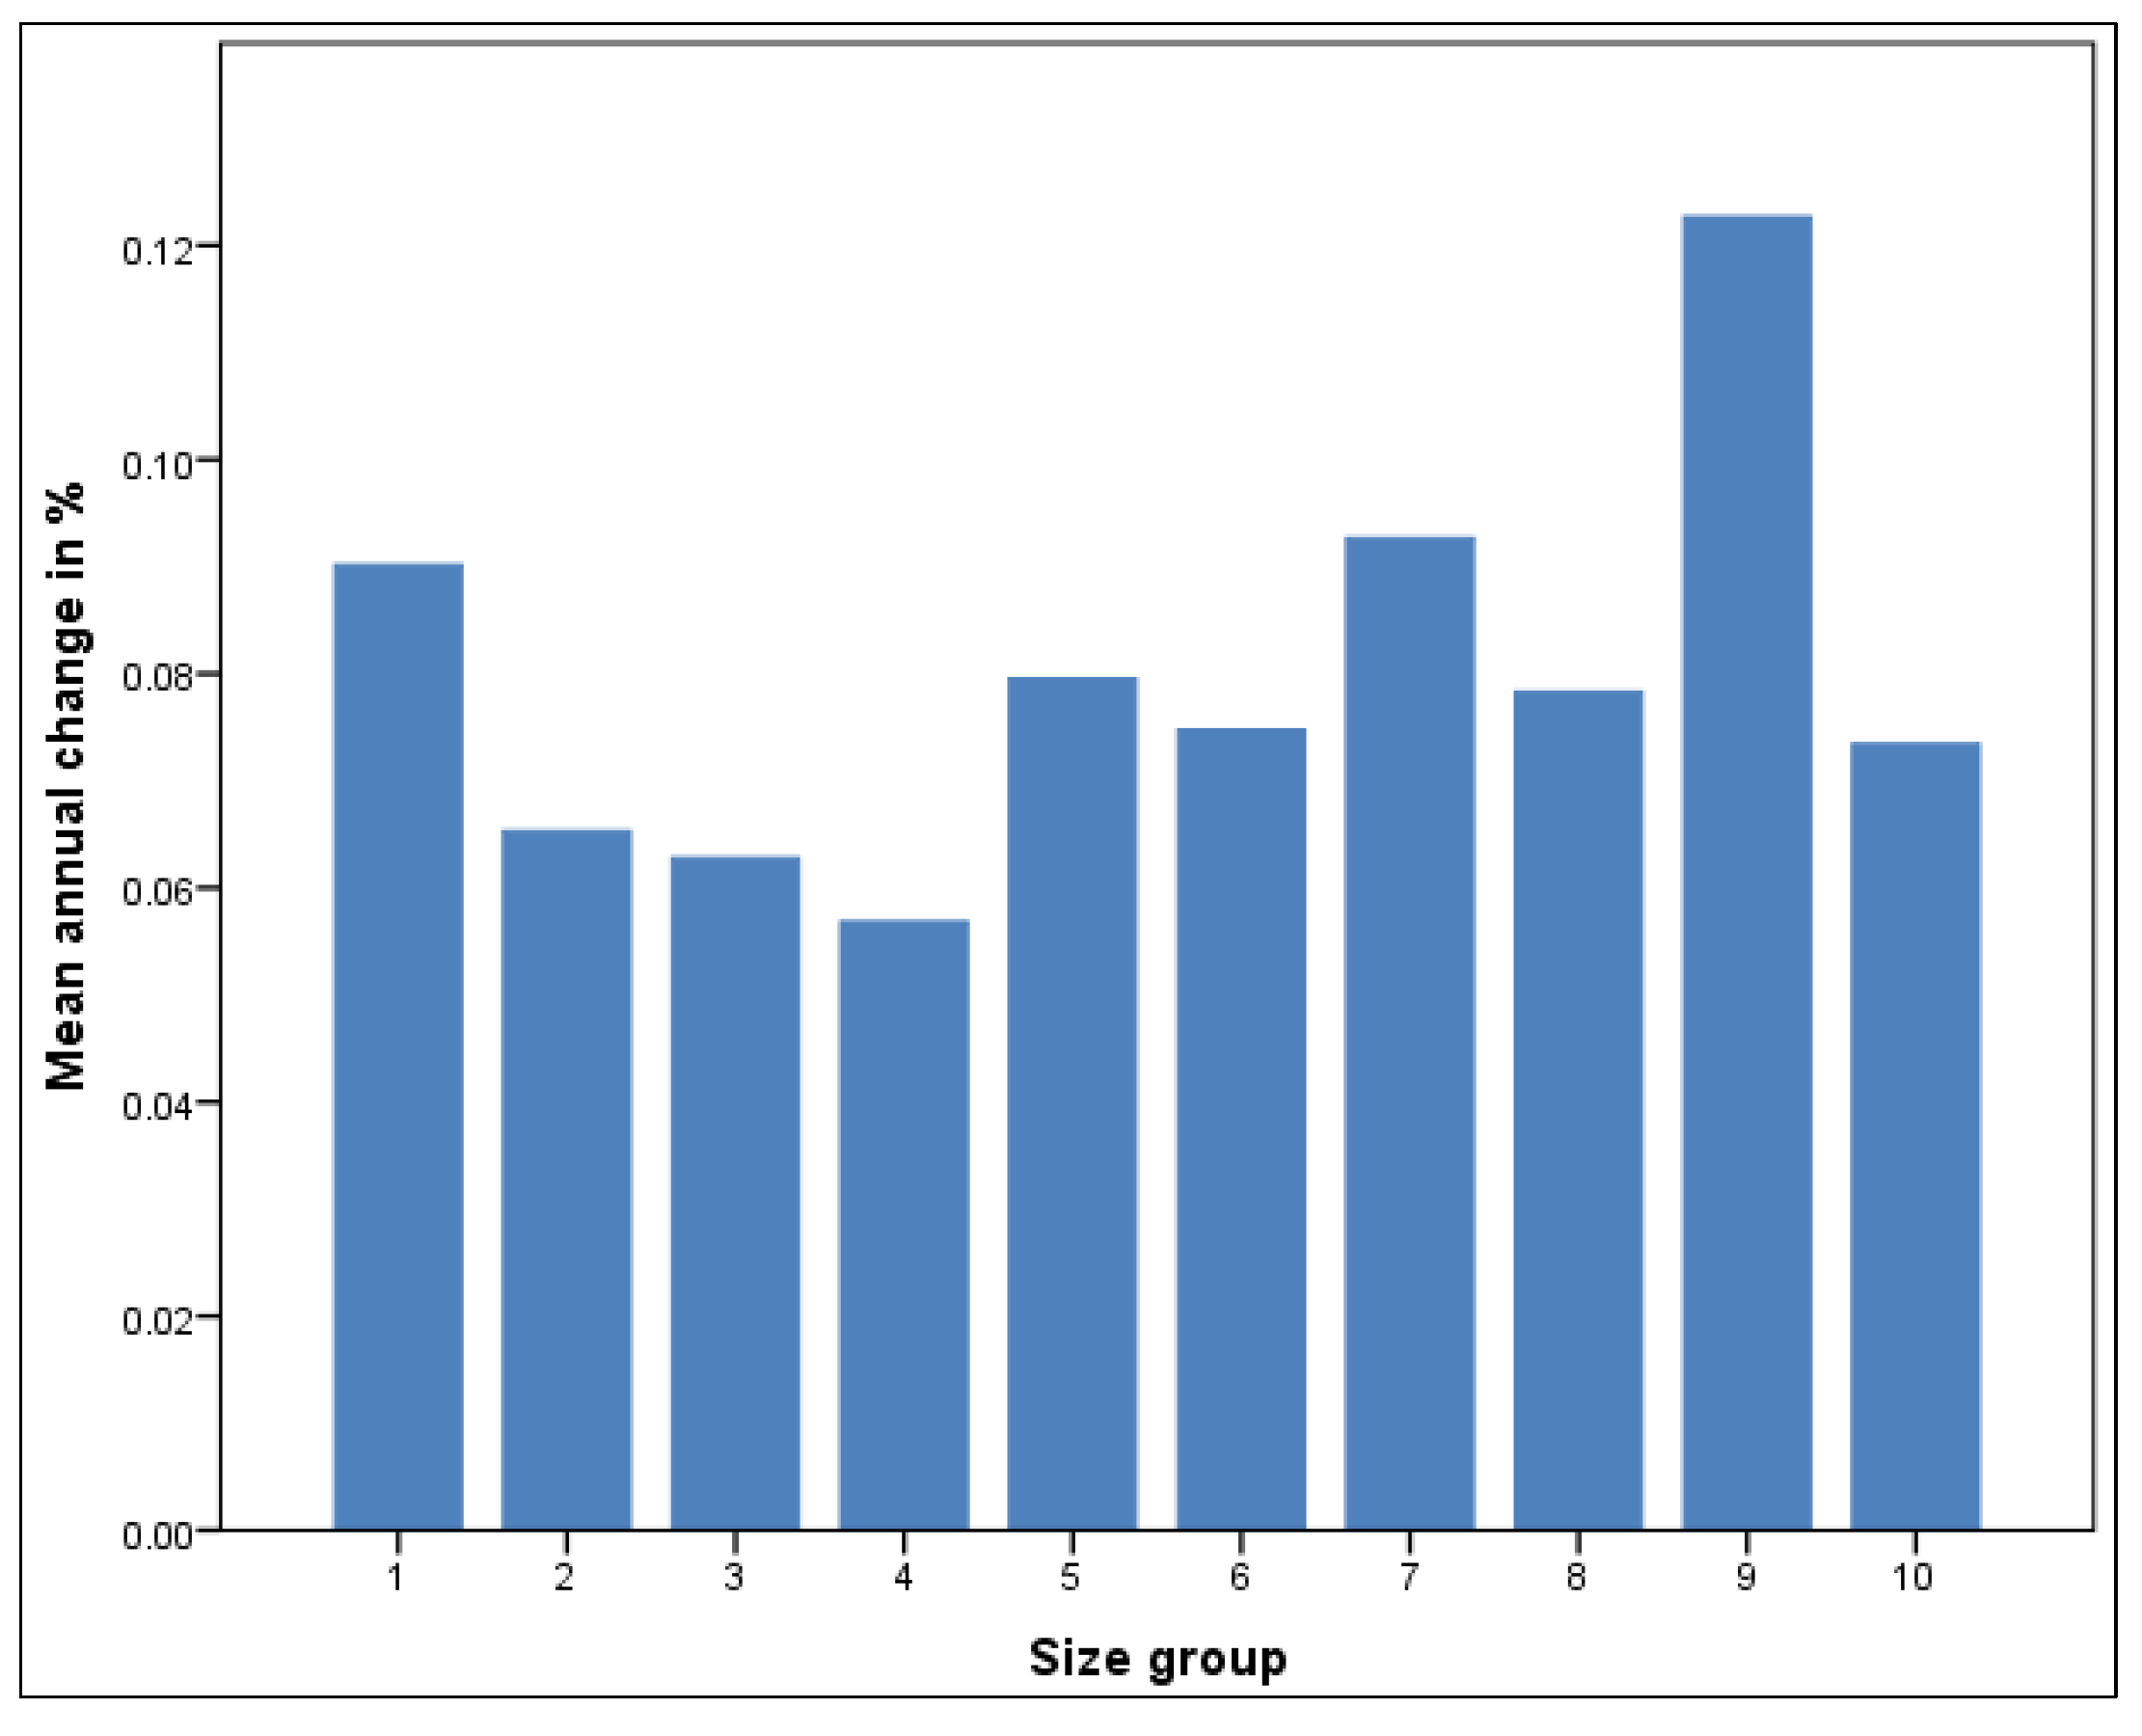
3.2.3. Size

3.2.4. Regression Results for Major Habitat Type, Management Category, and Size
| Dependent variable: Mean land and forest degradation in % | Coefficient | Std. Error | p value |
|---|---|---|---|
| Category I | −0.01 | 0.045 | 0.902 |
| Category III | 0.05 | 0.067 | 0.444 |
| Category IV | 0.02 | 0.050 | 0.655 |
| Category V | −0.03 | 0.062 | 0.631 |
| Category VI | 0.13 * | 0.033 | 0.000 |
| Deserts and xeric shrublands | −0.26 * | 0.080 | 0.001 |
| Flooded grasslands and savannas | −0.11 | 0.158 | 0.486 |
| Mangroves | −0.24 | 0.145 | 0.099 |
| Montane grasslands and shrublands | −0.44 * | 0.098 | 0.000 |
| Tropical and subtropical coniferous forests | −0.39 * | 0.128 | 0.002 |
| Tropical and subtropical dry broadleaf forests | −0.19 * | 0.062 | 0.002 |
| Tropical and subtropical grasslands, savannas and shrublands | 0.01 | 0.044 | 0.754 |
| Temperate broadleaf and mixed forests | −0.14 | 0.089 | 0.126 |
| Temperate grasslands, savannas and shrublands | −0.34 * | 0.098 | 0.001 |
| Protected area size (ln) | 0.04 * | 0.007 | 0.000 |
| Constant | −0.49 | 0.083 | 0.000 |
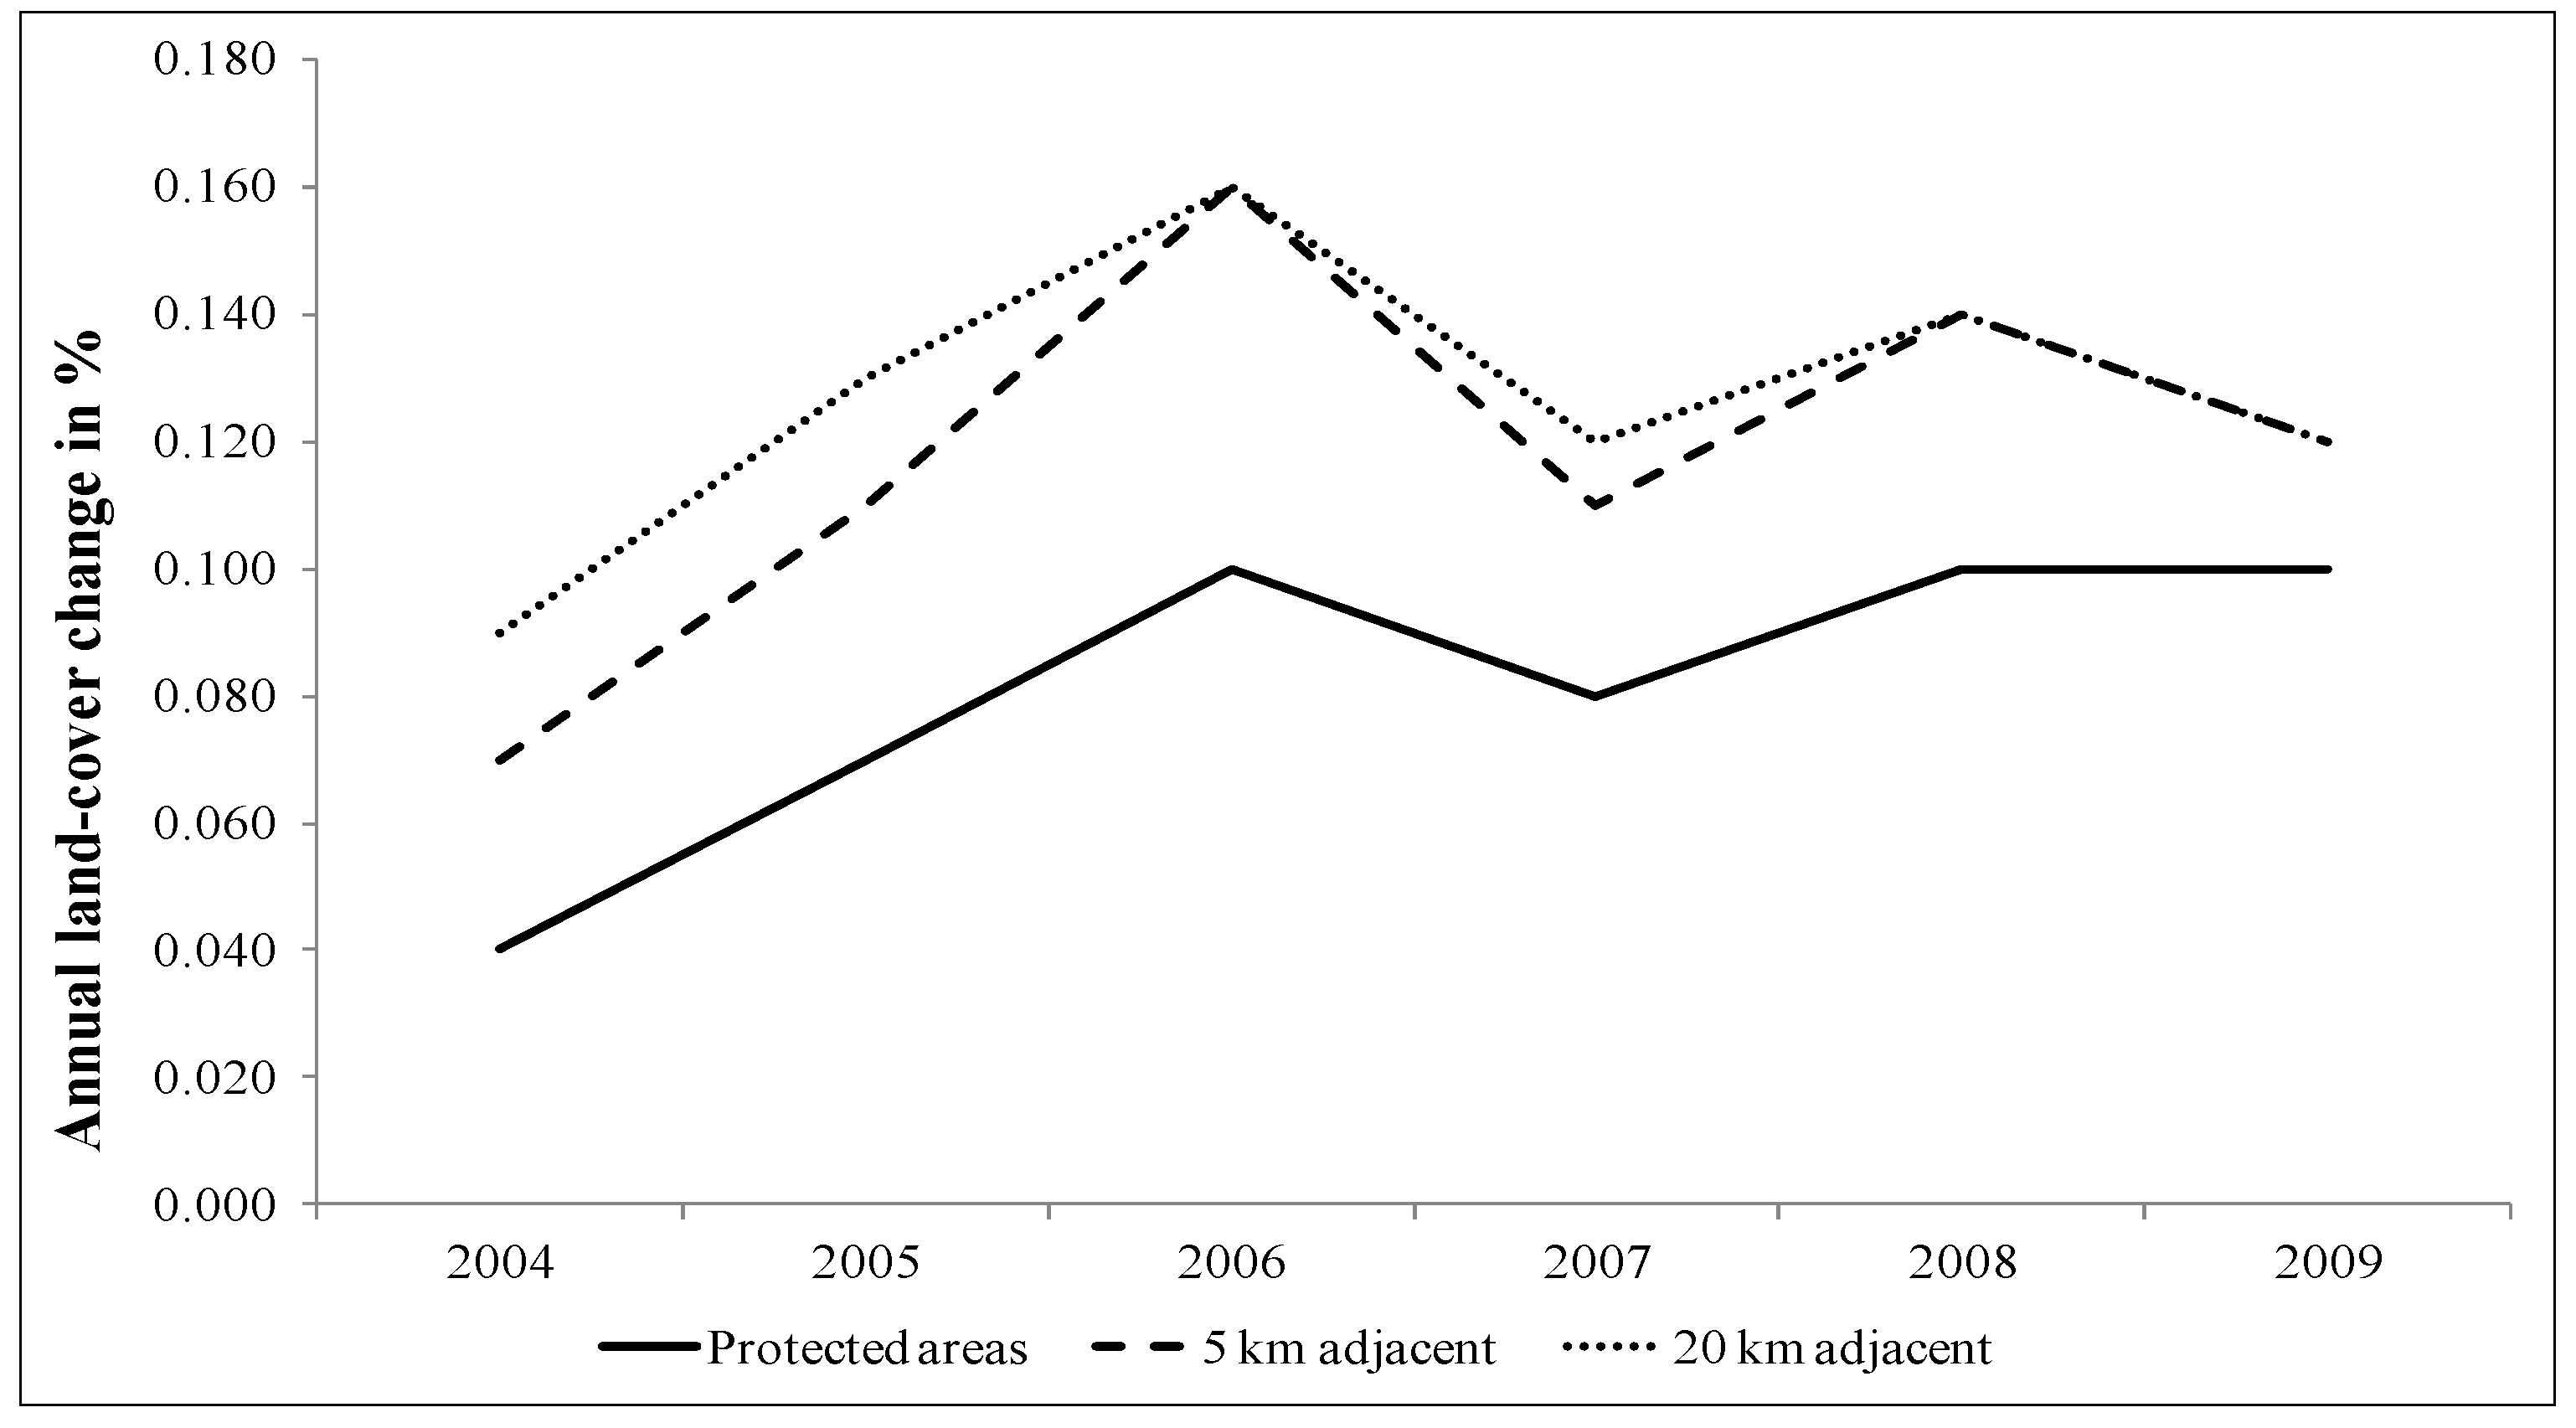
3.3. Differences Inside and Outside Protected Areas
4. Conclusions
Acknowledgments
Conflicts of Interest
References and Notes
- IUCN and UNEP-WCMC. The World Database on Protected Areas; IUCN and UNEP-WCMC: New York, NY, USA, 2011. [Google Scholar]
- Bertzky, B.; Corrigan, C.; Kemsey, J.; Kenney, S.; Ravilious, C.; Besançon, C.; Burgess, N. Protected Planet Report 2012: Tracking Progress towards Global Targets for Protected Areas; IUCN and UNEP-WCMC: Gland, Switzerland and Cambridge, UK, 2012. [Google Scholar]
- Dudley, N. Guidelines for Applying Protected Areas Management Categories; IUCN: Gland, Switzerland, 2008. [Google Scholar]
- Hockings, M. Systems for assessing the effectiveness of management in protected areas. BioScience 2003, 53, 823–832. [Google Scholar] [CrossRef]
- Leverington, F.; Costa, K.L.; Pavese, H.; Lisle, A.; Hockings, M. A global analysis of protected area management effectiveness. Environ. Manag. 2010, 46, 685–698. [Google Scholar] [CrossRef]
- Rodrigues, A.S.; Andelman, S.J.; Bakarr, M.I.; Boitani, L.; Brooks, T.M.; Cowling, R.M.; Yan, X. Effectiveness of the global protected area network in representing species diversity. Nature 2004, 428, 640–643. [Google Scholar] [CrossRef]
- Chape, S.; Spalding, M.D.; Jenkins, M.D. The World’s Protected Areas: Status, Values and Prospects in the 21st Century; University of California Press: Berkeley, CA, USA, 2008. [Google Scholar]
- Andam, K.; Ferraro, P.; Pfaff, A.; Sanchez-Azofeifa, G.; Robalino, J. Measuring the effectiveness of protected area networks in reducing deforestation. Proc. Natl. Acad. Sci. USA 2008, 105, 16089–16094. [Google Scholar]
- Craigie, I.D.; Baillie, J.E.; Balmford, A.; Carbone, C.; Collen, B.; Green, R.E.; Hutton, J.M. Large mammal population declines in Africa’s protected areas. Biol. Conserv. 2010, 143, 2221–2228. [Google Scholar] [CrossRef]
- Guisan, A.; Thuiller, W. Predicting species distribution: Offering more than simple habitat models. Ecol. Lett. 2005, 8, 993–1009. [Google Scholar] [CrossRef]
- Guo, L.B.; Gifford, R.M. Soil carbon stocks and land use change: A meta analysis. Glob. Change Biol. 2002, 8, 345–360. [Google Scholar] [CrossRef]
- Fahrig, L. Effects of habitat fragmentation on biodiversity. Annu. Rev. Ecol. Evol. Syst. 2003, 3, 487–515. [Google Scholar] [CrossRef]
- Nagendra, H. Do parks work? Impact of protected areas on land cover clearing. AMBIO 2008, 37, 330–337. [Google Scholar] [CrossRef]
- Joppa, L.; Pfaff, A. Reassessing the forest impacts of protection. Ann. N. Y. Acad. Sci. 2010, 1185, 135–149. [Google Scholar] [CrossRef]
- Gaveau, D.L.; Epting, J.; Lyne, O.; Linkie, M.; Kumara, I.; Kanninen, M.; Leader-Williams, N. Evaluating whether protected areas reduce tropical deforestation in Sumatra. J. Biogeogr. 2009, 36, 2165–2175. [Google Scholar] [CrossRef]
- Nagendra, H.; Rocchini, D.; Ghate, R. Beyond parks as monoliths: Spatially differentiating park-people relationships in the Tadoba Andhari Tiger Reserve in India. Biol. Conserv. 2010, 143, 2900–2908. [Google Scholar] [CrossRef]
- Ferraro, P.J.; Hanauer, M.M.; Sims, K.R. Conditions associated with protected area success in conservation and poverty reduction. Proc. Natl. Acad. Sci. USA 2011, 108, 13913–13918. [Google Scholar] [CrossRef]
- Friedl, M.A.; McIver, D.K.; Hodges, J.C.F.; Zhang, X.Y.; Muchoney, D.; Strahler, A.H.; Schaaf, C. Global land cover mapping from MODIS: Algorithms and early results. Remote Sens. Environ. 2002, 83, 287–302. [Google Scholar] [CrossRef]
- Lunetta, R.S.; Knight, J.F.; Ediriwickrema, J.; Lyon, J.G.; Worthy, L.D. Land-cover change detection using multi-temporal MODIS NDVI data. Remote Sens. Environ. 2006, 105, 142–154. [Google Scholar] [CrossRef]
- Strahler, A.H.; Boschetti, L.; Foody, G.M.; Friedl, M.A.; Hansen, M.C.; Herold, M.; Woodcock, C.E. Global Land Cover Validation: Recommendations for Evaluation and Accuracy Assessment of Global Land Cover Maps; European Commission, DG Joint Research Centre, Institute for Environment and Sustainability: Luxembourg, 2006. [Google Scholar]
- DETER System, National Institute for Space Research Brazil. Available online: http://www.inpe.br/ingles/news/news.php?Cod_Noticia=343 (accessed on 1 August 2013).
- FORMA Project, Center of Global Development. Available online: http://www.cgdev.org/initiative/forest-monitoring-action-forma (accessed on 1 August 2013).
- Terra-i. Available online: http://www.terra-i.org/terra-i/data.html (accessed on 1 August 2013).
- Morton, C.D.; DeFries, R.S.; Shimabukuro, Y.E.; Anderson, L.O.; del Bon Espírito-Santo, F. Rapid assessment of annual deforestation in the Brazilian Amazon using MODIS data. Earth Interact. 2005, 9, 1–22. [Google Scholar]
- Wang, J.; Rich, P.M.; Price, K.P.; Kettle, W.D. Relations between NDVI, grassland production, and crop yield in the central great plains. Geocarto Int. 2005, 20, 5–11. [Google Scholar]
- Gupta, R.P. Remote Sensing Geology, 2nd ed.; Springer: Berlin, Germany, 2003. [Google Scholar]
- Roerink, G.J.; Menenti, M.; Verhoef, W. Reconstructing cloud free NDVI composites using Fourier analysis of time series. Int. J. Remote Sens. 2000, 21, 1911–1917. [Google Scholar] [CrossRef]
- Xiao, X.; Moore, B.; Qin, X.; Shen, Z.; Boles, S. Large-scale observations of alpine snow and ice cover in Asia using multi-temporal VEGETATION sensor data. Int. J. Remote Sens. 2002, 23, 2213–2228. [Google Scholar] [CrossRef]
- Sakamoto, T.; van Nguyen, N.; Kotera, A.; Ohno, H.; Ishitsuka, N.; Yokozawa, M. Detecting temporal changes in the extent of annual flooding within the Cambodia and the Vietnamese Mekong Delta from MODIS time-series imagery. Remote Sens. Environ. 2007, 109, 295–313. [Google Scholar] [CrossRef]
- Yan, Y.E.; Ouyang, Z.T.; Guo, H.Q.; Jin, S.S.; Zhao, B. Detecting the spatiotemporal changes of tidal flood in the estuarine wetland by using MODIS time series data. J. Hydrol. 2010, 384, 156–163. [Google Scholar] [CrossRef]
- MODIS MOD35. Available online: http://modis-atmos.gsfc.nasa.gov/MOD35_L2/ (accessed on 1 August 2013).
- Tropical Rainfall Measuring Mission. Available online: http://trmm.gsfc.nasa.gov/ (accessed on 1 August 2013).
- WWF terrestrial biomes. Available online: http://worldwildlife.org/biomes (accessed on 1 August 2013).
- World Bank. World Development Indicators. Available online: http://data.worldbank.org/data-catalog/world-development-indicators (accessed on 1 August 2013).
- Bovarnick, A.; Fernandez Baca, J.; Galindo, J.; Negret, H. Financial Sustainability of Protected Areas in Latin America and the Caribbean; United Nations Development Program and The Nature Conservancy: New York, NY, USA and Arlington, TX, USA, 2010. [Google Scholar]
- Mas, J.F. Assessing protected area effectiveness using surrounding (buffer) areas environmentally similar to the target area. Environ. Monit. Assess. 2005, 105, 69–80. [Google Scholar] [CrossRef]
- Joppa, L.N.; Pfaff, A. High and far: Biases in the location of protected areas. PLoS One 2009, 4, e8273. [Google Scholar] [CrossRef]
- Greene, W.H. On the asymptotic bias of the ordinary least squares estimator of the Tobit model. Econometrica 1981, 49, 505–513. [Google Scholar] [CrossRef]
- Tobin, J. Estimation of relationships for limited dependent variables. Econometrica 1958, 26, 24–36. [Google Scholar] [CrossRef]
- Greene, W. Fixed effects and bias due to the incidental parameters problem in the Tobit model. Econom. Rev. 2004, 23, 125–147. [Google Scholar] [CrossRef]
- Wilcoxon, F. Individual comparisons by ranking methods. Biom. Bull. 1945, 1–6, 80–83. [Google Scholar] [CrossRef]
- Friedman, M. The use of ranks to avoid the assumption of normality implicit in the analysis of variance. J. Am. Stat. Assoc. 1937, 32, 675–701. [Google Scholar] [CrossRef]
- Friedman, M. A correction: The use of ranks to avoid the assumption of normality implicit in the analysis of variance. J. Am. Stat. Assoc. 1939, 34, 109. [Google Scholar]
- Wittemyer, G.; Elsen, P.; Bean, W.; Burton, A.C.O.; Brashares, J. Accelerated human population growth at protected area edges. Science 2008, 321, 123–126. [Google Scholar]
- Milanovic, B. Worlds Apart: Measuring International and Global Inequality; Princeton University Press: Princeton, NJ, USA, 2011. [Google Scholar]
- The highest correlation coefficients were found for GDP growth and the funding level (Pearson correlation coefficient: 0.6) and for GDP/capita and population density (−0.5), both being statistically significant at the 5% level. The correlation coefficients for the other pairs of variables were all below 0.3. We also estimated a number of partial models in which we reduced the collinearity by including no combination of variables with a correlation coefficient above 0.3, and found similar results.
- Wooldridge, J. Introductory Econometrics: A Modern Approach, 3rd ed.; South-Western College Publishing: Florence, KY, USA, 2005. [Google Scholar]
- Lambin, E.F.; Turner, B.L.; Geist, H.J.; Agbola, S.B.; Angelsen, A.; Bruce, J.W.; Xu, J. The causes of land-use and land-cover change: Moving beyond the myths. Global Environ. Change 2001, 11, 261–269. [Google Scholar] [CrossRef]
- Bonilla-Moheno, M.; Aide, T.M.; Clark, M.L. The influence of socioeconomic, environmental, and demographic factors on municipality-scale land-cover change in Mexico. Reg. Environ. Change 2012, 12, 543–557. [Google Scholar] [CrossRef]
- Bruner, A.G.; Gullison, R.E.; Rice, R.E.; da Fonseca, G.A. Effectiveness of parks in protecting tropical biodiversity. Science 2001, 291, 125–128. [Google Scholar] [CrossRef]
- Woodroffe, R.; Ginsberg, J.R. Edge effects and the extinction of populations inside protected areas. Science 1998, 280, 2126–2128. [Google Scholar] [CrossRef]
- Brashares, J.S.; Arcese, P.; Sam, M.K. Human demography and reserve size predict wildlife extinction in West Africa. Proc. R. Soc. B—Biol. Sci. 2001, 268, 2473–2478. [Google Scholar] [CrossRef]
- In hectares, the groups cover the following sizes: 500–1016; 1016–1965; 1965–3531; 3531–6550; 6550–12,447; 12,447–26,093; 26,093–52,580; 52,580–123,565; 123,565–374,725; and 374,725–5,041,193.
- Ferraro, P.J.; Hanauer, M.M.; Miteva, D.A.; Canavire-Bacarreza, G.J.; Pattanayak, S.K.; Sims, K.R. More strictly protected areas are not necessarily more protective: Evidence from Bolivia, Costa Rica, Indonesia, and Thailand. Environ. Res. Lett. 2013, 8, 025011. [Google Scholar] [CrossRef]
- Joppa, L.N.; Pfaff, A. Global protected area impacts. Proc. R. Soc. B—Biol. Sci. 2011, 278, 1633–1638. [Google Scholar] [CrossRef]
- McDonald, R.I.; Boucher, T.M. Global development and the future of the protected area strategy. Biol. Conserv. 2011, 144, 383–392. [Google Scholar] [CrossRef]
© 2013 by the authors; licensee MDPI, Basel, Switzerland. This article is an open access article distributed under the terms and conditions of the Creative Commons Attribution license (http://creativecommons.org/licenses/by/3.0/).
Share and Cite
Leisher, C.; Touval, J.; Hess, S.M.; Boucher, T.M.; Reymondin, L. Land and Forest Degradation inside Protected Areas in Latin America. Diversity 2013, 5, 779-795. https://doi.org/10.3390/d5040779
Leisher C, Touval J, Hess SM, Boucher TM, Reymondin L. Land and Forest Degradation inside Protected Areas in Latin America. Diversity. 2013; 5(4):779-795. https://doi.org/10.3390/d5040779
Chicago/Turabian StyleLeisher, Craig, Jerome Touval, Sebastiaan M. Hess, Timothy M. Boucher, and Louis Reymondin. 2013. "Land and Forest Degradation inside Protected Areas in Latin America" Diversity 5, no. 4: 779-795. https://doi.org/10.3390/d5040779
APA StyleLeisher, C., Touval, J., Hess, S. M., Boucher, T. M., & Reymondin, L. (2013). Land and Forest Degradation inside Protected Areas in Latin America. Diversity, 5(4), 779-795. https://doi.org/10.3390/d5040779