3.2. Avian Use of Wetlands Reserve Program easements
We counted a total of 115,791 birds during 21 surveys of 68 sites over two years (
Table 3). In 2008, 203 species of birds were recorded in wetland areas while in 2009, 119 species of birds were recorded (
Table 3). Previous studies recorded about 250 bird species across the entire CCV [
17,
18]. Numbers of birds recorded in this study were higher than has been observed in surveys of privately managed sites and croplands in the same area [
19,
20]. Dominant species were similar among years with the exception of aerial predators, plunge divers, and shorebirds (
Table 4). Thirty-one special status species were observed on wetland portions of WRP sites in 2008 and 14 in 2009. Fourteen special status species were observed on upland portions of sites throughout the CCV. Special status species appear in at least one of four state, national and international lists of threatened or endangered birds [
21,
22,
23,
24].
Table 3.
Number of species and total bird counts by survey method on Wetlands Reserve Program easements in California’s Central Valley.
Table 3.
Number of species and total bird counts by survey method on Wetlands Reserve Program easements in California’s Central Valley.
| | Wetland Survey | Point Count |
|---|
| | 2008 | 2009 | 2008 | 2009 |
|---|
| Sites a | 41 | 13 | 10 | 4 |
| Visits | 13 | 5 | 2 | 1 |
| Total Species | 142 | 119 | 37 | 15 |
| Total Count | 87,249 | 27,411 | 1090 | 41 |
Table 4.
Number of species in each avian guild observed in California’s Central Valley and dominant species by guild and frequency of occurrence on Wetlands Reserve Program easements (in parentheses). Frequencies are based on wetland surveys conducted on 42 sites in 2008 and 16 sites in 2009. Foraging guilds are comprised of species that share behavioral traits and have similar environmental requirements [
13].
Table 4.
Number of species in each avian guild observed in California’s Central Valley and dominant species by guild and frequency of occurrence on Wetlands Reserve Program easements (in parentheses). Frequencies are based on wetland surveys conducted on 42 sites in 2008 and 16 sites in 2009. Foraging guilds are comprised of species that share behavioral traits and have similar environmental requirements [13].
| Guild | Number of species | Dominant species |
|---|
| 2008 | 2009 | 2008 | 2009 |
|---|
| Aerial Feeders | 19 | 8 | -- | -- |
| Aerial Predators | 18 | 8 | Northern Harrier (65%) | Red Tailed Hawk (75%) |
| Large Waders | 8 | 6 | | |
| Dabbling Ducks | 14 | 9 | Mallard (88%) | Mallard (92%) |
| Geese and Swans | 4 | 2 | Canada Goose (17%) | Canada Goose (42%) |
| Gulls | 4 | 1 | California Gull, Herring Gull, Ring-billed Gull (2%) | Ring-billed Gull (2%) |
| Marsh Birds | 12 | 11 | Red-winged Blackbird (94%) | Red-winged Blackbird (92%) |
| Plunge Divers | 5 | 1 | Forster’s Terns (17%) | Belted Kingfisher (-) |
| Surface Divers | 15 | 8 | Pied-billed Grebe (48%) | Pied-billed Grebe (58%) |
| Shorebirds | 32 | 16 | Killdeer (79%) | Black-necked Stilt (75%) |
| Upland Birds | 72 | 49 | Brown-headed Cowbird (65%) | Brown-headed Cowbird (100%) |
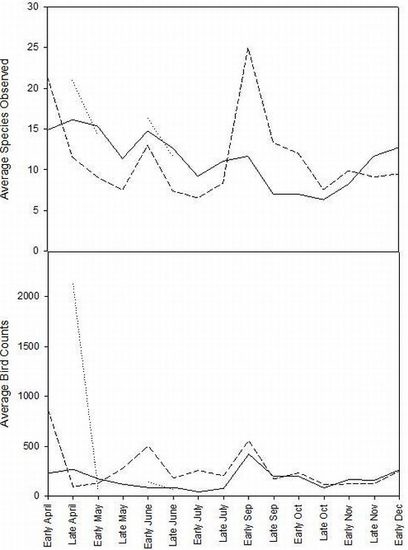
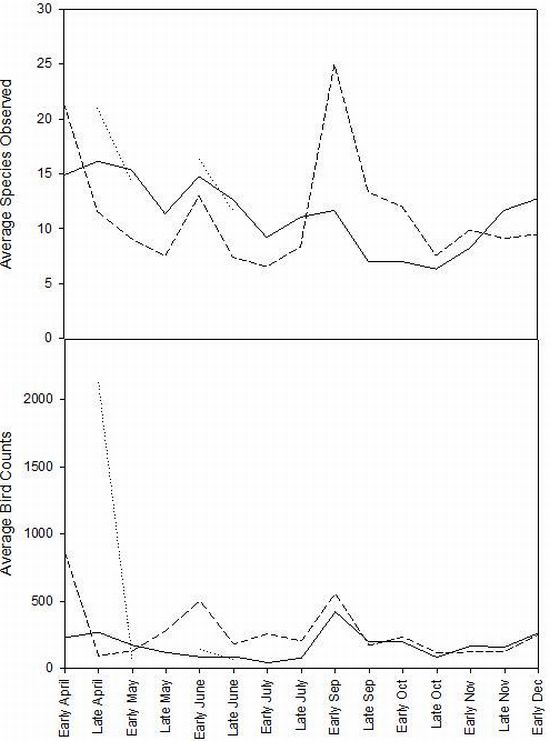
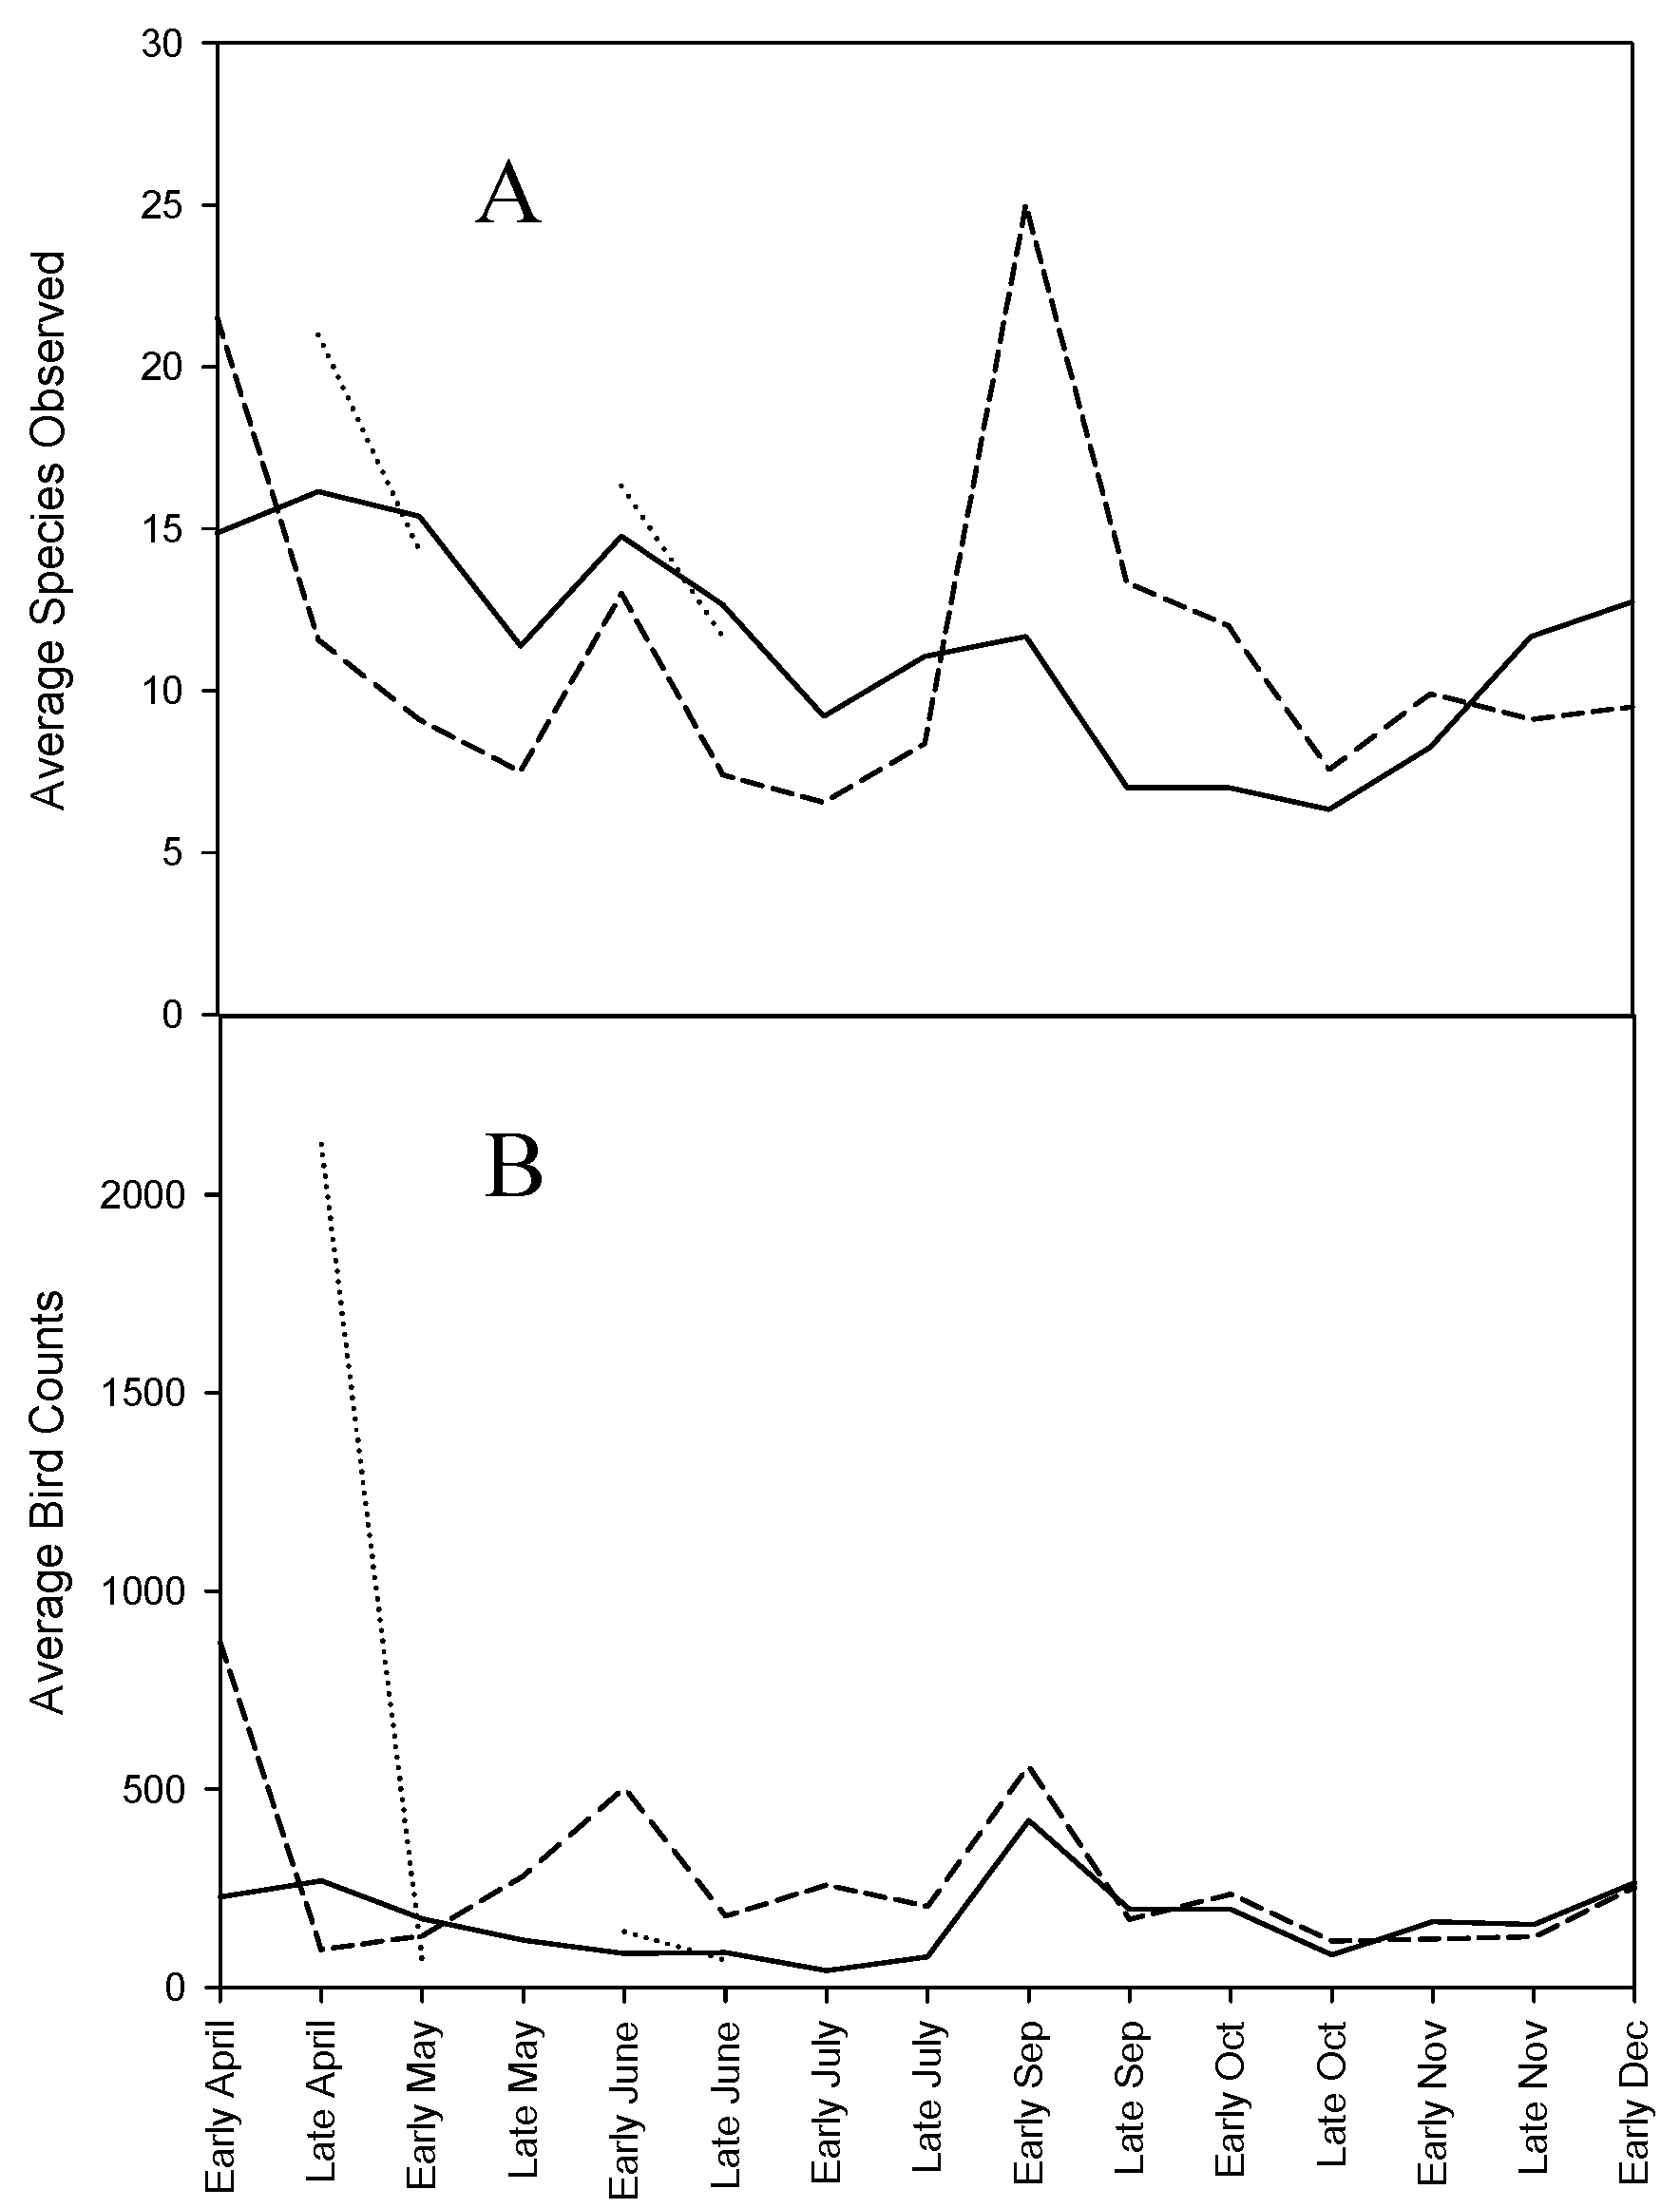
Bird species diversity (measured as the transformed Shannon-Weiner Index) was greater in July than in May at all sites in 2009 (t = −3.56,
p = 0.04). In 2008, average species richness in the Sacramento sub-basin peaked in April, while in the Tulare sub-basin, the greatest numbers of species were observed in September (
Figure 2A). Average number of birds observed per visit in the Sacramento and Tulare basins was highest in early September, while in the San Joaquin sub-basin the greatest abundance appeared to occur in late April (
Figure 2B). For subsequent analyses, birds were categorized into 11 foraging and habitat guilds.
Figure 2.
Average number of species and average number of individual birds observed per visit (wetland surveys) in the Sacramento (solid line), San Joaquin (dotted line) and Tulare (dashed line) sub-basins from April to December 2008.
Figure 2.
Average number of species and average number of individual birds observed per visit (wetland surveys) in the Sacramento (solid line), San Joaquin (dotted line) and Tulare (dashed line) sub-basins from April to December 2008.
Hydrology is the single most important determinant of wetland ecosystem function. The presence, depth and duration of water drives plant germination, floristic composition, water chemistry and wildlife use [
8,
25]. Drastic alterations to the hydrology of the Central Valley have markedly influenced wildlife presence and abundance, however restored wetland habitats may mitigate some of these changes. As in other surveys, bird diversity and abundance peaked in April during spring migration and then again in the late summer and early fall [
26], suggestive of historic avian migratory movements through the region. Historically, early migrants would have flown south to the Tulare sub-basin in the late summer and early fall to take advantage of the large lakes and wetlands while the rest of the CCV was relatively dry. This would be followed by a northward migration to the San Joaquin and Sacramento sub-basins as they flooded with winter rain and spring runoff. Once precipitation and flooding filled wetlands of the Sacramento and San Joaquin sub-basins, birds would then move north [
3]. Although our data point towards unchanged migration patterns, wintering ground philopatry may negatively impact body condition of individuals and populations if waterfowl continue to revisit heavily altered or degraded wetland habitats, particularly in the southern CCV.
Observed trends suggest that moist soil management techniques that emphasize flooding in the winter and drawdown in spring may not match peak avian abundance in the southern CCV. Flooding in early fall months beginning in September may favor waterfowl use in the Tulare sub-basin and mimic historic water conditions. A slow or delayed drawdown in late spring through early summer may favor breeding shorebirds in the San Joaquin and Tulare sub-basins.
Waterfowl and waterbirds in our study favored diverse sites with multiple habitat types. Incorporating variable topography in the initial design of restored impoundments creates a flooding gradient that favors development of a broader floral community with varying water tolerance. Sites with larger upland habitats favored aerial predators, which may discourage waterfowl and waterbird use.
3.3. Effect of Precipitation Gradient on Avian Use
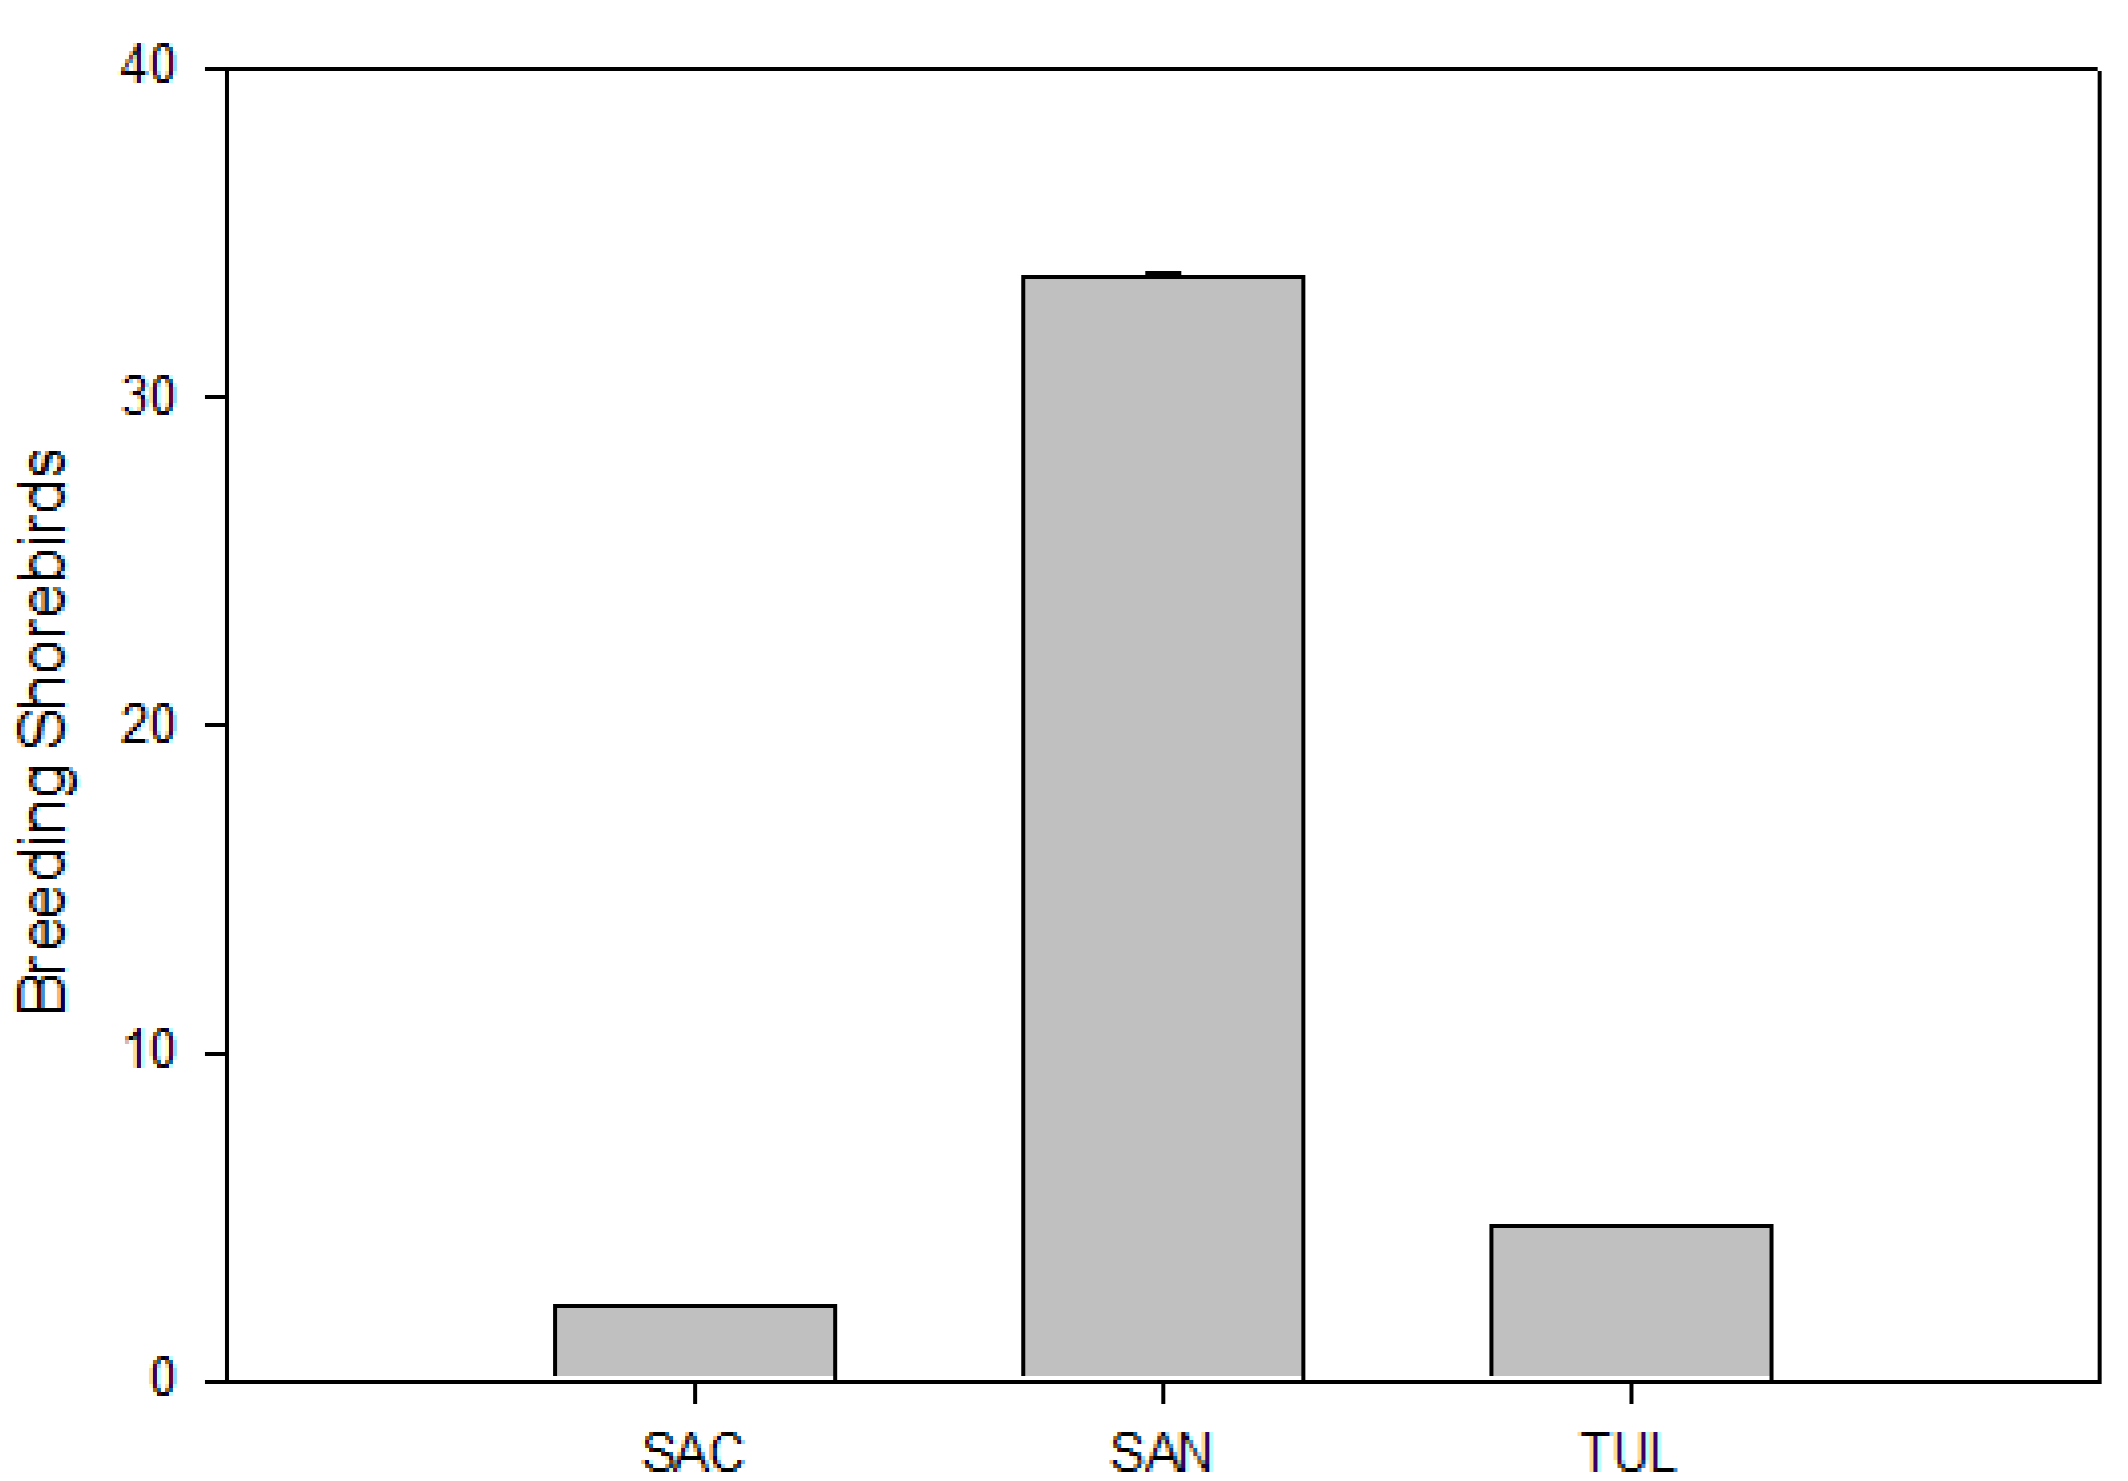
Neither species diversity nor species richness followed a trend along the north-south precipitation gradient. However, species richness was significantly greater in the San Joaquin sub-basin than in other sub-basins (H (2, n = 57) = 8.4, p = 0.01). In 2008, breeding shorebirds were also significantly more abundant in the San Joaquin sub-basin (H (2, n = 33) = 1 2.7, p < 0.01).
Point counts in the upland portions of WRP in the northernmost Sacramento sub-basin, exhibited significantly greater numbers of aerial feeders (H (1, n = 221) = 3.7,
p = 0.05) and marsh birds (H (1, n = 221) = 74.2,
p < 0.01) than in the San Joaquin sub-basin. Wetland surveys revealed greater numbers of geese in WRPs of the Sacramento sub-basin than either of the sub-basins further south (H (2, n = 61) = 8.5,
p = 0.01) (
Figure 3) as were dabbling ducks (H (2, n = 61) = 5.7,
p = 0.05). Shorebirds (H (2, n = 61) = 5.8,
p = 0.05), and marsh birds (H (2, n = 61) = 12.7,
p < 0.01) (
Figure 3) and breeding shorebirds (H (2, n = 33) = 12.7,
p < 0.01) were most abundant in the San Joaquin sub-basin (
Figure 4).
Almost all foraging guilds were more abundant in restored wetlands of the northern Sacramento sub-basin compared to the San Joaquin, suggesting a positive relationship between avian use, water availability and associated longer growing seasons. In addition, the Sacramento sub-basin has retained the majority of all remaining upland riparian habitat in the CCV [
3] and has large tracts of crops consumed by waterfowl such as rice and corn. Wildlife friendly artificial habitats include aquacultural ponds, rice paddy fields and reservoirs and are known to provide supplementary habitat to waterfowl in degraded landscapes around the world [
27]. An abundance of trees within semi-permanent wetlands of the Sacramento valley also contribute to higher avian biodiversity compared to sub-basins further south [
12]. Ancillary data suggests both on-site and landscape scale factors play a role in influencing avian occurrence. For instance, more geese were observed on restored sites in the Sacramento sub-basin. Goose presence is often associated with rice and corn crops on the landscape, but may also be linked to on-site habitat characteristics such as wet meadow (moist soil) and open water zones in WRP [
13]. Wildlife friendly crops such as rice, small grains and pasture which are attractive to geese are primarily grown in the Sacramento sub-basin. Wet meadow and open water zones were significantly larger on sites in the Sacramento sub-basin than sites further south [
13]. Wet meadow zones are typically dominated by short annual wetland species such as grasses (
Poaceae spp.), smartweeds (
Polygonum spp.) and swamp timothy (
Crypsis schoenoides) that may be favored by geese and other grazing birds. Larger wet meadow zones also suggest an emphasis on moist soil management which encourages the germination of annual seed bearing plants for wintering waterfowl.
Figure 3.
Average abundance of eight bird foraging guilds observed (wetland surveys) on wetland areas of Wetlands Reserve Program easements in three California Central Valley sub-basins, Sac = Sacramento, San = San Joaquin and Tul = Tulare. The Tulare sub-basin was not sampled in the year 2009. Foraging guilds are comprised of species that share behavioral traits and have similar environmental requirements [
13]. Standard error bars are shown.
Figure 4.
Average abundance of shorebirds observed (wetland surveys) on wetland areas of Wetlands Reserve Program easements in three California Central Valley sub-basins, Sac = Sacramento, San = San Joaquin and Tul = Tulare. Standard error bars are shown.
Figure 4.
Average abundance of shorebirds observed (wetland surveys) on wetland areas of Wetlands Reserve Program easements in three California Central Valley sub-basins, Sac = Sacramento, San = San Joaquin and Tul = Tulare. Standard error bars are shown.
Aerial predators were more abundant in the Tulare sub-basin compared to the Sacramento or San Joaquin and included species that often prey on wetland birds. Conditions in the drier Tulare sub-basin make wetland management particularly difficult. Heavy reliance on pumped groundwater has resulted in fewer actively managed wetlands and WRP easements with larger upland areas dominated by grasses such as salt grass (Distichlis spicata) and reed-canary grass (Phalaris canariensis). Given unreliable water supplies, pre-irrigated cropland outside of the growing season is often the only alternative for early fall migrants to the Tulare sub-basin. The result has been diminished early season use by waterfowl, particularly after the decline in pre-irrigated cropland in the 1970s. Although initiatives such as the Central Valley Project Improvement Act (CVPIA), which was passed in 1992 increased water reliability to the southern CCV, privately managed wetlands do not benefit directly. Furthermore, with rising population and agricultural demands, it is unlikely that water allocations to wetlands will increase significantly enough to approach historic wetland availability for water dependent species. It is therefore likely that restored habitats in the southern CCV will remain minimally managed or un-managed, providing habitat primarily for upland species and aerial predators whose foraging activity is better suited to open grasslands. However, where water is available, an emphasis on early fall flooding may support waterfowl migrants. Alternatively, encouraging the integration of waterfowl management in surrounding cropland may yield more substantial results.
Marsh birds occurred in greatest abundance in the San Joaquin sub-basin compared to other sub-basins. Marsh birds include Red-winged Blackbirds, Marsh Wrens, American Coots and Common Yellowthroat, among others. Breeding shorebirds were also more abundant in the San Joaquin sub-basin. Greater shorebird species richness has been reported in the San Joaquin Valley [
28], however other reports found that the Sacramento and Tulare sub-basins support more shorebirds than the San Joaquin. However, our data suggest that restored wetlands in this region are major shorebird habitats, despite only 50% of land owners managing for shorebirds. The numbers are disproportionately high especially considering the relative size of individual WRP easements and overall acreage in the San Joaquin. We suspect that shorebird and marsh bird abundance may be bolstered by the restored wetlands proximity to the Grasslands Ecological Area (GEA) located in the San Joaquin sub-basin. The GEA is a 64,700 ha mosaic of grassland, riparian and depressional wetlands recognized as a Wetland of International Importance by the Western Hemisphere Shorebird Reserve Network. The GEA supports more shorebirds than any other inland site in North America during winter and spring [
3,
19] and is one of a few key wintering areas in the world for mountain plovers [
29]. Additionally, the location of many privately managed sites within the Grassland Resource Conservation District (GRCD) may enhance their use by birds. The GRCD is a 30,300 ha area and holds 20% of the CCV’s remaining wetlands. About 11,300 ha of the GRCD are protected from development, and are some of the most important wintering waterfowl areas in North America [
30].
3.4. Effect of Restoration Age on Avian Use
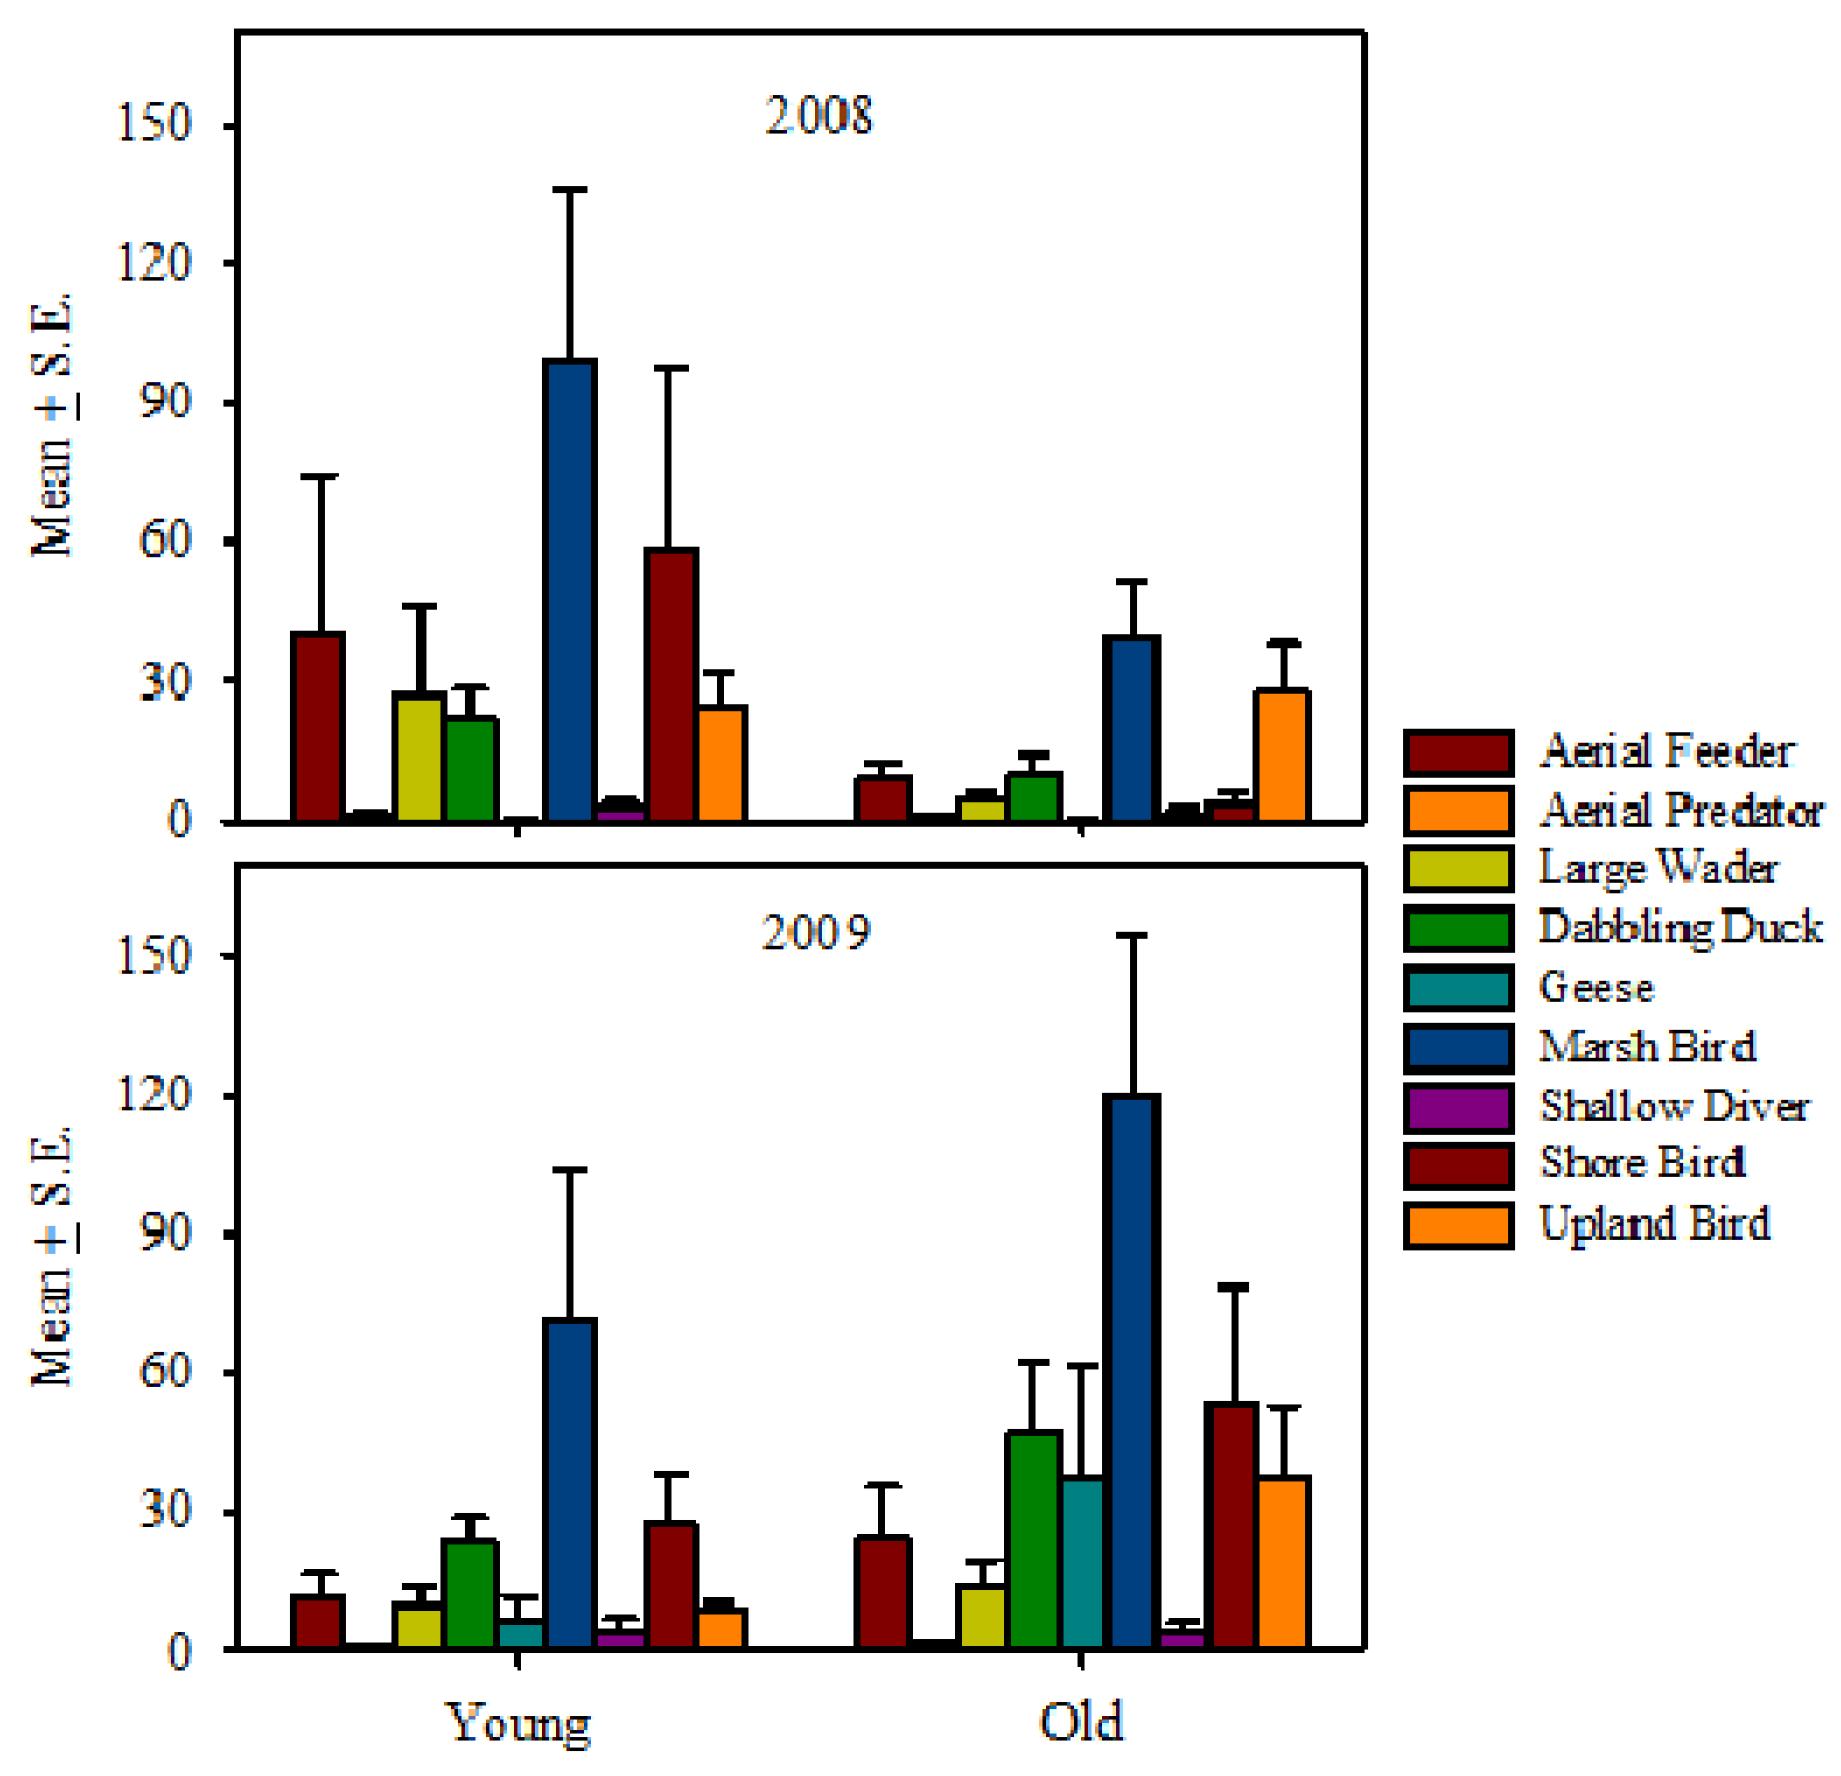
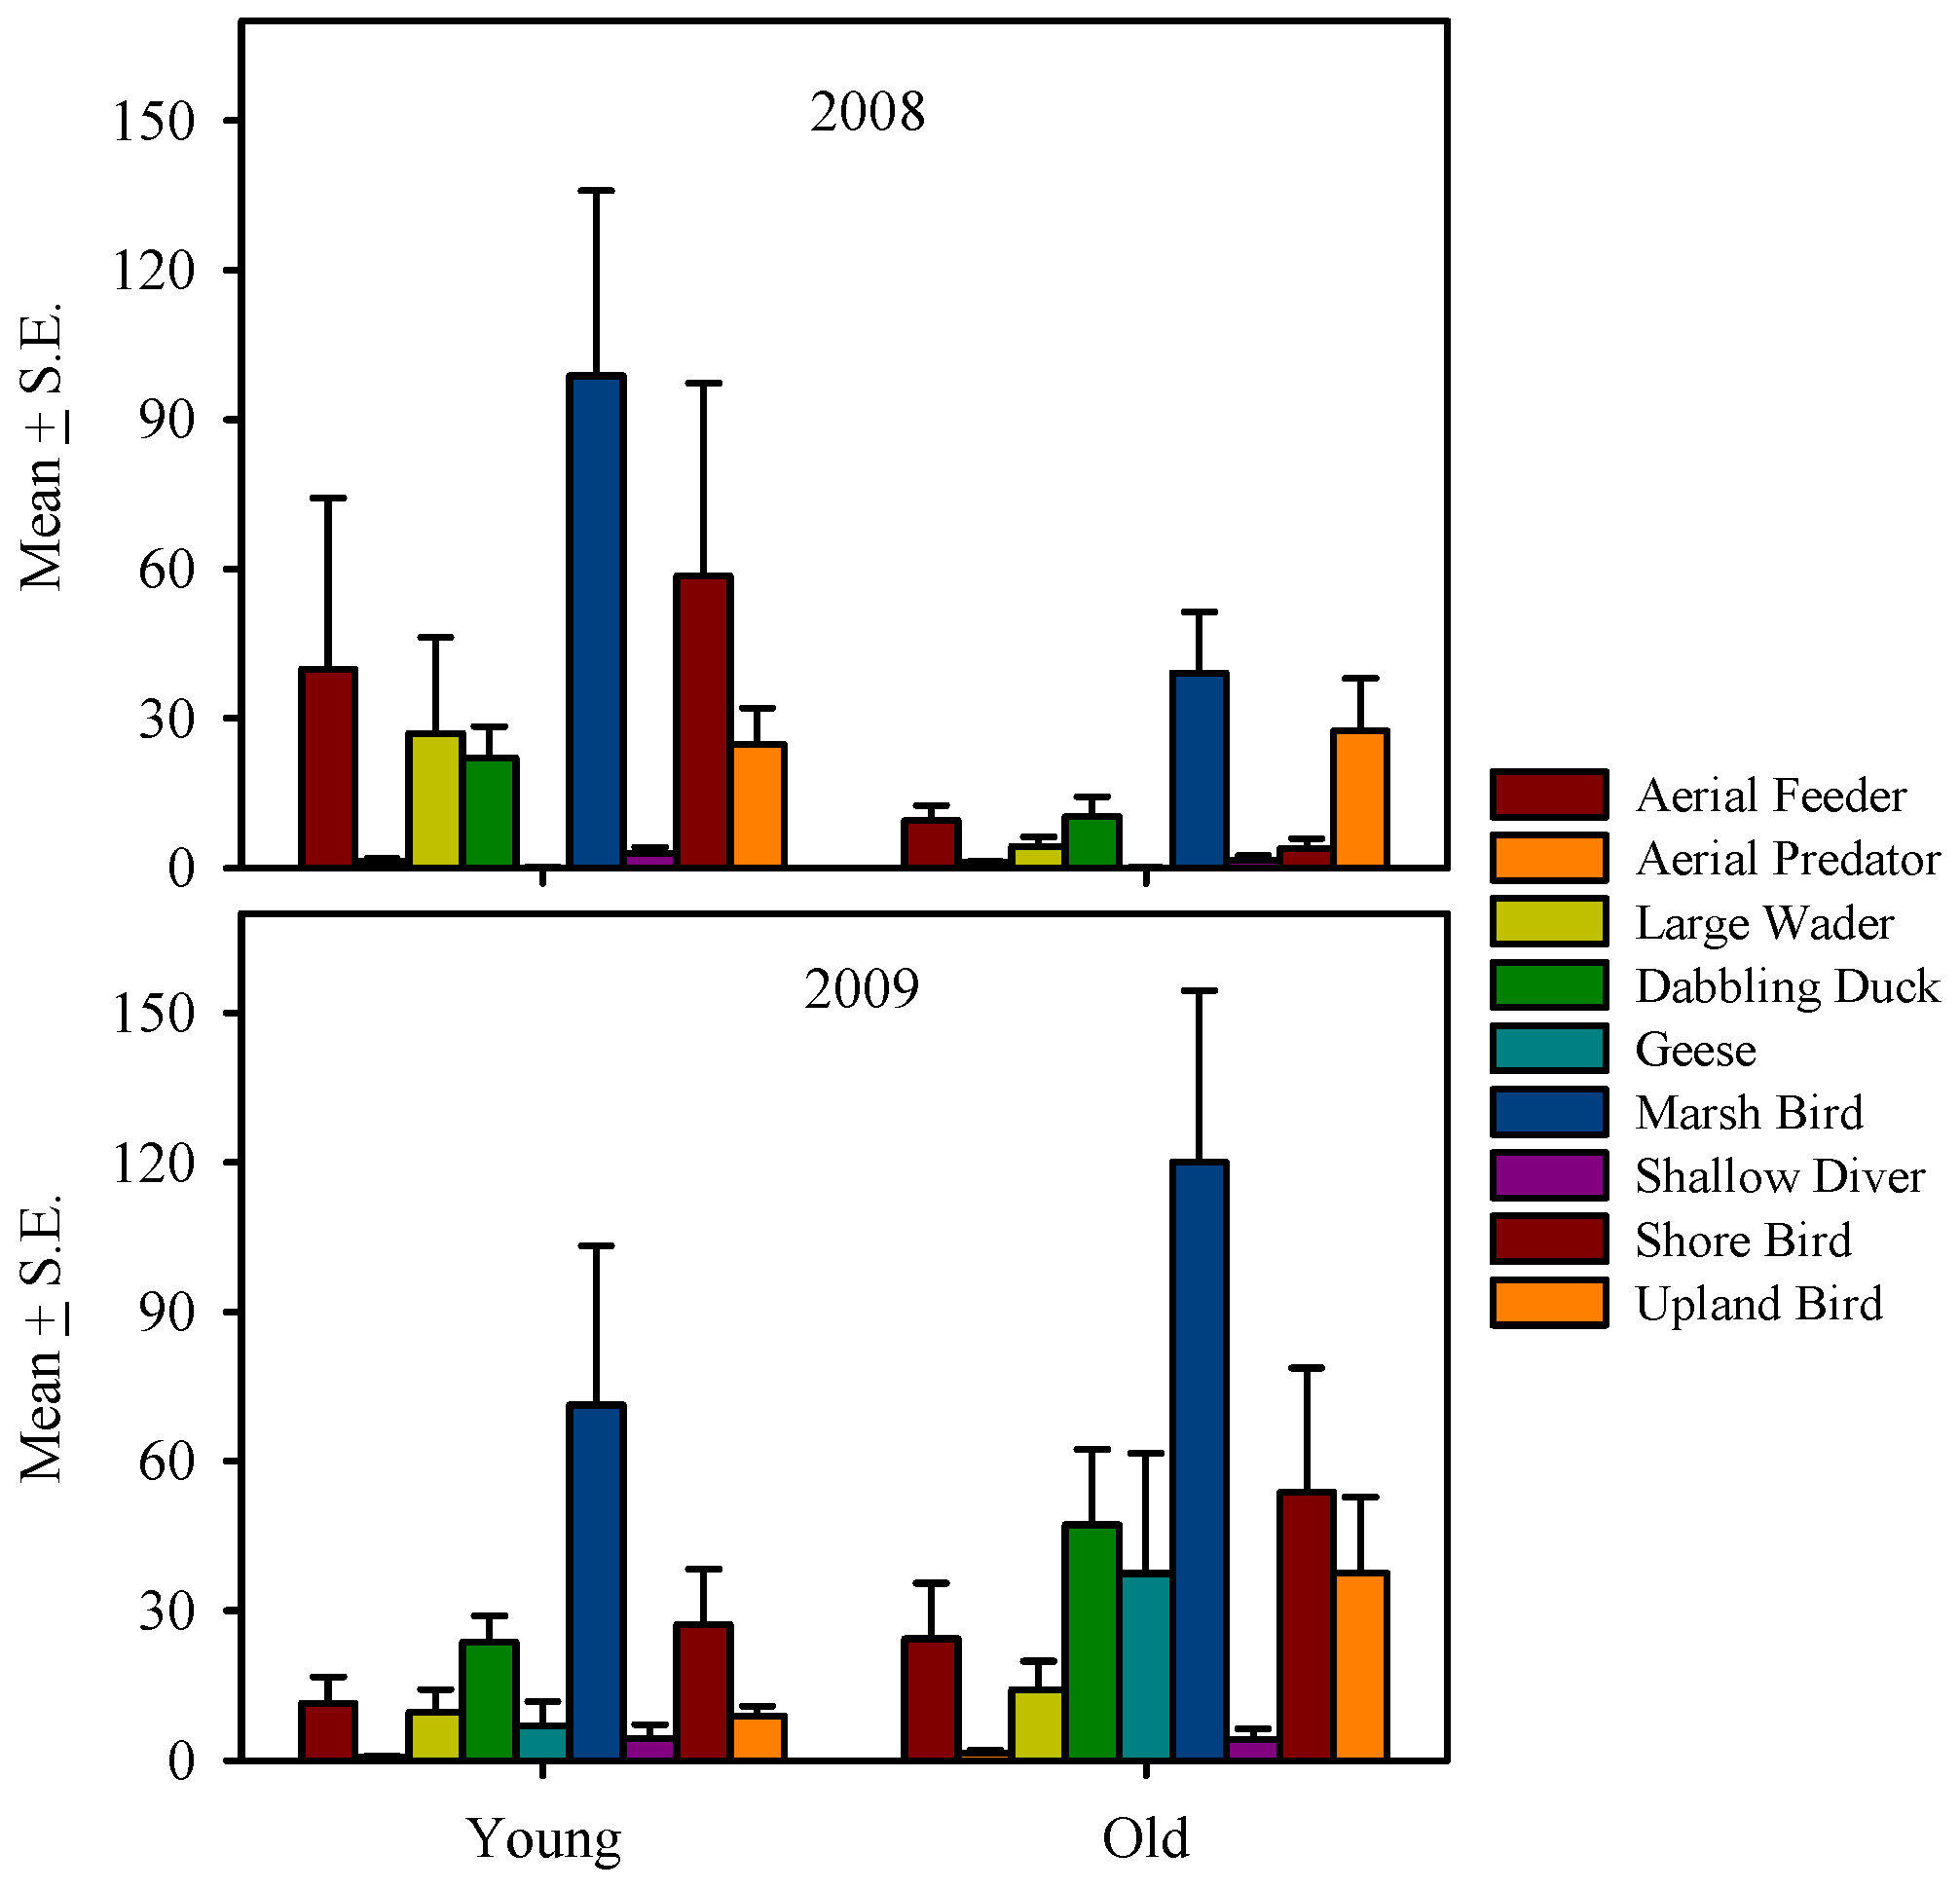
Bird species diversity and richness did not differ with WRP age since restoration. Among guilds, only upland birds were significantly more abundant on older WRPs than on younger WRPs (U (59) = 269.5, Z = −2.28,
p = 0.02) (
Figure 5). Most guilds were observed more frequently on older WRPs than on younger WRPs. Dabbling ducks, marsh birds, shorebirds and upland birds were observed more frequently on younger rather than older WRP sites (
Table 5).
Figure 5.
Average abundance of eight bird foraging guilds observed (wetland surveys) on wetland areas of Wetlands Reserve Program easements. 2008 includes Sacramento, San Joaquin, and Tulare sub-basin data, whereas 2009 includes Sacramento and San Joaquin sub-basin data only. “Young” sites are ≤5 years since restoration; “Old” are >5 years. Foraging guilds are comprised of species that share behavioral traits and have similar environmental requirements [
13]. Standard error bars are shown.
Shifts in bird species composition have been observed with increasing wetland age, primarily due to plant establishment and increasing habitat structure [
31,
32,
33]. Wetland physiognomy may be the most important factor influencing total bird diversity. Vegetation growth and management establish the basis of the ecological food web on restored wetlands [
34,
35]. Although we did not detect any differences in species diversity and foraging guild abundance between younger and older WRP uplands, wetland portions of older WRPs exhibited differences in all guilds with the exception of marsh birds. Upland birds were more abundant on wetlands of older sites and may be linked to the availability and size of riparian habitat on older sites. These findings corroborate that of previous studies, where sites re-vegetated with native plants in the Sacramento River that were greater than five years old, exhibited bird diversity similar to that of remnant woodland [
36]. Similarly, in Iowa, the mean number of breeding birds was reported to be significantly higher in older restored wetlands [
37] and species richness was reported to increase with percent cover of emergent vegetation.
3.5. Effect of Management Intensity on Avian Use
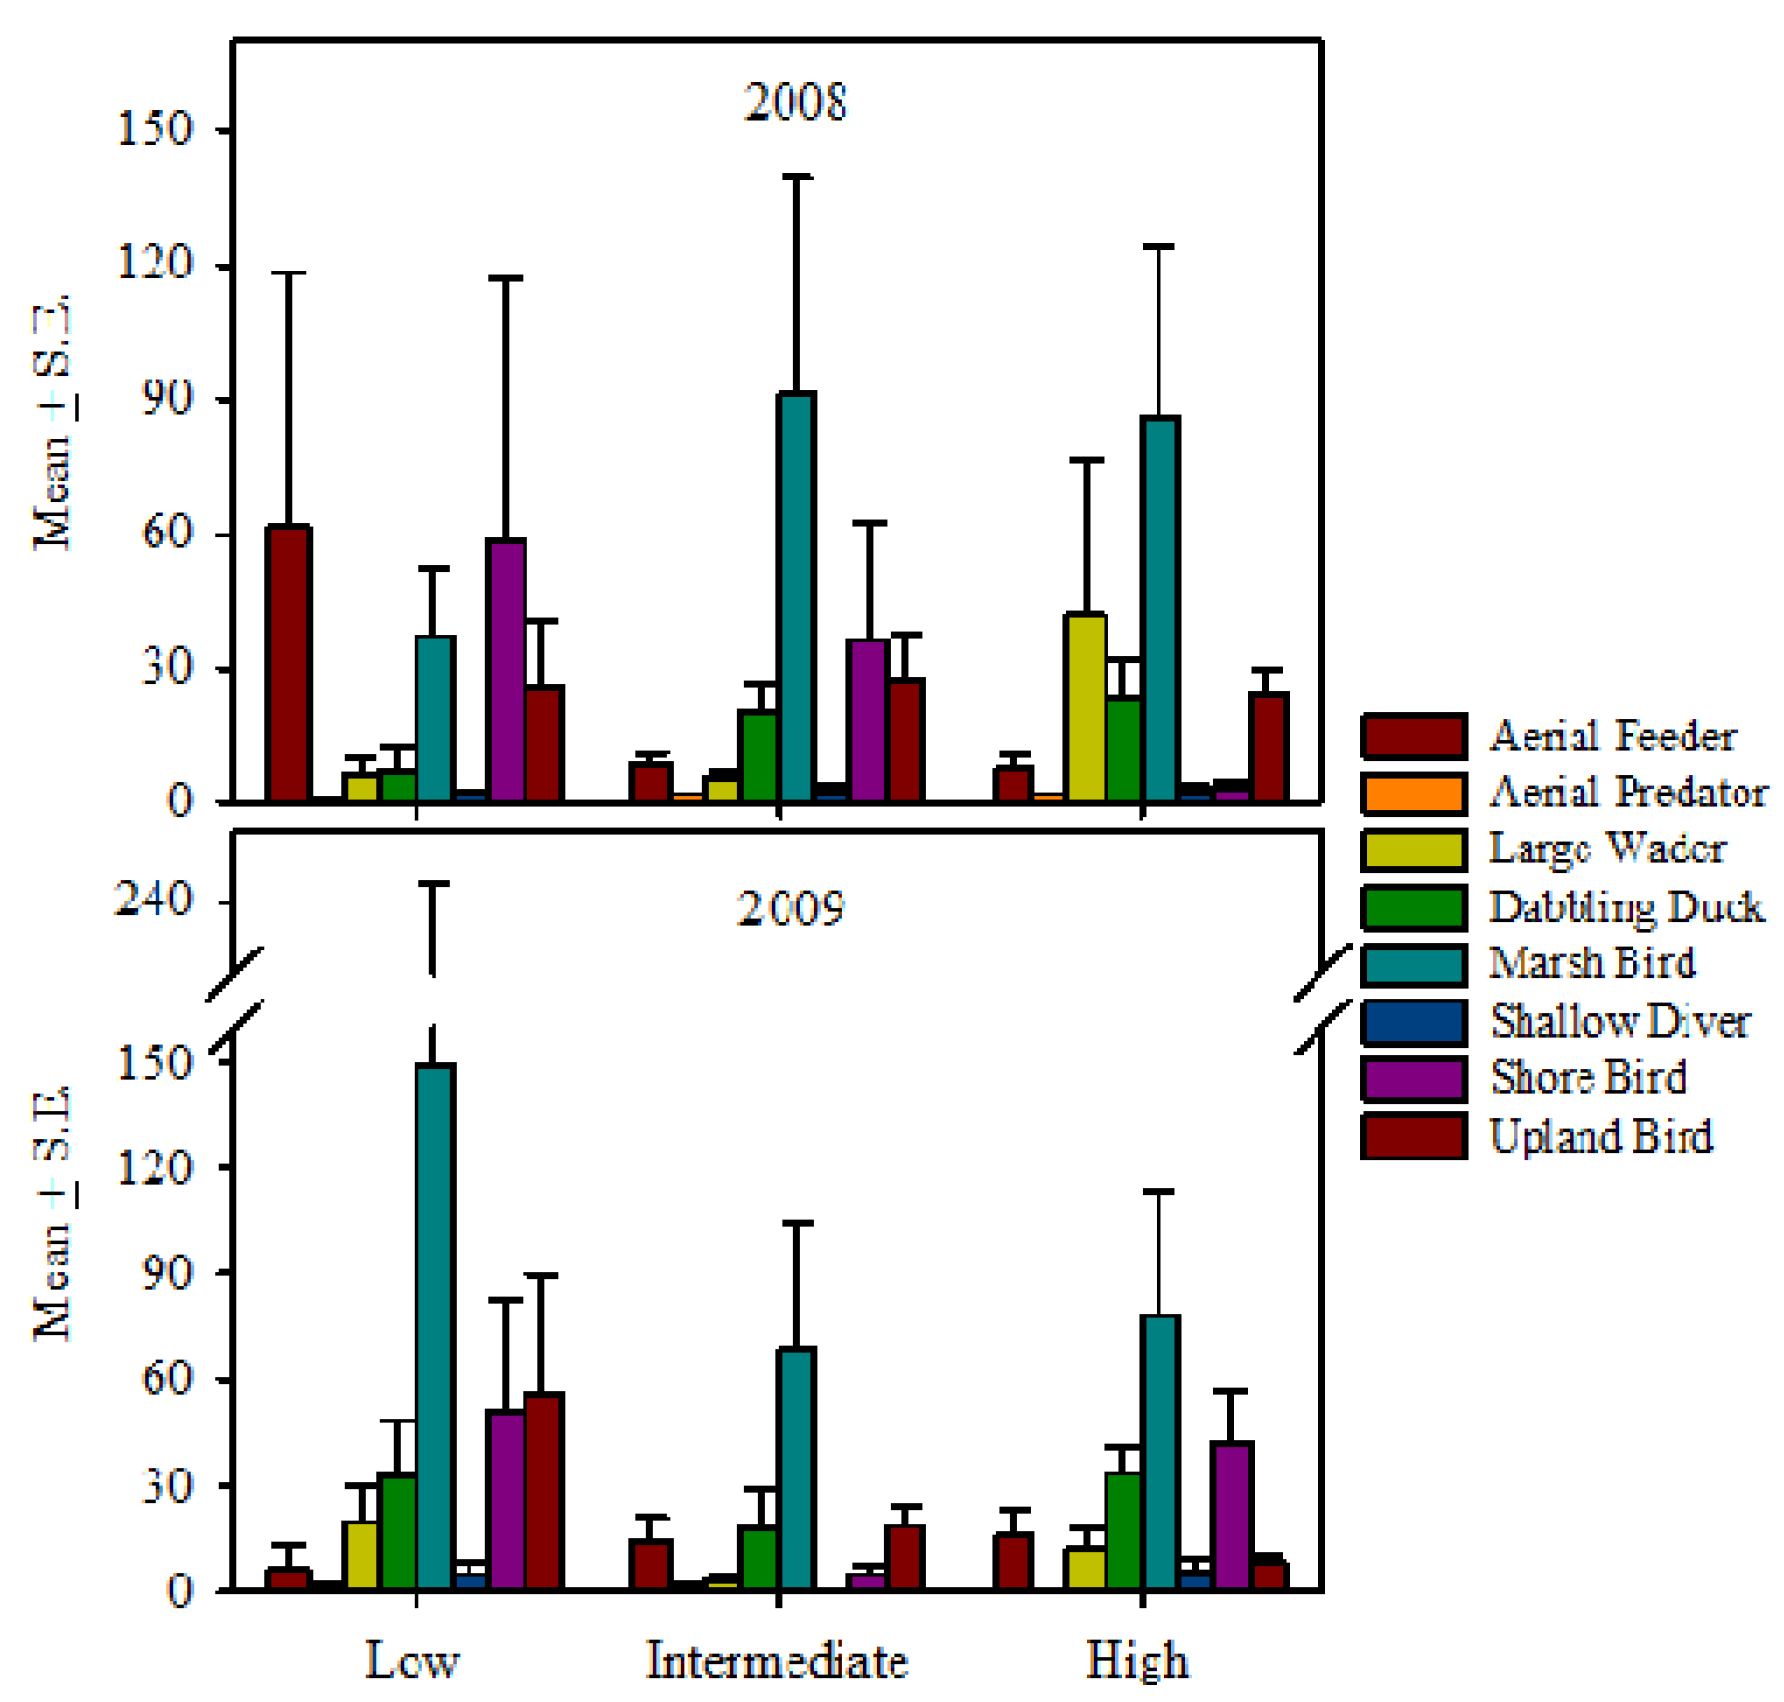
Point counts conducted in the upland portions of WRPs indicated that bird species richness was greater in low management intensity or unmanaged WRPs than on more intensively managed WRP sites (H (2, N = 19) = 6.0,
p = 0.05). Uplands of intensively managed WRPs had more upland species than other management regimes (H (2, N = 221) = 16.3,
p < 0.01). Wetland surveys revealed more dabbling ducks (H (2, N = 61) = 6.9,
p = 0.03), geese (H (2, N = 61) = 7.1,
p = 0.03) and aerial feeders (H (2, N = 61) = 5.9,
p = 0.05) on intensively managed WRPs than WRPs managed under intermediate or low management intensity regimes (
Figure 6). Notably in the Tulare sub-basin, large wading birds were significantly more abundant on intensively managed WRPs (H (2, N = 13) =7.1,
p = 0.03). Interestingly, shorebird abundance was greatest on intermediately managed sites (H (2, N = 61) = 8.9,
p = 0.01).
Table 5.
Percent occurrence of avian foraging guilds in Wetland Reserve Program easements by sub-basin, management and age (2008–2009). Number of sites is indicated in parentheses. Sac = Sacramento sub-basin; San = San Joaquin sub-basin and ; Tul = Tulare sub-basin. “Young” sites are ≤5 years since restoration; “Old” are >5 years. “Low” = sites under low or no management; “Inter” = sites under intermediate management; “High” = actively managed sites. Management categories are described in Experimental Section.
| Sub-basin % | | Management % | | Age % | |
|---|
| Sac | San | Tul | Low | Inter | High | Young | Old |
|---|
| Guild | (39) | (9) | (13) | (14) | (20) | (27) | (40) | (21) |
|---|
| Aerial Feeder | 95 | 89 | 85 | 86 | 95 | 93 | 88 | 100 |
| Aerial Predator | 74 | 100 | 92 | 93 | 90 | 70 | 80 | 86 |
| Wading Birds | 77 | 89 | 69 | 71 | 75 | 81 | 80 | 71 |
| Dabbling Ducks | 92 | 100 | 77 | 79 | 85 | 100 | 90 | 90 |
| Geese | 64 | 56 | 69 | 50 | 60 | 74 | 63 | 67 |
| Gulls | 23 | 0 | 0 | 7 | 15 | 19 | 13 | 19 |
| Marsh Birds | 59 | 56 | 0 | 21 | 40 | 63 | 53 | 33 |
| Plunge Divers | 41 | 56 | 85 | 64 | 65 | 37 | 48 | 62 |
| Shallow Divers | 46 | 44 | 23 | 21 | 35 | 56 | 40 | 43 |
| Shorebirds | 72 | 100 | 38 | 50 | 65 | 81 | 75 | 57 |
| Upland Birds | 82 | 100 | 54 | 43 | 85 | 93 | 83 | 71 |
Figure 6.
Average abundance of eight bird foraging guilds observed (wetland surveys) by management intensity on wetland areas of Wetlands Reserve Program easements in California’s Central Valley. 2008 includes Sacramento, San Joaquin, and Tulare sub-basin data, whereas 2009 includes Sacramento and San Joaquin sub-basin data only. Low = sites with low or no management, Intermediate = sites with intermediate management, High = actively managed sites. Foraging guilds are comprised of species that share behavioral traits and have similar environmental requirements [
13]. Standard error bars are shown.
Aerial feeders, marsh birds and upland birds were more abundant on heavily managed sites. All foraging guilds except upland birds were observed more frequently on actively managed sites. Although species diversity and richness did not differ statistically among management regimes, data indicate an increasing trend from low to high management.
As expected, actively managed restored wetlands supported more dabbling ducks. Actively managed sites have more dynamic hydrological regimes and many are managed specifically to attract wintering waterfowl. The largest proportion of actively managed sites was located in the Sacramento sub-basin [
13]; however, sites in the Tulare sub-basin may receive more use by waterfowl, waterbirds and shorebirds because alternative habitats were lacking. Geese and shallow divers were also more abundant on actively managed WRP easements.
Low and intermediate management may benefit non-waterfowl species. Less than half of all WRPs are not actively drawn down and therefore allow water to evaporate slowly. This strategy mimics historic conditions in the CCV, when slow evaporation of wetlands would occur over the summer following winter and spring flooding. This would have provided shallow ponds for breeding shorebirds. Not all active management practices are beneficial to birds. Most actively managed sites are mowed and disked to control weeds and create open water areas for wintering waterfowl. Increased disturbance due to vegetation and pest control may encourage predation by creating corridors in otherwise dense vegetation stands. Spraying for mosquitoes may also inadvertently impact invertebrate communities typically consumed by waterfowl. Waterfowl typically increase intake of invertebrates in their diets in the late winter as they prepare to migrate back to breeding grounds. While spraying was not widespread in the Sacramento and San-Joaquin sub-basins, almost half the sites in the Tulare sub-basin are sprayed.
3.6. Site Characteristics
Sites in the Tulare sub-basin exhibited significantly larger upland zones, followed by the San Joaquin and Sacramento sub-basins (H (2, N = 43) = 12.2, p = 0.02). Wet meadow zones dominated by annual, flood tolerant species and the open water zone were significantly larger in the Sacramento sub-basin (H (2, N = 43) = 14.7, p < 0.01). Wetland zones did not differ by management. Younger sites exhibited larger upland zones (t (41) = −2.19, p = 0.03), while older sites had significantly larger wet meadow (t (41) = −2.03, p = 0.05) and shallow marsh zones (t (41) = −2.36, p = 0.01).
We identified correlations between avian guilds and available proportions of different habitats on WRP. Avian guilds exhibited differences in their relationships to the proportion of restored wetland habitat (
Table 6). Spearman rank order correlation coefficients were significant at
p = 0.05. Marsh birds, wading birds, dabbling ducks, shorebirds and shallow divers were positively correlated to the number of wetland zones present indicating an affinity for wetlands with diverse flora. Diving ducks, shorebirds, geese and shallow divers were positively related to wetland depth, while aerial predators were negatively related to wetland depth. Geese were negatively related to proportion of upland, while aerial predator numbers increased with upland proportion. Proportions of wet meadow were positively correlated to plunge divers, but negatively correlated to marsh birds, diving ducks, aerial predators and upland birds. Marsh birds, wading birds, dabbling ducks, diving ducks, shallow divers and upland birds were all positively correlated to the proportion of shallow marsh and deep marsh. Dabbling ducks, diving ducks, shorebirds, geese and shallow divers were positively correlated to open water, however aerial predators were negatively correlated to open water.
Table 6.
Spearman Rank Order correlation coefficients among avian guilds and habitat characteristics surveyed in 2008 and 2009. Correlation coefficients shown are significant at p = 0.05.
Table 6.
Spearman Rank Order correlation coefficients among avian guilds and habitat characteristics surveyed in 2008 and 2009. Correlation coefficients shown are significant at p = 0.05.
| | Zones | Depth | Upland | Wet Meadow | Shallow Emergent | Deep Emergent | Open Water |
|---|
| Marsh Birds | 0.39 | - | - | −0.31 | 0.43 | 0.38 | - |
| Wading Birds | 0.38 | - | - | - | 0.47 | 0.24 | - |
| Dabbling Ducks | 0.44 | - | - | −0.34 | 0.42 | 0.37 | 0.26 |
| Shorebirds | 0.36 | 0.46 | - | - | - | - | 0.28 |
| Geese | - | 0.27 | -0.28 | - | - | - | 0.34 |
| Aerial Feeders | - | - | - | - | - | - | - |
| Aerial Predators | - | −0.24 | 0.49 | −0.37 | - | 0.38 | −0.43 |
| Shallow Divers | 0.32 | 0.27 | - | - | 0.32 | 0.26 | 0.41 |
| Plunge Divers | - | - | - | 0.25 | - | - | - |
| Upland Birds | - | - | - | −0.34 | 0.28 | 0.27 | - |


