Species Assemblage and Biogeography of Japanese Protura (Hexapoda) in Forest Soils

Abstract
:
1. Introduction
2. Methods
2.1. Study Area
2.2. Data Sets
2.3. Regional Comparison of Species Composition
2.4. Species Assemblages
3. Results
3.1. Data Sets
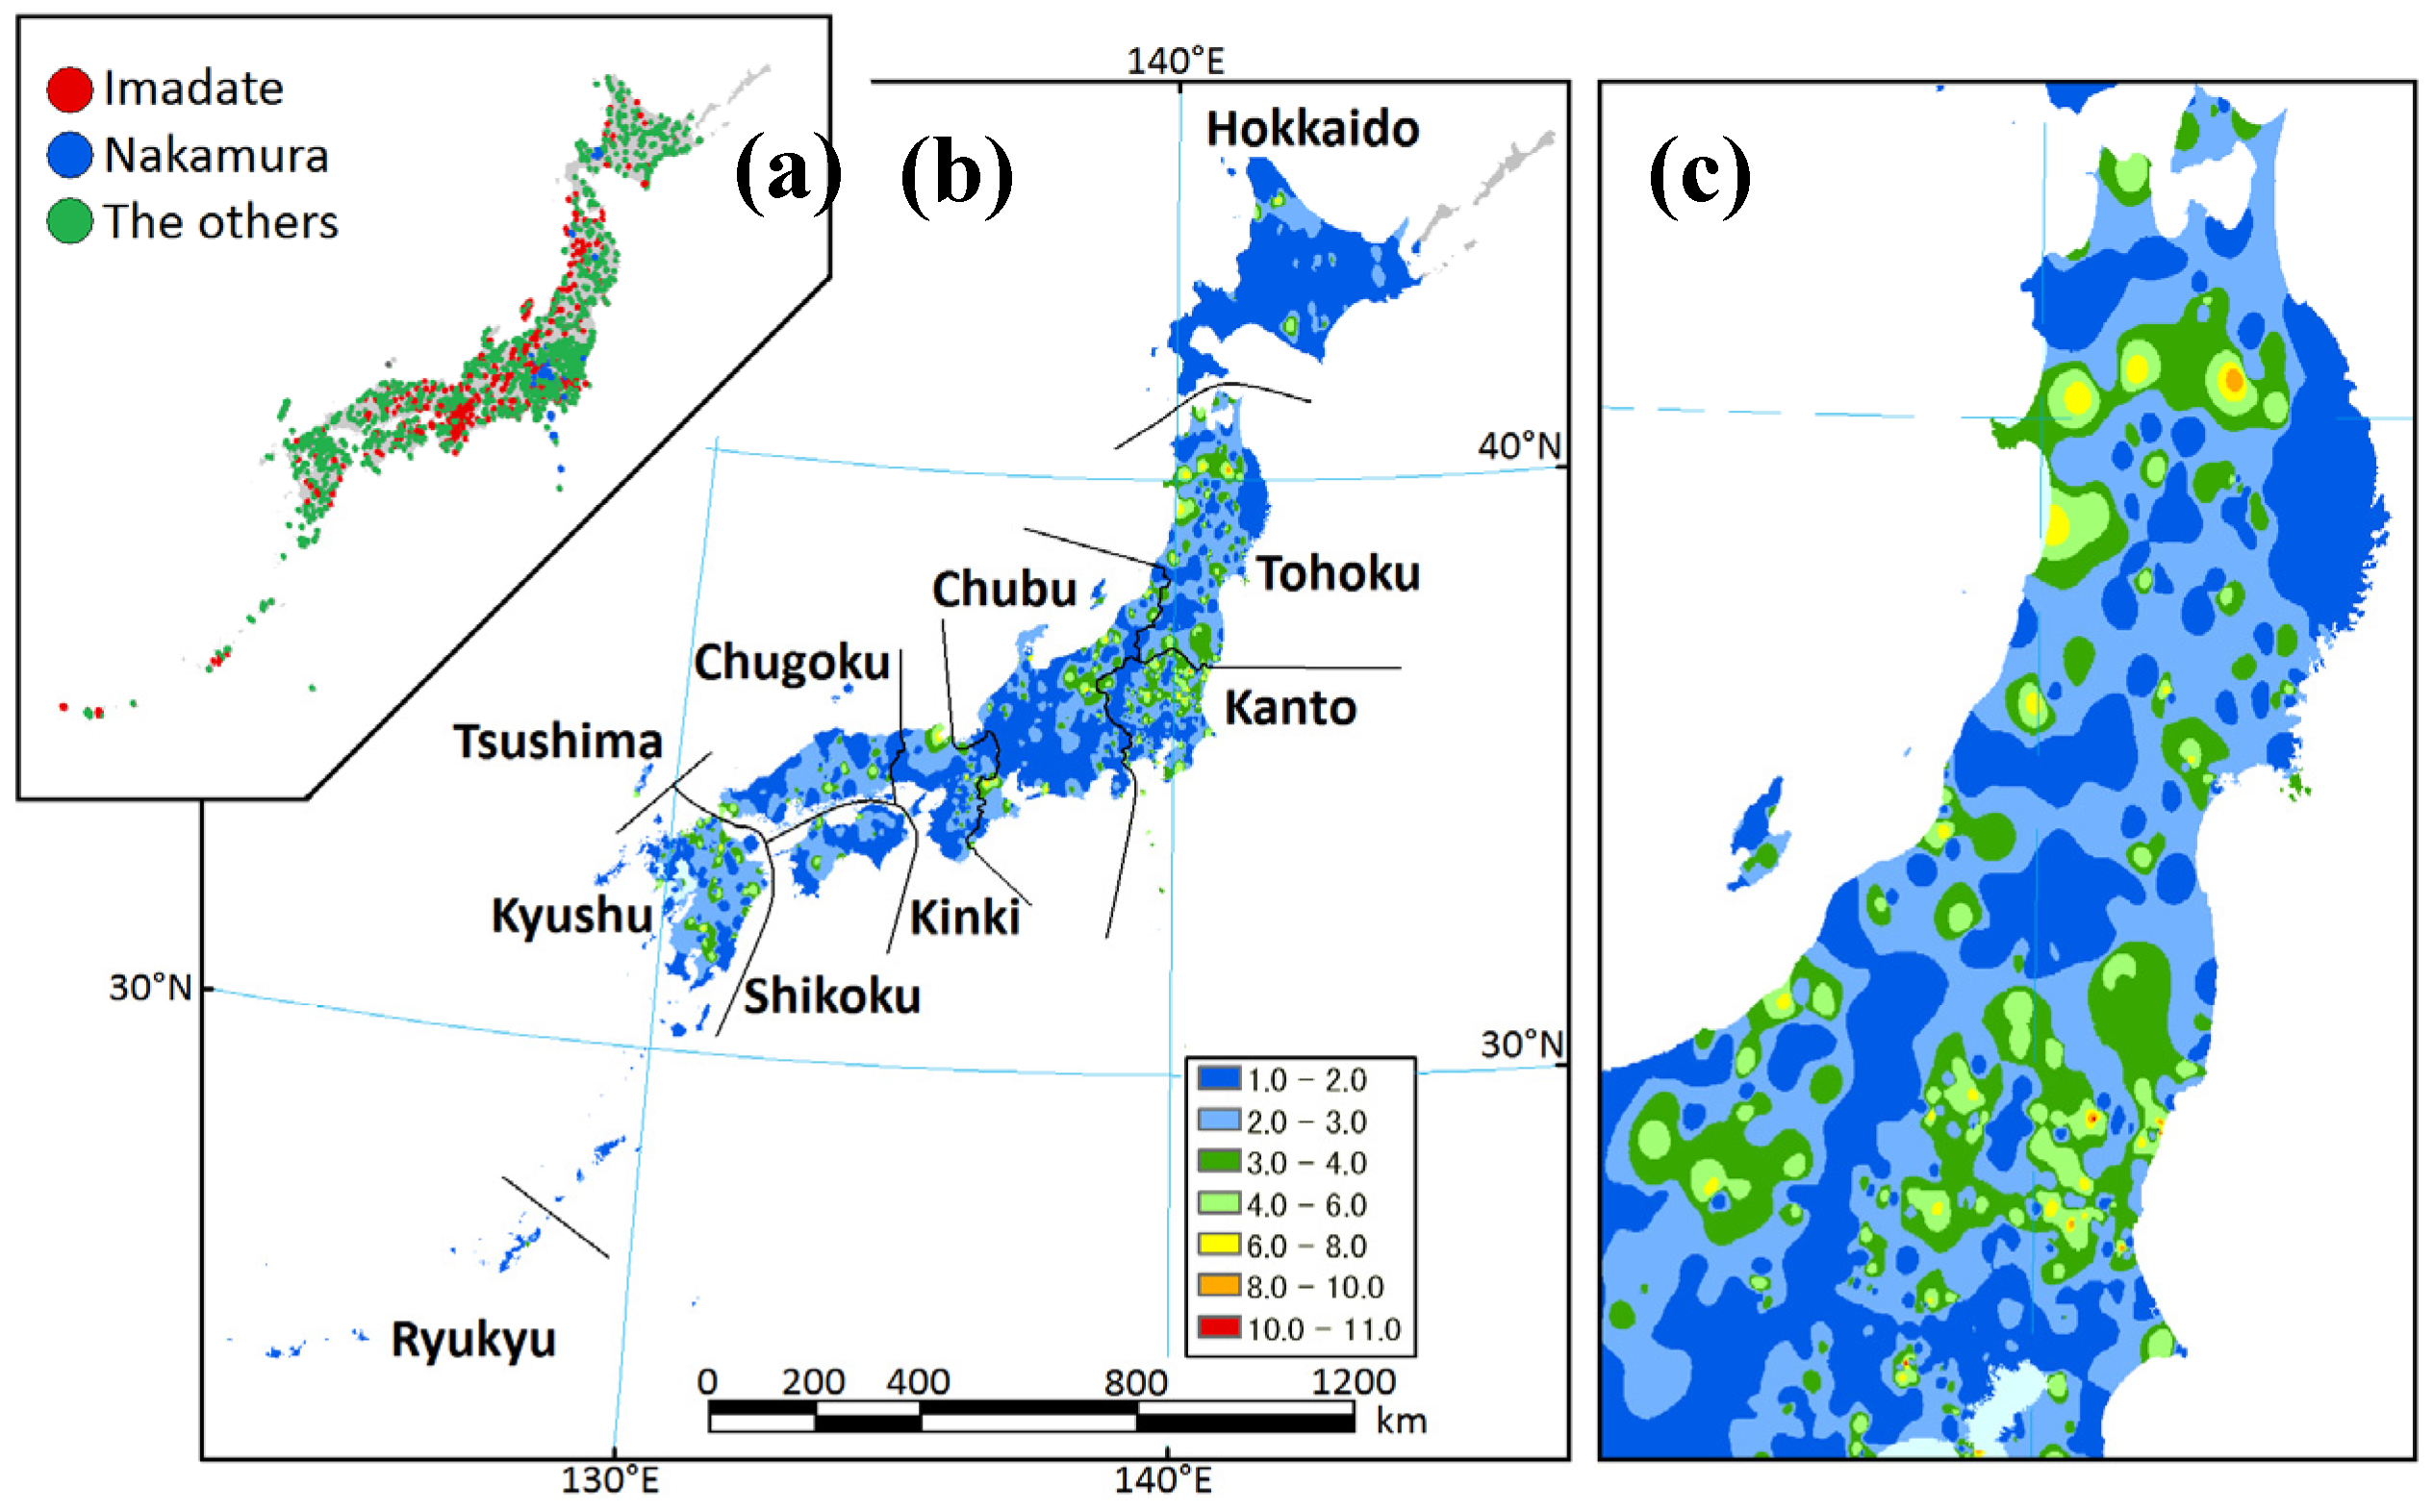
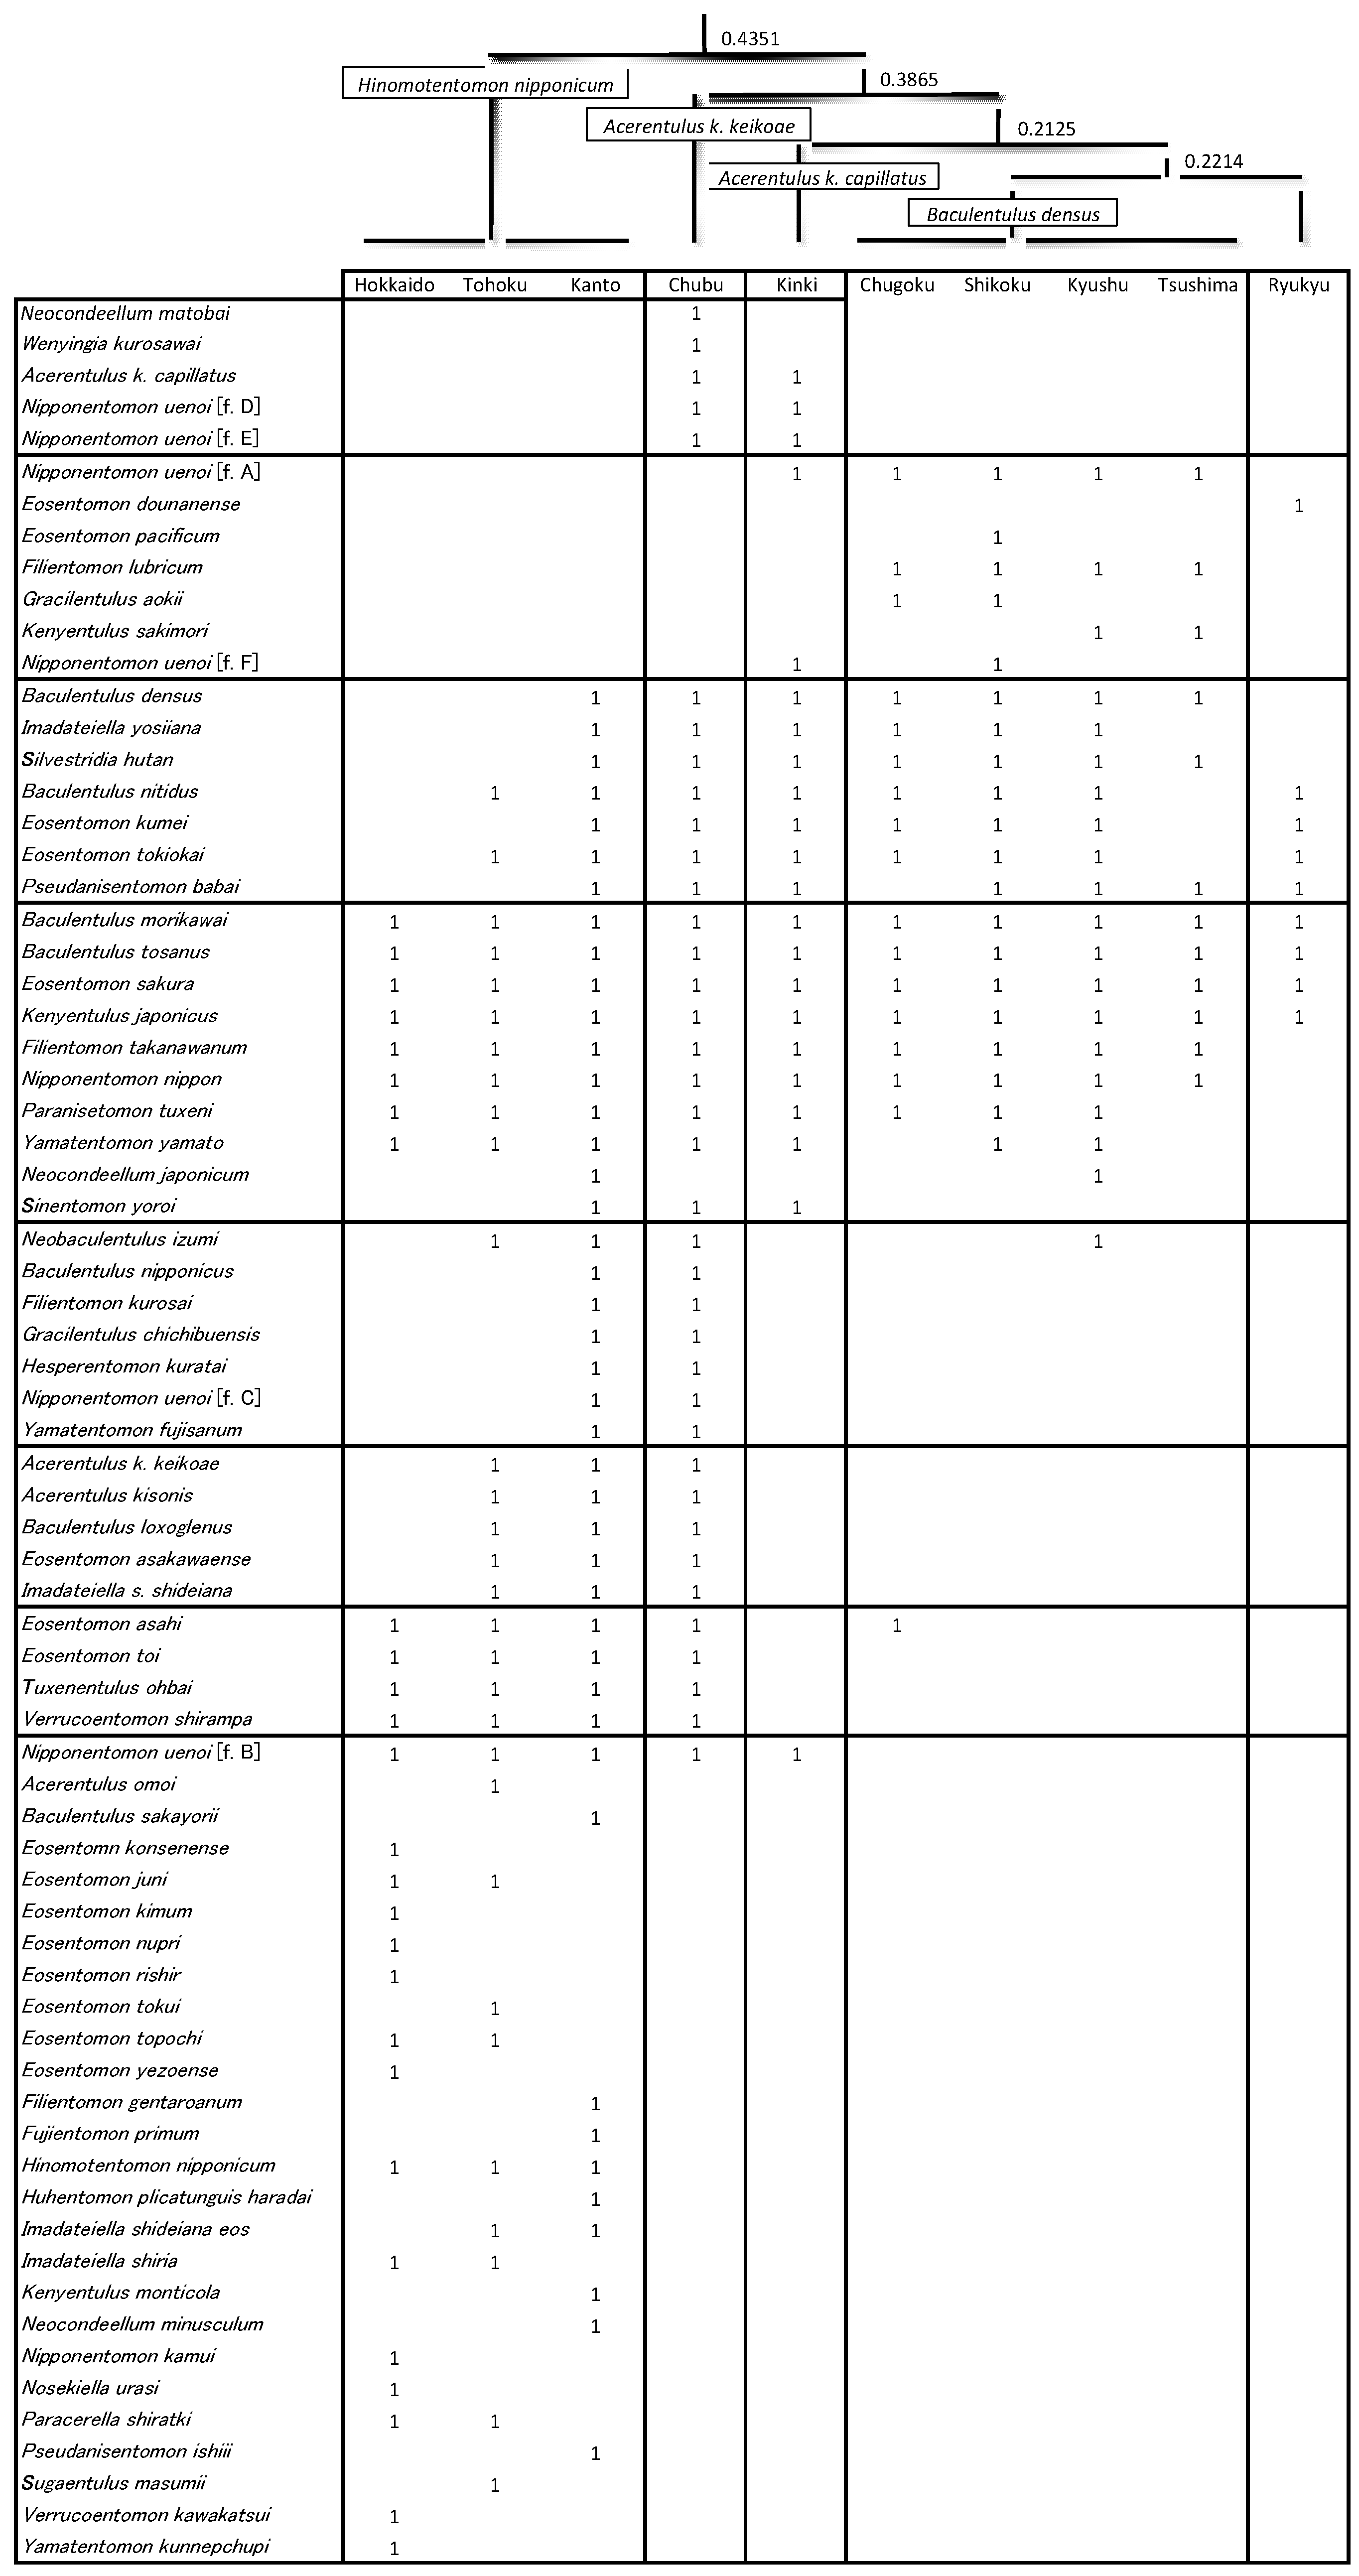
3.2. Regional Species Composition


| Region | Hokkaido | Tohoku | Kanto | Chubu | Kinki | Chugoku | Shikoku | Kyushu | Tsushima | Ryukyu | Total |
|---|---|---|---|---|---|---|---|---|---|---|---|
| Numbers of sampling localities | 480 | 339 | 743 | 568 | 299 | 171 | 116 | 296 | 34 | 64 | 3110 |
| Area (100 km2) | 846 | 669 | 324 | 726 | 273 | 319 | 183 | 422 | 7 | 23 | 3792 |
| Ratio (N/Area 100 km2) | 0.6 | 0.5 | 2.3 | 0.8 | 1.1 | 0.5 | 0.6 | 0.7 | 4.9 | 2.8 | |
| Total number of species | 27 | 30 | 43 | 45 | 22 | 17 | 20 | 20 | 12 | 9 | 71 |
| No. of expected species by Chao1 | 27.0 | 32.0 | 46.0 | 47.3 | 32.0 | 17.0 | 27.5 | 20.5 | 12.5 | 9.0 |

| Region | Hokkaido | Tohoku | Kanto | Chubu | Kinki | Chugoku | Shikoku | Kyushu | Tsushima |
|---|---|---|---|---|---|---|---|---|---|
| Tohoku | 0.82 | ||||||||
| Kanto | 0.60 | 0.89 | |||||||
| Chubu | 0.58 | 0.88 | 1.00 | ||||||
| Kinki | 0.49 | 0.61 | 0.74 | 0.93 | |||||
| Chugoku | 0.51 | 0.56 | 0.69 | 0.76 | 0.85 | ||||
| Shikoku | 0.45 | 0.53 | 0.67 | 0.81 | 0.98 | 0.96 | |||
| Kyushu | 0.44 | 0.49 | 0.62 | 0.71 | 0.95 | 0.95 | 0.96 | ||
| Tsushima | 0.36 | 0.37 | 0.51 | 0.57 | 0.70 | 0.81 | 0.81 | 0.83 | |
| Ryukyu | 0.16 | 0.31 | 0.43 | 0.51 | 0.59 | 0.58 | 0.55 | 0.57 | 0.43 |
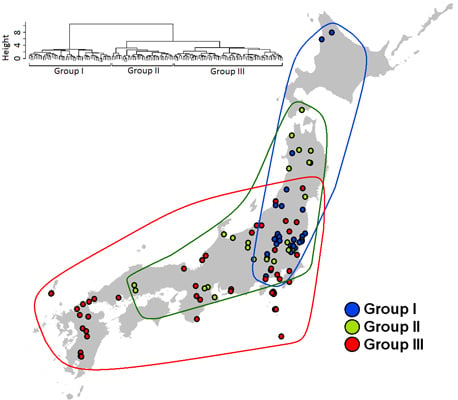
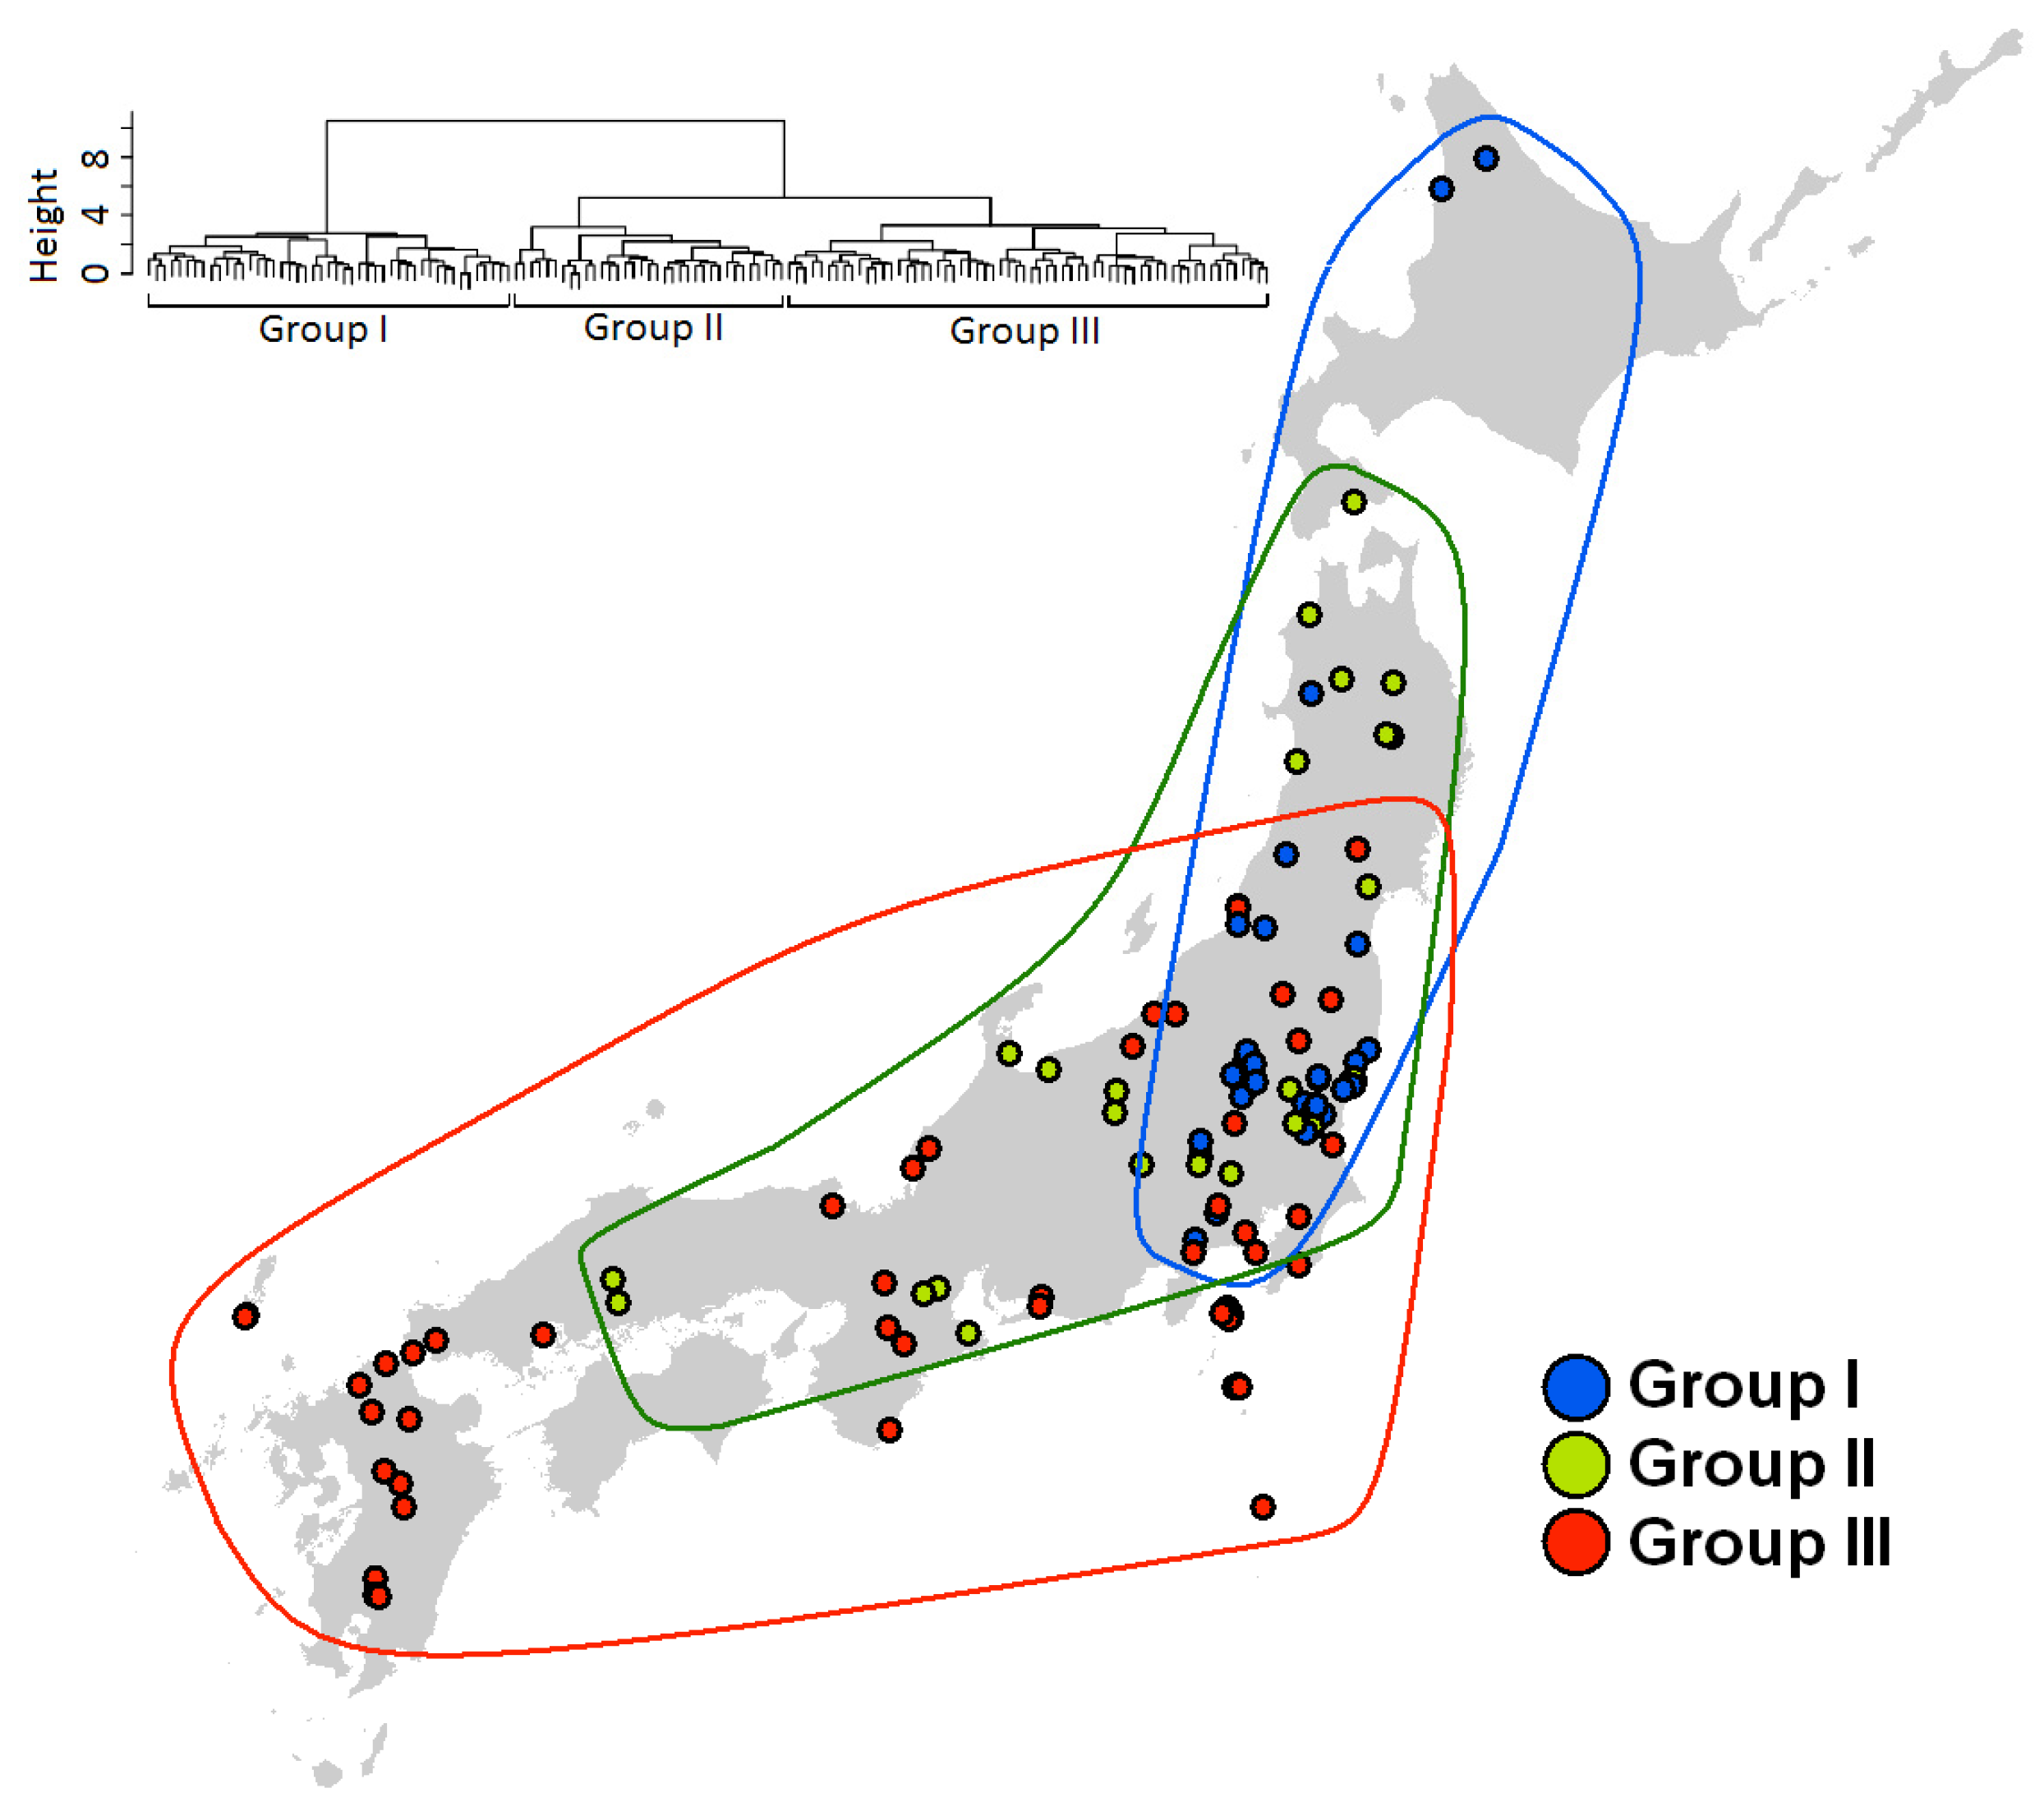
3.3. Species Assembly
| Region | Hokkaido | Tohoku | Kanto | Chubu | Kinki | Chugoku | Shikoku | Kyushu | Tsushima | Ryukyu |
|---|---|---|---|---|---|---|---|---|---|---|
| Numbers of sampling localities | 3 | 18 | 78 | 20 | 5 | 6 | 0 | 10 | 3 | 0 |
| Area (1000 km2) | 8.5 | 6.7 | 3.2 | 7.3 | 2.7 | 3.2 | 1.8 | 4.2 | 0.1 | 0.2 |
| Ratio (N/Area) | 0.4 | 2.7 | 24.1 | 2.8 | 1.8 | 1.9 | 0.0 | 2.4 | 42.9 | 0.0 |
| Group | No. of localities | Model | Constant | Standardized Regression Coefficient | AIC | ΔAIC | ||||
|---|---|---|---|---|---|---|---|---|---|---|
| Vegetation | Elevation | Max. Temp | Min. Temp | Precipitation | ||||||
| Gr1 | 47 | 1 | −0.87 | −0.81 | −0.59 | −0.49 | 153.05 | 0.00 | ||
| 2 | −0.86 | −1.08 | −0.77 | 153.85 | 0.80 | |||||
| 3 | −0.83 | −0.55 | −0.93 | 154.49 | 1.44 | |||||
| 4 | −0.86 | −0.15 | −0.85 | −0.53 | −0.53 | 154.53 | 1.48 | |||
| 5 | −0.86 | −0.23 | −1.09 | −0.78 | 154.62 | 1.56 | ||||
| 6 | −0.87 | −0.13 | −0.83 | −0.67 | −0.48 | 154.82 | 1.76 | |||
| full | −0.86 | −0.14 | −0.10 | −0.86 | −0.60 | −0.52 | 156.39 | 3.34 | ||
| null | −0.72 | 183.9 | 30.85 | |||||||
| Gr2 | 35 | 1 | −1.60 | −1.49 | 137.78 | 0.00 | ||||
| 2 | −1.60 | 0.19 | −1.45 | 138.97 | 1.19 | |||||
| 3 | −1.61 | 0.50 | −0.56 | −1.12 | 139.10 | 1.32 | ||||
| 4 | −1.60 | 0.14 | −1.46 | 139.32 | 1.55 | |||||
| Gr2 | 35 | 5 | −1.60 | 0.12 | −1.48 | 139.44 | 1.66 | |||
| 6 | −1.58 | 0.27 | 0.30 | −1.36 | 139.64 | 1.87 | ||||
| 7 | −1.60 | −0.07 | −1.46 | 139.71 | 1.93 | |||||
| full | −1.60 | 0.16 | 0.17 | 0.55 | −0.54 | −1.07 | 141.94 | 4.16 | ||
| null | −1.14 | 161.72 | 23.94 | |||||||
| Gr3 | 62 | 1 | −0.50 | 0.75 | 1.83 | 1.13 | 120.56 | 0.00 | ||
| 2 | −0.50 | −0.12 | 0.72 | 1.76 | 1.13 | 122.45 | 1.90 | |||
| 3 | −0.50 | 0.07 | 0.77 | 1.82 | 1.14 | 122.47 | 1.91 | |||
| full | −0.51 | 0.08 | −0.14 | 0.75 | 1.73 | 1.15 | 124.34 | 3.79 | ||
| null | −0.28 | 198.84 | 78.28 | |||||||
4. Discussion
5. Conclusions
Appendix
| Suborder | Family | Species |
|---|---|---|
| Acerentomoidea | Protentomidae | Fujientomon primum Imadaté, 1964 |
| Huhentomon plicatunguis haradai Imadaté, 1989 | ||
| Hesperentomon kuratai Imadaté, 1989 | ||
| Hinomotentomon nipponicum (Imadaté, 1964) | ||
| Neocondeellum japonicum Nakamura, 1990 | ||
| N. matobai (Imadaté, 1974) | ||
| N. minusculum Nakamura, 1990 | ||
| Acerentomidae | Acerentulus keikoae capillatus Imadaté, 1988 | |
| A. k. keikoae Imadaté, 1988 | ||
| A. kisonis Imadaté, 1961 | ||
| A. omoi Imadaté, 1988 | ||
| Tuxenentulus ohbai Imadaté, 1974 | ||
| Wenyingia kurosawai (Imadaté, 1986) | ||
| Sugaentulus masumii Imadaté, 1978 | ||
| Yamatentomon fujisanum Imadaté, 1964 | ||
| Y. kunnepchupi Imadaté, 1964 | ||
| Y. yamato (Imadaté et Yosii, 1956) | ||
| Filientomon gentaroanum Nakamura, 2001 | ||
| F. kurosai (Imadaté, 1974) | ||
| F. lubricum (Imadaté, 1956) | ||
| F. takanawanum (Imadaté, 1956) | ||
| Kenyentulus japonicus (Imadaté, 1961) | ||
| K. monticola Nakamura, 1990 | ||
| K. sakimori (Imadaté, 1977) | ||
| Gracilentulus aokii Imadaté, 1982 | ||
| G. chichibuensis Nakamura, 1995 | ||
| Baculentulus densus (Imadaté, 1960) | ||
| B. loxoglenus Yin, 1980 | ||
| B. morikawai (Imadaté et Yosii, 1956) | ||
| Acerentomoidea | Acerentomidae | B. nipponicus Nakamura, 1985 |
| B. nitidus (Imadaté et Yosii, 1959) | ||
| B. sakayorii Nakamura, 1995 | ||
| B. tosanus (Imadaté et Yosii, 1959) | ||
| Neobaculentulus izumi (Imadaté, 1965) | ||
| Silvestridia hutan Imadaté, 1965 | ||
| Verrucoentomon kawakatsui (Imadaté, 1964) | ||
| Nosekiella urasi Imadaté, 1981 | ||
| Paracerella shiratki (Imadaté, 1964) | ||
| Imadateiella shideiana eos (Imadaté, 1974) | ||
| I. s. shideiana (Imadaté, 1964) | ||
| I. shiria (Imadaté, 1964) | ||
| I. yosiiana (Imadaté, 1961) | ||
| I. shiria (Imadaté, 1964) | ||
| I. yosiiana (Imadaté, 1961) | ||
| Nipponentomon kamui Imadaté, 1965 | ||
| N. nippon (Yoshii, 1938) | ||
| N. uenoi uenoi Imadaté et Yosii, 1959 [f. A] | ||
| N. uenoi paucisetosum Imadaté, 1965 [f. B] | ||
| N. uenoi paucisetosum Imadaté, 1965 [f. C] | ||
| N. uenoi paucisetosum Imadaté, 1965 [f. D] | ||
| N. uenoi paucisetosum Imadaté, 1965 [f. E] | ||
| N. uenoi paucisetosum Imadaté, 1965 [f. F] | ||
| Sinentomoidea | Sinentomidae | Sinentomon yoroi Imadaté, 1977 |
| Eosentomoidea | Eosentomidae | Eosentomon asahi Imadaté, 1961 |
| E. asakawaense Imadaté, 1961 | ||
| E. dounanense Imadaté, 1994 | ||
| E. juni Imadaté, 1994 | ||
| E. kimum Imadaté, 1964 | ||
| E. konsenense Imadaté, 1994 | ||
| E. kumei Imadaté et Yosii, 1959 | ||
| E. nupri Nakamura, 1983 | ||
| E. pacificum Imadaté et Yosii, 1959 | ||
| E. rishir Nakamura, 2004 | ||
| E. sakura Imadaté et Yosii, 1959 | ||
| E. toi Imadaté, 1964 | ||
| E. tokiokai Imadaté, 1964 | ||
| E. tokui Imadaté, 1974 | ||
| E. topochi Imadaté, 1964 | ||
| E. yezoense Nakamura, 1983 | ||
| Paranisentomon tuxeni (Imadaté et Yosii, 1959) | ||
| Pseudanisentomon babai (Imadaté, 1964) | ||
| P. ishiii Nakamura,1996 |
| Species | Group | IndVal | P value | Frequency |
|---|---|---|---|---|
| Eosentomon asakawaense | 1 | 0.67 | 0.001 | 48 |
| Eosentomon asahi | 1 | 0.63 | 0.001 | 56 |
| Nipponentomon uenoi paucisetosum [f. B] | 1 | 0.37 | 0.001 | 48 |
| Acerentulus k. keikoae | 1 | 0.32 | 0.001 | 23 |
| Baculentulus sakayorii | 1 | 0.17 | 0.001 | 8 |
| Tuxenentulus ohbai | 1 | 0.13 | 0.049 | 19 |
| Imadateiella shideiana eos | 1 | 0.09 | 0.049 | 8 |
| Eosentomon sakura | 2 | 0.37 | 0.004 | 102 |
| Filientomon takanawanum | 2 | 0.33 | 0.001 | 46 |
| Paranisentomon tuxeni | 2 | 0.32 | 0.002 | 69 |
| Baculentulus tosanus | 2 | 0.29 | 0.032 | 83 |
| Nipponentomon uenoi paucisetosum [f. C] | 2 | 0.20 | 0.001 | 7 |
| Acerentulus omoi | 2 | 0.14 | 0.003 | 5 |
| Acerentulus kisonis | 2 | 0.13 | 0.042 | 17 |
| Yamatentomon yamato | 2 | 0.09 | 0.048 | 10 |
| Nipponentomon uenoi paucisetosum [f. D] | 2 | 0.09 | 0.019 | 3 |
| Kenyentulus japonicus | 3 | 0.57 | 0.001 | 77 |
| Eosentomon tokiokai | 3 | 0.47 | 0.001 | 37 |
| Neocondeellum japonicum | 3 | 0.19 | 0.001 | 12 |
| Nipponentomon uenoi uenoi [f. A] | 3 | 0.16 | 0.001 | 10 |
| Filientomon lubricum | 3 | 0.15 | 0.003 | 9 |
| Baculentulus nitidus | 3 | 0.11 | 0.015 | 11 |
| Neobaculentulus izumi | 3 | 0.11 | 0.032 | 11 |
Acknowledgments
References
- Rockstrom, J.; Steffen, W.; Noone, K.; Persson, A.; Chapin, F.S., III; Lambin, E.F.; Lenton, T.M.; Scheffer, M.; Folke, C.; Schellnhuber, H.J.; et al. A safe operating space for humanity. Nature 2009, 461, 472–475. [Google Scholar]
- Tylianakis, J.M.; Raphael, K.D.; Jordi, B.; David, A.W. Global change and species interactions in terrestrial ecosystems. Eco. Lett. 2008, 11, 1351–1363. [Google Scholar] [CrossRef]
- Fierer, N.; Strickland, M.S.; Liptzin, D.; Bradford, M.A.; Cleveland, C.C. Global patterns in belowground communities. Eco. Lett. 2009, 12, 1238–1249. [Google Scholar] [CrossRef]
- Lilleskov, E.A.; Mattson, W.J.; Storer, A.J. Divergent biogeography of native and introduced soil macroinvertebrates in North America north of Mexico. Divers. Distrib. 2008, 14, 893–904. [Google Scholar] [CrossRef]
- Finlay, B.J. Gobal dispersal of free-living microbial Eukaryote species. Science 2002, 296, 1061–1063. [Google Scholar] [CrossRef]
- Szeptycki, A. Catalogue of the World Protura; Wydawnictwa Instytutu Systematyki I Ewolucji Zwierzat Polskiej Akademii Nauk: Krakow, Poland, 2007. [Google Scholar]
- Chao, R.F.; Chen, C.S. The genus Eosentomon of Taiwan (Protura: Eosentomidae). Chin J. Entomol. 1996, 16, 303–321. [Google Scholar]
- Chao, R.F.; Chen, C.S. A new species of Tuxentntulus Imadaté (Protura: Acerentomidae) from Taiwan. Chin. J. Entomol. 1999, 19, 293–295. [Google Scholar]
- Chao, R.F.; Chen, C.S. Two new species of the genus Berberentulus Tuxen (Protura: Acerentomidae) from Taiwan. Chin. J. Entomol. 1999, 19, 209–215. [Google Scholar]
- Chao, R.F.; Lee, H.R.; Chen, C.S. Four new species of Acerentomidae (Insecta: Protura) in Taiwan. Chin. J. Entomol. 1998, 18, 235–246. [Google Scholar]
- Imadaté, G. Contribution to the proturan fauna of Korea. Ann. Historico-Nat. Musei Natl. Hung. 1973, 65, 151–155. [Google Scholar]
- Imadaté, G.; Szeptycki, A. The proturans from North Korea. Bull. Natl. Sci. Mus. Tokyo Ser. A (Zoology) 1976, 2, 267–276. [Google Scholar]
- Nakamura, O. Proturan from Taiwan. Edaphologia 1997, 59, 17–53. [Google Scholar]
- Szeptycki, A.; Imadaté, G. The proturans from North Korea (II). Bull. Natl. Sci. Mus. Tokyo Ser. A (Zoology) 1987, 13, 165–183. [Google Scholar]
- Yin, W.Y. Protura, Fauna Sinica, Arthropoda; Science Press: Beijing, China, 1999. [Google Scholar]
- Imadaté, G. Protura; Keigaku Publishing Company, Ltd.: Tokyo, Japan, 1974. [Google Scholar]
- Imadaté, G. Contributions towards a revision of the proturan fauna of Japan (I): New collecting records from Hokkaido. Bull. Coll. Liber. Arts Sci. Tokyo Med. Dent. Univ. 1979, 9, 1–17. [Google Scholar]
- Imadaté, G. Polymorphism in Nipponentomon uenoi Imadaté et Yosii (Protura). Edaphologia 1988, 38, 17–26. [Google Scholar]
- Imadaté, G. Contributions towards a revision of the proturan fauna of Japan(IX): Collecting data of Acerentomid and Sinentomid species in the Japanese Islands. Bull. Coll. Liber. Arts Sci. Tokyo Med. Dent. Univ. 1994, 24, 45–70. [Google Scholar]
- Imadaté, G. Contributions towards a revision of the proturan fauna of Japan(X): Collecting data of Eosentomid species in the Japanese Islands. Bull. Coll. Liber. Arts Sci. Tokyo Med. Dent. Univ. 1995, 25, 1–37. [Google Scholar]
- Imadaté, G.; Harada, H. Contributions towards a revision of the proturan fauna of Japan(Iii): New collecting records from Shikoku and Western Part of Honshu. Bull. Coll. Liber. Arts Sci. Tokyo Med. Dent. Univ. 1983, 13, 27–51. [Google Scholar]
- Imadaté, G.; Harada, H. Contributions towards a revision of the proturan fauna of Japan (V): New collecting records from the Central Part of Honshu. Bull. Coll. Liber. Arts Sci. Tokyo Med. Dent. Univ. 1987, 17, 19–33. [Google Scholar]
- Imadaté, G.; Kinjo, N. Contributions towards a revision of the proturan fauna of Japan(IV): New collecting records from the Northern Part of Honshu. Bull. Coll. Liber. Arts Sci. Tokyo Med. Dent. Univ. 1985, 15, 35–53. [Google Scholar]
- Imadaté, G.; Nakamura, O. Contributions towards a revision of the proturan fauna of Japan (VI): New collecting records from the Eastern Part of Honshu. Bull. Coll. Liber. Arts Sci. Tokyo Med. Dent. Univ. 1989, 19, 39–76. [Google Scholar]
- Imadaté, G.; Ohnishi, J. Contributions towards a revision of the proturan fauna of Japan (VIII): Further collecting records from Northern and Eastern Japan. Bull. Coll. Liber. Arts Sci. Tokyo Med. Dent. Univ. 1993, 23, 31–65. [Google Scholar]
- Imadaté, G.; Tanaka, S. Contributions towards a revision of the proturan fauna of Japan(II): New collecting records from Kyushu and the Ryukyu Islands. Bull. Coll. Liber. Arts Sci. Tokyo Med. Dent. Univ. 1981, 11, 1–16. [Google Scholar]
- Imadaté, G.; Tanaka, S. Contributions towards a revision of the proturan fauna of Japan(VII): Further collecting records from Central and Western Japan. Bull. Coll. Liber. Arts Sci. Tokyo Med. Dent. Univ. 1991, 21, 71–92. [Google Scholar]
- Nakamura, O.; Yoshida, A. Protura. In Insect Fauna of Kanagawa; Insect Seminor of Kanagawa: Kanagawa, Japan, 2004; pp. 33–36. [Google Scholar]
- Nakamura, O.; Hagiwara, Y.; Tamura, H. Fauna and vertical distribution of Protura at Mt. Komogatake of the Yakeishi Mountains. J. Coll. Arts Sci. Showa Univ. 2003, 34, 1–7. [Google Scholar]
- Nakamura, O.; Hagiwara, Y. Proturan communities under three different vegetations in adjacent area. Bull. Saitama Mus. Nat. Hist. 2006, 23, 17–22. [Google Scholar]
- Nakamura, O. Taxonomic revision of the family Eosentomidae (Hexapoda: Protura) from Japan. Zootaxa 2010, 2701, 1–109. [Google Scholar]
- Nakamura, O. Protura. In The 4th General Research Report of the Ibaraki Nature Museum; Ibaraki Nature Museum: Ibaraki, Japan, 2007; pp. 371–373. [Google Scholar]
- Nakamura, O. Protura. In A Monitoring Development for the Forest Ecosystem Conservation of the Shirakami-Sanchi Wolrd Heritage Site and a Forest Management Method Development for Harmonization with Forest Utilization in Its Surrounding Area; Ministry of the Environment: Tokyo, Japan, 2004; pp. 236–238. [Google Scholar]
- Nakamura, O. Protura. In The 3rd General Research Report of the Ibaraki Nature Museum; Ibaraki Nature Museum: Ibaraki, Japan, 2004; pp. 400–402. [Google Scholar]
- Nakamura, O. A new species of the genus Eosentomon (Insecta: Protura: Eosentomidae) from Rishiri Island, Hokkaido, Northern Japan. Species Divers. 2004, 9, 359–366. [Google Scholar]
- Nakamura, O. Protura and Diplura. In Research Report of the Biodiversity Area, Northern Foot of the Mount Fuji; Yamanashi Institute of Environmental Science and Ecological Research Association of Northern Foot of the Mount Fuji: Yamanashi, Japan, 2003; pp. 156–158. [Google Scholar]
- Nakamura, O. Protura. In Soil Animals in Tochigi; Tochigi Prefecture: Tochigi, Japan, 2002; pp. 205–215. [Google Scholar]
- Nakamura, O. Protura. In The 2nd General Research Report of the Ibaraki Nature Museum; Ibaraki Nature Museum: Ibaraki, Japan, 2001; pp. 368–371. [Google Scholar]
- Nakamura, O. A new species of the genus Filientomon from Central Japan (Protura: Acerentomidae). Edaphologia 2001, 31, 33–37. [Google Scholar]
- Nakamura, O. Corrections to and notes on Protura and Diplura in “Soil Arthropod Biota of Chiba City” (Ishii 1996, 1997). Bull. Saitama Mus. Nat. Hist 2000, 18, 1–6. [Google Scholar]
- Nakamura, O. Proturans from the garden of the Imperial Palace, Tokyo. Mem. Natl. Sci. Mus. Tokyo 2000, 36, 497–504. [Google Scholar]
- Nakamura, O. The records of Protentomidae. Edaphologia 1999, 62, 97. [Google Scholar]
- Nakamura, O. Soil animals of Kami-Izumi village. In Kami-Izumi Mura Shi Shizen-Hen Mokuroku; Kami-Izumi Mura: Saitama, Japan, 1999; pp. 139–145. [Google Scholar]
- Nakamura, O. Occurrence of Paracerella shiratki Imadaté (Protura, Acerentomidae) in Honshu. Edaphologia 1999, 63, 87. [Google Scholar]
- Nakamura, O. Protura from the Tajimagahara Wild Primrose Field, Urawa, Saitama. Bull. Saitama Mus. Nat. Hist 1999, 17, 1–3. [Google Scholar]
- Nakamura, O. The proturans from and around the Ozegahara moor. In Scientific Research of the Oze Area in central Japan; Oze Scientific Research Group: Tochigi, Japan, 1998; pp. 328–330. [Google Scholar]
- Nakamura, O. Protura. In The 1st General Research Report of the Ibaraki Nature Museum; Ibaraki Nature Museum: Ibaraki, Japan, 1998; pp. 328–330. [Google Scholar]
- Nakamura, O. A new species of the genus Pseudanisentomon (Protura, Eosentomidae) from Central Japan. Edaphologia 1996, 57, 7–12. [Google Scholar]
- Nakamura, O. A new species and a new record of the genus Baculentulus (Protura, Acerentomidae) from Japan. Jpn. J. Entomol. 1995, 63, 333–345. [Google Scholar]
- Nakamura, O. A new species of the genus Gracilentulus (Protura) from Japan. Edaphologia 1995, 54, 1–8. [Google Scholar]
- Nakamura, O. Proturans collected from roof garden of the building of the Saitama Museum of Natural History. Bull. Saitama Mus. Nat. Hist. 1994, 12, 61–63. [Google Scholar]
- Bu, Y.; Yin, W.Y. A new species of proturan from Northeast China (Protura, Acerentomidae). Acta Zootaxonomica Sin. 2007, 32, 56–60. [Google Scholar]
- Bu, Y.; Yin, W.Y. Occurrence of Nosekiella Rusek 1974 and Nienna Szeptycki 1988 (Protura: Nipponentomidae: Verrucoentominae) in China. Ann. Soc. Entomol. Fr. 2008, 44, 201–207. [Google Scholar]
- Maehara, T.; Hagiwara, Y.; Ishii, K.; Ito, R.; Kurozumi, T.; Sakayori, H.; Suganami, Y.; Tamura, H.; Chinone, S.; Nakamura, O.; et al. Soil animals from Rishiri Island, Northern Hokkaido. Rishiri Stud. 2003, 22, 55–72. [Google Scholar]
- Suma, Y.; Hirauchi, Y.; Ishii, K.; Ishikawa, K.; Shiba, M.; Nomura, S.; Sato, H.; Asama, S.; Ishizuka, K.; Nakamura, O.; et al. Fauna of soil animals of Minami-Rokuroshi Highland. Bull. Toyama Sci. Mus. 2002, 25, 69–87. [Google Scholar]
- Takai, Y. Invertebrates fauna in the Miya Village. In Miya-Son-Shi Shizenshi-Shiryo; Miya Village: Gifu, Japan, 2004; pp. 51–203. [Google Scholar]
- Wu, D.H.; Yin, W.Y. New records of the genera Acerentulus and Brasilidia (Protura: Acerentomidae) from China, with description of two new species. Zootaxa 2007, 1561, 53–61. [Google Scholar]
- Wu, D.H.; Yin, W.Y. The protura from Changbai Mountain, Northeastern China I: Genera Chosonentulus Imadaté & Szeptycki and Filientomon Rusek. Ann. Soc. Entomol. Fr. 2008, 44, 379–384. [Google Scholar]
- Wu, D.H.; Yin, W.Y. Two new species of Protura (Protentomidae and Hesperentomidae) from Northeastern China. Orient. Insects 2008, 42, 237–246. [Google Scholar] [CrossRef]
- The Free Address Geocoding Service of CSV Formatted Files; The University of Tokyo Website. Available online: http://newspat.csis.u-tokyo.ac.jp/geocode/modules/addmatch/index.php?content_id=1/ (assessed on 24 August 2012).
- Hill, M.O. TWINSPAN: A Fortran Program for Arranging Multivariate Data in an Ordered Two-way Table by Classification of the Individuals and Attributes; Ecology and Systematics, Cornell University: Ithaca, NY, USA, 1979. [Google Scholar]
- McCune, B.; Mefford, M. PC-ORD for Windows: Multivariate Analysis of Ecological Data. Version 4; MjM Software Desing: Gleneden Beach, OR, USA, 1999. [Google Scholar]
- R Development Core Team, R: A Language and Environment for Statistical Computing; R Foundation for Statistical Computing: Vienna, Austria, 2011.
- Dufrêne, M.; Legendre, P. Secies assemblages and indicator specires: The need for a flexibile asymmetrial approach. Ecolog. Monogr. 1997, 67, 345–366. [Google Scholar]
- Borcard, D.; Gillet, F.; Legendre, P. Numerical Ecology with R; Springer Science + Business Media: New York, NY, USA, 2011. [Google Scholar]
- Mesh Climate Data of Japan; Japan Meteological Agency Website. Available online: http://data.sokki.jmbsc.or.jp/cdrom/mesh_climatic_data/documents/index_e.htm/ (assessed on 24 August 2012).
- Colwell, R.K.; Coddington, J.A. Estimating terrestrial biodiversity through extraporation. Philos. Trans. R. Soceity B 1994, 345, 101–118. [Google Scholar]
- Imadate, G.; Ohnishi, J. Contributions towards a revision of the proturan fauna of Japan (VIII): Further collecting records from northern and eastern Japan. Bull. Coll. Liber. Arts Sci. Tokyo Med. Dent. Univ. 1993, 23, 31–65. [Google Scholar]
- Saito, S.; Yokoyama, K.; Tsutsumi, Y.; Tanimura, Y. Formation of Japanese Islands. In Natural History of the Japanese Islands; Tohkai University Press: Kanagawa, Japan, 2006; pp. 23–40. [Google Scholar]
- Ohshima, K. The history of straits around the Japanese Islands in the Late-Quaternary. Quat. Res 1990, 29, 193–208. [Google Scholar] [CrossRef]
- Ohshima, K. History of straits formation. Determine factor as animal distributions. Geol. News 1978, 289, 14–24. [Google Scholar]
© 2012 by the authors; licensee MDPI, Basel, Switzerland. This article is an open-access article distributed under the terms and conditions of the Creative Commons Attribution license (http://creativecommons.org/licenses/by/3.0/).
Share and Cite
Kaneko, N.; Minamiya, Y.; Nakamura, O.; Saito, M.; Hashimoto, M. Species Assemblage and Biogeography of Japanese Protura (Hexapoda) in Forest Soils. Diversity 2012, 4, 318-333. https://doi.org/10.3390/d4030318
Kaneko N, Minamiya Y, Nakamura O, Saito M, Hashimoto M. Species Assemblage and Biogeography of Japanese Protura (Hexapoda) in Forest Soils. Diversity. 2012; 4(3):318-333. https://doi.org/10.3390/d4030318
Chicago/Turabian StyleKaneko, Nobuhiro, Yukio Minamiya, Osami Nakamura, Masayuki Saito, and Minori Hashimoto. 2012. "Species Assemblage and Biogeography of Japanese Protura (Hexapoda) in Forest Soils" Diversity 4, no. 3: 318-333. https://doi.org/10.3390/d4030318