Article

Microbial Community Composition as Affected by Dryland Cropping Systems and Tillage in a Semiarid Sandy Soil

1
USDA-ARS, Cropping Systems Research Laboratory, Wind Erosion and Water Conservation Unit, 3810 4th St., Lubbock, TX 79415, USA
2
Research and Testing Laboratories and Medical Biofilm Research Institute, 4321 Marsha Sharp Freeway, Lubbock, TX 79407, USA
3
Department of Biological Sciences, Texas Tech University, Lubbock, TX 79409, USA
4
USDA-ARS, Southern Plains Area, 1001 Holleman Drive East, College Station, TX 77840-4117, USA
*
Author to whom correspondence should be addressed.
Diversity 2010, 2(6), 910-931; https://doi.org/10.3390/d2060910
Submission received: 19 April 2010 / Revised: 28 May 2010 / Accepted: 1 June 2010 / Published: 7 June 2010
(This article belongs to the Special Issue Microbial Diversity: From the Biosphere to the Human Microbiome)

Abstract

:
This study evaluated microbial communities of soil (0–10 cm) as affected by dryland cropping systems under different tillage practices after 5 years. The soil type was an Olton sandy loam with an average of 16.4% clay, 67.6% sand and 0.65 g kg−1 of organic matter (OM). The cropping systems evaluated were grain sorghum (Sorghum bicolor L.)—cotton (Gossypium hirsutum) (Srg-Ct), cotton-winter rye (Secale cereale)-grain sorghum (Ct-Rye-Srg), and a rotation of forage (f) sorghum (Sorghum bicolor L. and Sorghum sudanense) with winter rye (Srf-Rye), which were under no-tillage (nt) and conventional tillage (ct) practices. Soil microbial communities under cotton based cropping systems (Srg-Ct and Ct-Rye-Srg) showed lower fungal:bacterial ratios compared to the soil under Srf-Rye. Soil under Srf-Rye showed higher population densities of Bacteroidetes and Proteobacteria while lower Actinobacteria compared to Srg-Ct and Ct-Rye-Srg. Chloroflexi, Gemmatimonadetes and Verrucomicrobiae were higher in tilled soil compared to the no-tilled plots. Regardless the limited irrigation available to sustain agricultural production within these dryland cropping systems, this study demonstrated that differences in microbial communities are more affected by crop rotation than tillage management history. Although soil fungal diversity was not analyzed in this study, pyrosequencing suggests that tillage practices can affect bacterial phyla distribution in this sandy soil.
USDA Disclaimer:
Trade names and company names are included for the benefit of the reader and do not infer any endorsement or preferential treatment of the product by USDA-ARS.

1. Introduction

Little is known about how soil microbial communities are affected by dryland cropping systems under different tillage practices in semiarid regions, which have limited water availability to sustain crop productivity. Shifts in soil microbial community composition to higher fungal:bacterial ratios with diversified cropping systems and conservation tillage have been associated with potential changes in soil quality and C sequestration as fungal populations tend to have higher C assimilation efficiencies than bacterial populations, because they store higher amounts of the C via metabolic processes [1,2]. However, bacterial populations play an important role in soil processes including N fixation, and in decomposition of plant residues, organic matter and xenobiotic compounds. Semiarid soils under cotton (Gossypium hirsutum L.) based cropping systems in the semiarid region of Texas U.S., which are also generally intensively tilled since 1940, have shown to support a microbial community structure with lower fungal:bacterial ratios compared to those under pasture or cotton and peanut rotations [2,3]. Therefore, more information about the composition and distribution of soil bacterial populations under different cropping systems is needed to expand our understanding of the bacteria associated to soil processes in these agricultural soils. Furthermore, this information will contribute to a better understanding of agroecosystem functional dynamics under differing cropping-management practices.
Broad-level microbial community characterization is possible using fatty acid methyl ester (FAME) profiling according to the relative abundance of soil FAME indicators for different microbial functional groups. The phospholipid fatty acid methods (PLFA) provide a reliable approach to characterize the existing microbial communities of soil because phospholipids from active microbial cells are extracted from soil using organic solvents [4]. However, these methods are time consuming as several steps are required before the fatty acids are methylated to produce the FAMEs. The FAME-MIDI (Microbial IDentification Inc.) and FAME-ester-linked (EL) are more simple methods because the first steps involve in-situ hydrolysis and methylation reactions of fatty acids without the phospholipids extraction step. Thus, both methods may deal with fatty acids from soil organic matter, and thus, providing a historical evaluation of the microbial communities of a soil. However, previous studies have suggested that the EL method only extract ester-linked fatty acids (not organic bound fatty acids) because it employs a mild alkaline hydrolysis to lyse cells and release fatty acids from lipids once the ester bonds are broken [5]. Other studies have suggested that insignificant amounts of MIDI may be extracted in sandy soils with low organic matter (<1%) content [3,6]. Comparison of the MIDI- and EL- FAME methods were accomplished for coarse-silty and fine-loamy soils, but it has not been done for sandy soils. Regardless of the method, fungal structural groups have been evaluated using saprophytic indicators such as 18:1ω9c, 18:2ω6c, 18:3ω6c, and 20:5ω3 [4,7,8,9,10,11,12] and other indicators for arbuscular mycorrhiza such as 16:1ω 5c, 20:1ω9c, 20:2ω6c, and 22:1ω9c [10,11,13]. Bacterial structural groups have been evaluated according to the abundance of Gram+ indicators (i14:0, 15:0, i15:0, a15:0, i16:0, i17:0, a17:0), Gram- indicators (16:1ω9c, 16:1ω7c, 16:1ω7t, cy17:0, 18:1ω7c, 18:1ω5c and cy19:0) and actinomycetes (10Me16:0, 10Me17:0, and 10Me18:0) [7,8,9,12,14,15,16,9,12,14].
More recent advances for describing bacterial populations in natural environments rely on molecular pyrosequencing technology because it provides a massive parallel sequencing-by-synthesis approach that is less tedious and more efficient with respect to higher number of sequences attained when compared to traditional cloning methodologies [17,18,19,20,21,22]. Pyrosequencing is based on the detection of light emitted as each complimentary base is sequenced to an extracted DNA fragment attached to a bead within a Pico Plate, in which each DNA fragment is sequenced multiple times. Patterns of light intensities or flowgram, emitted by each well can then be used to determine the DNA sequence. Roesch et al. [20] were the first ones in using this technique for soil, who enumerated and contrasted bacterial diversity of four soils from the western hemisphere. Later, Acosta-Martinez et al. [22,23] provided information on the bacterial diversity of a single soil as affected by agricultural management and land use. This approach is a bacterial tag-encoded FLX amplicon pyrosequencing protocol followed by sequencing with the 454 Genome Sequencer FLX System (Roche, Nutley, New Jersey) originally described by Dowd et al. [24,25].
The objective of this study is to characterize long-term differences in soil microbial community dynamics under differing cropping systems and tillage practices that had been in place for 5 years by using FAME methods (EL and MIDI) and 454-pyrosequencing technologies. Three dryland crop-rotations were studied: grain sorghum (Sorghum bicolor)-cotton (Srg-Ct); cotton-winter rye (Secale cereale)-grain sorghum (Ct-Rye-Srg); and a rotation of forage (f) sorghum (also known as haygrazer; Sorghum bicolor L. and Sorghum sudanense) with winter rye (Srf-Rye). These three different crop rotation strategies were managed under both no-tillage (nt) and conventional tillage (ct) practices. Our hypothesis is that cotton based cropping systems such as Srg-Ct and Ct-Rye-Srg will sustain a microbial community structure with lower fungal:bacterial ratios compared to a system excluding cotton such as Srf-Rye. The aim of this study is to describe for the first time how these dryland cropping systems and tillage practices induce differences in soil bacterial phyla distribution for the Texas High Plains.

2. Material and Methods

2.1. Cropping Systems and Tillage Treatments

This dryland research study was established at the USDA-ARS farm near Lubbock, TX at latitude 33.68° and longitude −101.77°. Prior to the initiation of this study, the land (4 ha) was fallow during fall of 2001, cotton was planted in summer 2002, and rye was grown from December 2002 to April 2003. The soil is an Olton sandy loam (Fine, mixed, superactive, thermic Aridic Paleustolls) with an average of 16.4% clay, 67.6% sand, and 0.65 g kg−1 of organic matter (OM) content at the beginning of the study. In summer 2003, the land was divided into three field replicates of a split-plot design experiment with cropping systems as the main treatment and tillage as subplots. Each field replicate was 64.6 m wide and 210 m long. In brief, Srg-Ct represents a rotation of cotton and grain sorghum without a winter cover crop (fallow periods). The Ct-Rye-Srg rotation involves growing either cotton or grain sorghum during the summer with a winter cover crop (rye). The Srf-Rye rotation represents a high biomass cropping system with high residue crops during summer (forage sorghum also known as haygrazer) and winter (rye), which does not include a cotton crop because our purpose was to investigate the maximum impact achievable on the soil properties. All systems were under no-tillage (nt) or conventional tillage (ct). In the no-tillage (nt) treatments, there is no soil disturbance, and the summer crop residues remain on the soil surface. For example, forage sorghum and grain sorghum were layed-down by grain drill and left on the surface; whereas, cotton stalks remained standing. Conventional tillage (ct) was accomplished every fall using a shredder and moldboard plow equipment to incorporate the summer crops residues up to 15 cm before planting the winter cover crops. The moldboard equipment was also used to raise beds (101 cm row spacing) to plant the rye every fall (using a drill at 62 kg ha−1) on the tilled treatments. Every year, depending on precipitation and wind storms, beds may be prepared (bed prep) again before planting (same day) in May for rotations under this tillage treatment.

2.2. Projected General Management and Soil Sampling

Crops were planted in May every year. The forage sorghum (also known as haygrazer) variety was Pacesetter, which is typically produced for cattle feed, and planted at a rate of 16.8 kg ha−1 with a drill in 43 cm spacing. The cotton and grain sorghum varieties were Paymaster 23-26rr and K35-Y5, respectively, and were generally planted at 101.6 cm row spacing. Cotton was planted at a rate of 9–11 kg ha−1. Grain sorghum was generally planted at a rate of 3 kg ha−1. Pesticides and fertilizer were applied after precipitation events, which is a typical practice for dryland management. The herbicides used to control weeds were Markman® (2.34 L ha−1) for grain or forage sorghum and Round-up® (2.34 L ha−1) for cotton. Cotton was generally chemically terminated around mid October using 1.17 L Cyclone ha−1. When precipitation was sufficient, the winter cover crop (rye) was planted in December and terminated during April of the next year using Round-up® at 2.3 L ha−1 in Ct-Rye-Srg and Srf-Rye rotations. In general, during the 5 years prior to our sampling, the projected management was not possible every year due to significant climatic variations reflected in certain years with lack of fertilization (i.e., 2003, 2007), summer crop failure (2003, 2006) and only few weeks of winter cover crops (i.e., 2005) for cropping systems that apply.
Soil samples were taken from each of three field replicates available for each cropping system (Srg-Ct, Ct-Rye-Srg and Srf-Rye) and tillage (nt and ct) treatment combination. Two composite (0–10 cm depth) soil samples were taken across each field replicate plot (210 m), one from the north side and another from the south side (n = 6 per treatment; 2 samples per treatment plot × 3 field replicate plots). This sampling occurred in November 2007 after harvest of cotton (Ct-Rye-Srg), grain sorghum (Srg-Ct) and forage sorghum (Srf-Rye), which represented the end of the 5 year study. All samples from each treatment (n = 6) were analyzed for FAME and all soil properties evaluated, however, only 3 samples per treatment were analyzed for pyrosequencing.

2.3. Selected Soil Properties

Total C, organic C, and total N were determined in air-dried soil samples in a private laboratory (Ward Laboratories, Nebraska) by automated dry combustion (LECO TruSpec CN) [26,27]. Soil pH was measured in the air-dried soil (<5 mm) using a combination glass electrode (soil: water ratio, 1:2.5).
Microbial biomass C (MBC) and N (MBN) were determined in field-moist soil (15-g oven-dry equivalent ) by the chloroform-fumigation-extraction method [28,29]. In brief, organic C and N from the fumigated (24 h) and non-fumigated (control) soil were quantified using a CN analyzer (Shimadzu Model TOC-V/CPH-TN, Shimadzu Corporation, Japan). The MBC and MBN (difference between fumigated and non-fumigated values) were calculated using a kEC factor of 0.45 [30] and kEN factor of 0.54 [31], respectively. Each sample had duplicate analyses and results are expressed on a moisture-free basis.
Enzyme activities important for C (β-glucosidase, α-galactosidase), C and N (β-glucosaminidase), P (i.e., alkaline phosphatase, phosphodiesterase) and S (arylsulfatase) cycling were evaluated using 1 g of air-dried soil (<5 mm) with their appropriate substrate and incubated for 1 h (37 oC) at their optimal pH as described previously [32,33].

2.4. Microbial Community according to FAME Profiling

The FAME-MIDI method was used to extract fatty acids from the field-moist soil samples (3-g oven-dry equivalent) following the MIDI (Microbial ID, Inc., Newark, DE, USA) protocol as previously applied to soils [6]. In brief, the four steps of the MIDI protocol applied on the are: (1) saponification of fatty acids at 100 °C with 3 mL of 3.75 M NaOH in aqueous methanol [methanol : water ratio = 1:1] for 30 min; (2) methylation (esterification) at 80 °C in 6 mL of 6 M HCl in aqueous methanol [1:0.85] for 10 min; (3) extraction of the FAMEs with 3 mL of 1:1 [vol.:vol.] methyl-tert-butyl ether:hexane; and (4) washing of the solvent extract with 1.2% [wt./vol.] NaOH.
The FAME-EL method was performed as described by Schutter and Dick [5] using also 3 g of fresh soil (oven dried basis) as for the FAME-MIDI method described above. This method also involves 4 steps: (1) saponification and methylation of ester-linked fatty acids by incubation of 3 g of soil in 15 mL of 0.2 M KOH in methanol at 37 oC for 1 h. During that time, the samples are vortexed every 10 min, and addition of 3 mL of 1.0 M acetic acid to neutralize the pH of the mixture at the end of incubation, (2) FAMEs were partitioned into an organic phase by adding 10 mL of hexane followed by centrifugation at 480 × g for 10 min; (3) the hexane layer is transferred to a clean glass test tube and the hexane can be evaporated under a stream of N2 , and (4) In the final step, FAMEs are dissolved in 0.5 mL of 1:1 hexane:methyl-tert butyl ether and transferred to a GC vial for analysis.
For both methods, FAMEs were analyzed in a 6890 GC Series II (Hewlett Packard, Wilmington, DE, USA) equipped with a flame ionization detector and a fused silica capillary column (25 m × 0.2 mm) using H2 (ultra high purity) as the carrier gas. The temperature program was ramped from 170 °C to 250 °C at 5 °C min−1. Fatty acids were identified and quantified by comparison of retention times and peak areas to components of MIDI standards. The MIDI software provides FAME relative peak areas (percentage) based on the total FAMEs in a sample (based on the Aerobe method of the MIDI system). FAME concentrations (nmol g−1 soil) were calculated by comparing peak areas to an analytical standard (19:0, Sigma Chemical Co., St. Louis, MO) calibration curve. The FAMEs are described by the number of C atoms, followed by a colon, the number of double bonds and then by the position of the first double bond from the methyl (ω) end of the molecule. Cis isomers are indicated by c, and branched fatty acids are indicated by the prefixes i and a for iso and anteiso, respectively. Other notations are Me for methyl, OH for hydroxy and cy for cyclopropane.

2.5. Pyrosequencing

DNA was extracted from approximately 0.5 g of soil (oven dry basis of field-moist soil) using the Fast DNA Spin Kit for soil (QBIOgene, Carlsbad, CA, USA) following the manufacturer’s instructions. The DNA extracted (1uL) was quantified using Nanodrop ND-1000 spectrophotometer (Nanodrop Technologies, Wilmington, DE, USA). The integrity of the DNA extracted from the soils was confirmed by running DNA extracts on 0.8% agarose gel with 0.5X TBE buffer (45 mM Tris-borate, 1 mM EDTA, pH 8.0). All DNA samples were diluted to 100 ng/µL for a 50 µL PCR reaction. The 16S universal Eubacterial primers 530F (5’-GTG CCA GCM GCN GCG G) and 1100R (5’-GGG TTN CGN TCG TTG) were used for amplifying the ~600 bp region of 16S rRNA genes. HotStarTaq Plus Master Mix Kit (Qiagen, Valencia, CA, USA) was used for PCR under the following conditions: 94 °C for 3 minutes followed by 32 cycles of 94 °C for 30 seconds; 60 °C for 40 seconds and 72 °C for 1 minute; and a final elongation step at 72 °C for 5 minutes. A secondary PCR (6 cycles rather than 32) was performed for FLX Amplicon Sequencing under the same condition by using designed special fusion primers with different tag sequences as: LinkerA-Tags-530F and LinkerB-1100R [22]. After secondary PCR, all amplicon products from different samples were mixed in equal volumes, and purified using Agencourt Ampure beads (Agencourt Bioscience Corporation, MA, USA).
Pyrosequencing was used to characterize primary predominant bacterial populations. In preparation for FLX sequencing (Roche, Nutley, NJ, USA), the size and concentration of DNA fragments were accurately measured using DNA chips under a Bio-Rad Experion Automated Electrophoresis Station (Bio-Rad Laboratories, CA, USA) and a TBS-380 Fluorometer (Turner Biosystems, CA, USA). A 9.6 × 10⁶ sample of double-stranded DNA molecules/µl with a size of 625 bp were combined with 9.6 million DNA capture beads, and then amplified by emulsion PCR. After bead recovery and bead enrichment, the bead-attached DNAs were denatured with NaOH, and sequencing primers were annealed. A two-region 454 sequencing run was performed on a 70 × 75 GS PicoTiterPlate (PTP) by using a Genome Sequencer FLX System (Roche, Nutley, NJ, USA). It should be noted that 100 total samples were run within this same FLX 2-region sequencing reaction Pico Plate. All FLX related procedures were performed following Genome Sequencer FLX System manufacturers instructions (Roche, Nutley, NJ, USA). Thus, moderate diversity pyrosequencing analysis (2,000–3,000 reads per sample) was performed at the Research and Testing Laboratory (Lubbock, TX, USA).
A custom script written in the C# within the Microsoft® .NET development environment (Microsoft Corp, Seattle, WA, USA) was utilized to generate all possible combinations of 10-mer oligonucleotide tags with GC % between 40 and 60% [22]. Individual tags were chosen to label our samples. Custom software developed within the Microsoft® .NET environment (Microsoft Corp, Seattle, WA, USA) was also utilized for all post sequencing processing [22,34]. In-depth discussion of software code is outside the scope of this report; however, a description of the algorithm follows. Quality trimmed sequences obtained from the FLX sequencing run were processed using a custom scripted bioinformatics pipeline as depicted in Acosta-Martinez et al. [22]. In short, each sequence was trimmed back to utilize only high quality sequence information, tags were extracted from the FLX generated multi- FASTA file, while being parsed into individual sample specific files based upon the tag sequence. Tags which did not have 100% homology to the original sample tag designation were not considered as they might be suspect in quality. Sequences which were less than 200 bp after quality trimming were not considered. Samples were then depleted of definite chimeras using B2C2 software, described by Research and Testing Laboratory (Lubbock, TX, USA; www.researchandtesting.com/B2C2.html). The resulting sequences were then evaluated using BLASTn [35] against a custom database derived from the RDP-II database and GenBank (http://ncbi.nlm.nih.gov) [22,36]. The sequences contained within the curated 16S database were those considered of high quality based upon RDP-II standards [37] and which had complete taxonomic information within their annotations. Following best-hit processing, a secondary post-processing algorithm was utilized to combine genus and other taxonomic designations generating data with relative abundance of each taxonomic entity within the given sample, and phylogenetic assignments were based upon NCBI taxonomic designations.

2.6. Statistical Analysis

Analysis of variance (ANOVA) was used to determine significant effects of cropping systems and tillage treatments on soil properties. To further evaluate the relationship among soil bacterial populations as affected by cropping system and tillage practices, discriminant function analysis (DFA) was utilized. DFA was employed as a tool for visualizing a separation of groups (cropping system and tillage treatments) in multivariate space, using MATLAB (Natick, Massachusetts). Known groups based on extrinsic criteria (cropping system and tillage practices) are required, in which the DFA calculates eigenvectors to account for among-group variances, which optimizes discrimination among the groups by one or more linear combinations in a multidimensional space. For each DFA, 1,000 randomized (bootstrap) iterations were performed in order to build null distributions from which to compare actual sampling distribution. This randomization technique is robust and very useful for minimizing statistical assumptions associated with theoretical distribution-null comparisons (ex. F-distribution) by taking into account the structure of the actual data collected. DFA ordination graph, axes 1 and 2 were chosen in all figures to represent the relationship between treatments over time as these axes accounted for the most variation reported by the eigenvalues. Multivariate analysis of variance (MANOVA) was used as the statistical criterion to determine whether the multivariate groupings defined by the DFA differed significantly via the F-statistic using the statistical software package SPSS 14.0 (Chicago, IL).
Bacterial pyrosequencing population data were also analyzed by performing multiple sequence alignment techniques, using MUSCLE (with parameter -maxiters 1, -diags1 and -sv) [38]. Based on the alignment, a distance matrix was constructed using DNAdist from PHYLIP version 3.6 with default parameters from Felsenstein [39,40]. These pairwise distances served as input to DOTUR [41] for clustering the sequences into OTUs of defined sequence similarity that ranged from 0% to 20% dissimilarity. The statistical approach used by Roesch et al. [20] was applied for comparing OTU richness among the systems using rarefaction curves. At 3% dissimilarity level, a Richard’s equation [42] was fit to the rarefaction curves generated by DOTUR for each cropping system and tillage treatment combination to determine the OTUs. The clusters based upon dissimilarity of 3%, served as OTUs for generating predictive rarefaction models and for making calculations with the richness (diversity) indexes Ace and Chao1 [43] in DOTUR. These programs were run on a Windows VISTA machine, 2 quad core Xeon processors at 3.0 Ghz with 12 GB of RAM.
Lastly, a double dendogram was performed using comparative functions and multivariate hierarchical clustering methods of NCSS 2007 (NCSS, Kaysville, Utah) based upon the top- most abundant bacterial classes including the weighted-pair group clustering method and the Manhattan distance method with no scaling. It should be noted that the dendogram linkages of the bacterial classes are not phylogenetic but based upon abundance of classes among the samples ordered in rows. Clustering of the systems was similarly based upon abundance of the top 32 most abundant bacterial classes among individual samples. Manhattan distance for the relative percentage data is calculated between rows j and k, where δijk = zijzjk as shown in equation 1.
Diversity 02 00910 i001

3. Results

3.1. Selected Soil Properties

Table 1 presents selected properties for this soil sampling which represents 5 years of the establishment of cropping systems and tillage treatments as reported by Acosta-Martínez et al. [44]. Total C, total N, organic C, microbial biomass (MB) and enzyme activities (EAs) were not impacted by the tillage treatments after 5 years. These properties were higher under Srf-Rye compared to the other dryland cropping systems (P < 0.05). Soil MBC and MBN were similar under Ct-Rye-Srg and Srg-Ct, which were lower than Srf-Rye. Among different EAs evaluated in this soil, Acosta-Martínez et al. [44] concluded that those related to C cycling (β-glucosidase, α-galactosidase and β-glucosaminidase) showed similar trends to the MB whereas the EAs involved in P and S cycling (alkaline phosphatase, phosphodiesterase, and arylsulfatase) showed more distinction among the cropping systems (Srf-Rye > Ct-Rye-Srg > Srg-Ct).
Table 1. Selected soil properties as affected by dryland cropping systems and tillage in a semiarid sandy soil.
Soil PropertiesSrg-Ct Ct-Rye-Srg Srf-RyeANOVA
No-tillTill No-tillTill No-tillTillRotationTillageRot. × Till
Total C (g C kg-1 soil) 5.47 (0.23) 5.53 (0.23) 6.10 (0.25) 6.17 (0.30) 7.27 (0.29) 8.17 (0.71)< 0.001n.s.n.s.
Total N (g N kg-1 soil) 0.50 (0.01) 0.54 (0.04) 0.58 (0.03) 0.58 (0.02) 0.70 (0.03) 0.78 (0.05)< 0.0010.05n.s.
Organic C (g C kg-1 soil) 4.93 (0.47) 5.13 (0.20) 4.97 (0.24) 5.93 (0.37) 6.70 (0.20) 7.67 (0.79)0.0010.1n.s.
Soil pH 7.14 (0.02) 7.10 (0.03) 7.04 (0.06) 7.02 (0.06) 7.05 (0.02) 7.14 (0.03)n.s.n.s.n.s.
Microbial Biomass (MB)
 MBC (mg C kg-1 soil)50.45 (3.95)50.76 (0.39)51.17 (4.66)49.77 (6.32) 74.67 (1.27) 80.38 (3.38)< 0.001n.s.n.s.
 MBN (mg C kg-1 soil) 2.52 (0.44) 2.95 (0.18) 3.45 (0.64) 2.53 (0.34) 3.73 (0.19) 3.40 (0.22)0.1n.s.n.s.
Enzyme Activities (EAs)
 (mg PN kg-1 soil h-1)
 β-Glucosidase activity64.34 (5.61)66.27 (6.06)94.40 (3.56)68.90 (5.21)141.92 (8.86)157.03 (12.70)< 0.001n.s.0.05
 α-Galactosidase activity 4.09 (0.38) 4.22 (0.38) 5.13 (0.07) 6.50 (1.01) 11.42 (0.73) 13.04 (1.33)< 0.0010.1n.s.
 β-Glucosaminidase activity 6.59 (0.55) 7.44 (0.55) 8.03 (0.58) 8.85 (0.08) 16.22 (2.56) 24.30 (4.09)< 0.0010.1n.s.
 Alkaline Phosphatase act.75.93 (5.17)75.66 (5.26)76.95 (3.50)75.98 (7.95)123.73 (10.11)145.88 (4.09)< 0.001n.s.n.s.
 Phosphodiesterase activity27.52 (3.00)28.79 (4.05)31.68 (6.94)38.34 (6.97) 75.35 (9.17) 81.52 (8.81)< 0.001n.s.n.s.
 Arylsulfatase activity 1.42 (0.71) 2.13 (0.55) 2.71 (0.90) 2.13 (0.58) 7.86 (0.67) 9.68 (1.79)< 0.001n.s.n.s.
Values in parenthesis () are the standard error of the mean (n = 6). This data was presented in Acosta-Martinez et al. [44].

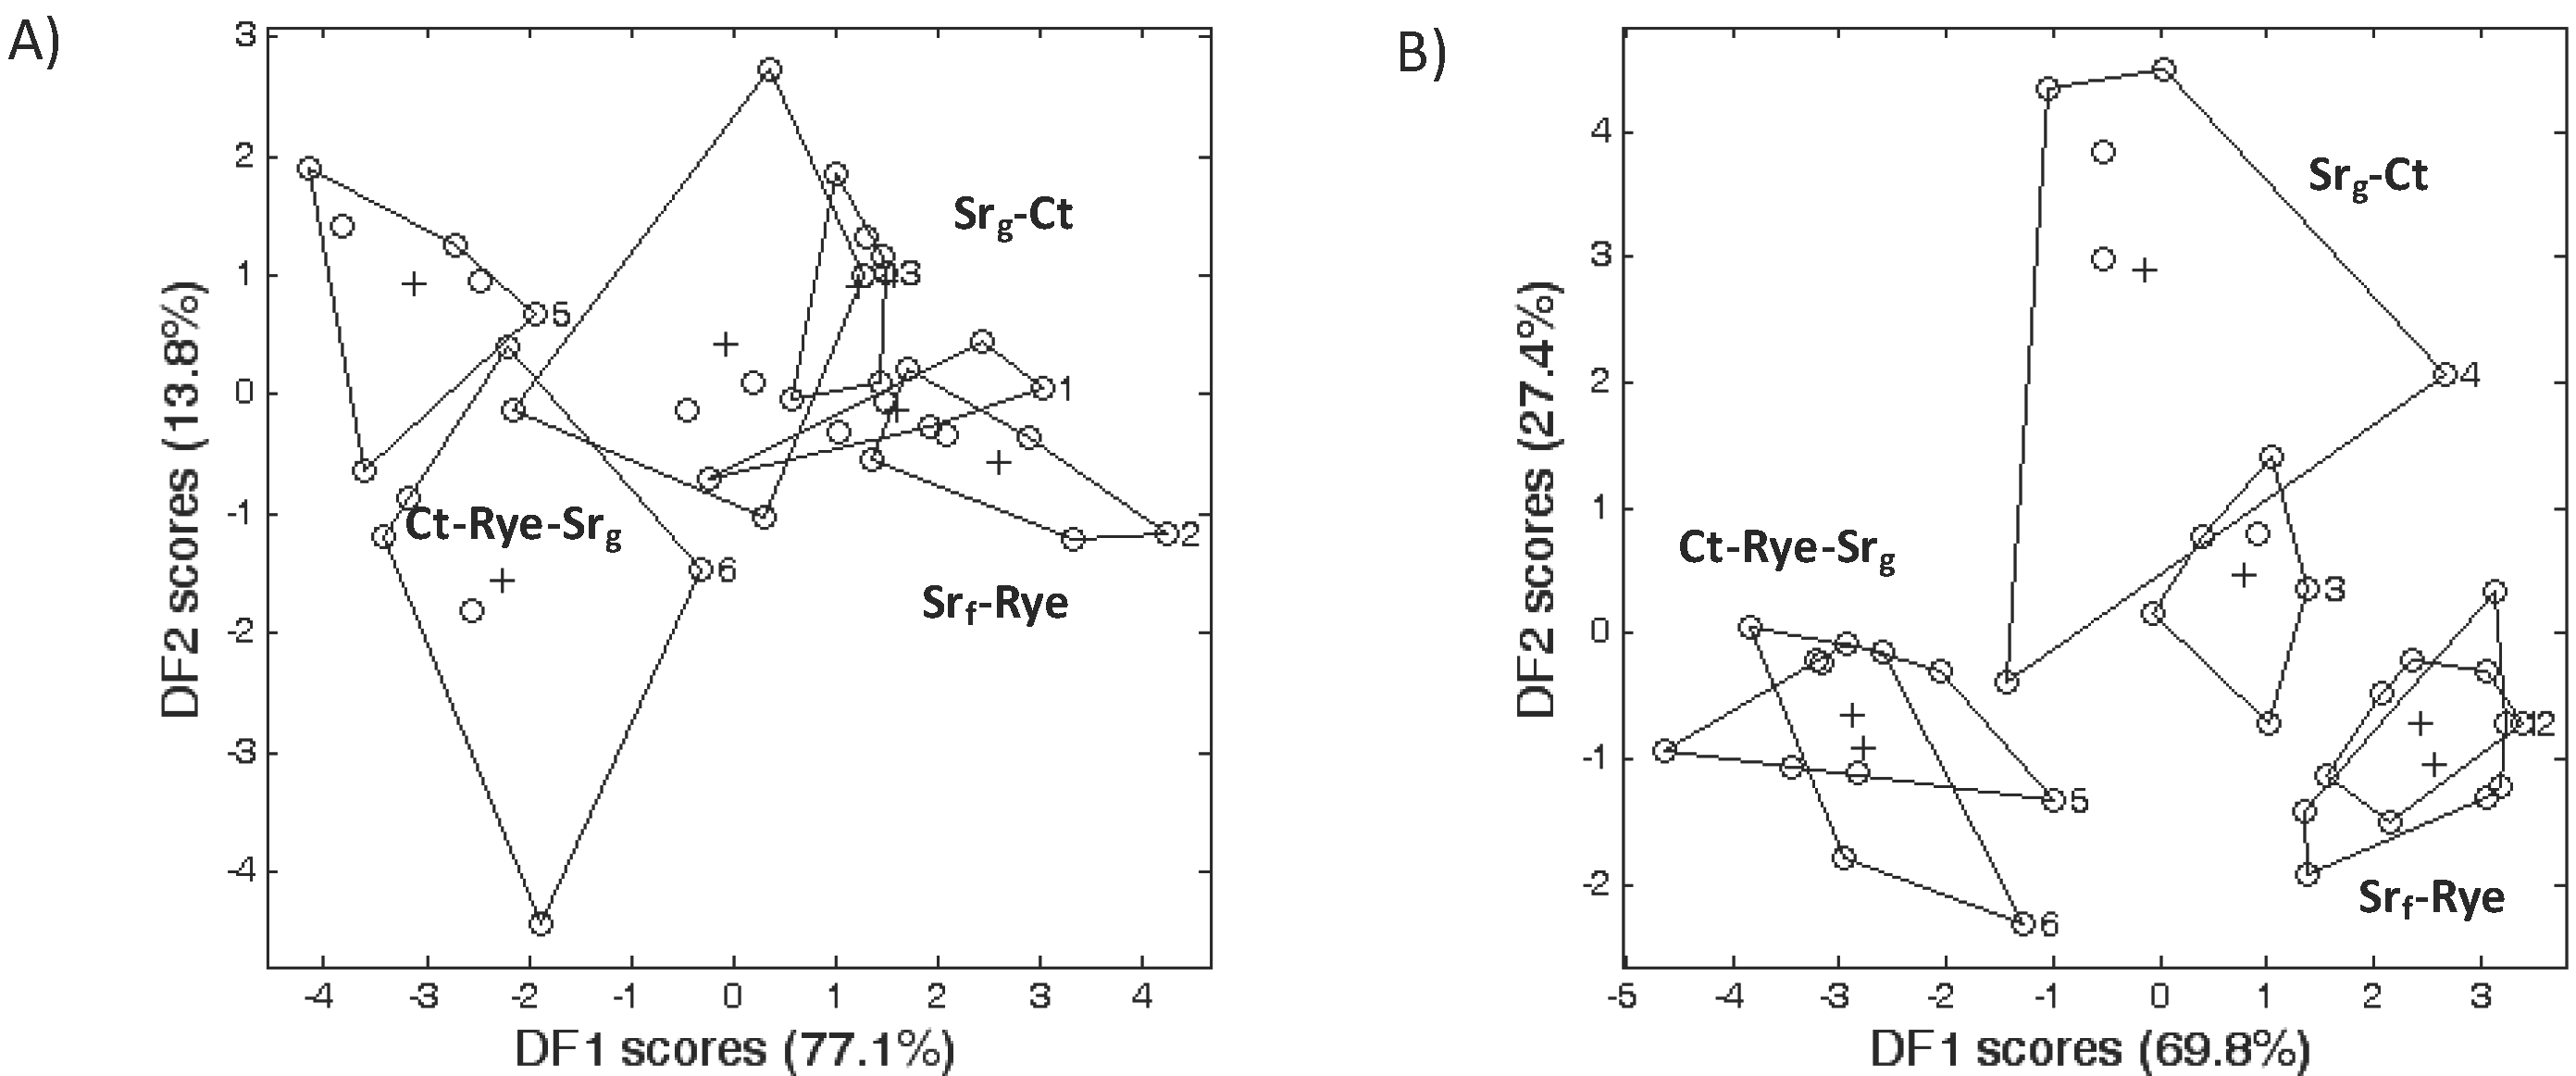
3.2. Microbial Community Structure

According to FAME indicators for microbial groups using the MIDI and EL methods, soil microbial communities differed among cropping systems, but not by tillage practices (Table 2, Figure 1). The methods reflected differences in the total number of FAME peaks obtained for this soil (data not shown), which were higher for MIDI (avg. of 47 peaks) compared to the EL method (avg. of 25 peaks). There were also differences for the FAME concentrations obtained with these methods as higher FAME concentrations were generally found with the MIDI method. The total concentration of all FAMEs in table 2 was higher under the MIDI method (18.35–41.22 nmol g−1 soil) than in the EL method (2.6–8.81 nmol g−1 soil). In addition, cy17:0 and cy19:0 were generally not picked up by the MIDI method, while i13:0 3OH and i17:0 3OH were generally not detected by the EL method.
Regarding the sum for bacterial and fungal FAMEs, the EL-method showed higher sum for bacterial FAMEs than the sum for fungal FAMEs in the cotton based cropping systems (Srg-Ct and Ct-Rye-Srg), while the MIDI approach demonstrated the opposite trend. However, both methods showed higher sum of fungal and bacterial FAMEs in soil under Srf-Rye compared to Srg-Ct (and Ct-Rye-Srg for the EL-method). Although the F:B ratios were generally much higher with the MIDI method, both methods showed higher F:B ratios in soil under Srf-Rye than under Srg-Ct and Ct-Rye-Srg. Thus, the overall trends for the F:B ratios were the same across cropping systems regardless of the method (Srf-Rye > Ct-Rye-Srg = Srg-Ct). Both methods also agreed by demonstrating the same trend regarding total concentration of all FAMEs across the different cropping systems, which is in agreement with microbial biomass C results.
Although FAME concentrations differed for these two methods, discriminant function analyses (DFA) using bacterial FAME indicators showed similar separation among cropping systems and tillage treatments for both FAME methods (Figure 1). The cumulative eigenvalue for the first two axes of the DFA (the total percent variation represented) for both the MIDI and EL FAME methods was ≥91%. MANOVA revealed significant differences regarding these soil bacterial components for both the MIDI and EL methods among the differing cropping systems (P ≤ 0.006). Furthermore, regardless of the FAME method, the vector plots demonstrated highly positive correlations between bacterial FAME indicators and the same cropping systems (Ct-Rye-Srg and Srg-Ct).
Table 2. Soil microbial community composition according to FAME indicators with MIDI and EL-methods under dryland no-tilled cropping systems (tillage treatments were not significant).
FAME resultsMIDI-FAME EL-FAME MIDI vs. EL
Srg-Ct Ct-Rye-Srg Srf-RyeANOVASrg-Ct Ct-Rye-Srg Srf-RyeANOVAANOVA
Bacteria (B)________ nmol g-1 soil _________ ________ nmol g-1 soil _________
 Gram+
   a15:01.52b1.73b2.36a0.0050.13b0.28b0.51a0.002<0.001
   i15:0 2.21b2.62b3.39a0.0070.23b0.45b0.79a0.008<0.001
   a17:00.52b0.62a0.67a0.0230.19b0.26b0.42a0.001<0.001
   i17:00.51a0.62a0.63a0.0200.15b0.22b0.31a0.005<0.001
 Gram-
  cy17:00.10n.d.n.d.n/a0.02b0.06b0.17a0.038n.s.
  cy19:0n.d.n.d.n.d.n/a0.21b0.19b0.31a0.026<0.001
  i13:0 3OH 0.18b0.22b0.31a0.006n.d.n.d.n.d.n/an/a
  i17:0 3OH0.39b0.47b3.39a0.017n.d.n.d.n.d.n/an/a
 Acinomycetes
  10Me16:01.13a1.44a1.27an.s.0.37b 0.49ab0.72a0.017<0.001
  10Me17:00.25a0.32a0.27an.s.0.03b0.08b0.12a0.047<0.001
  10Me18:00.07a0.16a0.15an.s.0.08b0.14b0.25a0.0120.03
Fungi (F)
  16:1ω5c6.39b3.64b23.10a0.0400.18b0.08b2.11a<0.001<0.001
  18:1ω9c3.61b4.34b5.96a<0.0010.71b0.81b2.03a0.001<0.001
  18:2ω6c2.82b2.85b4.66a0.0020.31b0.34b1.02a0.106<0.001
  18:3ω6c0.54b0.54b0.89a0.0090.03b0.04b0.12a0.009<0.001
Total (nmol g-1 soil)18.35b17.43b41.22a 2.60b3.41b8.81a
Sum F indicators13.41b11.37b34.55a<0.0011.22b1.27b5.29a0.001<0.001
Sum B indicators4.94b 6.06ab6.67a0.0361.39b2.13b3.52a0.004<0.001
F:B ratios2.71b1.88b5.18a 0.88b0.60b1.51a
Diferent letters indicate differences among cropping systems at P < 0.05 for the specified FAME within the same method. FAMEs not detected (n.d), were not compared with ANOVA (=n/a) for determining significant cropping system effects.
Figure 1. Discriminant function analyses (DFA) comparing bacterial populations among the cropping systems and tillage treatments using two FAME methods: (A) MIDI and (B) EL.
Diversity 02 00910 g001

3.3. Bacterial Phyla Distribution in This Soil

Figure 2 provides a hierarchal clustering double dendogram based upon the relative abundance (%) of the top 32 bacteria (Y-axis) within the cropping system (Srg-Ct, Ct-Rye-Srg, and Srf-Rye) and tillage (nt and ct) treatments in our study (X-axis). The heatmap colors indicate the relative percentage of bacteria ranging from <0.0001% in black up to 52% in red. It should be noted that the dendogram linkages of the bacterial classes are not phylogenetic. This double dendogram revealed that the predominant phyla in this soil despite treatment effects were Actinobacteria and Proteobacteria (red to orange color in the heat map). Less predominant bacteria in this soil (1.17–6.71%) were Acidobacteria, Verrucomicrobiae, Bacteroidetes, Spartobacteria, Solibacteres, Chloroflexi and Thermomicrobia (green in the heat map). Definitely rare bacteria, but still detected in this soil (<1.17%) were Planctomycetacia, Nitrospira, Thermolithobacteria, Thermotogae, Dehalococcoidetes, Gloebacteria, Chlamydiae, and Ktedonobacteria (black in the heat map).
Figure 2. Double hierarchal dendogram to evaluate bacterial distribution in this soil (heat map) using the weighted-pair group clustering method and Manhattan distance method with no scaling. The heat map colors represent the relative percentage of the bacterial classes within each treatment with the legend indicated at the upper left of the figure. The treatments along the X-axis with Manhattan distances are indicated by branch length and an associated scale located at the upper right of the figure. Clustering based upon Manhattan distance of the bacterial classes along the Y-axis and their associated scale is indicated in the lower left.
Diversity 02 00910 g002

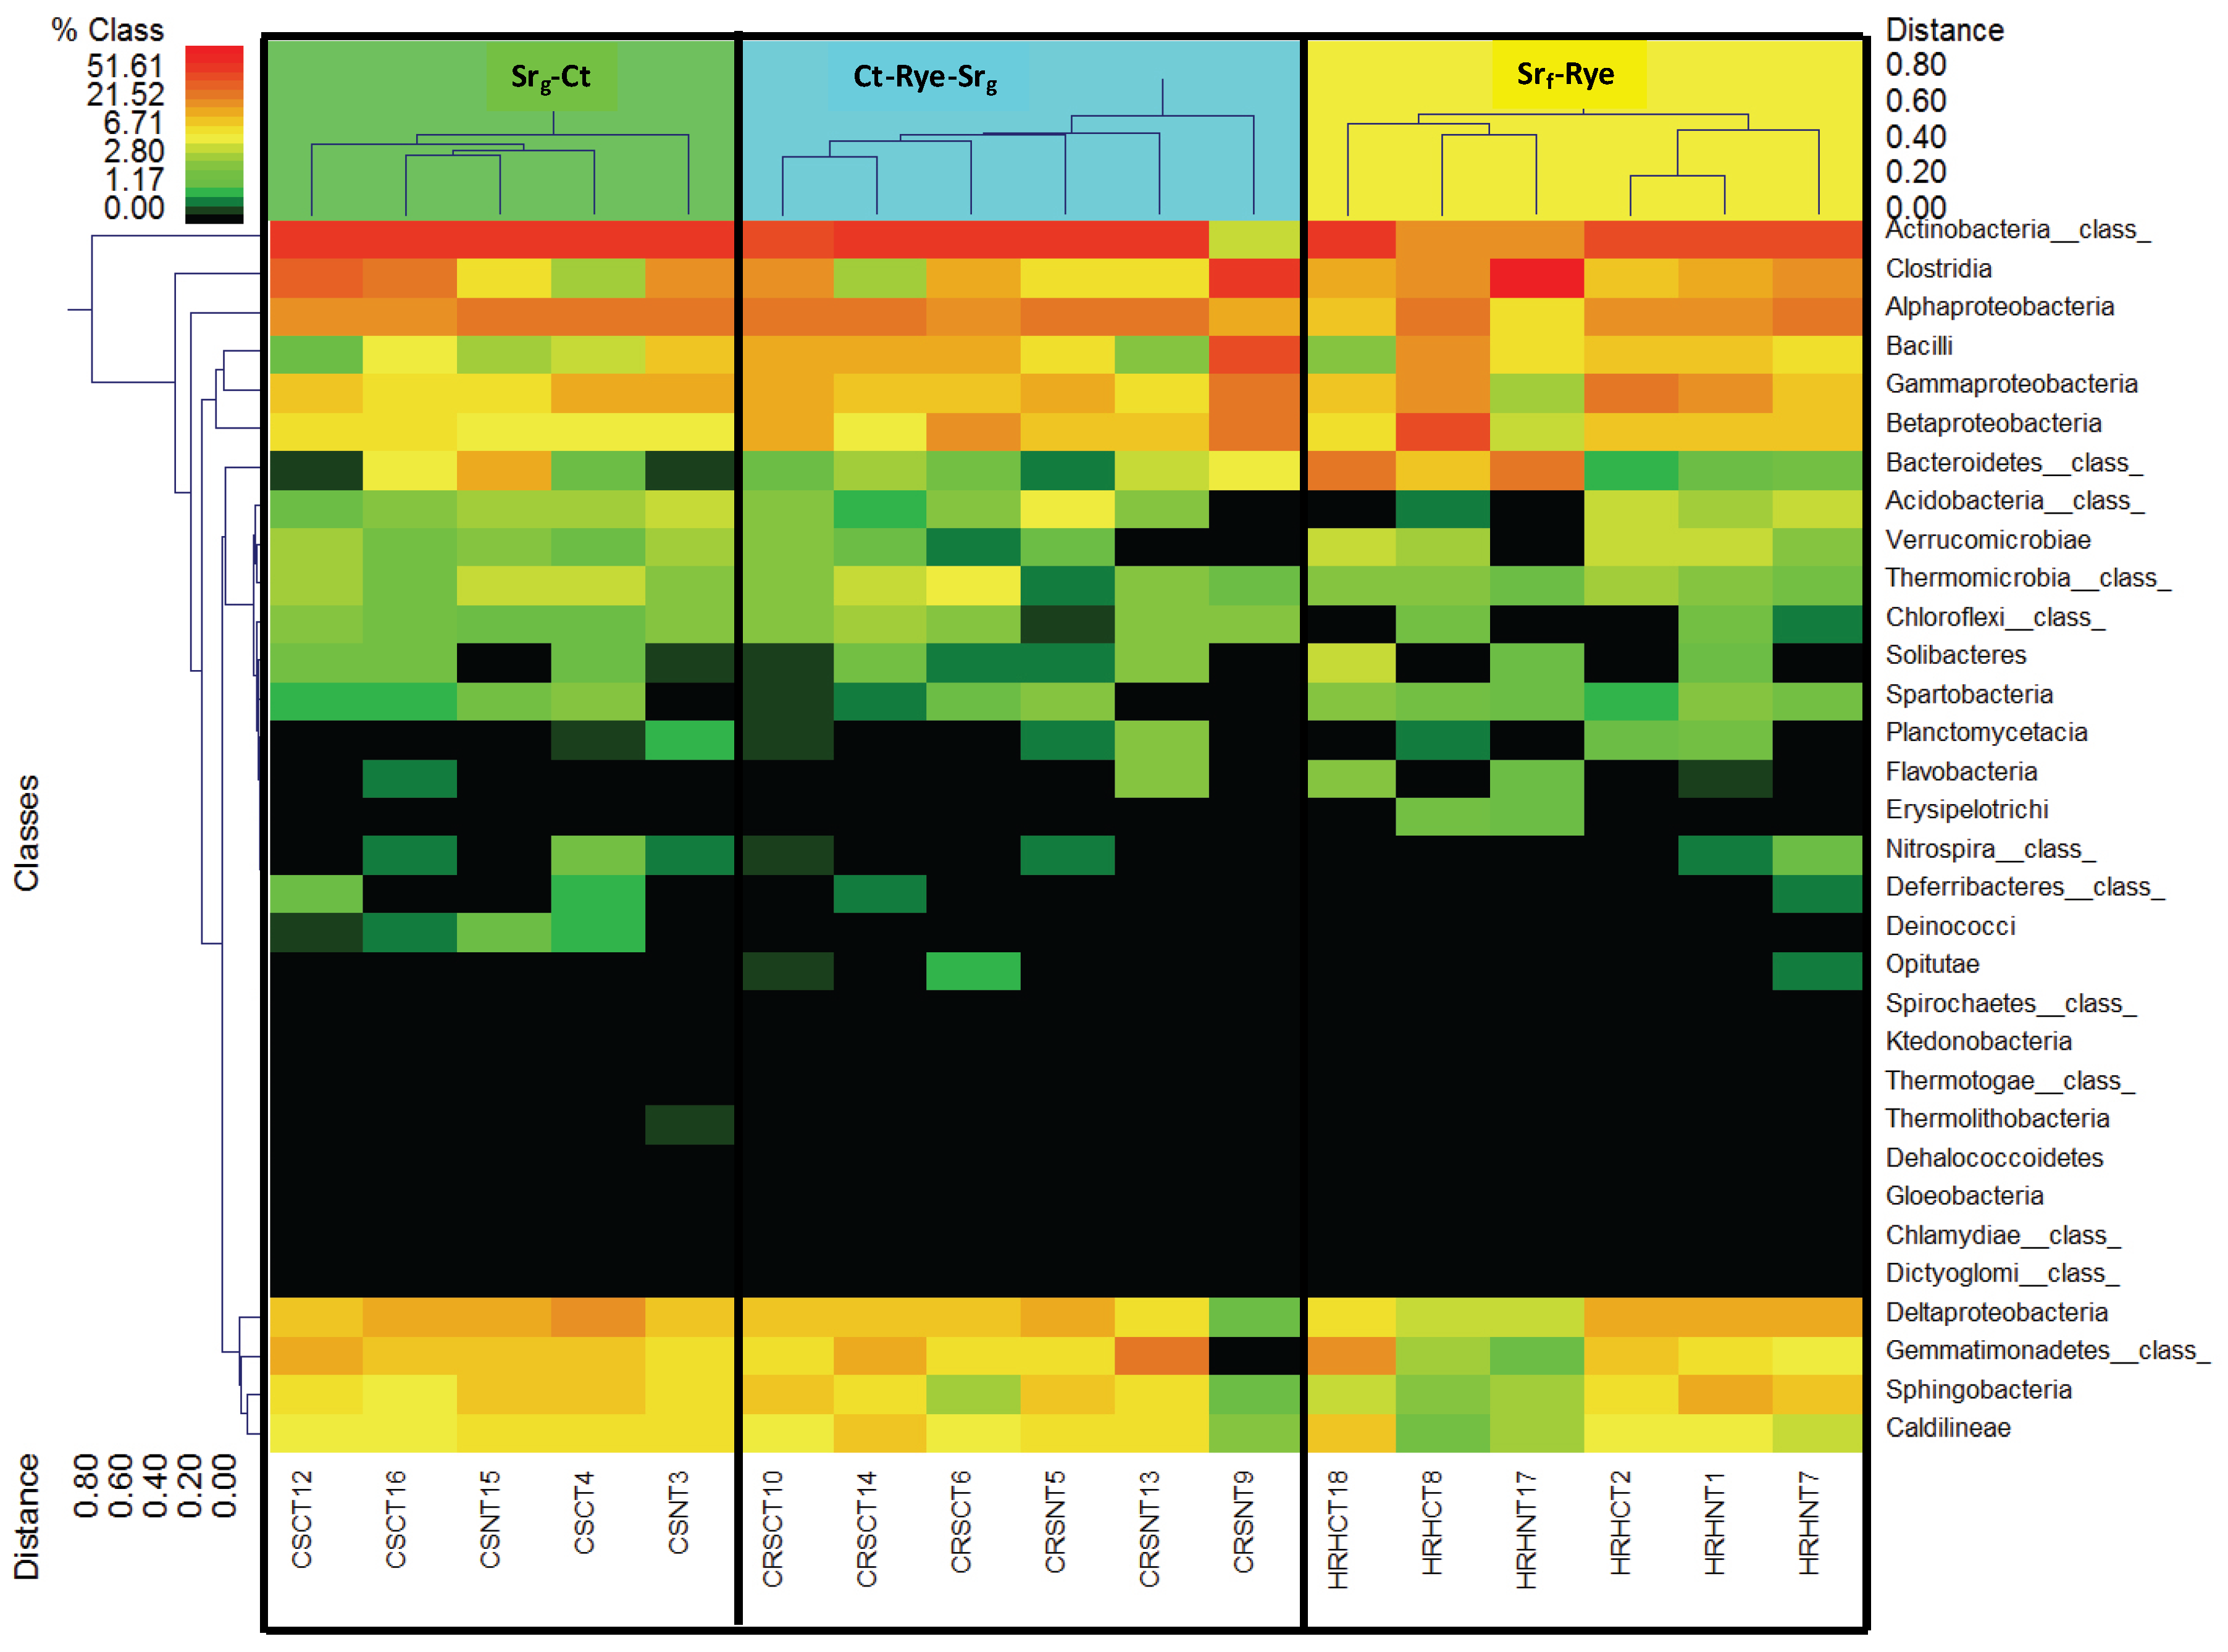
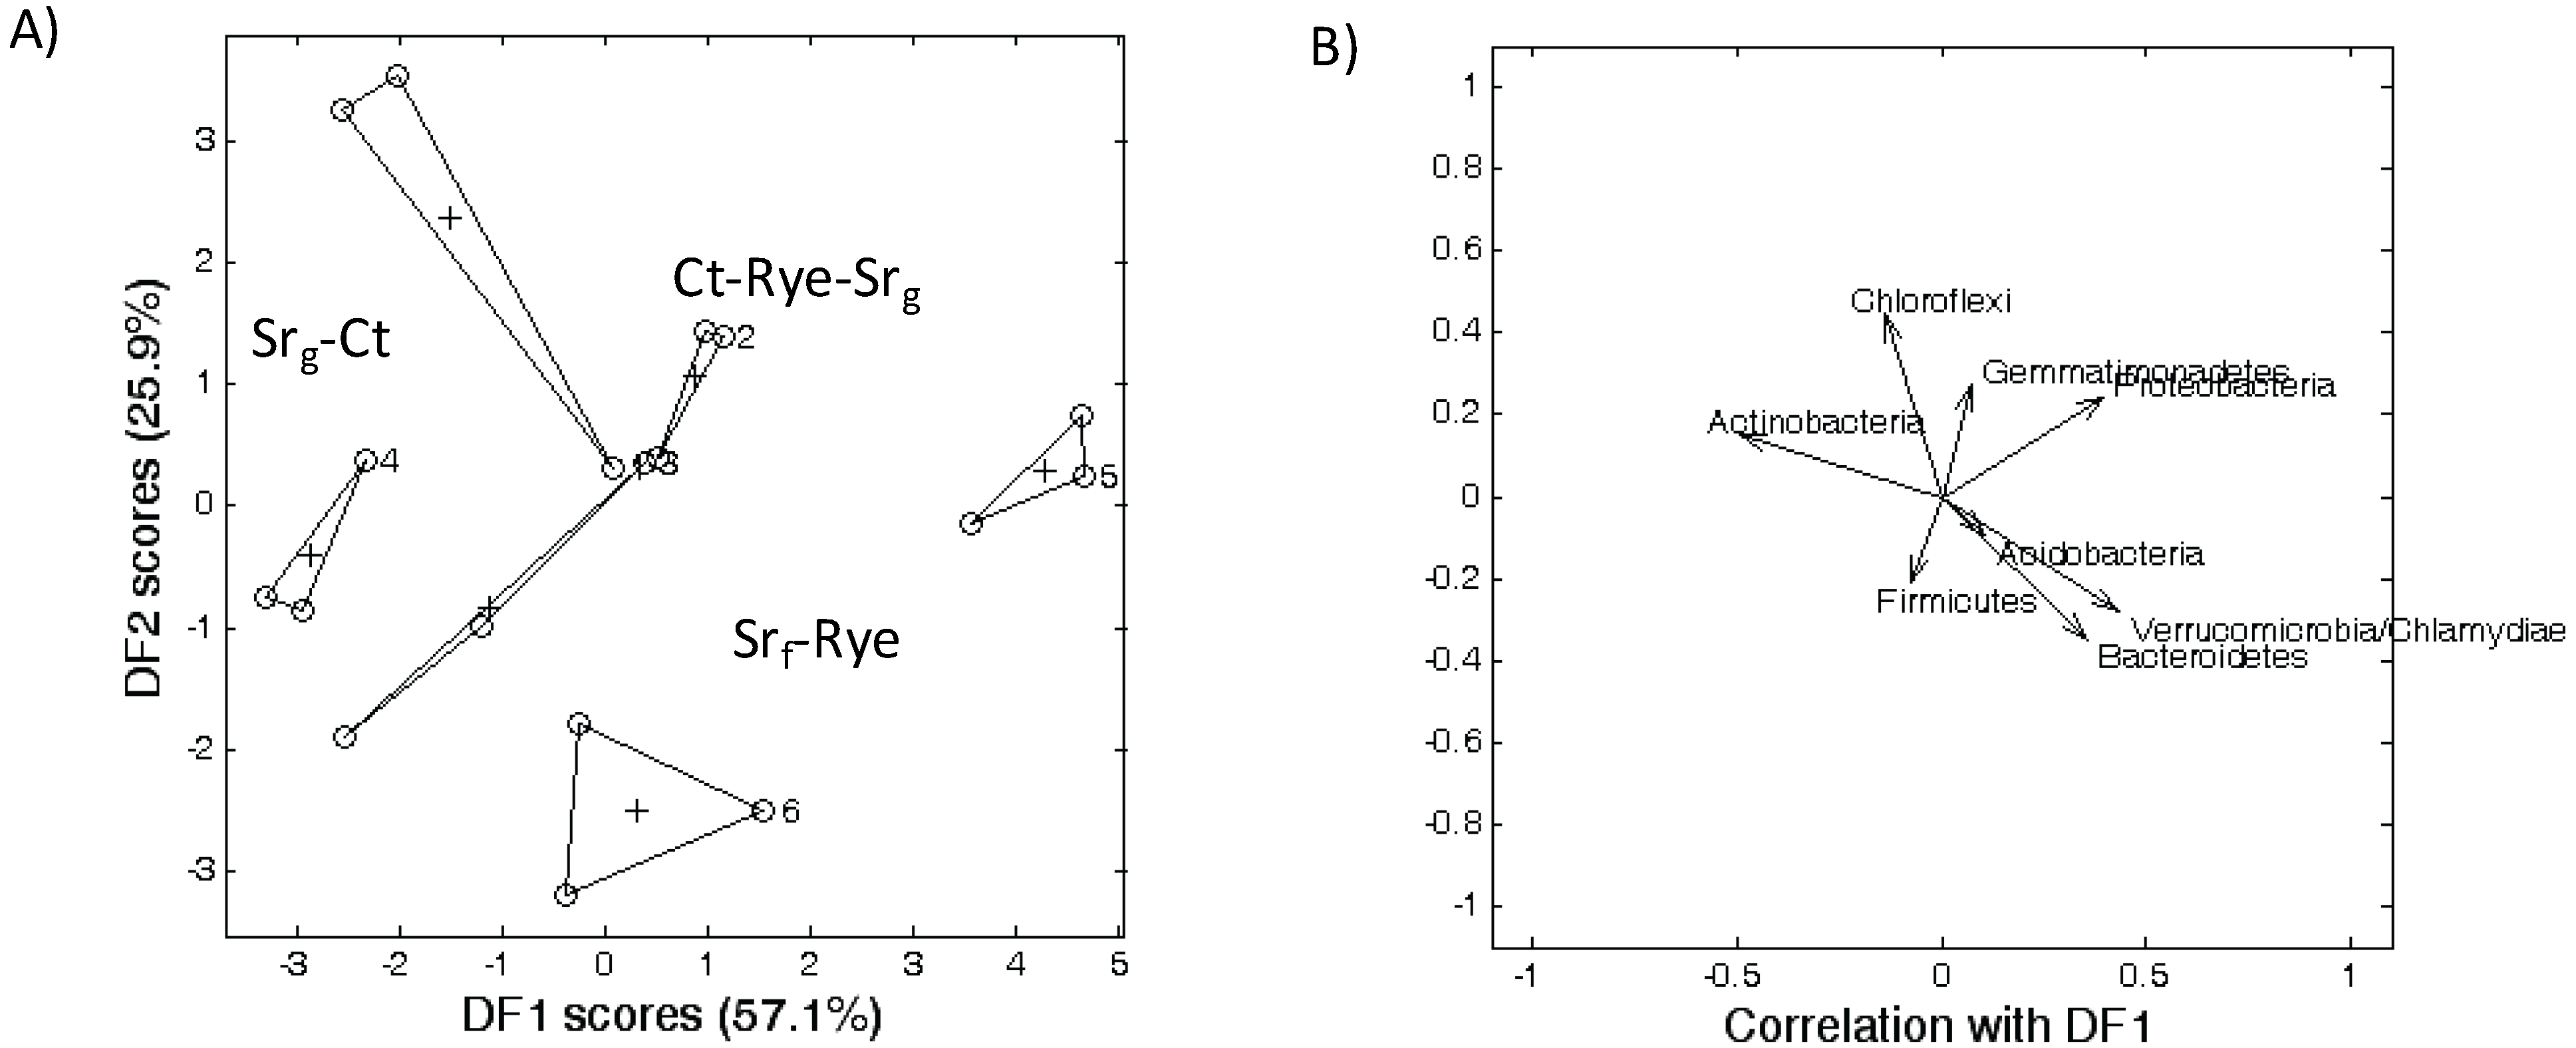
3.4. Bacterial Phyla Distribution as Affected by the Cropping System and Tillage Management

Significant differences were detected for the predominant bacteria in this sandy soil as affected by the dryland cropping systems and tillage evaluated (Table 3). The most predominant trend is that this sandy soil showed higher Bacteroidetes while lower Actinobacteria under Srf-Rye compared to the other cropping systems. In addition, Proteobacteria showed a significant interaction between cropping system and tillage treatment as they were predominant under tilled plots than no-tilled plots for Srf-Rye, and they tended to be higher in soil under Ct-Rye-Srg and Srf-Rye compared to Srg-Ct.
The predominant bacterial phyla in this semiarid sandy soil were also affected by tillage treatments. Chloroflexi tended to be more predominant in soil under tilled plots than no-tilled plots for Srg-Ct and Ct-Rye-Srg rotations, but this trend was not significant (P = 0.071). Gemmatimonadetes and Verrucomicrobiae were predominant in soil under tilled plots compared to the no-tilled plots for all cropping systems. In contrast to the other bacteria, Firmicutes were higher under no-tilled plots compared to the tilled plots for all cropping systems.
Table 3. Bacterial phyla distribution as affected by dryland cropping systems and tillage in a semiarid sandy soil.
Relative abundance Srg-Ct Ct-Rye-Srg Srf-RyeANOVA results
bacteria (%)No-tillTill No-tillTill No-tillTillRotation Tillage Rot × Till
Proteobacteria23.52 (2.75)29.72 (7.74) 34.22 (1.24)32.18 (2.76) 28.13 (9.73)37.55 (8.34)n.s.n.s.0.053
Actinobacteria33.63 (0.53)32.48 (3.47) 22.84 (2.77)30.71 (10.13)20.44 (6.16)21.18 (5.58)0.010n.s.0.005
Firmicutes23.62 (4.45)13.16 (12.86)22.44 (2.98)14.63 (15.53)27.91 (3.53)14.18 (14.68)n.s.0.027n.s.
Chloroflexi 4.88 (0.46) 6.12 (2.46) 5.55 (1.13) 7.38 (1.18) 4.05 (0.96) 5.09 (0.86)0.0180.0710.010
Bacteroidetes 6.16 (0.76) 5.75 (3.88) 5.77 (1.15) 5.27 (0.98) 10.86 (4.23)10.30 (3.13)0.019n.s.n.s.
Gemmatimonadetes 4.08 (0.25) 6.48 (0.89) 5.60 (1.29) 5.59 (3.67) 2.94 (2.14) 5.64 (1.11)0.0010.029n.s.
Verrucomicrobia
/Chlamydiae 1.51 (0.17) 2.15 (0.83) 0.74 (0.24) 1.80 (0.74) 2.55 (0.33) 3.44 (0.92)n.s.0.0390.001
Acidobacteria 1.57 (0.26) 2.34 (0.84) 2.00 (0.04) 1.63 (1.04) 1.90 (0.76) 1.99 (0.55)n.s.n.s.n.s.
Values in parenthesis () are the standard error of the mean (n = 3).
Table 4. Bacterial diversity as affected by dryland cropping systems and tillage in a semiarid sandy soil.
Diversity Srg-CtCt-Rye-SrgSrf-Rye
IndexNo-tillTillNo-tillTillNo-till Till
OTU 3%223.67333.67161.33261.67166.01145.00
ACE 3%610.60968.79433.42680.13396.04493.25
Chao1 3%568.99873.60392.26597.19340.08401.58
95% COI for Chao11,049.71–88.27983.72–762.88836.98–52.46796.16–398.22512.66–167.50736.70–66.46
The bacterial diversity indexes ACE and Chao1 at 3% dissimilarity tended to be higher under tilled plots than no-till plots regardless of the cropping system (Table 4). In addition, there seems to be this trend in diversity indexes among the cropping systems: Srg-Ct > Ct-Rye-Srg = Srf-Rye. However, it is important to emphasize that calculation of 95% confidence intervals for the Chao1 indexes showed that none of these trends were significant.
Discriminant function analysis (DFA) displayed a clear separation between soil bacterial populations as affected by cropping system and tillage practices (Figure 3) which were confirmed by MANOVA (P = 0.03). The cumulative eigenvalue for the first two axes of the DFA (the total percent variation represented) was 93.5%. The corresponding vector correlations indicated strong positive correlations between Bacteroidetes, Actinobacteria, Firmicutes, and Verrucomicrobiae/Chlamydiae associated with Srf-Rye regardless of tillage. Furthermore, Acidobacteria demonstrated a strong positive correlation associated with Srg-Ct under no tillage treatments. Chloroflexi demonstrated a strong positive correlation associated with Ct-Rye-Srg under conventional tillage, while Proteobacteria and Gemmatimonadetes demonstrated positive correlations associated with Ct-Rye-Srg under no tillage.
Figure 3. Discriminant function analyses (DFA) for comparing the bacterial phyla distribution among the cropping systems and tillage management evaluated.
Diversity 02 00910 g003

4. Discussion

This study evaluated three cropping systems that were intended to show a decrease in fallow periods by the addition of a winter rye cover crop (i.e., Srg-Ct vs. Ct-Rye-Srg), along with a contrasting cropping system of forage sorghum and winter rye (Srf-Rye) to incorporate more biomass, but excluding cotton. It is important to recognize that water limitations for dryland production in semiarid regions can disrupt the cropping sequence and potentially affect the soil microbial communities. Acosta-Martínez et al. [44] reported that the dryland cropping systems of this study experienced large climatic variability every year prior to our sampling that caused significant differences in biomass production and crop failure in some years. This study experienced a 100 year-record minimum and maximum precipitation in 2003 (total of 244 mm) and 2004 (total of 692 mm), respectively. Thus, plant biomass for these crops were extremely low (<5,000 kg ha−1) in August 2003 while they were its maximum during August 2004 (4,000, 8,000 and 17,000 kg ha−1 for grain sorghum, forage sorghum and cotton, respectively). The study by Acosta-Martínez et al. [44] concluded that the very low biomass produced in certain years can be evidence that C inputs in dryland cropping systems for this region can be extremely low, which was reported for another semiarid region [45]. Regardless these differences from year to year, Acosta-Martínez et al. [44] found that rotations including winter cover crops (e.g., Srf-Rye and Ct-Rye-Srg), when precipitation and air temperature permitted the winter crop, provide higher plant biomass return and other types of root exudates in soil to promote MB and metabolic diversity as indicated by several EAs compared to Srg-Ct and continuous cotton (Ct-Ct) after only 3 yrs. The amount of biomass returned and/or soil surface coverage by rye during winters may have not been significant compared to the summer crops (sorghum or cotton), ranging from 42.6 to 304 kg ha−1 during the study, but soil under rotations with winter cover crops showed improvements in microbial properties. After 5 years, MB and EAs were similar in soil under cotton based cropping systems (Ct-Rye-Srg and Srg-Ct), which were lower compared to a cropping system without cotton such as Srf-Rye. Further, comparison of Srg-Ct with continuous cotton (Ct-Ct) in nearby research plots by Acosta-Martínez et al. [44] revealed that it took 5 years for soil MB to be higher under Srg-Ct than Ct-Ct.

4.1. Soil Microbial Communities As Affected by the Cropping Systems

This study showed that the soil microbial community structure, as shown by both FAME methods used, has been affected by the dryland cropping system history. The FAME concentrations obtained using the EL- and MIDI-FAME methods differed, as the MIDI method yielded higher concentrations of most FAMEs. These results suggest that the EL method does not extract FAMEs attached to the soil organic matter (as does the MIDI approach), and thus the total FAME amounts are lower [5]. Regardless, we found that the differences in the FAME concentrations with both EL and MIDI approaches demonstrated very similar separation patterns among these cropping systems in this sandy soil as also found previously for other soil types [5]. Furthermore, the same trends among the cropping systems were revealed by calculating total concentration of all FAMEs in agreement with microbial biomass data, which may indicate the suitability of both methods to estimate microbial biomass. Both FAME methods showed lower fungal:bacterial ratios under these cotton based cropping systems (Ct-Rye-Srg and Srg-Ct) compared to Srf-Rye, which emphasizes the importance of understanding the soil bacterial diversity more in depth under these dryland cropping systems.
Pyrosequencing showed that cotton based cropping systems sustained higher Actinobacteria, which are widely recognized for their key role in soil metabolic functioning (i.e., decomposition of organic materials, such as cellulose and chitin), and thereby playing a crucial role in organic matter turnover and C cycling [46]. Cotton based cropping systems (Srg-Ct and Ct-Rye-Srg) showing lower MB and EAs and higher Actinobacteria compared to Srf-Rye may suggest that Actinobacteria play a key role in the soil processes under cotton rotation practices. The higher proportion of Proteobacteria in soil under Srf-Rye (tilled > no-tilled) and Ct-Rye-Srg compared to Srg-Ct may be related to the inclusion of winter cover crops in the former rotations. Bacteroidetes were also more predominant in soil under Srf-Rye compared to the other treatments. Interestingly, a recent study [47] reported the abundances of both Proteobacteria and Bacteroidetes were positively correlated with C mineralization rates. Likewise, other studies have suggested that Proteobacteria encompass an enormous level of morphological, physiological and metabolic diversity, which play a significant role in global C, N and S cycling [23,48]. Previous studies have reported that Bacteroidetes can rapidly exploit bio-available organic matter and colonize aggregates [22,49,50]. Generally, Bacteroidetes levels have been reported to be higher and Proteobacteria lower in soil under cropland when compared to pasture [20,22,23,51]. Regardless, it is difficult to explain the current trends of bacterial phyla distribution in this soil due to the limited research comparing these bacterial phyla among different cropping systems.

4.2. Soil Microbial Communities As Affected by Tillage

Although soil MB and EAs were not affected by tillage, the distribution of the predominant bacterial phyla was affected by tillage treatments. Several studies have reported shifts in microbial communities to higher fungal populations (i.e., phospholipid fatty acids indicators) and increases in EAs (i.e., dehydrogenase, urease, protease, phosphatase and β-glucosidase) under no-tilled soils compared to tilled counterparts in other regions and types of soils [52,53]. Previous studies have reported that no-tillage practices encourage fungal hyphae to expand more extensively in soil, and thus, higher fungal populations are expected under no-tillage soils while higher bacterial populations under tilled soils [54,55]. However, we did not observe this trend, in all likelihood because there were only slight differences in surface cover and residues returned in the no-tillage treatments compared to the tilled treatments due to the low biomass levels in certain years prior to our sampling. Results from Acosta-Martínez et al. [44] documented that plant biomass (and cotton yields) were not influenced by crop rotation or tillage history during the first 5 years study. Tilled soil showed a trend for higher members of Chloroflexi compared to no-tilled plots (i.e., Srg-Ct and Ct-Rye-Srg) as found for the Gemmatimonadetes and Verrucomicrobiae for all cropping systems. Differences in bacterial phyla distribution with tillage practices are also reflected in the higher members of Firmicutes (which are mainly Gram+ bacteria) under no-tilled plots compared to the tilled plots for all cropping systems. Although bacterial diversity indexes appeared higher, the Chao1 index was not significant when assessed using 95% confidence intervals. Overall, it is still difficult to explain the prevalence of certain bacterial groups in tilled treatments vs. no-tillage treatment in this sandy soil, in part, because of limited research precedence, as these trends likely depend on a combination of factors including soil parameters, cropping system, tillage practices, and other environmental parameters.

4.3. Bacterial Distribution in this Soil

Previous studies have shown repeatedly that the majority of 16S rRNA gene soil clone libraries belong to nine major bacteria phyla [56,57,58]. Although the seven to eight predominant bacterial phyla observed in this soil agrees with other studies, four of these bacterial phyla (including Chloroflexi, Gemmatimonadetes, Verrucomicrobia, and Acidobacteria) represented less than 5% of the overall relative abundance in these soils. The predominant bacteria detected in other studies such as Plantcomycetes were not abundant in this soil, representing <0.5% of the total sequences. The lower abundances of bacterial phyla and OTUs demonstrated in this study may be due to the sandy texture (>55%), lower organic matter content (<1%) and extreme environmental conditions in this semiarid region (i.e., high winds, extreme temperatures, long inter-pulse periods, and intermittent heavy rain events). In addition, soils from this region have been under continuous monoculture cotton history since 1940 [59,60], which is known to reduce microbial diversity of soils compared to crop rotation [22,23,61,62].
It was of ecological significance that Proteobacteria and Actinobacteria were most abundant in this sandy soil compared to studies with very high clay soil in this semiarid region [22,23] and other soil types elsewhere [63]. Spain et al. [63] concluded that Proteobacteria can represent 25–40% of total sequences by clone library studies (i.e., >1000 near full length 16S rRNA genes or >300bp 16S rRNA gene sequences) or 42–50% abundance from shorter fragments (~100bp) obtained by pyrosequencing. On the contrary, Acidobacteria represented one of the least abundant bacteria in this sandy soil when compared to other soils, probably due in part to the neutral pH (>7.1) of this soil [51]. Lauber et al. [64] reported that Acidobacteria were most abundant in soils with pH ranging between 4.5 to 7, and observed much lower in soils with pH higher than 7.

5. Conclusions

This study detected significant differences in microbial community composition of soil among dryland cropping systems after 5 years regardless of limited water availability in this semiarid region in which crops without supplemental irrigation undergo crop failure. Our study found increases in fungal populations and differences in bacterial phyla distribution in soil with a cropping history of high biomass crops such as the forage sorghum and winter rye cover crop when cotton was not in the rotation (Srf-Rye rotation). Changes in soil microbial communities under the Srf-Rye rotation were in agreement with shifts (higher) in several enzyme activities of nutrient cycling compared to Srg-Ct and Ct-Rye-Srg. Although there were no measurable tillage effects on microbial community structure or biomass in this soil, bacterial phyla distribution responded to tillage practices. These findings reflect differences at the species level that are not necessarily reflected (or detected) as broad changes in taxonomic microbial groups as assessed by FAME analyses. Due to the significant variability of annual biomass production under dryland production in this semiarid Texas High Plains region, the continuation of this study is important for the long-term evaluation of soil microbial communities as sensitive indicators of soil quality and functioning.

Acknowledgements

The initiation of the field plots in 2003 was possible due to funding from the Ogallala Aquifer Research Initiative in that year. This research was also supported by the Agricultural Research Service under the USDA-ARS GRACEnet Project (Greenhouse Gas Reduction through Agricultural Carbon Enhancement Network).

References

  1. Bailey, V.L.; Smith, J.L., Jr.; Bolton, H. Fungal-to-bacterial ratios in soils investigated for enhanced C sequestration. Soil Biol. Biochem. 2002, 34, 997–1008. [Google Scholar] [CrossRef]
  2. Acosta-Martinez, V.; Bell, C.E.; Morris, B.E.L.; Zak, J.; Allen, V.G. Long-term soil microbial community and enzyme activity responses to an integrated cropping-livestock system in a semi-arid region. Agric. Ecosys. Environ. 2010, 137, 231–240. [Google Scholar] [CrossRef]
  3. Acosta-Martinez, V.; Rowland, D.; Sorensen, R.B.; Yeater, K.M. Microbial community structure and functionality under peanut-based cropping systems in a sandy soil. Biol. Fertil. Soils 2008, 44, 681–692. [Google Scholar] [CrossRef]
  4. Zelles, L. Phospholipid fatty acid profiles in selected members of soil microbial communities. Chemosphere 1997, 35, 275–294. [Google Scholar] [CrossRef] [PubMed]
  5. Schutter, M.E.; Dick, R.P. Comparison of fatty acid methyl ester (FAME) methods for characterizing microbial communities. Soil Sci. Soc. Am. J. 2000, 64, 1659–1668. [Google Scholar] [CrossRef]
  6. Acosta-Martinez, V.; Upchurch, D.R.; Schubert, A.M.; Porter, D.; Wheeler, T. Early impacts of cotton and peanut cropping systems on selected soil chemical, physical, microbiological and biochemical properties. Biol. Fertil. Soils 2004, 40, 44–54. [Google Scholar] [CrossRef]
  7. Zak, J.C.; Visser, S. An appraisal of soil fungal biodiversity: the crossroads between taxonomic and functional biodiversity. Biodiv. Conser. 1996, 5, 169–183. [Google Scholar] [CrossRef]
  8. Zogg, G.P.; Zak, D.R.; Ringelberg, D.B.; MacDonald, N.W.; Pregitzer, K.S.; White, D.C. Compositional and functional shifts in microbial communities due to soil warming. Soil Sci. Soc. Am. J. 1997, 61, 475–481. [Google Scholar] [CrossRef]
  9. Ringelberg, D.B.; Stair, J.O.; Almeida, J.; Norby, R.J.; O’Neill, E.G.; White, D.S. Consequences of rising atmospheric carbon dioxide levels for the belowground microbiota associated with white oak. J. Environ. Qual. 1997, 26, 495–503. [Google Scholar] [CrossRef]
  10. Olsson, P.A. Signature fatty acids provide tools for determination of the distribution and interactions of mycorrhizal fungi in soil. FEMS Micro. Ecol. 1999, 29, 303–310. [Google Scholar] [CrossRef]
  11. Madan, R.; Pankhurst, C.; Hawke, B.; Smith, S. Use of fatty acids for identification of AM fungi and estimation of AM spores in soil. Soil Biol. Biochem. 2002, 34, 125–128. [Google Scholar] [CrossRef]
  12. Pinkhart, H.C.; Ringelberg, D.B.; Piceno, Y.M.; Macnaughton, S.J.; White, D.C. Biochemical approaches to biomass measurements and community structure analysis. In Manual of Environmental Microbiology; Hurst, C.J., Crawford, R.L., Knudsen, G.R., McInerney, M.J., Stentzenbach, L.D., Eds.; ASM Press: Washington, DC, USA, 2002; pp. 101–113. [Google Scholar]
  13. Ruess, L.; Häggblomb, M.M.; García Zapatac, E.J.; Dightonc, J. Fatty acids of fungi and nematodes-possible biomarkers in the soil food chain? Soil Biol. Biochem. 2002, 34, 745–756. [Google Scholar]
  14. Bardgett, R.D.; Hobbs, P.J.; Frostegard, A. Changes in soil fungal: bacterial biomass ratios following reductions in the intensity of management of an upland grassland. Biol. Fertil. Soils 1996, 22, 261–264. [Google Scholar] [CrossRef]
  15. Frostegard, A.; Baath, E. The use of phospholipid fatty acid analysis to estimate bacterial and fungal biomass in soil. Biol. Fertil. Soils 1996, 22, 59–65. [Google Scholar] [CrossRef]
  16. Rateledge, C.; Wilkinson, S.G. Microbial Lipids; Academic: London, UK, 1998. [Google Scholar]
  17. Fulthorpe, R.R.; Roesch, L.F.W.; Riva, A.; Triplett, E.W. Distantly sampled soils carry few species in common. ISME J. 2008, 2, 901–910. [Google Scholar] [CrossRef] [PubMed]
  18. Huse, S.M.; Huber, J.A.; Morrison, H.G. Accuracy and quality of massively parallel DNA pyrosequencing. Genom. Biol. 2007, 8, R143. [Google Scholar]
  19. Liu, Z.; Lozupone, C.; Hamady, M. Short pyrosequencing reads suffice for accurate microbial community analysis. Nucl. Acids Res. 2007, 35, e120. [Google Scholar] [CrossRef] [PubMed]
  20. Roesch, L.F.; Fulthrope, R.R.; Riva, A.; Casella, G.; Hadwin, A.K.M.; Kent, A.D.; Daroub, S.M.; Camargo, F.A.O.; Farmerie, W.G.; Triplett, E.W. Pyrosequencing enumerates and contrasts soil microbial diversity. ISME J. 2007, 1, 283–290. [Google Scholar] [PubMed]
  21. Cardenas, E.; Tiedje, J.M. New tools for discovering and characterizing microbial diversity. Curr. Opin.Biotech. 2008, 19, 544–549. [Google Scholar] [CrossRef] [PubMed]
  22. Acosta-Martínez, V.; Dowd, S.E.; Sun, Y.; Allen, V.G. Tag-encoded pyrosequencing analysis of bacterial diversity in a single soil type as affected by management and land use. Soil Biol. Biochem. 2008, 40, 2762–2770. [Google Scholar] [CrossRef]
  23. Acosta-Martínez, V.; Dowd, S.E.; Sun, Y.; Wester, D.; Allen, V.G. Pyrosequencing analysis for characterization of soil bacterial populations as affected by an integrated livestock-cotton production system. Appl. Soil Ecol. 2010, 45, 13–25. [Google Scholar] [CrossRef]
  24. Dowd, S.E.; Sun, Y.; Secor, P.R.; Rhoads, D.D.; Wolcott, B.M.; James, G.A.; Wolcott, R.D. Survey of bacterial diversity in chronic wounds using pyrosequencing, DGGE, and full ribosome shotgun sequencing. BMC Micrbiol. 2008, 8, 43. [Google Scholar] [CrossRef]
  25. Dowd, S.E.; Sun, Y.; Wolcott, R.D.; Carroll, J.A. Bacterial tag-encoded FLX amplicon pyrosequencing (bTEFAP) for microbiome studies: bacterial diversity in the ileum of newly weaned Salmonella-infected pigs. Foodbor. Path. Dis. 2008, 5, 459–472. [Google Scholar] [CrossRef]
  26. McGreehan, S.L.; Naylor, D.V. Automated instrumental analysis of carbon and nitrogen in plant and soil samples. Comm. Soil Sci. Plant Anal. 1988, 19, 493–505. [Google Scholar] [CrossRef]
  27. LECO Corporation; St. Joseph, MI. Dumas Method. Organic Application Note FP 2000. Nitrogen in Soil. 1988. Form No. 203-821-005. [Google Scholar]
  28. Brookes, P.C.; Landman, A.; Pruden, G.; Jenkinson, D.S. Chloroform fumigation and the release of soil nitrogen: A rapid direct extraction method to measure microbial biomass nitrogen in soil. Soil Biol. Biochem. 1985, 17, 837–842. [Google Scholar] [CrossRef]
  29. Vance, E.D.; Brookes, P.C.; Jenkinson, D.S. An extraction method for measuring microbial biomass C. Soil Biol. Biochem. 1987, 19, 703–707. [Google Scholar] [CrossRef]
  30. Wu, J.; Joegensen, R.G.; Pommerening, B.; Chaussod, R.; Brookes, P.C. Measurement of soil microbial biomass C by fumigation: a automated procedure. Soil Biol. Biochem. 1990, 22, 1167–1169. [Google Scholar]
  31. Jenkinson, D.S. Determination of microbial biomass carbon and nitrogen in soil. In Advances in Nitrogen Cycling in Agricultural Ecosystems; Wilson, J.R., Ed.; CAB Int.: Walling-ford, UK and Marcel Dekker, New York, NY, USA, 1988; pp. 368–386. [Google Scholar]
  32. Tabatabai, M.A. Soil enzymes. In Methods of Soil Analysis: Microbiological and Biochemical Properties; Weaver, R.W., Angle, J.S., Bottomley, P.S., Eds.; SSSA Book Series No. 5; Soil Science Society of America: Madison, WI, USA, 1994; pp. 775–833. [Google Scholar]
  33. Parham, J.A.; Deng, S.P. Detection, quantification and characterization of β-glucosaminidase activity in soil. Soil Biol. Biochem. 2000, 32, 1183–1190. [Google Scholar] [CrossRef]
  34. Dowd, S.E.; Zaragoza, J.; Rodriguez, J.R.; Oliver, M.J.; Payton, P.R. Windows.NET network distributed basic local alignment search toolkit (W.ND-BLAST). BMC Bioinform. 2005, 6, 93. [Google Scholar]
  35. Altschul, S.F.; Gish, W.; Miller, W. Basic local alignment search tool. J. Mol.Biol. 1990, 215, 403–410. [Google Scholar] [CrossRef] [PubMed]
  36. Maidak, B.L.; Cole, J.R.; Lilburn, T.G.; Parker Jr., C.T.; Saxman, P.R.; Farris, R.J.; Garrity, G.M.; Olsen, G.J.; Schmidt, T.M.; Tiedje, J.M. The RDP-II (Ribosomal Database Project). Nucl. Acids Res. 2001, 29, 173–174. [Google Scholar] [CrossRef] [PubMed]
  37. Cole, J.R.; Chai, B.; Farris, R.J.; Wang, Q.; Kulam-Syed-Mohideen, A.S.; McGarrell, D.M.; Bandela, A.M.; Cardenas, E.; Garrity, G.M.; Tiedje, J.M. The ribosomal database project (RDP-II): introducing myRDP space and quality controlled public data. Nucl. Acids Res. 2007, 35, 169–172. [Google Scholar] [CrossRef]
  38. Edgar, R.C. MUSCLE: multiple sequence alignment with high accuracy and high throughput. Nucl. Acids Res. 2004, 32, 792–1797. [Google Scholar]
  39. Felsenstein, J.P. Phylogeny Inference Packageversion 3.2. Cladistics1989; 5, 164–166.
  40. Felsenstein, J.P. Phylogeny Inference Package, version 3.6. Distributed by the author. Department of Genome Sciences, University of Washington: Seattle, WA, USA, 2005.
  41. Schloss, P.D.; Handelsman, J. Introducing DOTUR, a computer program for defining operational taxonomic units and estimating species richness. Appl. Environ. Microbiol. 2005, 71, 1501–1506. [Google Scholar] [CrossRef] [PubMed]
  42. Seber, G.A.F.; Wild, C.J. Nonlinear Regression; John Wiley: New York, NY, USA, 1989. [Google Scholar]
  43. Chao, A.; Bunge, J. Estimating the number of species in a stochastic abundance model. Biometrics 2002, 58, 531–539. [Google Scholar] [CrossRef] [PubMed]
  44. Acosta-Martinez, V.; Lascano, R.; Booker, J.D.; Zobeck, T.M.; Upchurch, D.R. Dryland Cropping Systems Influence Microbial Biomass and Enzyme Activities in a Sandy Soil in a Semiarid Region. Submitted to. Biol. Fertil. Soils. 2010, (in press). [Google Scholar]
  45. Liebig, M.; Carpenter-Boggs, L.; Johnson, J.M.F.; Wright, S.; Barbour, N. Cropping system effects on the soil biological characteristics in the Great Plains. Renew. Agric. Food Sys. 2006, 21, 36–48. [Google Scholar] [CrossRef]
  46. Lacey, J. Actinomycetes in soils, composts and fodders. In Actinomycetales: Characteristics and Practical Importance; Sykes, G., Skinner, F.A., Eds.; Academic Press: New York, NY, USA, 1973; pp. 231–251. [Google Scholar]
  47. Fierer, N.; Bradford, M.A.; Jackson, R.B. Toward an ecological classification of soil bacteria. Ecology 2007, 88, 1354–1364. [Google Scholar] [CrossRef] [PubMed]
  48. Kersters, K.; De Vos, P.; Gillis, M.; Swings, J.; Vandamme, P.; Stackebrandt, E. Introduction to the proteobacteria. In The Prokaryotes, 3rd ed.; Dwarkin, M., Falkow, S., Rosenberg, E., Schleifer, K.H., Stackebrandt, E., Eds.; Springer: New York, NY, USA, 2006; volume 5, pp. 3–37. [Google Scholar]
  49. Weiss, P.; Schweitzer, B.; Amann, R.; Simon, M. Identification in situ and dynamics of bacteria on limnetic organic aggregates (Lake Snow). Appl. Environ. Microbiol. 1996, 62, 1998–2005. [Google Scholar] [PubMed]
  50. Abell, G.C.J.; Bowman, J.P. Colonization and community dynamics of class Flavobacteria on diatom detritus in experimental mesocosms based on Southern Ocean seawater. FEMS Microbiol. Ecol. 2005, 53, 379–391. [Google Scholar] [CrossRef] [PubMed]
  51. Jangid, K.; Williams, M.A.; Franzluebbers, A.J.; Sanderlin, J.S.; Reeves, J.H.; Jenkins, M.B.; Endale, D.M.; Coleman, D.C.; Whitman, W.B. Relative impacts of land-use, management intensity and fertilization upon soil microbial community structure in agricultural systems. Soil Biol. Biochem. 2008, 40, 2843–2853. [Google Scholar] [CrossRef]
  52. Roldan, A.; Salinas-Garcia, J.R.; Alguacil, M.M.; Diaz, E.; Caravaca, F. Soil enzyme activities suggest advantages of conservation tillage practices in sorghum cultivation under subtropical conditions. Geoderma 2005, 129, 178–185. [Google Scholar] [CrossRef]
  53. Kennedy, A.C.; Schillinger, W.F. Soil quality and water intake in traditional-till vs. no-till Paired farms in Washington's Palouse region. Soil Sci.Soc. Am. J. 2006, 70, 940–949. [Google Scholar]
  54. Acosta-Martínez, V.; Mikha, M.; Vigil, M.F. Microbial communities and enzyme activities in soils Ander alternative crop rotations compared to wheat-fallow for the Central Great Plains. Appl. Soil Ecol. 2007, 37, 41–52. [Google Scholar] [CrossRef]
  55. Upchurch, R.; Chiu, C.Y.; Everett, K.; Dyszynski, G.; Coleman, D.C.; Whitman, W.B. Differences in the composition and diversity of bacterial communities from agricultural and forest soils. Soil Biol. Biochem. 2008, 40, 1294–1305. [Google Scholar]
  56. Janssen, P.H. Identifying the dominant soil bacteria taxa in libraries of 16S rRNA and 16S rRNA genes. Appl. Environ. Microbiol. 2006, 72, 1719–1728. [Google Scholar] [CrossRef] [PubMed]
  57. Dinamarca, M.A.; Cereceda-Balic, F.; Fadic, X.; Seeger, M. Analysis of striazine-degrading microbial communities in soils using most-probable-number enumeration and tetrazolium salt detection. Intern. Microbiol. 2007, 10, 209–215. [Google Scholar]
  58. Liebner, S.; Harder, J.; Wagner, D. Bacterial diversity and community structurein polygonal tundra soils from Samoylov Island, Lena Delta, Siberia. Int. Microbiol. 2008, 11, 195–202. [Google Scholar] [PubMed]
  59. Allen, V.G.; Brown, C.P.; Kellison, R.; Segarra, E.; Green, C.J.; Wheeler, T.A.; Dotray, P.A.; Conkwright, J.C.; Green, C.J.; Acosta-Martinez, V. Integrating cotton and beef production to reduce water withdrawal from the Ogallala aquifer in the Southern High Plains. Agron. J. 2005, 97, 556–567. [Google Scholar] [CrossRef]
  60. Allen, V.G.; Brown, C.P.; Segarra, E.; Green, C.J.; Wheeler, T.A.; Acosta-Martinez, V.; Zobeck, T.M. In search of sustainable agricultural systems for the Llano Estacado of the U.S. Southern High Plains. Agr. Ecosyst. Environ. 2008, 124, 3–12. [Google Scholar] [CrossRef]
  61. Larkin, R.P. Characterization of soil microbial communities under different potato cropping systems by microbial population dynamics, substrate utilization, and fatty acid profile. Soil Biol. Biochem. 2003, 35, 1451–1466. [Google Scholar] [CrossRef]
  62. Larkin, R.P.; Honeycutt, W. Effects of different 3-year cropping systems on soil microbial communities and Rhizoctonia diseases of potato. Phytopathology 2006, 96, 68–79. [Google Scholar] [CrossRef] [PubMed]
  63. Spain, A.M.; Krumholz, L.R.; Elshahed, M.S. Abundance, composition, diversity and novelty of soil proteobacteria. ISME J. 2009, 3, 992–1000. [Google Scholar] [CrossRef] [PubMed]
  64. Lauber, C.L.; Hamady, M.; Knight, R.; Fierer, N. Pyrosequencing-based assessment of soil pH as a predictor of soil bacterial community structure at the continental scale. Appl. Environ. Microbiol. 2009, 15, 5111–5120. [Google Scholar] [CrossRef]

