Article

Stable Isotope Analyses of Multiple Tissues of Great Shearwaters (Ardenna Gravis) Reveals Long-Term Dietary Stability, Short-Term Changes in Diet, and Can be Used as a Tool to Monitor Food Webs

1
National Oceanic and Atmospheric Administration, National Ocean Service, Stellwagen Bank National Marine Sanctuary, 175 Edward Foster Road, Scituate, MA 02066, USA
2
Department of Biology, Boston University, Boston, MA 02215, USA
3
Department of Biological and Environmental Sciences, Long Island University Post, Brookville, NY 11548, USA
*
Author to whom correspondence should be addressed.
Diversity 2019, 11(9), 163; https://doi.org/10.3390/d11090163
Submission received: 6 August 2019 / Revised: 16 August 2019 / Accepted: 19 August 2019 / Published: 12 September 2019
(This article belongs to the Special Issue Stable Isotopes in Ecological Research)

Abstract

:
The great shearwater (Ardenna gravis) is a common pelagic bird with a distribution that spans almost the entire Atlantic basin, which in conjunction with its relatively high abundance, makes great shearwaters an effective bio indicator. We compared δ13C and δ15N values from the feathers, red blood cells (RBCs), and plasma of great shearwaters collected in 2014 and 2015 from the waters off Massachusetts and Cape Cod. The δ13C and δ15N values of RBCs were quite constant between sampling periods and years, suggesting a generally stable food web over that time period. However, the δ13C of plasma indicates a small seasonal change in diet between July and September for both years, with plasma δ15N values suggesting a slight increase in trophic level late in summer. Comparison of the δ15N of RBCs and plasma indicates that great shearwaters experienced a diet shift during the first few weeks of summer 2014, but not in 2015. Comparisons with other studies suggest that these shearwaters feed at a lower trophic level than great shearwaters sampled in the Bay of Fundy and that there is a decrease in δ13C with increasing latitude, which could indicate a more pelagic diet in northern waters. Stable isotope analysis of the sixth primary feathers provided evidence that these feathers are molted in the Northern Hemisphere and that the diet of great shearwaters shortly after arrival was different in 2014 and 2015. This study demonstrates that within species comparisons of tissue isotopic signatures over time and comparisons of isotopic signatures of tissues with different turnover rates, can detect changes in diet and be used as a tool to monitor for changes in marine food webs over time and space. The relevant signals remain informative even in the absence of species-specific data on tissue-diet discrimination factors, tissue turnover rates, or knowledge of dietary components and their stable isotopic signatures, suggesting dietary changes indicative of a corresponding change in the food web.

1. Introduction

The Gulf of Maine is a semi-enclosed sea located on the eastern coast of North America that is bordered by the states of Massachusetts, New Hampshire, Maine, and the Canadian provinces of Nova Scotia and New Brunswick. It is an area of very high productivity with around 3300 documented species of macrobiota, as well as a strong fishing community and tourism sector [1]. Environmental disturbances brought about by global climate change can greatly influence ecosystems and can cause species to change behavior, distribution, or abundance, affecting whole food webs [2]. Given the extent of economic activity that takes place in the Gulf of Maine [1,3] and its potential vulnerability to climate change [4,5], understanding how environmental and anthropogenic factors can affect and change food webs in this region is of great importance.
Food webs have multiple and complex connections [6]. A change in the population size of an important species can profoundly influence many other species in that ecosystem [7,8,9,10,11,12]. In order for researchers to understand how a system might react to population changes of important species within a food web, they must understand the major food web interactions and the trophic position of the important players within it. However, this can be a daunting task when relying solely on more traditional methods such as direct observation and gut analysis, suggesting that other approaches must also be taken [13].
Stable isotope analysis (SIA) offers a means of summarizing food web interactions. SIA is a more objective, integrative, and quantitative method of studying diets and trophic positions of organisms than many other techniques [14,15,16,17]. Typically, the 15N/14N ratio of tissues increases with and are used as a measure of trophic level [18,19]. The ratio of 13C/12C often changes little and does not become enriched much from one trophic level to the next [20,21]. As such, carbon stable isotope ratios can be used to determine changes or differences in sources of diet in a system, if the probable components or sources of diet differ isotopically. For example, in marine systems δ13C values tend to be less negative in benthic or nearshore systems and relatively more negative in pelagic or offshore food webs [22,23].
Rather than attempting to sample an entire food web and understand the interactions of all the components within that food web, an alternative approach is to study select species that, as part of their feeding behavior, sample large portions of the food web [24]. For example, marine birds, as top predators, are good indicators of changes in food webs, the overall health of their ecosystem [22,24,25,26] and the effects of climate change, pollution, or fishing on the birds [27,28]. Several studies involving marine birds as indicator species have been conducted to assess the effects of global climate change and other factors on ecosystems [24,29,30,31]. The analysis of the diets of marine birds offers potential insights into food web interactions, changes in food webs, and thus the overall health and condition of the marine environment [31].
We are interested in gaining a better understanding of and monitoring the state of food webs in Massachusetts Bay and the waters off of Cape Cod, Massachusetts and in the Gulf of Maine in general, especially as they affect the larger and more mobile predators that can follow the movement of their prey. This is a large expanse of water and therefore we chose the great shearwater (Ardenna gravis) as our indicator species for several reasons: Great shearwaters captured off Cape Cod and in Massachusetts Bay travel widely, averaging 515 km per week, but appear to spend most of their time in the Gulf of Maine before beginning their migration south in August and September [32,33]. They feed on a wide range of prey species and as top marine predators, great shearwaters are sensitive to changes in their prey populations, such as sand lance, herring, and mackerel [34,35,36], as well as abiotic factors such as currents, surface temperature, and salinity [28,36,37]. Great shearwater populations have experienced mass mortality events of emaciated birds, the causes of which are currently unknown, suggesting their sensitivity as bioindicators of important ecological events that bear further investigation [37,38]. However, there are inevitably tradeoffs when selecting an indicator species. Thus, while great shearwaters sample food webs over wide areas, they only feed in the top few meters of the water column [39] and are therefore limited to sampling the portion of the food web that enters that portion of the water column. In addition, they forage predominantly in the Rim and other shallow water (<100 m deep) habitats of the Gulf of Maine, generally avoiding the deeper basins [32].
We studied the diets and feeding behaviors of great shearwaters captured in 2014 and 2015 by analyzing the SI ratios of their plasma, RBCs (red blood cells), and feathers. Different tissues have different turnover rates, where the SI ratios of tissues with faster turnover rates, such as plasma, reflect an integration of diet consumed over the several days prior; those of tissues with slower turnover rates such as RBCs can reflect an integration of diet over several weeks prior to sampling. Feather tissue, once grown, does not change until it is replaced in the next molt and therefore reflects the diet during the period of the particular feather’s growth. Since fluctuations in prey populations are reflected in the δ13C and δ15N of tissues of the great shearwaters [35], shifts in the carbon and nitrogen isotope ratios within and between tissues from birds caught over a period of time indicate changes in diet that may reflect important changes to the food web and ecosystem in which the shearwaters forage. Since prey species and food webs can change over time and space, we investigated potential effects of season/location and year on the diets and trophic position of the great shearwaters.
Great shearwaters breed in the Southern Atlantic Ocean [40,41] rather than the Northern Atlantic. Adults begin their migration north mid-April [42], arriving in the Gulf of Maine in May and June [43,44]. Great shearwaters begin migrating south in August and September [32], but many still remain in the North Atlantic into November [45]. While it has been suggested that great shearwaters molt in the North Atlantic [44], evidence also suggests that some great shearwaters begin their molt in the South Atlantic and then complete it in the North Atlantic [46].
Given the characteristics of great shearwater migration, the differences in turnover rates and time of formation of blood plasma, RBCs, and feathers, and given that we sampled shearwaters in July and again in September for two different years, we formulated the following hypotheses:
  • Great shearwaters that winter in the waters of Massachusetts Bay and Cape Cod may molt the sixth primary (p6) flight feather in either the Southern or Northern Hemisphere.
  • The diet of great shearwaters and the portion of the food web they sample varies between years.
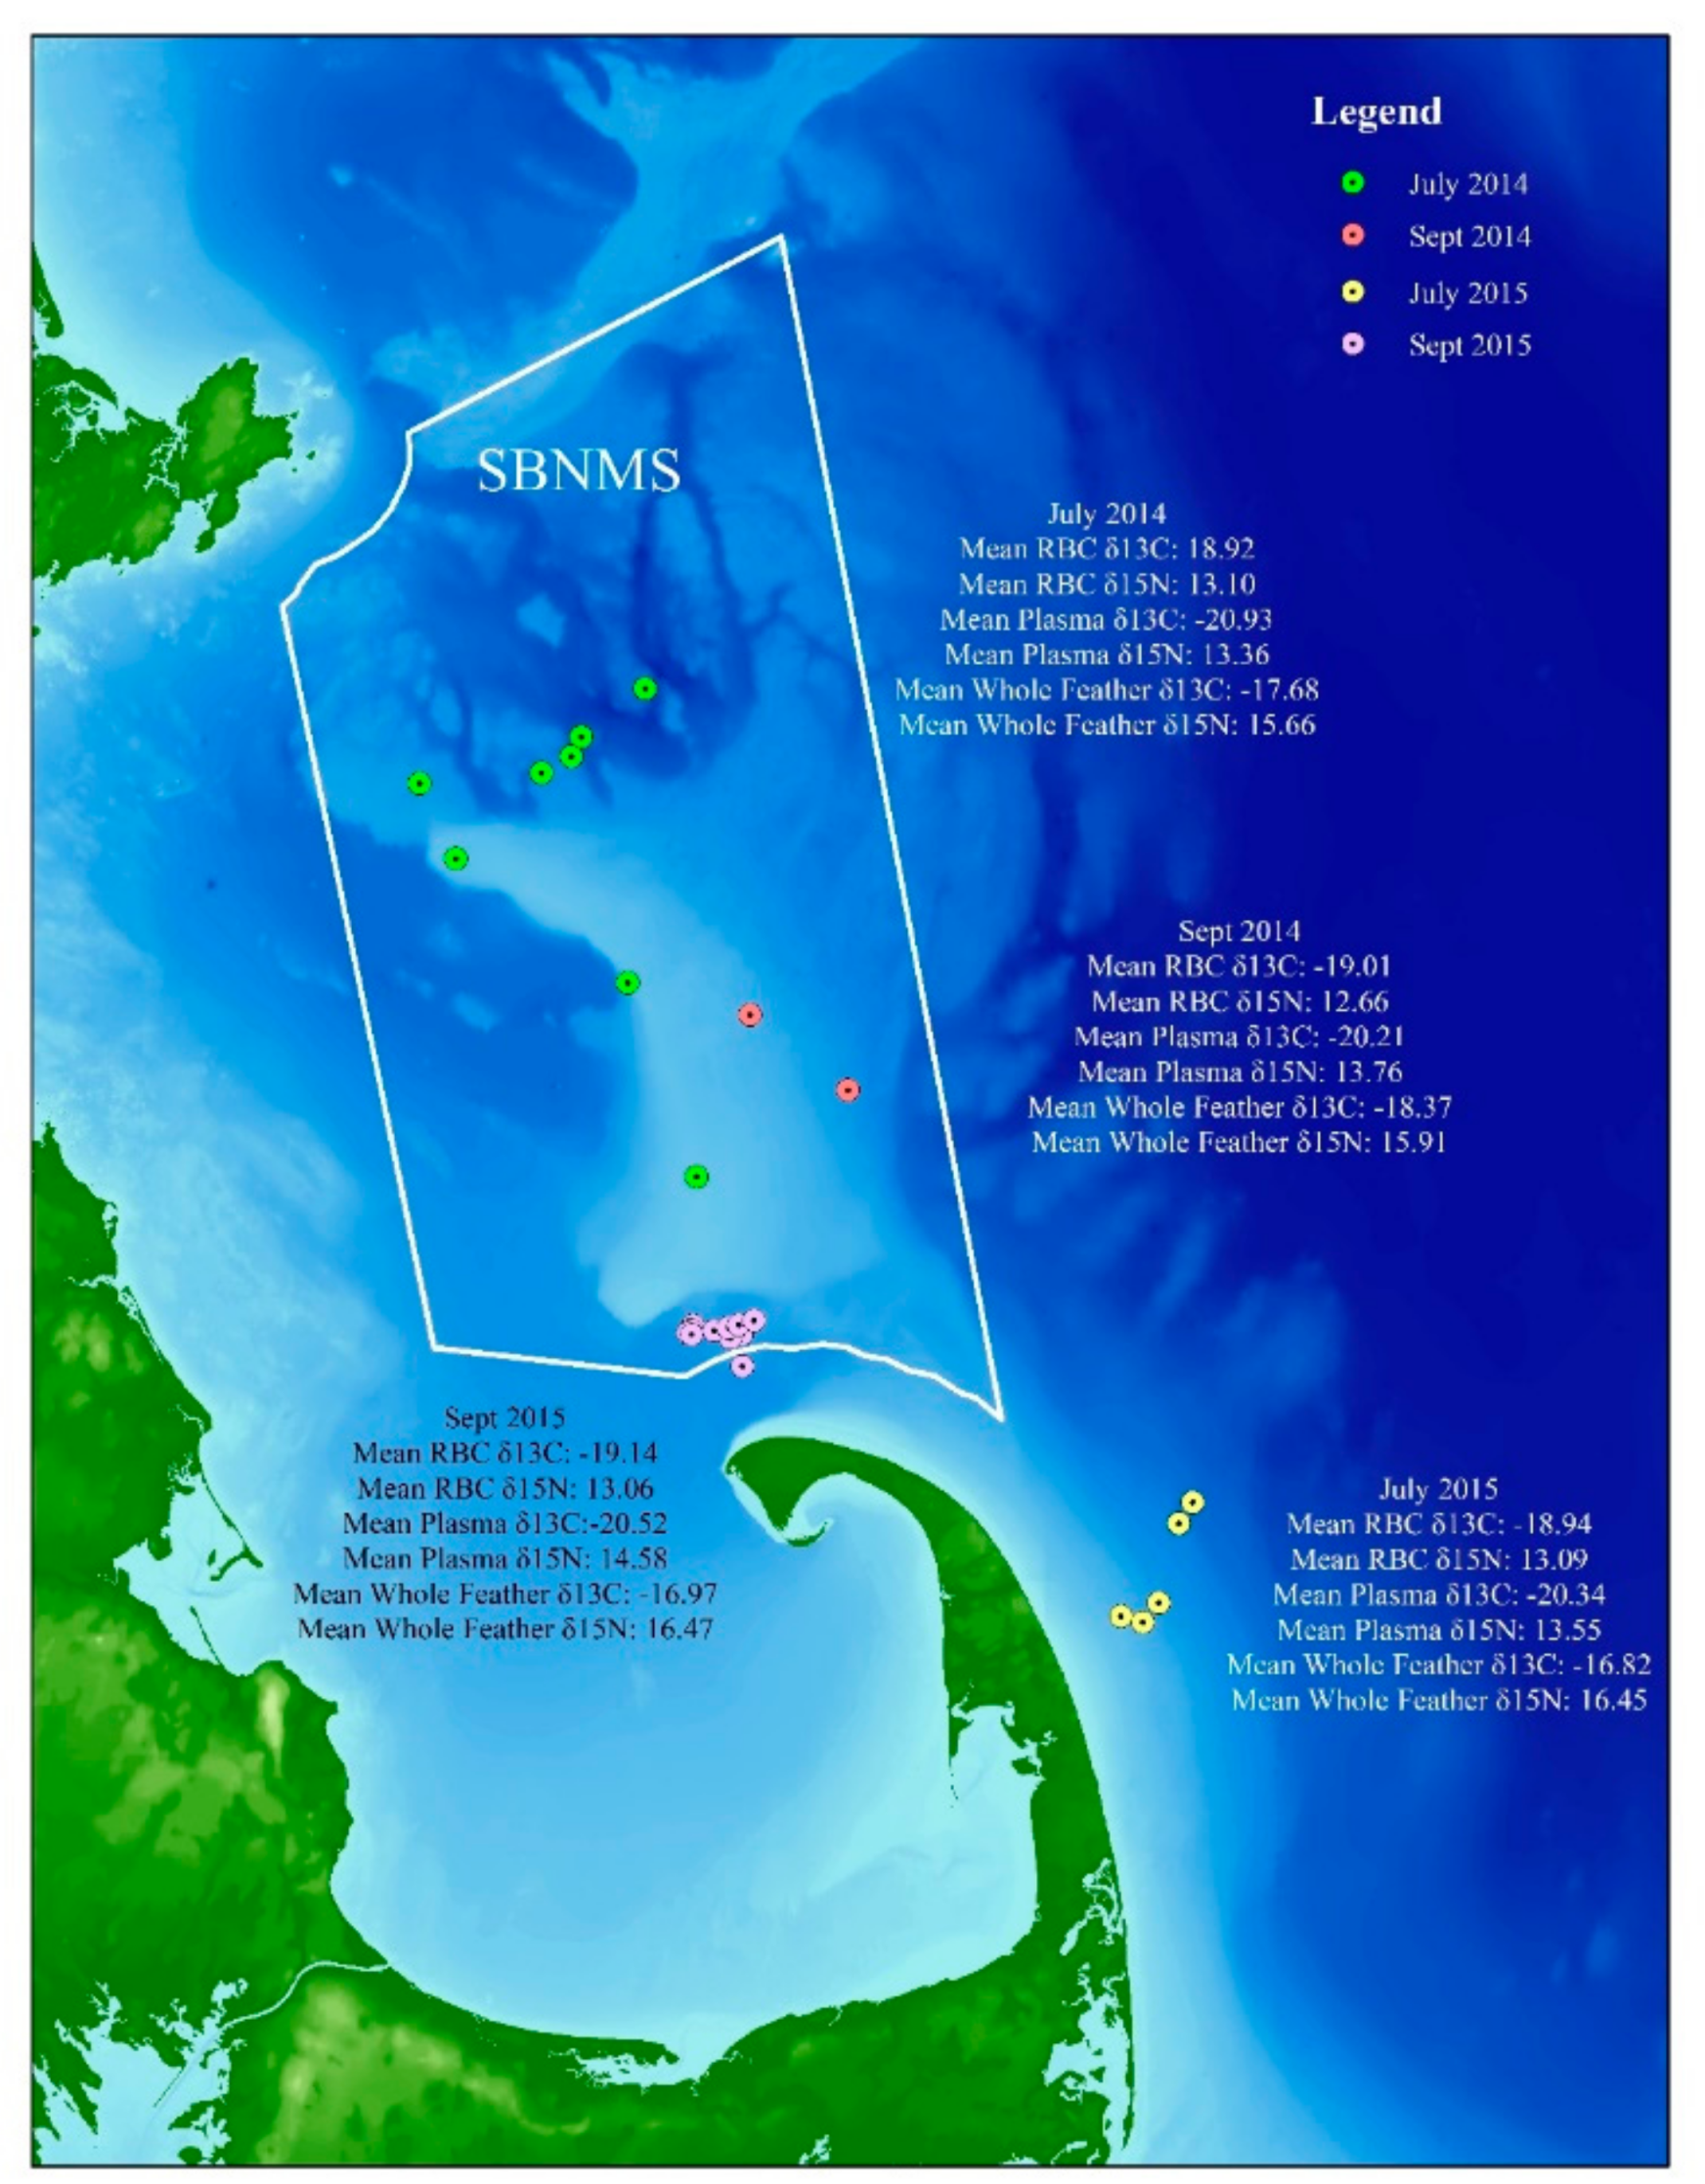
  • The diet of great shearwaters and the portion of the food web they sample varies seasonally or by location.
Based on the above hypotheses and the fact that we sampled blood plasma, blood RBCs, and the tip of the p6 feather of great shearwaters in both mid-July and mid-September, we made the following predictions:
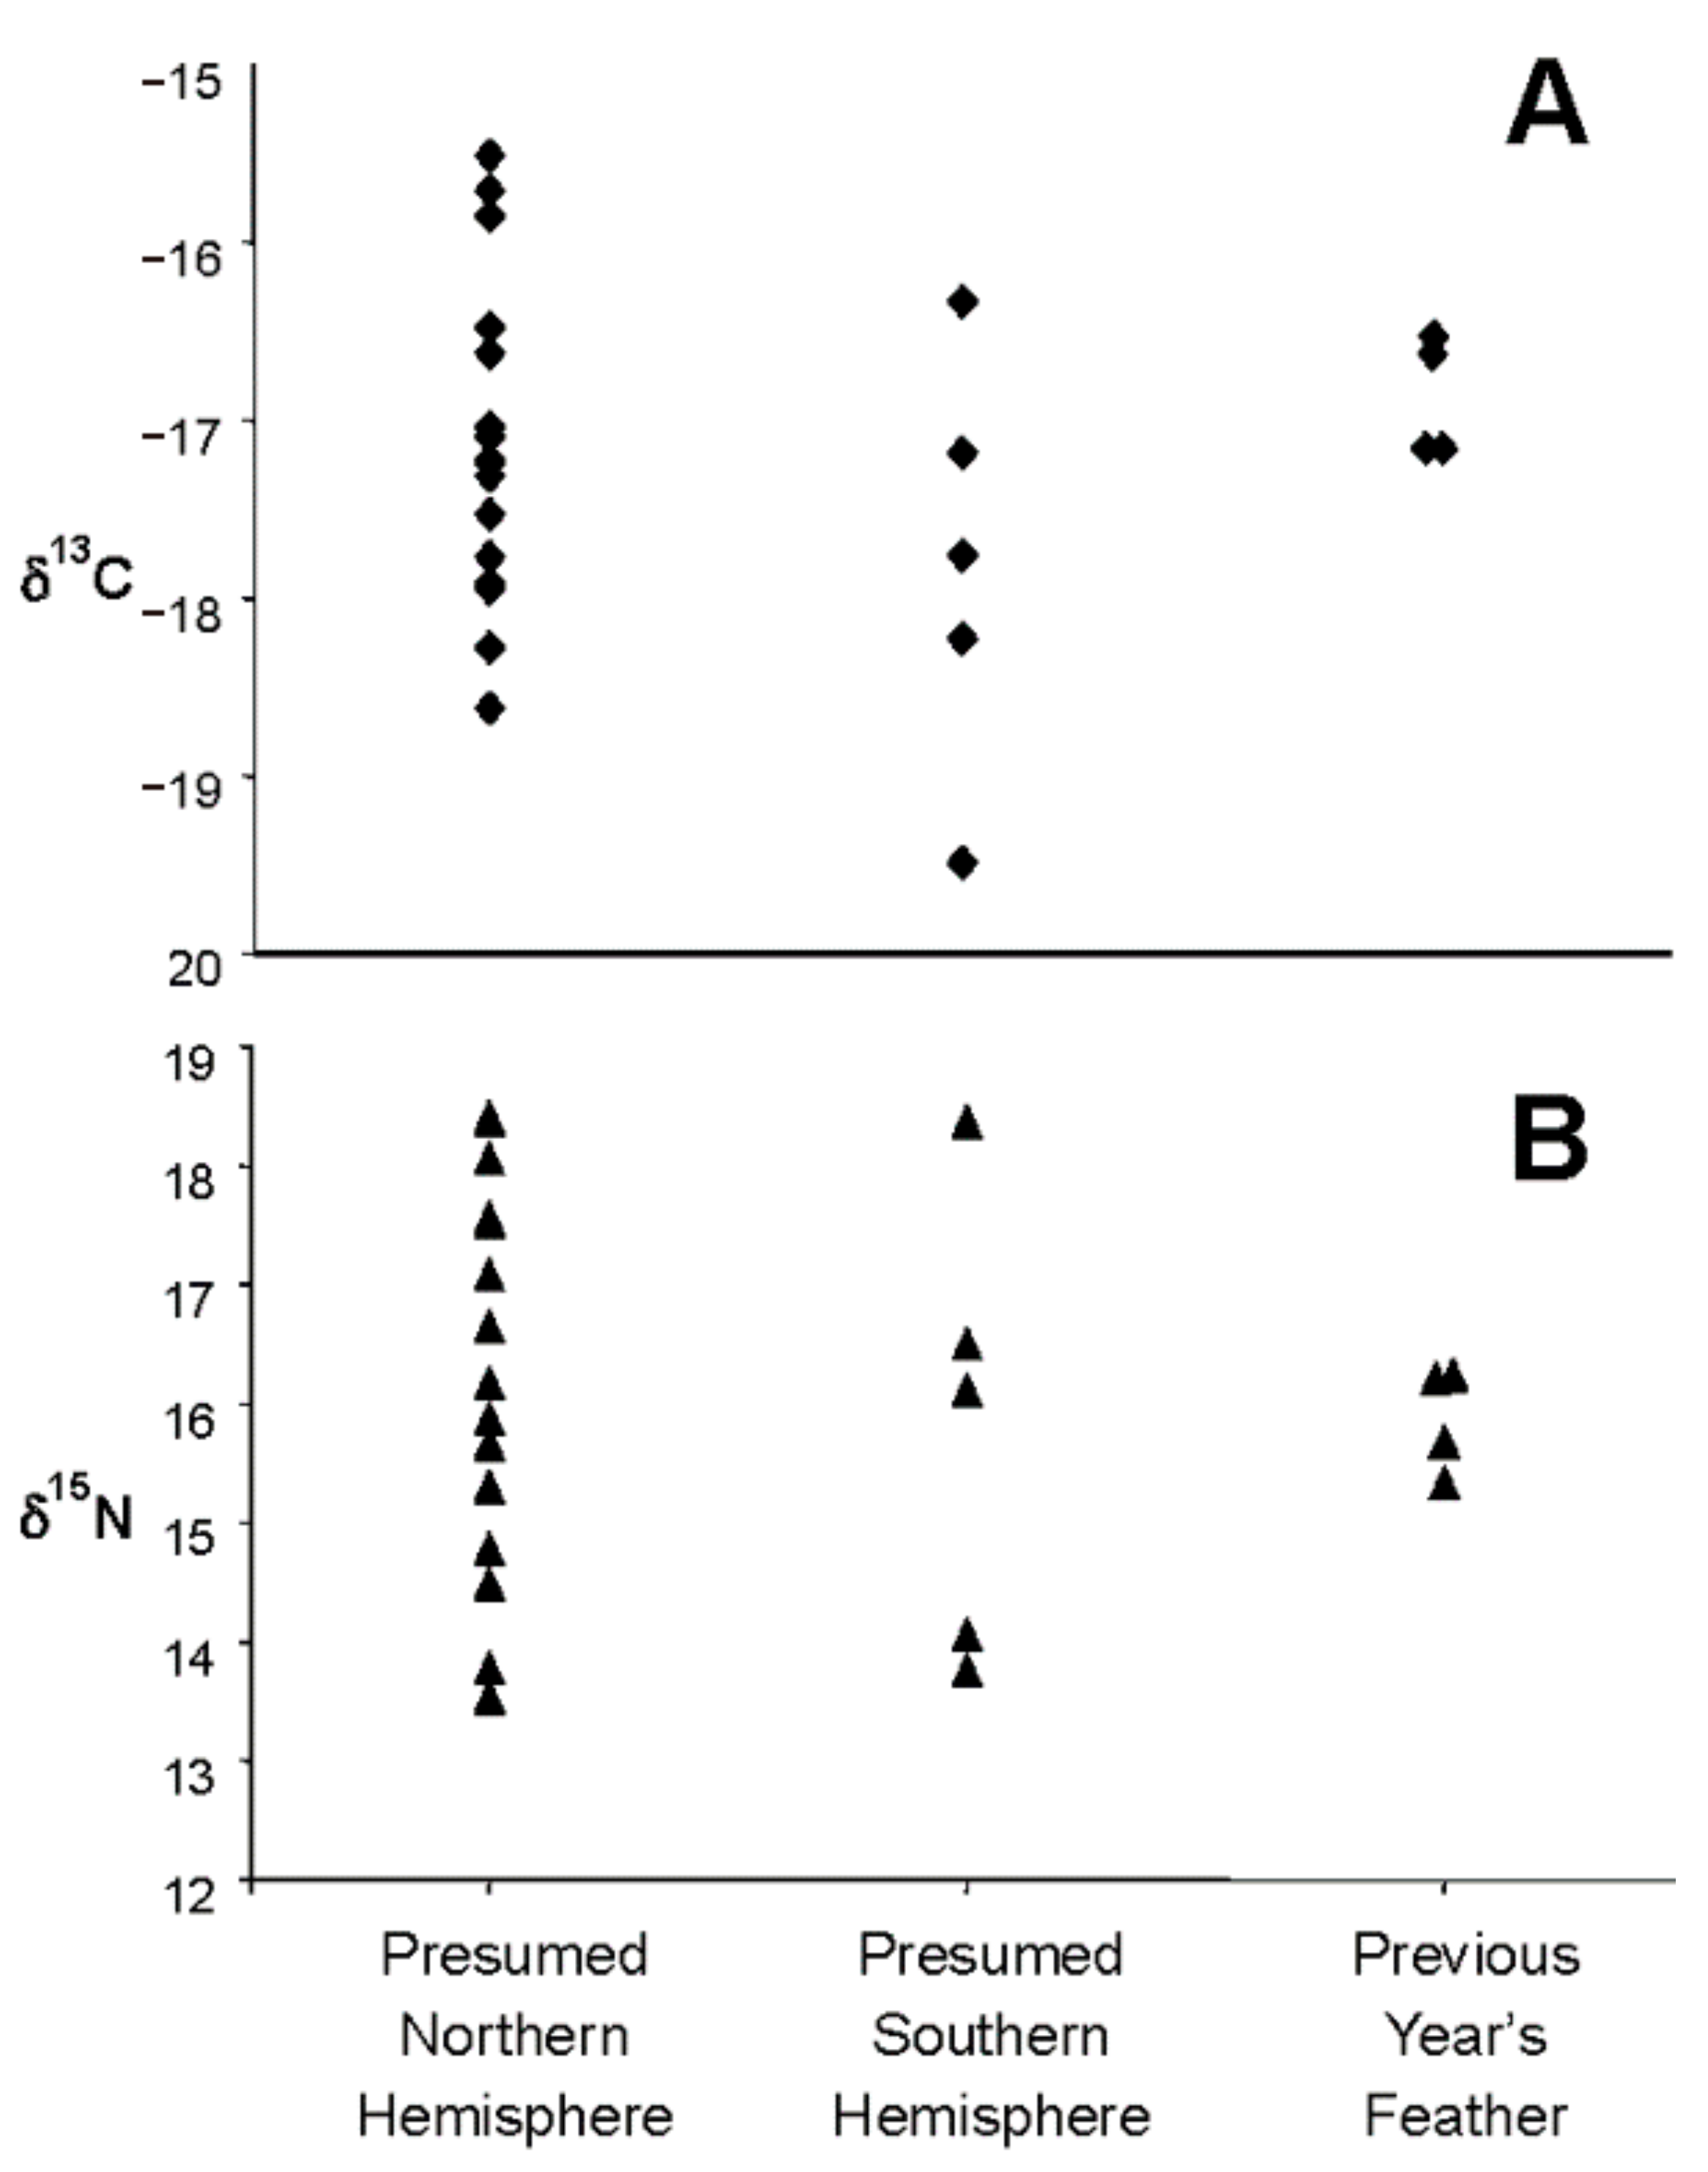
  • If the molt of the p6 feather is variable and is molted by some birds in the South Atlantic and other birds in the North Atlantic, we should see evidence of a bimodal distribution in the δ13C of the feathers, reflecting the difference in signal between great shearwater feathers grown in northern and Southern Hemispheres. Sixth primary feathers of birds whose molt was completed when captured in July should have molted the p6 feather in the Southern Hemisphere and therefore have relatively enriched δ13C-values, whereas the p6 feathers of birds whose molt was not completed by the July capture should have molted in the Northern Hemisphere and therefore be relatively depleted in 13C [37,47].
  • If the food web and diet of great shearwaters in Massachusetts Bay and the waters off Cape Cod differs from year to year, then we predict there will be a significant difference in both δ13C and δ15N of the RBCs, plasma, and/or feathers of birds caught in different years.
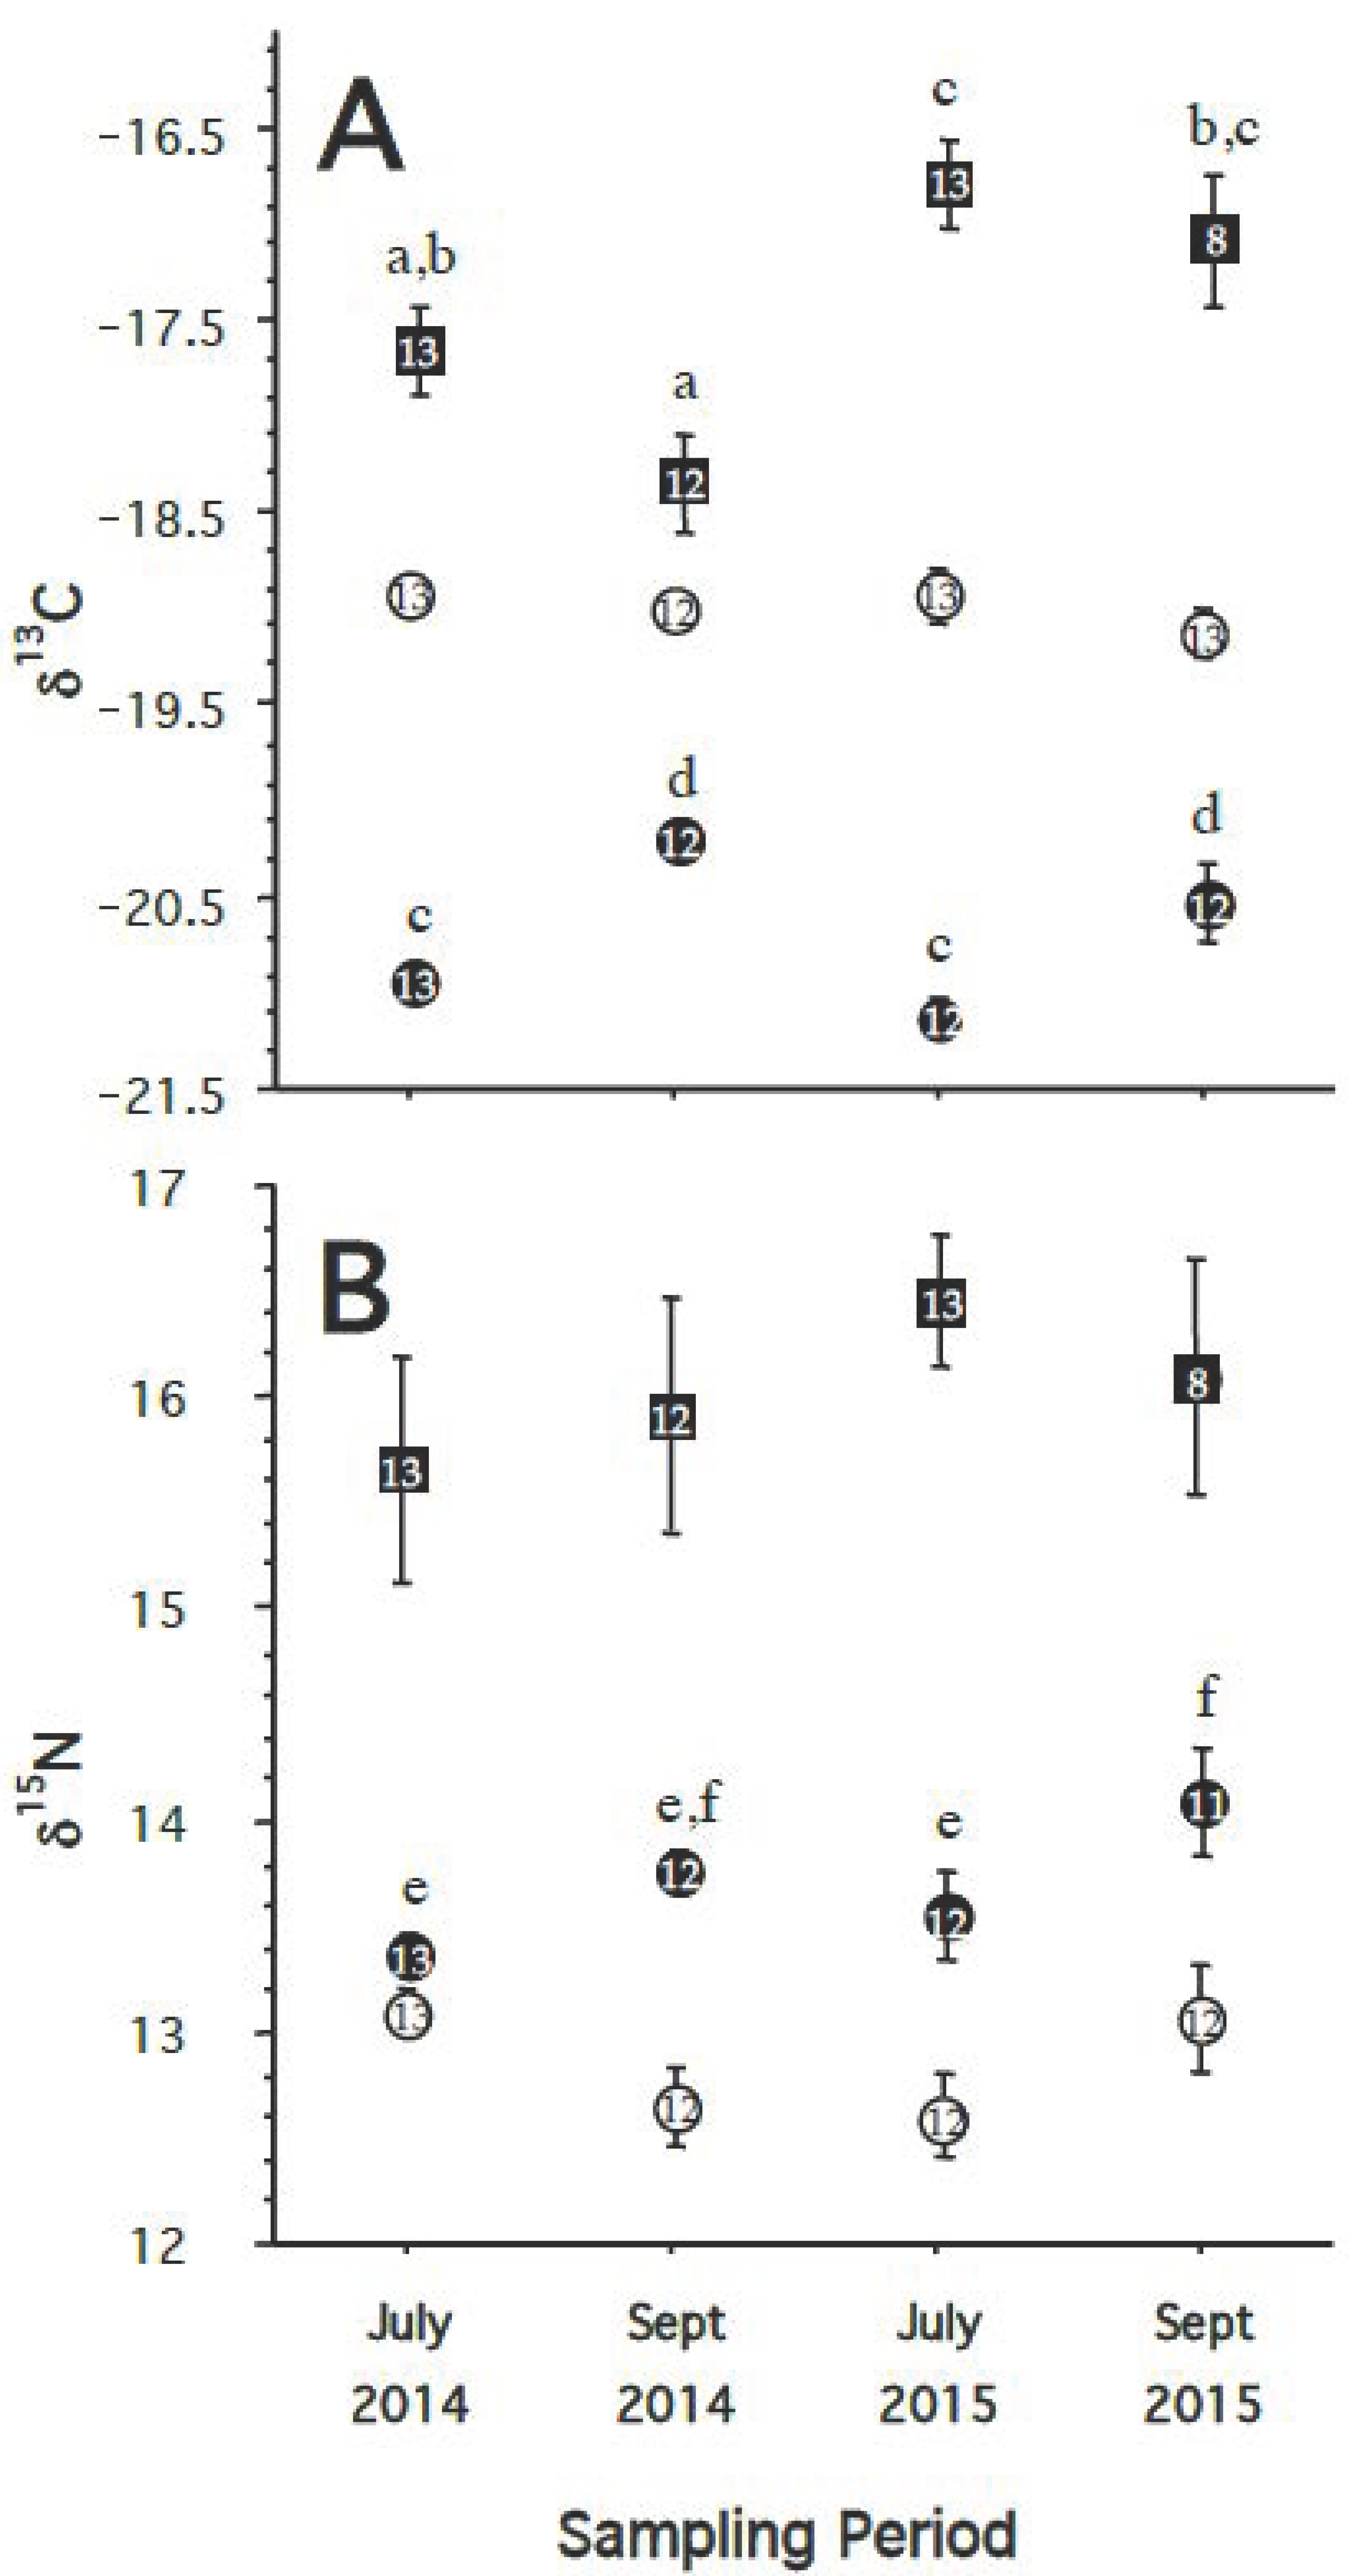
  • If there are changes in the diet and food web on a seasonal basis or between individual sampling locations, we would expect to see changes in the δ13C and δ15N of blood plasma (shorter turnover rate) but not in the δ13C and δ15N of RBCs (longer turnover rate). Consequently, when comparing tissues, we predict that the Δ13Cplasma-RBC and Δ15Nplasma-RBC would also differ significantly between capture events. Likewise, we predict that the Δ13Cfeather-RBC and Δ15Nfeather-RBC would differ significantly between capture events.
Previous studies have found a negative relationship between latitude and δ13C values in the blood of Cory’s shearwaters (Calonectris borealis) in the North Atlantic [48,49]. Therefore, we also compared the δ13C and δ15N values of great shearwater RBCs and feathers from our study with those from previous studies [34,35,37,46].

2. Materials and Methods

2.1. Capture

Great shearwaters were collected in the Stellwagen Bank National Marine Sanctuary (SBNMS) and adjoining waters in 20–21 July and 14 September 2014, 8–12 July and 15–16 September 2015. Rafts of great shearwaters resting on the surface of the water were spotted and identified from onboard a NOAA research vessel using binoculars. Individual shearwaters were then captured using a bait and net technique, wherein birds were enticed to come close enough to a small dinghy that they could be caught using a long-handled fish net. Once a bird was captured, the bird was placed in a pillowcase to calm it and prevent unnecessary movement that might cause the bird to harm itself.

2.2. Field Data Collection

The time and location of capture were recorded, after which the birds were weighed to the nearest whole gram using a spring scale. The birds were then banded; blood and feather samples were then taken for SIA. Less than 1 mL of blood was taken into 3–4 capillary tubes from the metatarsal vein or, less frequently, the basilic vein of the bird [50], and then stored on ice for no longer than 16 h before they were centrifuged to separate the plasma and cellular (referred to in this paper as red blood cells or RBCs) fractions. These were then frozen until SIA. Two to three cm from the tip of the sixth primary (p6) feather were clipped except from birds where the p6 was still growing in, missing, or damaged, in which case we used the p7 primary feather. It should be noted that in these cases, the p7 was grown the previous year. The feathers were then stored until analysis. Hereafter all the feathers are referred to as p6 feathers for the sake of simplicity.
The molt score for each bird was recorded following Ginn and Melville [51], where a score of zero indicates a worn feather grown the previous year and 5 a new, fully grown feather. Scores in between indicate different degrees of feather growth. Thus, a score of zero for a bird indicates all ten primary feathers are old and were grown the previous year, while a score of 50 indicates all primary flight feathers are new and fully grown in the current year.

2.3. Stable Isotope Analysis

Blood RBC, plasma, and feather samples were kept in a freezer until ready for SIA at the Boston University Stable Isotope Laboratory. Feathers were soaked in an methanol:chloroform solution overnight to remove lipids; the solution was decanted and the remaining solution was allowed to evaporate in the hood. The feathers were placed in a 60 °C oven overnight to completely dry. The feathers were then placed in liquid nitrogen and ground to a powder, following which approximately 1 mg was placed in a tin capsule for analysis. We did not extract lipid from either the plasma or RBC portions of the blood, but that is unlikely to have much effect on the resulting δ13C [52,53]. These tissues were pipetted into tin capsules and placed in a 60 °C drying oven overnight before folding and then underwent continuous flow measurements through the GVI IsoPrime (Elementar Americas, Inc., Ronconcoma, NY) isotope ratio mass spectrometer (IRMS) and a Eurovector elemental analyzer (Eurovector, Milan, Italy). The sample isotope ratio is compared to a secondary gas standard, whose isotope ratio has been calibrated against NBS 20 (Solenhofen Limestone), NBS 21 (Spectrographic Graphite), and NBS 22 (Hydrocarbon Oil) for CO2 and against atmospheric N2 and IAEA standards N-1, N-2, and N-3 (ammonium sulfate standards) for N2. Ratios of 13C/12C and 15N/14N are expressed as the relative per mil (‰) difference between the samples and international standards (Vienna PDB carbonate and N2 in air, respectively) where:
δX = (Rsample/Rstandard − 1) × 1000 (‰)
where X = 13C or 15N and R = 13C/12C or 15N/14N.
Reproducibility of the standards were within 0.2 per mil of expected values for both nitrogen and carbon.

2.4. Statistical Analysis

To test the Hypothesis (1) that the p6 feathers of some great shearwaters are molted in the Southern Hemisphere, while the p6 feathers of other great shearwaters are molted in the Northern Hemisphere, we split the results of SIA of the feathers into three groups. We assumed that the p6 feathers from birds whose molt score was 50 had completed molt and grown in the Southern Hemisphere. The reasoning behind this was that if the birds had completed their entire molt by mid-July, they would probably have been young of the year and have molted in the Southern Hemisphere [54]. Alternatively, the second pre-basic molt (PB2) may begin in the Southern Hemisphere, suspend, and then be completed in the Northern Hemisphere in after second year (ASY) birds and possibly nonbreeders [54]. Therefore, these birds probably started molting earlier than those whose molt was still incomplete and thus it was possible that the p6 was molted and replaced in the Southern Hemisphere. We assumed that the p6 feathers from birds with an incomplete molt (molt score < 50) were grown in the Northern Hemisphere, probably in June of the year that the feather was collected. Finally, there were some p6 and p7 feathers that we sampled that were worn, obviously not yet molted, and from the previous year’s feather growth. Since we had no basis by which to assign these feathers to one hemisphere or the other, we put them in their own group. Since all great shearwaters captured in September of either year had completed their molt, we had no basis to assign the p6 to either the Southern or Northern Hemisphere. Consequently, we only used data from feathers collected in July of 2014 and 2015 and did not include feathers collected in September of these years in the analysis. The three groups—Northern Hemisphere, Southern Hemisphere, and old feathers—were compared using a single factor ANOVA (type III sums of squares, p < 0.05).
To test the Hypothesis (2) that there are year-to-year differences in the diet/food web of great shearwaters that winter in the waters of Massachusetts Bay and Cape Cod, we used a t-test to compare the δ13C and δ15N each of plasma, RBCs, and feathers of 2014 and 2015.
Since captures of birds essentially took place at a different place, each trip, location and season were confounded (Figure 1). However, it is unlikely that the tissues of great shearwaters caught at one location are actually indicative of their diet or the food web at that particular location in any case, since they travel widely and frequently [32]. We combined the data from all the birds caught on a trip into a single capture event, for a total of four capture events or periods: July 2014, September 2014, July 2015, and September 2015. To test the Hypothesis (3) that there are seasonal/locational differences in the diet/food web of great shearwaters off of Massachusetts, we did separate one-way ANOVAs (type III sums of squares) for each tissue, with capture event as the factor, and either δ13C or δ15N as the dependent variable. Comparisons were within tissues, not between tissues, and differences were deemed significant if p < 0.05. Where the results of the ANOVA were found to be significant, we did a Fischer’s Protected Least Significant Difference (PLSD) to determine which individual trips were significantly different from the others. We compared differences between feather and RBCs and plasma and RBCs (Δ13C and Δ15N) in a like manner. We did not compare the Δ13Cfeather-plasma or the Δ15Nfeather-plasma as those values represented very different time periods and one probably has little bearing on the other.
We also tested for a latitudinal gradient by comparing our data with the data from previous studies. Since we did not have access to the raw data of previous studies, we compared the mean δ13C and δ15N of RBCs of the listed capture events (Ronconi 2010, Gulka 2017, and this study) as well as for feathers (Haman 2013 and this study). We used linear regression of the RBC δ13C to see if there was a latitudinal trend. However, linear regression did not seem appropriate for the δ15N data so we used ANOVA (type III sums of squares) to compare the δ15N values at the different locations. It should be noted that the delta values of shearwaters caught off the northeast coast of Newfoundland include feathers from both great shearwaters and sooty shearwaters (Ardenna grisea, Gulka et al. 2017). Since there was only one value given for the mean δ13C and δ15N of the feathers of shearwaters caught in Florida and since these were dead, stranded, and emaciated birds known to be isotopically different from live birds caught in the Bay of Fundy, we excluded these from our analyses and used t-tests to compare the δ13C and δ15N values of the feathers of great shearwaters caught in this study with those caught in the Bay of Fundy [37].

3. Results

3.1. Hypothesis 1: Sixth Primary Feather is Molted in Either the Southern or Northern Hemisphere

We found no evidence of a bimodal distribution in either the δ13C or the δ15N of the p6 feathers that we collected from great shearwaters captured in July. We found no statistical evidence of a difference between feathers assumed to have grown in the Southern Hemisphere, feathers assumed to have grown in the Northern Hemisphere, or older feathers grown the previous year for either δ13C (F2,23 = 1.309, p = 0.29) or for δ15N (F2,23 = 0.157, p = 0.856; Figure 2).

3.2. Hypothesis 2: Diet/Food Web Changes between Years

Contrary to our prediction, we found no significant difference between 2014 and 2015 in the mean δ13C of RBCs (2014 mean δ13C = −18.96, 2015 mean δ13C = −19.04, t49 = 0.663, p = 0.51) or in the mean δ13C of plasma (2014 mean δ13C = −20.59, 2015 mean δ13C = −20.82, t47 = 1.507, p = 0.14). Nor did we find significant difference between 2014 and 2015 in the mean δ15N of plasma (2014 mean δ15N = 13.55, 2015 mean δ15N = 13.80, t47 = 1.40, p = 0.17), the mean δ15N of RBCs (2014 mean δ15N = 12.89, 2015 mean δ15N = 12.84, t47 = 0.251, p = 0.80), or the δ15N of feathers collected in 2014 and 2015 (2014 mean δ15N = 15.78, 2015 mean δ15N = 16.32, t44 = 4.14, p = 0.28). However, we did find a significant difference in the δ13C of feathers collected in 2014 and 2015 (2014 mean δ13C = −18.01, 2015 mean δ13C = −16.93, t44 = 4.14, p = 0.0002, Figure 3).

3.3. Hypothesis 3: Diet/Food Web Changes by Season/Location

We found evidence supporting our hypothesis of short-term/locational changes in the diet/food web. While we found the δ13C and δ15N of RBCs to remain quite constant over time and space, i.e., we found no evidence of an effect of capture event on the δ13C (F3,47 = 0.812, p = 0.5, Figure 3A) or on the δ15N of the RBCs (F3,46 = 0.46, p > 0.7, Figure 3B), a comparison of plasma δ13C suggests short-term or locational changes in diets and thus the food web great shearwaters were participating in between July and September of both years (F3,45 = 10.8, p < 0.0001, Figure 3A). However, there was no significant difference between July of 2014 and July of 2015 (p = 0.29), nor between September of 2014 and September of 2015 (p = 0.085). Likewise, the δ15N of the plasma of great shearwaters was slightly, though significantly greater in September 2015 than in July 2015 (F3,44 = 3.54, p = 0.02, Figure 3B), possibly indicating a slight increase in trophic level, either due to the change in season or due to the change in location. Consequently, as predicted, there were also significant differences between capture events in the Δ13CRBC-plasma (F3,45 = 12.72, p < 0.0001), with the Δ13Cplasma-RBC for both September 2014 and 2015 being significantly less than for either July 2014 or July 2015 (Figure 3A). While an ANOVA did show strong evidence of a difference in δ13C of feathers (F3,42 = 7.55, p = 0.0004) among sampling events, a Fischer’s PLSD test provided at best weak evidence of a seasonal difference in diet in 2014 (July 2014 mean = −17.68, September 2014 mean = −18.37, p = 0.052), and none in 2015 (July 2015 mean = −16.82, September 2015 mean = −17.10, p = 0.48). The only clear difference revealed by the post hoc test was between September 2014 and July 2015 (p < 0.0001; Figure 3A).
Again, the comparison of the δ13C of feathers and RBCs provides evidence supporting our hypothesis of short-term/locational changes in diet/food web. The Δ13CRBC-feather varied from as little as 0.6‰ in September of 2014 to as much as 2.1‰ in July of 2015 (F3,42 = 5.000, p < 0.0047, Figure 3A), with the Fisher’s PLSD indicating that the Δ13CRBC-feather was significantly smaller in July and September of 2014 than for the same months of 2015. The Δ15NRBC-feather did not differ significantly between capture events (F3,41 = 0.407, p = 0.75) and was an average of 3.0‰ (±0.3 SE) over the two years (Figure 3B). As one would expect, the Δ13CRBC-plasma differed significantly over sampling events (F3,45 = 12.721, p < 0.0001), with the Fisher’s PLSD showing the difference to be smaller in September of both years than in July of both years (Figure 3A). An ANOVA of the Δ15Nplasma-RBC (F3,44 = 4.163, p = 0.011) followed by a Fisher’s PLSD post hoc test showed the Δ15Nplasma-RBC for July 2014 to be significantly smaller than that of the other sampling periods (p < 0.02), while the Δ15Nplasma-RBC for the other sampling periods were essentially the same (Figure 3B).

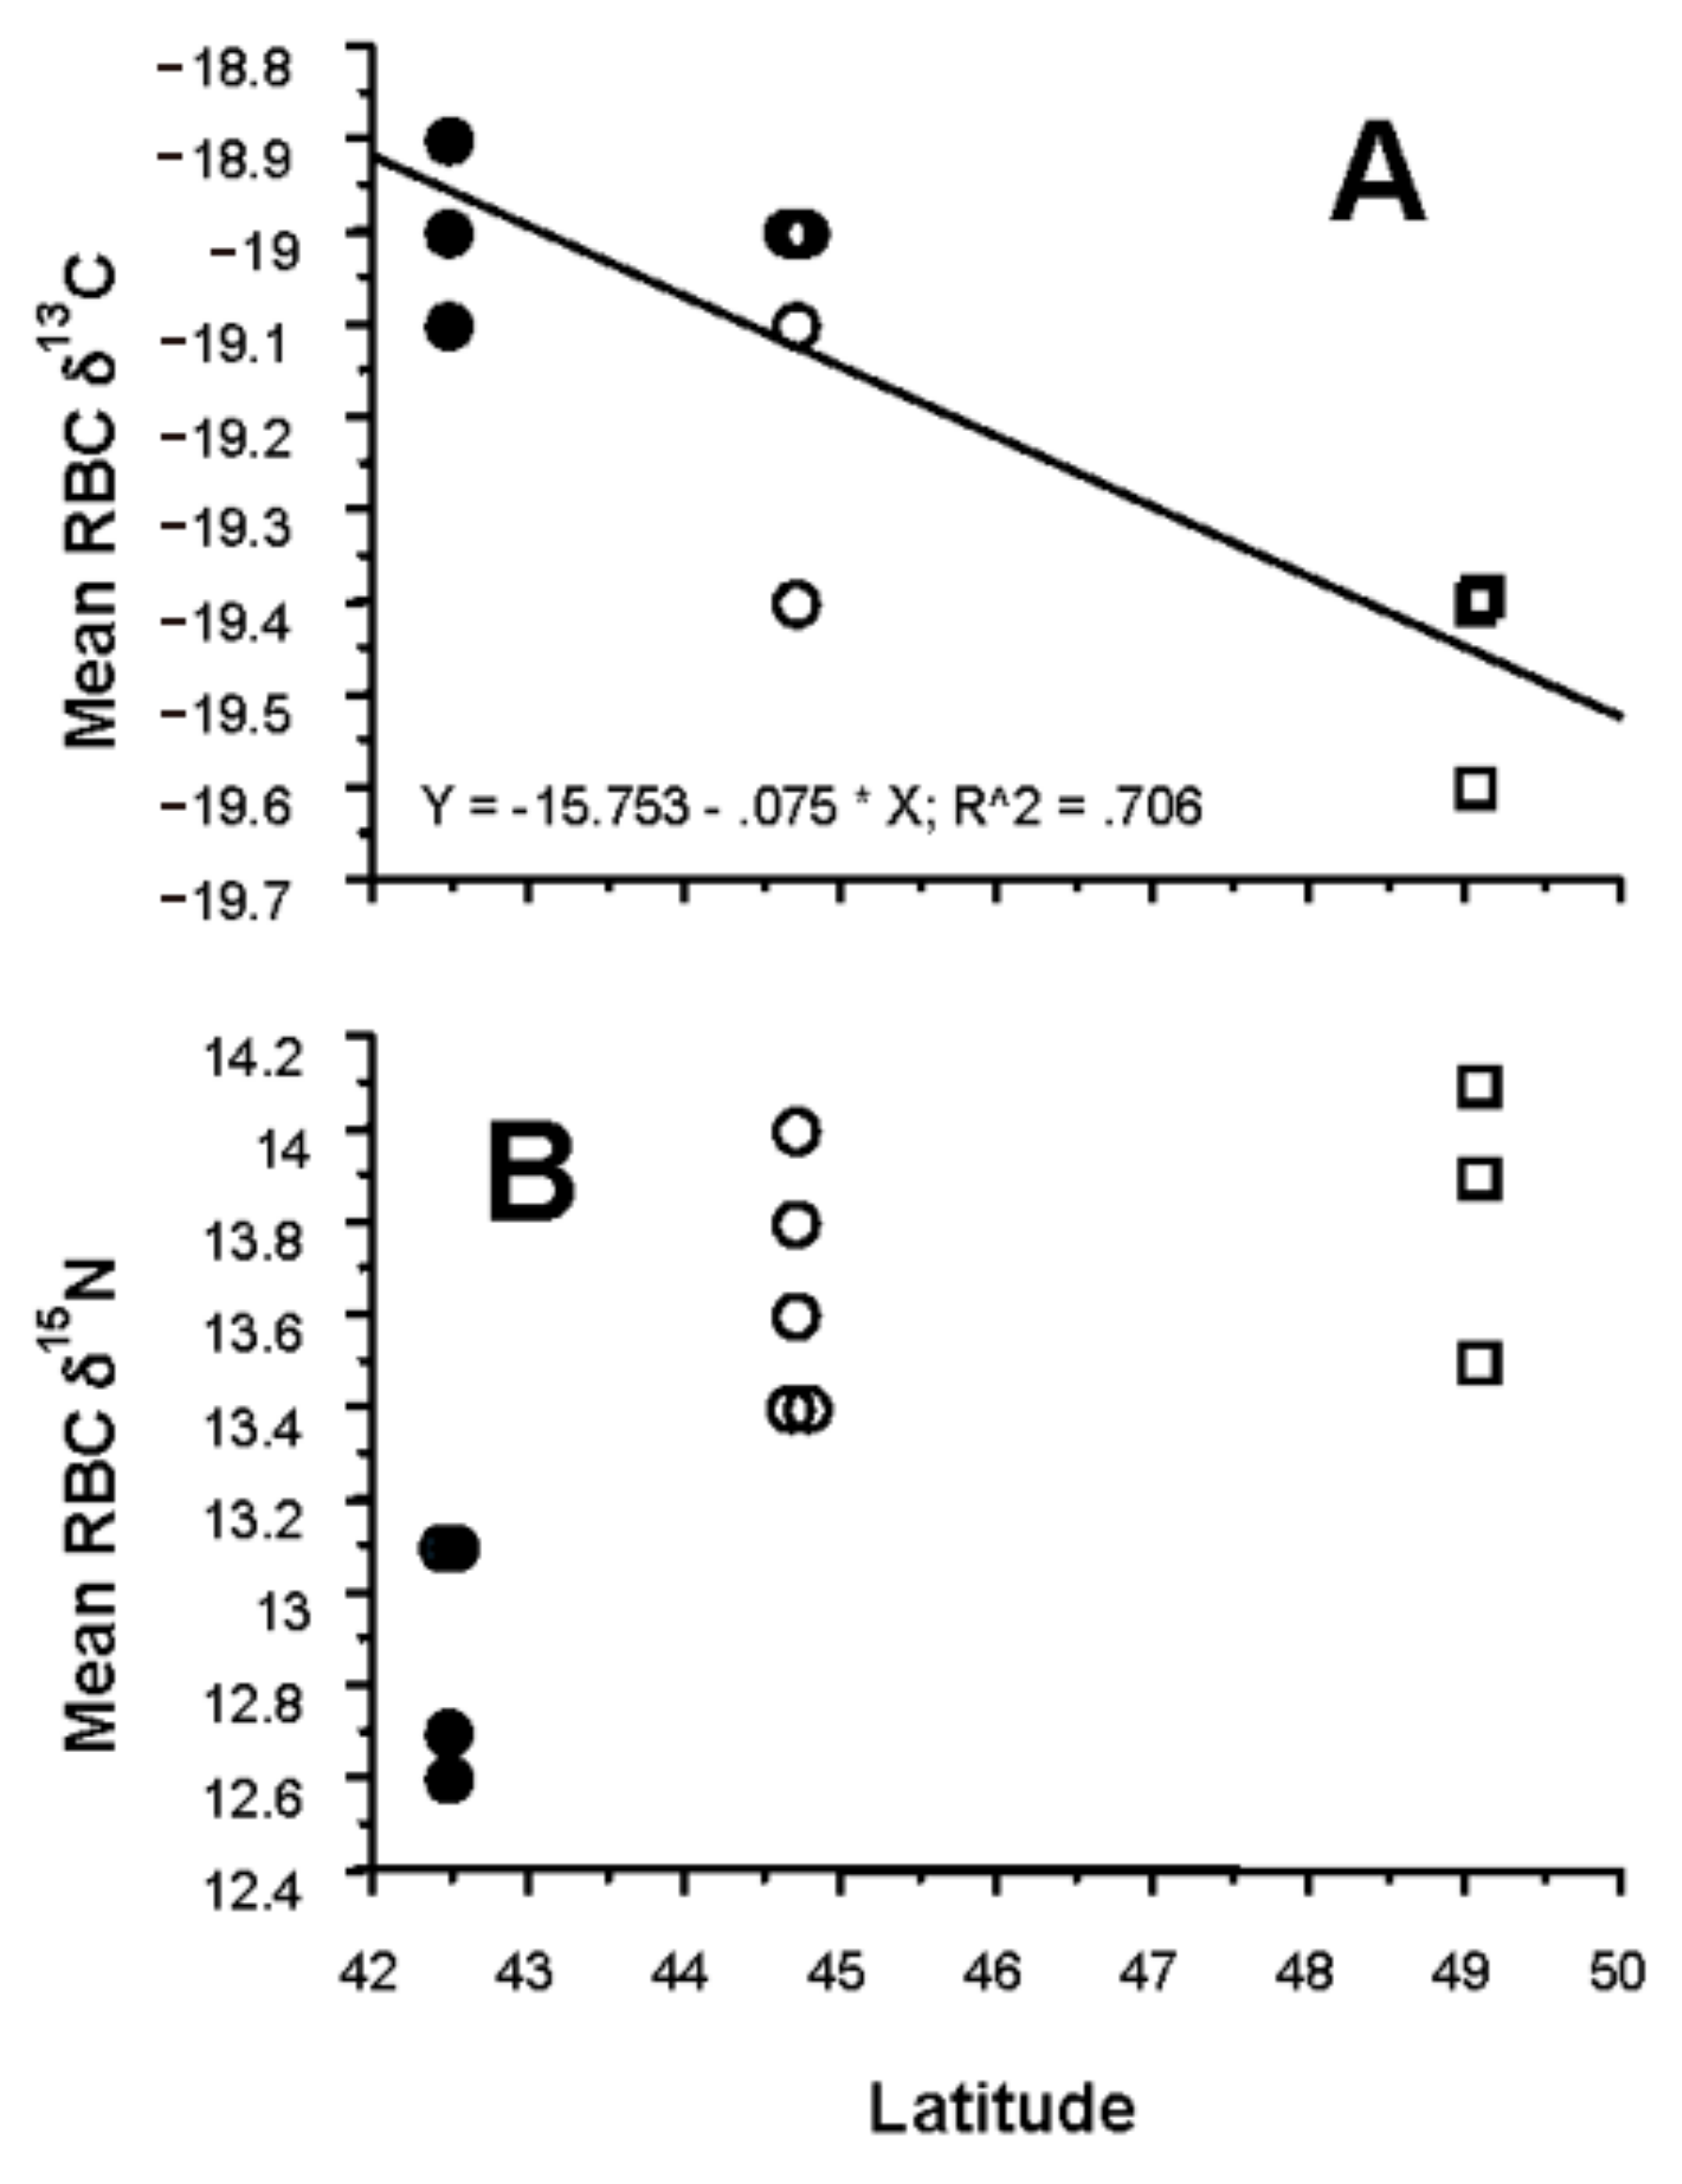
3.4. Latitudinal Gradient

Three studies that have collected and analyzed data on the δ13C and δ15N values of RBCs (i.e., the cellular portion of blood) in the North Atlantic ([34,35] and this study), providing enough data to look for a latitudinal gradient in δ13C (Table 1). We found that δ13C decreases significantly with latitude (F1,10 = 24.07, p = 0.006) and that the relationship explains a high proportion of the variance (R2 = 0.71; Figure 4A). We found the δ15N of great shearwater RBCs in the Massachusetts Bay/Cape Cod area to be significantly less that of those caught in the Bay of Fundy or off the northeast coast of Newfoundland (F1,9 = 13.08, p = 0.0022, Fisher’s PLSD < 0.05, Figure 4B).

4. Discussion and Conclusions

Ideally, when using SIA to examine diets and food webs, one would have baseline isotopic data of the tissues of the species of interest, the isotopic turnover rates of those tissues, and the isotopic signatures of a large suite of potential prey. This is often not possible, especially for wide-ranging species, such as seabirds, that can only be sampled opportunistically and within small portions of their range. In many cases, it is difficult to keep these species in captivity sufficiently long to determine tissue turnover rates (Zak Mertz, Cape Wildlife Center, Barnstable MA, pers. comm.) and such data for these and similar species are sparse or nonexistent. An alternative approach would be to compare bulk values with isotopic signatures drawn from essential amino acids or compound-specific stable isotope analysis. Though this will hopefully become routine, this method is currently more expensive and was not available to us for this study. Despite these limitations, a comparison of tissues with different turnover rates, when sampled from individuals at a single point in time, can reveal changes in diet over time without the need for recapturing and sampling individuals multiple times [55,56], a nearly impossible task when seabirds are off their nesting grounds. Since seabirds are high-level predators and often feed on a variety of species, changes in their diets can also reveal changes in the corresponding food web [24,25,31].

4.1. Hypothesis 1: Sixth Primary Feather is Molted in Either the Southern or Northern Hemisphere

The δ13C and δ15N values of feathers represent the bird’s diet at the time the feather was grown, thus interpreting the meaning of these values depends upon when and where the feathers were grown. Among great shearwaters sampled off the southern coast of Brazil in February through early June 2006, some but not all had molted their sixth primary feather [46]. Among great shearwaters observed in Massachusetts Bay/Cape Cod, some are either hatch year birds, with a full set of feathers grown in the Southern Hemisphere [33], or have completed their molt by early-July, while others are in the very early stages of molting. By mid-July, nearly all have completed their molt through the fifth primary feather, meaning that some still have to molt their sixth primary feather (Powers, pers. obs.) [32]. Since we analyzed the tip of the p6 feather, which is the first part of the feather to have grown and therefore represents the diet during the earliest time of feather formation, it was important to determine where those tips grew, because the difference in the δ13C values between feathers we collected in July 2014 and July 2015 may have been due to a difference in ratio of p6 feathers grown in the Northern and Southern Hemispheres.
The available data indicate that great shearwater feathers grown in the Southern Hemisphere have a mean δ13C value of −15.4‰ [47] and are therefore a mean of 1.4–3.0‰ higher than the tips of the p6 feathers that we collected. While we cannot exclude the possibility that some of the feather tips were grown in the Southern Hemisphere, since a few of the feathers had δ13C values approaching −15.4‰, we found no evidence of a difference in the δ13C of the feathers most likely to have grown in the Southern Hemisphere when compared to those most likely to have grown in the Northern Hemisphere. There does not appear to be a bimodal distribution of feather δ13C and feathers clearly grown the previous year had δ13C values indicating they were grown in the Northern Hemisphere. While we found no published data on the growth rates of any shearwater feathers, the growth rate of the primary flight feather of ashy storm petrels (Oceanodroma homochroa) is 1.4–2.0 mm*d−1 [57]. Since the sixth primary of our great shearwaters is approximately 130 mm long, assuming a similar feather growth rate for great shearwaters suggests that the 20–30 mm we collected from the tip of newly grown feathers would have grown between 50 days and 93 days before collection. This is probably an overestimate, since great shearwater primaries are longer than those of ashy storm petrels, which range from 55 mm to 107 mm [57], and because birds with longer primary feathers also tend to have faster feather growth rates [58]. These rough estimates, along with the δ13C values of the p6 feathers and the fact that of birds were still in the process of growing their p6 feathers or had not yet molted them in July, strongly suggests that the tips of the p6 feathers we sampled were grown shortly after the shearwaters arrived in the Northern Hemisphere, i.e., May to early June [43].

4.2. Hypothesis 2: Diet/Food Web Changes between Year

When the δ13C and δ15N values of samples collected in both July and September were combined as a single year, we found no significant differences between years in either the δ13C or δ15N of blood plasma or RBCs of great shearwaters. While this suggests that their diets overall were similar both summers and that there were no significant changes in their diet from one summer to the next, it hides some seasonal variation. The lack of any significant difference between 2014 and 2015 in the δ15N of feathers supports the conclusion that great shearwaters fed at similar trophic levels during both years.

4.3. Hypothesis 3: Diet/Food Web Changes by Season/Location

A comparison of the δ13C of RBCs from great shearwaters captured early in the summer (July) versus late summer (September) supports the conclusion that, when averaged or integrated over a longer time period, the diet of great shearwaters appears to be relatively constant. While the turnover rate of RBCs in great shearwaters is unknown, the half-life of δ13C of whole blood and RBCs is known for other birds. The half-life for the δ13C fractional turnover of the whole blood of great skuas (Catharacta skua) is 15.7 ± 2.1 days [52], while it is 15.1 days for the RBCs of red knots (Calidris canutus) [55], and 11.2 ± 0.8 days whole blood for dunlins (Calidris alpina pacifica) [59]. Since smaller birds tend to have faster metabolic rates [60,61], this would suggest that the half-life for great shearwater RBCs may lie somewhere closer to 15.7 days. Thus, if we assume the half-life of RBCs lies closer to the half-life of whole blood in great skuas, i.e., approximately 16 days (this is also similar to a turnover rate calculated using a mass-based algorithm [62]), the RBCs of great shearwaters should represent an integration of their diet over the previous six to eight weeks. This may, however, be an underestimate, since the half-life for δ13C for the RBCs of yellow-rumped warblers (Dendroica coronate), a small passerine with a high metabolic rate [63,64], is 10–12 days [65], while that for the RBCs of American Crows (Corvus brachyrhyncos) is 29.8 days [66], whereas for the RBCs of mallard ducks (Anas platyrhynchos) and Bewick’s swans (Cygnus columbianus) it is 31.9 days [67]. The fact that δ13CRBC remains remarkably constant over the course of our study suggests that while there may have been short term changes in their diet (on the order of weeks), the carbon sources in their diet remained relatively constant when integrated over a longer period (i.e., on the order of months). Since the half-life of δ15N is similar to that of carbon [68], the lack of any significant difference in the δ15N of RBCs of the different capture events (Figure 2B) indicates no longer-term shift in trophic level and supports this conclusion. In other words, we found no evidence over the course of the study of shifts in diet that were of sufficient magnitude or duration to affect the δ13C or δ15N of RBCs significantly. Given that great shearwaters travel an average of 515 km per week [32], this reflects not just an average over time but over space.
Thus, at appropriate time scales, the δ13C and δ15N of great shearwater RBCs provides a good measure of the general stability of the food web throughout the southern Gulf of Maine. Since it takes six to seven weeks or more for great shearwater RBCs to turn over, even a relatively small number of great shearwaters will have sampled a large area within the Gulf of Maine during that period [32]. The stability of the δ13C and δ15N of great shearwater RBCs across all four sampling events, suggests no strong or widespread annual or seasonal differences in the food webs between 2014 and 2015.
By contrast, the analysis of the δ13C of plasma suggests that there were small but significant short-term changes in the diet of great shearwaters. The turnover rates of δ13C and δ15N in blood plasma are less well studied than that of whole blood and RBCs. For American crows the half-life of plasma δ13C is 2.9 days [66], while in a study combining data from mallard ducks and Bewick’s swans, the mean turnover rate for the δ13C of the blood plasma of these two species was 4.3 days [67]. This suggests that the δ13C half-life of great shearwater blood plasma lies between 2.9 days and 4.3 days. Thus, blood plasma of great shearwaters probably represents an integration of diet over a period of one to three weeks. For both 2014 and 2015, the δ13C of shearwater plasma was significantly higher in September than in July (by 0.72‰ in 2014 and 0.59‰ in 2015), while the δ13C of blood RBCs remained relatively constant (Figure 2A). This suggests a short-term or seasonal shift in diet rather than a locational change in diet, since the pattern is the same for both years (Figure 3A). but the sampling locations were different for both years (Figure 1). This could be due to a shift in diet towards consuming more benthic or near shore species or that they fed on the same prey but the prey themselves were feeding closer to the sea bottom or to the coastline; it is most likely the former [22,69,70].
However, other mechanisms could also explain this shift. Within an organism, the δ13C value of lipids is generally more negative than that of protein or carbohydrates [71] and since plasma lipid content can increase dramatically during yolk formation [52,72] it would be possible that reproductive state could cause the observed changes in plasma δ13C, except that great shearwaters nest and reproduce in the South Atlantic, not the North Atlantic [33,40,73]. Consequently, the females in our samples were not forming yolk. In addition, most great shearwaters in the Gulf of Maine appear to be young, non-reproductive birds [32]. A change in the δ13C of plasma could also be caused by a change in the lipid content of prey species within the diet, without actually changing the kinds or proportions of prey species that constitute the diet. A diet high in lipids can increase the lipid content of blood plasma, decreasing its δ13C [52]. For example, the mean lipid content of sand lance captured in the waters off Greenland, a frequent component of the diet of great shearwaters [35,36], is about 6% in May and increases to 22–24% in August for adult sand lance or 20% in September for juvenile sand lance [74]. This pattern of “fattening up” from spring to late summer is evident in other species of forage fish [75,76] and while the timing may be somewhat different for forage fish in the Gulf of Maine than for sand lance captured off Greenland, the trend should also be similar, as suggested by the fact that herring from the Bay of Fundy, have much higher lipid contents in summer than in winter [77]. Therefore, if sand lance and similar fish form a major part of diet of great shearwaters, they could cause a decrease in the δ13C in the blood plasma of great shearwaters from July to September without a change in the diet of the shearwaters over that period. However, in our study, the δ13C of plasma increased from July to September for both years, making this an unlikely mechanism. Likewise, we found the δ15N of shearwater plasma to be significantly higher in September 2015 than either July of 2014 or July of 2015, while it was not significantly different from the δ15N of plasma collected in September of 2014 (Figure 1B). This may indicate an increase in trophic level late in the summer and also suggests a short-term shift in the diet.
Since, as discussed above, the evidence suggests that the tips of the p6 feathers that we analyzed were grown shortly after the shearwaters arrived in the Northern Hemisphere, whether these feather tips were collected in July or in September, their δ13C values are indicative of the diet they were eating shortly after arrival. Thus, it is appropriate to discuss the results of the significant difference in feather δ13C between years here. The fact that feathers collected in 2015 were a mean of about 1‰ higher than those collected in 2014 suggests that their diet shortly after arrival in the Northern Hemisphere differed between years, possibly consisting of more benthic or near shore prey [22,69,70] in 2015 than in 2014. Alternatively, the differences we see in feather δ13C values, especially between September 2014 and both July and September 2015 (Figure 3A), may be due to the fact that that the feathers we collected and analyzed in July of both years represents the diet of the corresponding birds in late spring, whereas the δ13C values of feathers collected in September of both years may represent both the diet of birds that molted their p6 feathers in the late spring and the diet of birds that molted their p6 feathers early to midsummer, but in differing proportions. Either way, this still represents a change in the diet of these birds and thus differing food webs. It is just that the first explanation suggests a between year dietary difference due to differing food webs in the late spring in which the great shearwaters are participating, whereas the second explanation suggests a between year dietary difference due to seasonal differences in the food webs in which the great shearwaters participate.
A comparison of the differences in δ13C and δ15N between multiple tissues, as has been done in other studies [47,78,79,80,81,82], largely confirms the conclusions reached thus far. The smaller Δ13CRBC-plasma in September of both years is what we would expect if there was a change in diet within a week or so preceding the September sampling events. If a mean difference of 1.4‰ is the Δ13Cfeather-blood of great shearwaters in equilibrium with their diet, as Quillfeldt et al. [47] suggest, then the fact that the Δ13Cfeather-RBC of the shearwaters we caught ranged from 0.6‰ to 2.1‰ would suggest that the p6 feathers we sampled were not in isotopic equilibrium with the average diet the birds were eating in the North Atlantic, with the possible exception of July of 2014, where the Δ13Cfeather-RBC was 1.2‰. However, as we would also expect if there were a shift from a more negative, i.e., pelagic diet in late spring 2014, to a less negative, e.g., benthic or neritic diet in late spring of 2015, the Δ13Cfeather-RBC was significantly smaller in July and September of 2014 than for the same months of 2015.
However, the comparisons of the Δ15Nplasma-RBC provide new insights. Of particular interest when comparing the plasma and RBC δ15N-values is July of 2014. We found the Δ15Nplasma-RBC for July 2014 to be significantly less than that of the other sampling periods, while the Δ15Nplasma-RBC for the other sampling periods remained relatively constant and statistically indistinguishable (Figure 3B). This suggests that we captured a very recent or ongoing change in the diet of great shearwaters early in the summer of 2014. There are two possible explanations. First, it may be that there is little or no difference in the δ15N tissue-diet discrimination factors of great shearwater plasma and RBCs and that the plasma and RBCs were in equilibrium with their diet in July of 2014. In this case the Δ15Nplasma-RBC indicates that we captured repeated and similar short-term increases in the trophic level (plasma δ15N) that the great shearwaters were feeding at just preceding the other three capture periods relative to the longer-term dietary average preceding that period (RBC δ15N). However, the plasma δ15N of dunlins, mallard ducks, and Bewick’s swans was found to be 0.8‰ higher than the δ15N of their RBCs when in equilibrium with their diet [67,68]. The plasma δ15N of yellow-rumped warblers in dietary equilibrium was found to be 1.4–1.6‰ higher than the δ15N of their RBCs, while that of several wild-caught songbirds was found to be 0.8–3.1‰ higher than their RBCs [65]. This suggests that when in dietary equilibrium, the δ15N of plasma and RBCs is not similar in birds, and that generally in birds the δ15N of plasma is higher than that of RBCs. That, and the relatively constant Δ15Nplasma-RBC for September 2014, July 2015, and September 2015 (1.10‰, 0.90‰, and 0.95‰, respectively) suggests that the Δ15Nplasma-RBC was in equilibrium when these samples were taken, and that the fractionation factor between these two tissues, when at equilibrium, is about 1‰. The fact that the Δ15Nplasma-RBC was only 0.26‰ for July of 2014 suggests that a second explanation is more likely—i.e., that we captured a very recent or ongoing change in the diet of great shearwaters immediately preceding capture in July of 2014 and that the tissues had not yet reached equilibrium with the new diet. It also suggests that this change in diet involved a shift in the average trophic level at which the shearwaters were feeding. Since the turnover rate of plasma is faster than that of RBCs—that the change in δ15N of RBCs should lag the change in the δ15N of plasma—and given the observed values for the other sampling periods, the most probable explanation would be that shearwaters had decreased or were in the process of decreasing the average trophic level at which they were feeding during the one to three weeks preceding the July 2014 sampling period.
Comparing the delta-values between tissues can be problematic. Blood δ13C values can be influenced by the lipid content of the plasma, since lipids are generally depleted in 13C relative to proteins [71,83]. However, since bird plasma is generally low in lipids the effect of lipid on whole blood and plasma δ13C values is minimal and should not affect the results of the plasma-RBC comparisons in this study [52,84,85]. Likewise, uric acid, though isotopically depleted [84], should for similar reasons have little isotopic effect [86]. Nor should it affect the comparison of RBC and feather δ13C values, since we separated the RBCs from the plasma and the influence of lipids removed when only the cellular fraction is used [52,87]. Feathers too can be problematic, since the diet-feather discrimination factor is small when the feather proteins are of dietary origin, but large when feather proteins are of endogenous origin. Therefore, differences in feather δ15N may be indicative of switching between endogenous and exogenous sources for constructing feather proteins [86]. However, our study did not find significant differences in feather δ15N between sampling events, suggesting that this was not an issue. Thus, the fluctuation in the Δ15Nfeather−RBC is most likely due to variations in the diet at the time of feather formation rather than nutritional status. For other studies that similarly compare tissue delta values, see [88,89,90,91].

4.4. Latitudinal Gradient

Few studies have collected and analyzed data on the δ13C and δ15N values of RBCs (i.e., the cellular portion of blood) or feathers of great shearwaters. Yet by using the mean δ13CRBC values provided in the literature [34,35] and in this study, we were able to demonstrate a strong, negative relationship between δ13CRBC and latitude. The strength of this relationship (R2 = 0.71) may in part be due to the fact that we were limited to using the means of reported sampling events, thereby removing the variance that would normally be found had the values of all the individual birds been used. The fact that the data from Gulka et al. [34] included both great shearwaters and sooty shearwaters should not account for the observed negative relationship, since the δ13C values of sooty shearwater RBCs tend to be higher than those of sympatric great shearwaters [35]. Consequently, our results support other studies that have also found a negative relationship between latitude and δ13C values in the blood of Cory’s shearwaters in the North Atlantic [48,49].
However, the difference in mean δ15NRBC between this study and the other two studies is unlikely due to latitude since we found no significant difference between the δ15NRBC of great shearwaters in the Bay of Fundy [35] or those further north off the north coast of Newfoundland [34]. Rather, it is probably indicative of a difference in the primary prey items and a difference in the trophic level at which shearwaters feed in the Massachusetts Bay/Cape Cod area compared to those feeding further north. Stable isotope analysis suggests that squid, herring, and krill are the primary prey items of great shearwaters in the Bay of Fundy [35], and that capelin are the primary prey of shearwaters off the north coast of Newfoundland [34]. If we assume a trophic discrimination factor of 2.75‰ for piscivorous birds [35], the fact that mean δ15NRBC of great shearwaters feeding in the Massachusetts Bay/Cape Cod area is nearly 1‰ less than that of great shearwaters feeding at the other two locations suggests that they are feeding on average approximately one third of a trophic level lower than great shearwaters at the other two locations. While we do not present data on the δ15N of potential prey items, this might suggest a greater reliance on sand lance [35] for the great shearwaters observed in this study.

4.5. Food Webs

Given the challenges that climate change and other disturbances present to food webs and ecosystems, it is important to have a means to monitor the health of these systems and look for significant changes to these systems. However, the scale of, complexity of, and the limited ability to directly sample marine ecosystems makes this difficult. Consequently, having proxies to monitor for important changes to food webs and thus ecosystems is increasingly important. SIA of the feathers of multiple species of seabirds has proved effective in demonstrating a change in the food web of the North Central Pacific indicating a shift from an ecosystem dominated by fish to one where squid has become the major food source [24], and in detecting differences in food webs likely due to differences in fishing pressure, mean trophic level of fish caught, and sea-surface warming [31].
However, it may not be feasible to collect isotopic data from multiple indicator species or the suite of potential prey of these species, especially from a particularly desired location or over the desired time period. In addition, SIA of a single tissue over long periods from multiple species, while highly suited to discovering long-term changes in food webs and ecosystems [24,31], is likely to miss important short-term changes in food webs, such as over the course of weeks to months. Such short-term changes in food webs may drive important, but currently poorly understood phenomena, such as the mass mortalities of great shearwaters [37,38]. In such cases, SIA of multiple tissues from even a single indicator species has the potential to fill this gap [55,56].
In this study, we demonstrated the potential of great shearwaters as a bioindicator species. We have demonstrated the potential for SIA of multiple tissues taken over a few sampling periods from a single species to detect dietary changes and thus changes in the food web between years, within the few weeks preceding sampling, and even several weeks to months before sampling. This was accomplished even though tissue-diet discrimination factors for great shearwaters has not been measured, the tissue isotopic turnover rates are unknown for great shearwaters, and in the absence of data on the diet of great shearwaters or the isotopic signatures of potential great shearwater prey items from the waters of Massachusetts Bay and Cape Cod. Comparison of plasma δ13C values indicates a shift to possibly more benthic or near shore prey in the one to three weeks preceding sampling in September of both 2014 and 2015. A comparison of the δ15N values of plasma suggested that this was accompanied by an increase in trophic level in September of 2015 and possibly in September of 2014. Comparison of feather δ13C values over the four sampling events indicates that the diet of great shearwaters in the few weeks after arrival in the Northern Hemisphere differed between 2014 and 2015, again possibly indicating a shift to towards a food web with a greater proportion of benthic or near shore prey in 2015.
Knowing tissue turnover rates is critical to correctly interpreting isotopic data collected from multiple tissues [81,92]. However, we have shown that even when those data are not available for the species in question, there are often data available in the literature that, since metabolic rate scales with size [60,61,64], allows one to make reasonable estimates as to the limits within which the turnover rate for a particular tissue should fall. For this study, the available data suggested that the isotopic half-life of RBCs was likely a minimum of 16 days, but could be as much as 30 days, in either case sufficiently slow for RBCs to integrate isotopic signals over months, suggesting that RBCs would work as a good baseline with which to compare other tissues, as was demonstrated by the very consistent isotopic signal of RBCs over the four sampling periods in our study.
Again, it is desirable, where possible, to employ species specific discrimination factors. However, in studies that specifically tests hypotheses regarding diet change over time and where the same tissue can be compared over multiple and appropriate time periods, the data thus generated can effectively test these hypotheses without having to establish specific diet-tissue discrimination factors. Likewise, in studies, such as this one, that specifically test hypotheses regarding seasonal or relatively short-term changes in diet, establishing a fractionation difference between tissues is sufficient [81]. In this study, we took the former approach to infer dietary changes over seasons and years. However, we found that the latter approach detected a change in diet not detected by the former method, i.e., that the shearwaters had a change in diet within the few weeks preceding their July 2014 capture. We also demonstrated that even when a fractionation difference between tissues cannot be firmly established, knowing the approximate degree and likely direction of that difference can be sufficient to undermine one hypothesis and support another, in the case of this study, supporting the hypothesis that plasma and RBCs were not in isotopic equilibrium in July 2014, but likely were in September 2014, July 2015, and September 2015, rather than the reverse case.
Thus, this study demonstrates that even in the absence of species specific isotopic data on possible dietary components, tissue turnover rates, diet-tissue discrimination factors, and even tissue-tissue fractionation differences, SIA analysis of multiple tissues with different isotopic turnover rates can detect changes in diet and or food web over time. However, two caveats must be addressed. First, while we have assumed that the relative and temporal changes we have observed in the δ13C and δ15N values of the tissues analyzed are indicative of changes in diet caused by changing to prey, or a different mix of prey, that results in an isotopically different diet, the isotopic shifts we observed may alternatively be due to changes in the physiology of the indicator species, isotopic variation in the diet of the prey without the prey having actually changed the composition of its diet [81], or by a change in the composition of the prey’s diet to an isotopically different dietary source or mix. Nevertheless, if the indicator species has not changed its diet, and the change one observes in the isotopic signatures of its tissues is due to either of the latter two causes, the changes in tissue isotopic signature of the indicator species is still indicative of a change in the food web, just at a lower trophic level. Even if the change in tissue isotopic signature is due to a change in the physiology of the indicator species, it may still indicate a change in the diet/food web, such as if the change in the isotopic signature of a tissue or tissues is due to nutritional stress, fasting or starvation [93]. This would indicate that the food web has changed in such a way that it no longer provides sufficient prey or prey of sufficient nutritional quality for the individuals of the indicator species to maintain themselves. Sampling the same suite of tissues multiple times can establish baselines that would indicate the natural variations in tissue isotopic signatures due to such things as normal changes in the physiology of the indicator species or in the isotopic signatures of primary producers at the bottom of the food web. The second caveat is that changes in diet/food web cannot be detected via SIA of the tissues of indicator species if the diet or food web changes in ways that are isotopically opaque, e.g., if the indicator species switches from one prey item to another that is isotopically very similar to the first.
Therefore, this study suggests that SIA of multiple tissues from one or more indicator species is a useful economically and logistically feasible means of monitoring for large changes in the food web that would warrant further investigation, such as when changes in tissue isotopic signatures coincide with known disturbances, e.g., increased fishing pressure [31] or the movement of a warm core ring into the Gulf of Maine [94,95]. SIA of multiple tissues of indicator species might also shed light on the unknown causes of known events, such as mass mortalities of seabirds [37,38], or it might detect shifts in the food web indicating an unknown disturbance, which then should be investigated and determined. Comparisons of multiple tissues within an indicator or other species will be particularly useful in situations where the isotopic signatures of potential prey are poorly known or even where the potential prey themselves are not known, and where tissue-diet discrimination factors are poorly known. In addition, we suggest that where these are well known, comparing the isotopic signatures of tissues with different turnover rates can be combined with mixing models and other tools to shed additional light on behavior, diet, and changes in the food web.

Author Contributions

P.H. was the major contributor to field work and data collection, though all of the authors were involved in these activities. P.H., along with K.A.H., was responsible for writing the manuscript. K.A.H. supervised the study, revised the manuscript, did the statistical analyses, and, along with L.K. and P.H., developed the experimental design. D.N.W. arranged for and supervised the excursion aboard the NOAA research vessel and assisted in collecting samples and data from the great shearwaters. K.D.P. collected feathers, scored feathers, and molts, provided these data, participated in extensive conversations without which understanding the molt would not have been possible, and reviewed multiple rewrites of the manuscript. R.H.M. conducted the stable isotope analysis of all the samples. L.K. provided undergraduate help, financial support, and help with reviewing and editing.

Funding

This study received financial support or support in kind from LIU Post, BU, and NOAA.

Acknowledgments

Linda Welch, Michael Thompson, Anna Robuck, Tammy Silva, Sara Williams, Montana Airey, Lucy McGinnis, and the crew of NOAA R/V Auk for assistance in collecting shearwater data. We would also like to thank Montana Airey and Lucy McGinnis for their assistance in preparing feather samples for stable isotope analysis. This study was covered by the Long Island University Post IACUC Protocol #14-02.

Conflicts of Interest

The authors declare no conflict of interest.

References

  1. Thompson, C. State of the Gulf of Maine Report; Gulf of Maine Council on the Marine Environment: Ogunquit, ME, USA, 2010; pp. 1–56. [Google Scholar]
  2. Boscolo-Galazzo, F.; Crichton, K.A.; Barker, S.; Pearson, P.N. Temperature dependency of metabolic rates in the upper ocean: A positive feedback to global climate change? Glob. Planet. Chang. 2018, 170, 201–212. [Google Scholar] [CrossRef]
  3. Northeast Multispecies (Large Mesh/Groundfish) Fishery Management Plan; New England Fishery Management Council: Newburyport, MA, USA, 2006; Available online: http://archive.nefmc.org/nemulti/summary/large_mesh_multi.pdf (accessed on 31 August 2018).
  4. Drinkwater, K.F.; Mueter, F.; Friedland, K.D.; Taylor, M.; Hunt, G.L., Jr.; Hare, J.; Melle, W. Recent climate forcing and physical oceanographic changes in Northern Hemisphere regions: A review and comparison of four marine ecosystems. Prog. Oceanogr. 2009, 81, 10–28. [Google Scholar] [CrossRef]
  5. Salisbury, J.E.; Jönsson, B.F. Rapid warming and salinity changes in the Gulf of Maine alter surface ocean carbonate parameters and hide ocean acidification. Biogeochemistry 2018, 141, 401–418. [Google Scholar] [CrossRef] [PubMed] [Green Version]
  6. Polis, G.A.; Strong, D.R. Food web complexity and community dynamics. Am. Nat. 1996, 147, 813–846. [Google Scholar] [CrossRef]
  7. Ainley, D.G.; Santora, J.A.; Capitolo, P.J.; Field, J.C.; Beck, J.N.; Carle, R.D.; Donnelly-Greenan, E.; McChesney, G.J.; Elliott, M.; Bradley, R.W.; et al. Ecosystem-based management affecting Brandt’s cormorant resources and populations in the Central California current region. Biol. Conserv. 2018, 217, 407–418. [Google Scholar] [CrossRef]
  8. Perkins, A.; Ratcliffe, N.; Suddaby, D.; Ribbands, B.; Smith, C.; Ellis, P.; Meek, E.; Bolton, M. Combined bottom-up and top-down pressures drive catastrophic population declines of Arctic skuas in Scotland. J. Anim. Ecol. 2018, 87, 1573–1586. [Google Scholar] [CrossRef] [PubMed]
  9. Donohue, I.; Petchey, O.L.; Kéfi, S.; Génin, A.; Jackson, A.L.; Yang, Q.; O’Connor, N.E. Loss of predator species, not intermediate consumers, triggers rapid and dramatic extinction cascades. Glob. Chang. Biol. 2017, 23, 2962–2972. [Google Scholar] [CrossRef]
  10. Sanders, D.; Thébault, E.; Kehoe, R.; Frank van Veen, F.J. Trophic redundancy reduces vulnerability to extinction cascades. Proc. Natl. Acad. Sci. USA 2018, 115, 2419–2424. [Google Scholar] [CrossRef] [Green Version]
  11. Kostrzewa, R. Puffins, climate change and fisheries. Biol. Unserer Zeit 2015, 45, 322–329. [Google Scholar] [CrossRef]
  12. Berg, S.; Pimenov, A.; Palmer, C.; Emmerson, M.; Jonsson, T. Ecological communities are vulnerable to realistic extinction sequences. Oikos 2015, 124, 486–496. [Google Scholar] [CrossRef]
  13. Gao, X.; Chen, X.; Li, Y. A review on the methods used in aquatic food web research: Development and applications. J. Fish. Sci. China 2018, 25, 1347–1360. [Google Scholar] [CrossRef]
  14. Cucherousset, J.; Bouletreau, S.; Martino, A.; Roussel, J.M.; Santoul, F. Using stable isotope analyses to determine the ecological effects of non-native fishes. Fish. Manag. Ecol. 2012, 19, 111–119. [Google Scholar] [CrossRef]
  15. Franco, M.A.L.; Carvalho, M.C.; de Rezende, C.E. A revision on the use of multiple tools for trophic studies of fish communities. Neotrop. Biol. Conserv. 2014, 9, 172–185. [Google Scholar]
  16. Layman, C.A.; Araujo, M.S.; Boucek, R.; Hammerschlag-Peyer, C.M.; Harrison, E.; Jud, Z.R.; Matich, P.; Rosenblatt, A.E.; Vaudo, J.J.; Yeager, L.A.; et al. Applying stable isotopes to examine food-web structure: An overview of analytical tools. Biol. Rev. 2012, 87, 545–562. [Google Scholar] [CrossRef]
  17. Wang, X.; Jiang, H.X.; Zhang, Y.N. Application of stable isotope analyses to avian diets and trophic structure. Shengtai Xuebao Acta Ecol. Sin. 2015, 35, 5556–5569. [Google Scholar]
  18. Minagawa, M.; Wada, E. Stepwise enrichment of 15N along food chains: Further evidence and the relation between 15N and animal age. Geochim. Cosmochim. Acta 1984, 48, 1135–1140. [Google Scholar] [CrossRef]
  19. Vanderklift, M.A.; Ponsard, S. Sources of variation in consumer-diet δ15N enrichment: A meta-analysis. Oecologia 2003, 136, 169–182. [Google Scholar] [CrossRef]
  20. Post, D.M. Using stable isotopes to estimate trophic position: Models, methods, and assumptions. Ecology 2002, 83, 703–718. [Google Scholar] [CrossRef]
  21. Schoeninger, M.J.; DeNiro, M.J. Nitrogen and carbon isotopic composition of bone collagen from marine and terrestrial animals. Geochim. Cosmochim. Acta 1984, 48, 625–639. [Google Scholar] [CrossRef]
  22. Hobson, K.A.; Piatt, J.F.; Pitocchelli, J. Using stable isotopes to determine seabird trophic relationships. J. Anim. Ecol. 1994, 63, 786–798. [Google Scholar] [CrossRef]
  23. Hobson, K.A.; Gilchrist, G.; Falk, K. Isotopic investigations of seabirds of the North Water Polynya: Contrasting trophic relationships between the eastern and western sectors. Condor 2002, 104, 1–11. [Google Scholar] [CrossRef]
  24. Gagne, T.O.; David Hyrenbach, K.; Hagemann, M.E.; Van Houtan, K.S. Trophic signatures of seabirds suggest shifts in oceanic ecosystems. Sci. Adv. 2018, 4, eaao3946. [Google Scholar] [CrossRef]
  25. Montevecchi, W.A.; Myers, A. Dietary changes of seabirds indicate shifts in pelagic food webs. Sarsia 1996, 80, 313–322. [Google Scholar] [CrossRef]
  26. Montevecchi, W.A. Binary dietary responses of northern gannets Sula bassana indicate changing food web and oceanographic conditions. Mar. Ecol. Prog. Ser. 2007, 352, 213–220. [Google Scholar] [CrossRef]
  27. Furness, R.W. A review of seabird responses to natural or fisheries-induced changes in food supply. Aquat. Predat. Prey 1996, 166–173. [Google Scholar]
  28. Furness, R.W.; Camphuysen, K. Seabirds as monitors of the marine environment. ICES J. Mar. Sci. 1997, 54, 726–737. [Google Scholar] [CrossRef]
  29. Lauria, V.; Attrill, M.J.; Brown, A.; Edwards, M.; Votier, S.C. Regional variation in the impact of climate change: Evidence that bottom-up regulation from plankton to seabirds is weak in parts of the Northeast Atlantic. Mar. Ecol. Prog. Ser. 2013, 488, 11–22. [Google Scholar] [CrossRef]
  30. Lauria, V.; Attrill, M.J.; Pinnegar, J.K.; Brown, A.; Edwards, M.; Votier, S.C. Influence of climate change and trophic coupling across four trophic levels in the Celtic Sea. PLoS ONE 2012, 7, e47408. [Google Scholar] [CrossRef]
  31. Gagné, T.O.; Hyrenbach, K.D.; Hagemann, M.E.; Bass, O.L.; Pimm, S.L.; MacDonald, M.; Peck, B.; Van Houtan, K.S. Seabird trophic position across three ocean regions tracks ecosystem differences. Front. Mar. Sci. 2018, 5, 317. [Google Scholar] [CrossRef]
  32. Powers, K.D.; Wiley, D.N.; Allyn, A.J.; Welch, L.J.; Ronconi, R.A. Movements and foraging habitats of great shearwaters Puffinus gravis in the Gulf of Maine. Mar. Ecol. Prog. Ser. 2017, 574, 211–226. [Google Scholar] [CrossRef]
  33. Cuthbert, R.J. Breeding biology, chick growth and provisioning of great shearwaters (Puffinus gravis) at Gough Island, South Atlantic Ocean. Emu 2005, 105, 305–310. [Google Scholar] [CrossRef]
  34. Gulka, J.; Carvalho, P.C.; Jenkins, E.; Johnson, K.; Maynard, L.; Davoren, G.K. Dietary niche shifts of multiple marine predators under varying prey availability on the northeast Newfoundland coast. Front. Mar. Sci. 2017, 4, 324. [Google Scholar] [CrossRef]
  35. Ronconi, R.A.; Koopman, H.N.; McKinstry, C.A.E.; Wong, S.N.P.; Westgate, A.J. Figure. Ecol. Prog. Ser. 2010, 419, 267–282. [Google Scholar] [CrossRef]
  36. Brown, R.G.B.; Barker, S.P.; Gaskin, D.E.; Sandeman, M.R. The foods of great and sooty shearwaters Puffinus gravis and P. Griseus in Eastern Canadian Waters. Ibis 1981, 123, 19–30. [Google Scholar] [CrossRef]
  37. Haman, K.H.; Norton, T.M.; Ronconi, R.A.; Nemeth, N.M.; Thomas, A.C.; Courchesne, S.J.; Al, S.; Kevin Keel, M. Great shearwater (Puffinus gravis) mortality events along the eastern coast of the United States. J. Wildl. Dis. 2013, 49, 235–245. [Google Scholar] [CrossRef]
  38. Lee, D.S. Mass die-offs of greater shearwaters in the western North Atlantic: Effects of weather patterns on mortality of a trans-equatorial migrant. Chat 2009, 73, 37–47. [Google Scholar]
  39. Ronconi, R.A.; Ryan, P.G.; Ropert-Coudert, Y. Diving of great shearwaters (Puffinus gravis) in cold and warm water regions of the South Atlantic Ocean. PLoS ONE 2010, 5, e15508. [Google Scholar] [CrossRef]
  40. Woods, R.W. Great shearwater Puffinus gravis breeding in the Falkland Islands. Ibis 1970, 112, 259–260. [Google Scholar] [CrossRef]
  41. Warham, J. The Petrels, Their Ecology and Breeding Systems; Academic Press: London, UK, 1990. [Google Scholar]
  42. Voous, K.H.; Wattel, J. Distribution and migration of greater shearwaters. Ardea 1963, 51, 143–157. [Google Scholar]
  43. Huettmann, F.; Diamond, A.W. Seabird migration in the Canadian Northwest Atlantic Ocean: Moulting locations and movement patterns of immature birds. Can. J. Zool. 2000, 78, 624–647. [Google Scholar] [CrossRef]
  44. Brown, R.G.B. The wing-moult of fulmars and shearwaters (Procellariidae) in Canadian Atlantic waters. Can. Field-Nat. 1988, 102, 203–208. [Google Scholar]
  45. Harrison, P. Seabirds: An Identification Guide, 2nd ed.; Houghton Mifflin Company: Boston, MA, USA, 1985. [Google Scholar]
  46. Bugoni, L.; Naves, L.C.; Furness, R.W. Moult of three Tristan da Cunha seabird species sampled at sea. Antarct. Sci. 2014, 27, 240–251. [Google Scholar] [CrossRef]
  47. Quillfeldt, P.; Bugoni, L.; McGill, R.A.R.; Masello, J.F.; Furness, R.W. Differences in stable isotopes in blood and feathers of seabirds are consistent across species, age and latitude: Implications for food web studies. Mar. Biol. 2008, 155, 593–598. [Google Scholar] [CrossRef]
  48. Navarro, J.; González-Solís, J.; Viscor, G. Nutritional and feeding ecology in Cory’s shearwater Calonectris diomedea during breeding. Mar. Ecol. Prog. Ser. 2007, 351, 261–271. [Google Scholar] [CrossRef]
  49. Paiva, V.H.; Xavier, J.; Geraldes, P.; Ramirez, I.; Garthe, S.; Ramos, J.A. Foraging ecology of Cory’s shearwaters in different oceanic environments of the North Atlantic. Mar. Ecol. Prog. Ser. 2010, 410, 257–268. [Google Scholar] [CrossRef]
  50. Kramer, M.H.; Harris, D.J. Avian blood collection. J. Exot. Pet. Med. 2010, 19, 82–86. [Google Scholar] [CrossRef]
  51. Ginn, H.B.; Melville, D.S. Moult in birds. BTO Guide 1983, 19, 1–112. [Google Scholar]
  52. Bearhop, S.; Waldron, S.; Votier, S.C.; Furness, R.W. Factors that influence assimilation rates and fractionation of nitrogen and carbon stable isotopes in avian blood and feathers. Physiol. Biochem. Zool. 2002, 75, 451–458. [Google Scholar] [CrossRef]
  53. Bond, A.L.; Jones, I.L. A practical introduction to stable-isotope analysis for seabird biologists: Approaches, cautions and caveats. Mar. Ornithol. 2009, 37, 183–188. [Google Scholar]
  54. Pyle, P. Identification Guide to North American Birds. Part II: Anatidae to Alcidae; Slate Creek Press: Point Reyes Station, CA, USA, 2008. [Google Scholar]
  55. Klaassen, M.; Piersma, T.; Korthals, H.; Dekinga, A.; Dietz, M.W. Single-point isotope measurements in blood cells and plasma to estimate the time since diet switches. Funct. Ecol. 2010, 24, 796–804. [Google Scholar] [CrossRef] [Green Version]
  56. Phillips, D.L.; Eldridge, P.M. Estimating the timing of diet shifts using stable isotopes. Oecologia 2006, 147, 195–203. [Google Scholar] [CrossRef]
  57. Ainley, D.G.; Lewis, T.J.; Morrell, S. Molt in Leach’s and ashy storm-petrels. Wilson Bull. 1976, 88, 76–95. [Google Scholar]
  58. Rohwer, S.; Ricklefs, R.E.; Rohwer, V.G.; Copple, M.M. Allometry of the duration of flight feather molt in birds. PLoS Biol. 2009, 7, e1000132. [Google Scholar] [CrossRef]
  59. Evans Ogden, L.J.; Hobson, K.A.; Lank, D.B. Blood isotopic (δ13c and δ15n) turnover and diet-tissue fractionation factors in captive dunlin (Calidris alpina pacifica). Auk 2004, 121, 170–177. [Google Scholar] [CrossRef]
  60. Bennettand, P.M.; Harvey, P.H. Active and resting metabolism in birds: Allometry, phylogeny and ecology. J. Zool. 1987, 213, 327–344. [Google Scholar] [CrossRef]
  61. Nagy, K.A. Field metabolic rate and food requirement scaling in mammals and birds. Ecol. Monogr. 1987, 57, 111–128. [Google Scholar] [CrossRef]
  62. Carleton, S.A.; del Rio, C.M. The effect of cold-induced increased metabolic rate on the rate of 13C and 15N incorporation in house sparrows (Passer domesticus). Oecologia 2005, 144, 226–232. [Google Scholar] [CrossRef]
  63. Guglielmo, C.G.; Gerson, A.R.; Price, E.R.; Hays, Q.R. The effects of dietary macronutrients on flight ability, energetics, and fuel metabolism of yellow-rumped warblers Setophaga coronata. J. Avian Biol. 2017, 48, 133–148. [Google Scholar] [CrossRef]
  64. Nagy, K.A. Field metabolic rate and body size. J. Exp. Biol. 2005, 208, 1621–1625. [Google Scholar] [CrossRef] [Green Version]
  65. Podlesak, D.W.; McWilliams, S.R.; Hatch, K.A. Stable isotopes in breath, blood, feces and feathers can indicate intra-individual changes in the diet of migratory songbirds. Oecologia 2005, 142, 501–510. [Google Scholar] [CrossRef]
  66. Hobson, K.A.; Clark, R.G. Turnover of 13C in cellular and plasma fractions of blood: Implications for nondestructive sampling in avian dietary studies. Auk 1993, 110, 638–641. [Google Scholar] [CrossRef]
  67. Hahn, S.; Hoye, B.J.; Korthals, H.; Klaassen, M. From food to offspring down: Tissue-specific discrimination and turn-over of stable isotopes in herbivorous waterbirds and other avian foraging guilds. PLoS ONE 2012, 7, e30242. [Google Scholar] [CrossRef]
  68. Lourenço, P.M.; Granadeiro, J.P.; Guilherme, J.L.; Catry, T. Turnover rates of stable isotopes in avian blood and toenails: Implications for dietary and migration studies. J. Exp. Mar. Biol. Ecol. 2015, 472, 89–96. [Google Scholar] [CrossRef]
  69. Hobson, K.A. Trophic relationships among high arctic seabirds: Insights from tissue-dependent stable-isotope models. Mar. Ecol. Prog. Ser. 1993, 95, 7–18. [Google Scholar] [CrossRef]
  70. Moody, A.T.; Hobson, K.A.; Gaston, A.J. High-arctic seabird trophic variation revealed through long-term isotopic monitoring. J. Ornithol. 2012, 153, 1067–1078. [Google Scholar] [CrossRef]
  71. DeNiro, M.J.; Epstein, S. Mechanism of carbon isotope fractionation associated with lipid synthesis. Science 1977, 197, 261–263. [Google Scholar] [CrossRef]
  72. Speake, B.K.; Murray, A.M.B.; Noble, R.C. Transport and transformations of yolk lipids during development of the avian embryo. Prog. Lipid Res. 1998, 37, 1–32. [Google Scholar] [CrossRef]
  73. Rowan, M.K. The greater shearwater puffinus gravis at’ its breeding grounds. Ibis 1952, 94, 97–121. [Google Scholar] [CrossRef]
  74. Danielsen, N.S.T.; Hedeholm, R.B.; Grønkjær, P. Seasonal changes in diet and lipid content of northern sand lance Ammodytes dubius on Fyllas Bank, West Greenland. Mar. Ecol. Prog. Ser. 2016, 558, 97–113. [Google Scholar] [CrossRef]
  75. Henderson, R.J. Seasonal changes in the lipid composition of herring (Clupea harengus) in relation to gonad maturation. J. Mar. Biol. Assoc. UK 1989, 69, 323–334. [Google Scholar] [CrossRef]
  76. Hislop, J.R.G.; Harris, M.P.; Smith, J.G.M. Variation in the calorific value and total energy content of the lesser sandeel (Ammodytes marinus) and other fish preyed on by seabirds. J. Zool. 1991, 224, 501–517. [Google Scholar] [CrossRef]
  77. Lane, H.A.; Westgate, A.J.; Koopman, H.N. Ontogenetic and temporal variability in the fat content and fatty acid composition of atlantic herring (clupea harengus) from the Bay of Fundy, Canada. Fish. Bull. 2011, 109, 113–122. [Google Scholar]
  78. Bond, A.L.; Jardine, T.D.; Hobson, K.A. Multi-tissue stable-isotope analyses can identify dietary specialization. Methods Ecol. Evol. 2016, 7, 1428–1437. [Google Scholar] [CrossRef]
  79. Heady, W.N.; Moore, J.W. Tissue turnover and stable isotope clocks to quantify resource shifts in anadromous rainbow trout. Oecologia 2013, 172, 21–34. [Google Scholar] [CrossRef]
  80. Germain, L.R.; McCarthy, M.D.; Koch, P.L.; Harvey, J.T. Stable carbon and nitrogen isotopes in multiple tissues of wild and captive harbor seals (Phoca vitulina) off the California coast. Mar. Mammal Sci. 2012, 28, 542–560. [Google Scholar] [CrossRef]
  81. Dalerum, F.; Angerbjorn, A. Resolving temporal variation in vertebrate diets using naturally occurring stable isotopes. Oecologia 2005, 144, 647–658. [Google Scholar] [CrossRef]
  82. Knoff, A.; Hohn, A.; Macko, S. Ontogenetic diet changes in bottlenose dolphins (Tursiops truncatus) reflected through stable isotopes. Mar. Mammal Sci. 2008, 24, 128–137. [Google Scholar] [CrossRef]
  83. Tieszen, L.L.; Boutton, T.W.; Tesdahl, K.G.; Slade, N.A. Fractionation and turnover of stable carbon isotopes in animal tissues: Implications for δ13C analysis of diet. Oecologia 1983, 57, 32–37. [Google Scholar] [CrossRef]
  84. Bearhop, S.; Teece, M.A.; Waldron, S.; Furness, R.W. Influence of lipid and uric acid on δ13C and δ15N values of avian blood: Implications for trophic studies. Auk 2000, 117, 504–507. [Google Scholar]
  85. Cherel, Y.; Hobson, K.A.; Hassani, S. Isotopic discrimination between food and blood and feathers of captive penguins: Implications for dietary studies in the wild. Physiol. Biochem. Zool. 2005, 78, 106–115. [Google Scholar] [CrossRef]
  86. Cherel, Y.; Hobson, K.A.; Bailleul, F.; Groscolas, R. Nutrition, physiology, and stable isotopes: New information from fasting and molting penguins. Ecology 2005, 86, 2881–2888. [Google Scholar] [CrossRef]
  87. Hatch, K.A.; Sacksteder, K.A.; Treichel, I.W.; Cook, M.E.; Porter, W.P. Early detection of catabolic state via change in 13C/12C ratios of blood proteins. Biochem. Biophys. Res. Commun. 1995, 212, 719–726. [Google Scholar] [CrossRef]
  88. Denton, M.J.; Demopoulos, A.W.J.; Baldwin, J.D.; Smith, B.J.; Hart, K.M. Stable isotope analysis enhances our understanding of diamondback terrapin (Malaclemys terrapin) foraging ecology. Estuaries Coasts 2019, 42, 596–611. [Google Scholar] [CrossRef]
  89. Horswill, C.; Matthiopoulos, J.; Ratcliffe, N.; Green, J.A.; Trathan, P.N.; McGill, R.A.R.; Phillips, R.A.; O’Connell, T.C. Drivers of intrapopulation variation in resource use in a generalist predator, the macaroni penguin. Mar. Ecol. Prog. Ser. 2016, 548, 233–247. [Google Scholar] [CrossRef] [Green Version]
  90. MacNeil, M.A.; Skomal, G.B.; Fisk, A.T. Stable isotopes from multiple tissues reveal diet switching in sharks. Mar. Ecol. Prog. Ser. 2005, 302, 199–206. [Google Scholar] [CrossRef] [Green Version]
  91. Villegas, M.; Newsome, S.D.; Blake, J.G. Seasonal patterns in δ2H values of multiple tissues from Andean birds provide insights into elevational migration. Ecol. Appl. 2016, 26, 2381–2387. [Google Scholar] [CrossRef]
  92. Bauchinger, U.; McWilliams, S. Carbon turnover in tissues of a passerine bird: Allometry, isotopic clocks, and phenotypic flexibility in organ size. Physiol. Biochem. Zool. 2009, 82, 787–797. [Google Scholar] [CrossRef]
  93. Hatch, K.A. The use and application of stable isotope analysis to the study of starvation, fasting, and nutritional stress in animals. In The Comparative Physiology of Fasting and Starvation; McCue, M.D., Ed.; Springer: Berlin/Heidelberg, Germany, 2012; pp. 337–364. [Google Scholar]
  94. Endo, Y.; Wiebe, P.H. Euphausiid distribution, abundance and succession in North Atlantic warm-core ring 82b. J. Plankton Res. 2005, 27, 175–188. [Google Scholar] [CrossRef]
  95. Myers, R.A.; Drinkwater, K. The influence of Gulf Stream warm core rings on recruitment of fish in the Northwest Atlantic. J. Mar. Res. 1989, 47, 635–656. [Google Scholar] [CrossRef]
Figure 1. Capture locations of all the great shearwaters from 2014–2015. The points are color coded according to the capture month and year. Mean stable isotope values for the great shearwaters captured at each location are displayed.
Diversity 11 00163 g001
Figure 2. The δ13C (Panel A) and δ15N (Panel B) of the p6 feathers from great shearwaters collected in July 2014 and July 2015. P6 feathers from birds with incomplete molts were presumed to have grown in the Northern Hemisphere. P6 feathers collected from birds with complete molts were presumed to have grown in the Southern Hemisphere. Tips from several well-worn feathers were collected. These feathers were grown the previous year, though it was impossible to suggest where. ANOVA found no evidence of any significant difference between the three groups for either δ13C or δ15N (p > 0.05).
Diversity 11 00163 g002
Figure 3. Comparison of δ13C values (panel A) and δ15N values (panel B) within tissues for blood plasma (black circles), red blood cells (RBCs) (open circles), and feathers (black squares). When comparing within tissues, periods that do not share letters differ significantly (Fischer’s PLSD, p ≤ 0.05) in the δ13C or δ15N. Standard error bars are indicated. Sample sizes are given within the symbols.
Diversity 11 00163 g003
Figure 4. Linear regression (Panel A) shows a strong and significant negative relationship between latitude where the great shearwaters were captured and the δ13C of their RBCs (p = 0.0006), while ANOVA (Panel B) found the δ15N of the shearwater RBCs in the Massachusetts Bay/Cape Cod (mean d15N = 12.9) area to be less (p < 0.05) than that of those captured in the Bay of Fundy (mean δ15N = 13.8) or off the northeast coast of Newfoundland (mean δ15N = 13.6). A Fishers PLSD showed that the latter two did not differ significantly from each other (p > 0.05). The symbols represent the mean δ-values of RBCs for each capture event (see Table 1). Black circles represent this study, open circles represent capture events from Ronconi et al. [35], and open squares represent capture events from Gulka et al. [34]. Where multiple symbols overlap, the values were actually identical. It should be noted that while this study and Ronconi et al. [35] only captured great shearwaters, the Gulka et al. [34] study combined data from great and sooty shearwaters.
Diversity 11 00163 g004
Table 1. A comparison of the δ13C and δ15N of the RBCs (cellular portion of blood) and feathers of great shearwaters caught in the North Atlantic. Standard errors (SE) are given for RBCs, while standard deviations (SD) are given for feathers in order to be consistent with values previously published.
RBC δ13CRBC δ15N
StudyLocationnMeanSEMeanSE
This studyMassachusetts Bay, Cape Cod (July 2014)13−18.90.0613.10.1
This studyMassachusetts Bay, Cape Cod (September 2014)12−190.0712.70.19
This studyMassachusetts Bay, Cape Cod (July 2015)12−18.90.1512.60.19
This studyMassachusetts Bay, Cape Cod (September 2015)12−19.10.1313.10.25
Ronconi et al. 2010Bay of Fundy (2005) *34−19.10.0513.40.13
Ronconi et al. 2010Bay of Fundy (2006) *71−190.0413.40.07
Ronconi et al. 2010Bay of Fundy (2007) *52−190.0413.60.07
Ronconi et al. 2010Bay of Fundy (2008) *53−19.40.06140.06
Ronconi et al. 2010Bay of Fundy (2009) *21−190.0813.80.07
Gulka et al. 2017Newfoundland (early summer, 2016) 28−19.60.0513.50.13
Gulka et al. 2017Newfoundland midsummer, 2016) 14−19.40.0813.90.14
Gulka et al. 2017Newfoundland (late summer, 2016) 6−19.40.0614.10.22
Feather δ13CFeather δ15N
MeanSDMeanSD
This studyMassachusetts Bay, Cape Cod (July 2014)13−17.70.815.61.9
This studyMassachusetts Bay, Cape Cod (September 2014)12−18.40.915.91.9
This studyMassachusetts Bay, Cape Cod (July 2015)13−16.80.816.51.1
This studyMassachusetts Bay, Cape Cod (September 2015)8−17.1116.11.6
Haman et al. 2013Bay of Fundy (2006)11−16.8116.11.7
Haman et al. 2013Bay of Fundy (2007)20−16.60.716.31.7
Haman et al. 2013Florida stranded (2008) 9−18.11.116.31.1
Haman et al. 2013Bay of Fundy (2008)12−17.20.715.61
* Values and SE taken from Figure 3 of Ronconi et al. [35]. Sample sizes assumed to be those found in Table 3 of Ronconi et al. [35]. Values are for great shearwaters and sooty shearwaters combined. These were stranded, emaciated great shearwaters, not in good health.

