Article

The Composition and Assembly of Bacterial Communities across the Rhizosphere and Phyllosphere Compartments of Phragmites Australis

1
State Key Laboratory of Hydrology-Water Resources and Hydraulic Engineering, Joint International Research Laboratory of Global Change and Water Cycle, College of Hydrology and Water Resources, Hohai University, Nanjing 210098, China
2
State Key Laboratory of Lake Science and Environment, Nanjing Institute of Geography and Limnology, Chinese Academy of Sciences, Nanjing 210008, China
*
Author to whom correspondence should be addressed.
Diversity 2019, 11(6), 98; https://doi.org/10.3390/d11060098
Submission received: 22 May 2019 / Revised: 20 June 2019 / Accepted: 21 June 2019 / Published: 24 June 2019
(This article belongs to the Section Microbial Diversity and Culture Collections)

Abstract

:
The rhizosphere and the phyllosphere represent two different epiphytic compartments of host plant, which are closely related to plant growth, health, and productivity. However, the understanding of the diversity, composition, and assembly of the bacterial communities in different epiphytic microenvironments of large emerged macrophytes has remained elusive, especially the abundant and rare taxa across rhizosphere and phyllosphere communities. In this study, we collected samples of two different epiphytic compartments (rhizosphere and phyllosphere) of Phragmites australis. Both 16S rRNA gene-based high-throughput sequencing and null-model analysis were employed to determine the difference in the composition and assembly of above-mentioned epiphytic bacterial communities. Our results indicated that bacterial communities of rhizosphere exhibited higher diversity and richness than those of phyllosphere. Deterministic processes dominated the assembly of bacterial community in both compartments, and stochastic processes contributed a certain proportion (30.30%) in the assembly of phyllosphere bacterial community. We also found that rare taxa contributed more significantly to the alpha- and beta-diversity of bacterial community than those of abundant taxa. The obtained data are useful for better understanding the bacterial community of different epiphytic compartments of P. australis.

1. Introduction

Phragmites australis (P. australis) is a kind of perennial gramineous emergent aquatic plant species with strong adaptability and a wide ecological amplitude, which can invade new territory efficiently to form dense dominant communities in aquatic ecosystems such as lakeside belts and wetlands [1]. It can absorb a large amount of organic pollutants such as nitrogen and phosphorus, toxic substances, and heavy metals, thereby reducing the nutrient level and pollution degree of the wetland and promoting its ecological processes [2,3]. On account of these important ecological functions, P. australis is often used in constructed wetland sewage treatment systems [3]. A great deal of research had been carried out on the population genetic structure, physiology and ecology, resource distribution, ecosystem function, and economic value of P. australis in constructed wetlands [4,5,6,7], but no special attention had been paid to the local community of P. australis under natural conditions in the field.
Some studies revealed that plants have different microbial communities on inside different organs, and that the bacterial communities related to the surface of root and leaf are the most abundant and the most characteristic [8]; they are called the rhizosphere bacterial community [9] and the phyllosphere bacterial community [10,11], respectively. They are closely related to many processes of plant metabolism, growth, and development, as well as biogeochemical cycles [8,9,11,12,13], and have an impact on the function of the ecosystem and its adaptability to environmental changes. Both rhizosphere and phyllosphere microbial communities can provide pathogen protection, resist biotic/abiotic stress, and affect carbon and nitrogen cycles [10,12,14], while the rhizosphere microorganisms seem to provide additional effects, such as regulating hormone levels and enhancing the net sequestration of organic matter of plant roots etc., by helping plants to obtain nutrients from the soil [8,9]. We hypothesized that there are shared and unique bacteria in both the rhizosphere and phyllosphere, and the redundancy and specificity of their effects on plants may be related to the difference in species composition of the bacterial communities. However, current research on plant rhizosphere microorganisms is mainly concentrating on terrestrial economic crops (such as rice, wheat, poplar, etc.) [15,16,17,18,19,20] and model organism (Arabidopsis thaliana, etc.) [9,21,22]; there are few reports on the rhizosphere microbial communities of aquatic plants. In addition, the phyllosphere is a habitat with more intense environmental heterogeneity than rhizosphere [12,13], and the bacterial communities across different types of habitat subjected to different dominant control factors, such as dispersal limitation and environmental selection, but the differences between the rhizosphere and phyllosphere had not been confirmed yet [8,13].
Previous studies reported that the bacterial community was composed of a few abundant species and a large number of rare species [23,24,25,26], and there are significant differences in environmental preferences and ecological responses between them [25,27]. In our study on rhizosphere and phyllosphere bacterial communities, another understudied aspect concerns the abundant and the rare taxa. Abundant bacterial taxa affect ecological function by controlling the main processes in ecosystems, such as fluxes of organic matter and the production of biomass [25,28,29]. However, recent studies increasingly emphasize the ecological importance of rare taxa, which as part of the seed bank contain more metabolically active microorganisms than abundant taxa [30,31]. Some rare taxa can provide important functions that are disproportionate to their richness or growth rate, such as basic functions related to nutrient cycling [32,33,34]. However, previous studies did not report the abundant and rare taxa in the rhizosphere and phyllosphere, so that more targeted analyses are still needed to understand the contribution of abundant and rare taxa to the bacterial community in the colonization process of different epiphytic compartments.
In order to validate the hypothesis laid out above and make up for the shortages of the existing studies, we used 16S rRNA gene-based high-throughput sequencing to investigate the composition, structure, and assembly of the bacterial community on different epiphytic compartments (rhizosphere and phyllosphere) of P. australis, and probe into the abundant and rare taxa in the rhizosphere and phyllosphere respectively. Specifically, our main objectives were: (i) to compare the diversity, composition, and structure of rhizosphere and phyllosphere bacterial communities and their dominant bacterial group; (ii) to reveal the main differences in diversity and composition of abundant and rare taxa in the bacterial communities of rhizosphere and phyllosphere, respectively; (iii) to determine the process and control factors of bacterial community assembly in different epiphytic compartments of P. australis.

2. Materials and Methods

2.1. Sampling Site and Sample Collection

A nursery wetland (32.052 N, 118.870 E) located in the Sun Yat-sen Mausoleum, Nanjing, was selected to obtain P. australis samples. Sampling was conducted in July 2018. There were lush flooded wild P. australis communities with less anthropogenic disturbing at the sampling location. In order to compare the differences of bacterial community associated with different epiphytic compartments of P. australis, 12 independent P. australis with vigorous growth were selected to acquire rhizosphere and phyllosphere samples. The height of the collected P. australis was on average approximately 2.8 m, and the average leaf length, leaf width of P. australis were about 46.0 cm, 3.2 cm, respectively. After removing the surface 5 cm soil to exclude the effects of humus and weed, the root of P. australis was obtained from the depth of 5–15 cm below the ground using a core sampler (DM60, Mingyu, China). After the phenotypic measurement, five to six pieces of mature and healthy leaves were collected into aseptic sealed bag as leaf samples. A total of 12 roots and 12 leaves samples were obtained and transported to laboratory at 4 °C within 24 h and stored at −80 °C for further processing.
In addition, we collected 5 bulk sediments in the area, pH, total nitrogen (TN), nitrate nitrogen (NO3-N), nitrite nitrogen (NO2-N), and total phosphorous (TP) of bulk soil were measured as soil background (Table S1). The pH was measured with specific electrodes (PHB-4, REX, China). TN and TP were investigated according to Jiao et al. (2018) [35]. NO3-N and NO2-N was measured by Skalar san++ (Skalar, Netherlands). Sediment type of bulk sediments were analyzed with the Beckman Coulter LS13320 particle size analyzer.

2.2. Processing of the Collected Samples

The roots with soil were freeze-dried (−59 °C) with a vacuum freezing dryer (FD-1A-50, Beijing Boyikang Lab Instrument Co. Ltd., Beijing, China). After that, further treatment was carried out to separate the rhizosphere sample according to the method of Bulgarelli et al. (2012) and Lundberg et al. (2012) [21,36]. Firstly, the loose soil around the root (including the fibrous roots) was shaken off and manually removed from the roots by rubbing and shaking with sterile gloves until only the soil closest to the root was left. Then, the processed root was put into a sterilized 50 mL Falcon tube with 35 mL sterile Silwet L-77 amended PBS buffer (130 mM NaCl, 7 mM Na2HPO4, 3 mM NaH2PO4, pH 7.0, 0.02% Silwet L-77). After 20 min of shaking washing on a shaking platform at 180 rpm, the washing buffer was centrifuged (1500× g, 20 min). At last, the resulting pellet was collected and stored at −80 °C as the rhizosphere sample.
As for the phyllosphere samples, the washing operation was identical to that of rhizosphere sample, leaves of each sample were placed into PBS buffer for vibration cleaning. After that, each eluted PBS buffer was filtered by 0.22 μm filter membrane, and the collected membranes were stored at −80 °C until DNA extraction.

2.3. DNA Extraction, PCR Amplification and High-Throughput Sequencing

Approximately 0.25 g of the rhizosphere sample was taken, and the total DNA was extracted using the FastDNA® SPIN for soil kit (MP Biomedicals, Solon, USA) following the manufacturer’s protocol. For the phyllosphere epiphytic bacteria, DNA was extracted from the filtration membrane using the Water DNA kit (Omega, USA). The extracted DNA was stored at -80℃ for subsequent analysis.
The universal primer set 779F (5′-AACMGGATTAGATACCCKG-3′) and 1115R (5′-AGGGTTGCGCTCGTGGG-3′) was selected to amplify the V5-V6 hypervariable region of bacterial 16S rRNA gene and avoid chloroplast contamination [37,38]. PCR amplification of each DNA sample was individually conducted in triplicated 20 μL mixture reaction system, which contained 0.4 μL of 10 μM each of the forward and reverse primers, 1 μL of DNA template corresponding to 20 ng, 10 μL of 2× Prime STAR Buffer (plus Mg2+), 2 μL of 2.5 mM dNTPs, 1.0 U TaKaRa Prime STAR HS DNA polymerase and ddH2O. The PCR cycling conditions were as follows: pre-denaturation at 95 °C for 2 min, followed by 25 amplification cycles (denatured at 95 °C for 30 s, annealing at 55 °C for 30 s, and extension at 72 °C for 30 s), with a final 5 min extension at 72 °C The triplicated amplified products of each DNA sample were pooled together to minimize the bias caused by PCR amplification. After amplification, the PCR products were verified by 1.5% (w/v) agarose gel electrophoresis. The combined PCR products were purified with the AxyPrepDNA gel purification kit (Axygen Biotechnology Hangzhou Ltd., Hangzhou, China), and then Qubit 3.0 (Life Invitrogen) was used for quantitative combination of PCR products. Finally, the purified PCR amplified samples were sequenced on the Illumina MiSeq platform (BIOZERON Co., Ltd., Shanghai, China).

2.4. Processing of the Sequencing Data

After sequencing, raw paired-end sequences data (.fastq) were processed to filter the sequencing quality of each forward and reverse sequences by using the standard operating procedures of QIIME (version 1.9) [2]. Paired-end sequences of each sample were truncated to a 250 base pairs (bp) reads through a 20 bp sliding window when sequences with average quality score < 25 by using Trimmomatic v.0.33 [39], and the truncated reads shorter than 50 bp and mismatched reads were discarded. Only trimmed sequences that overlapped length longer than 10 bp and mismatch density lower than 0.25 were assembled according to their overlap sequence in FLASH v.1.2.11 [40].
Following that, sequence reads were trimmed according to the MiSeq standard operating procedure (SOP) of the Mothur software package [41]. The sequences longer than 6 nucleotides (consecutive identical bases) with homopolymers were excluded from further analysis [42]. The remaining sequences were aligned using the nearest alignment space termination (NAST) algorithm against a bacterial SILVA 16S rRNA gene template [43]. Then, the command ‘chimera.uchime’ in Mothur was applied to identify and remove putative chimeric sequences that had possible pyrosequencing errors [44]. The online ribosomal database project (RDP) Classifier was used to obtain taxonomic classification information based on 80% bootstrap cut-off threshold [45]. Operating taxonomic units (OTU) were clustered at 3% sequence dissimilarity cut-off level by using the furthest-neighbor method in Mothur [46]. Finally, OTUs were generated based on the alignment and clustering results, and suspicious or rare OTUs (sequence number < 17) together with singletons were excluded from downstream analyses [47]. The aligned sequences were used to calculate the phylogenetic tree in FastTree v2.1 [48]. For subsequent analysis and comparison, we normalized sequences efforts by resampling a subset of 20,061 sequences randomly from each sample to minimize bias connected with different sequencing depths across whole samples datasets.

2.5. Definition of Abundant and Rare Operating Taxonomic Units (OTUs)

With reference to recent publications [27,28,29,35,49,50,51], we defined abundant and rare OTUs based on the cut-off level of relative abundance. To facilitate comparisons between studies, we adopted the thresholds in previous studies [50,51]. Abundant OTUs were defined as the OTUs with relative abundance > 0.01% within a sample, whereas rare OTUs were defined as the OTUs with relative abundance < 0.01%. Through the above steps, we obtained two separate tables for abundant and rare OTUs. Subsequently, the divisions for abundant and rare community were conducted and performed as described above for the rhizosphere and phyllosphere communities. After sequence standardization of abundant and rare OTUs, we obtained random subsets of 13,441 and 980 sequences corresponding to abundant and rare communities from each sample, respectively. Finally, we obtained four taxonomic summary tables of the four groups after subsampled, including rhizosphere abundant taxa (RAT), rhizosphere rare taxa (RRT), phyllosphere abundant taxa (PAT), phyllosphere rare taxa (PRT).

2.6. Statistical Analyses

Based on the phylogenetic tree and OTUs table, alpha-diversity was calculated and represented by indices that including observed species (OTU richness), Faith’s phylogenetic diversity (Faith’s PD). Beta-diversity was calculated to compare the dissimilarities of bacterial community within and across different groups based on unweighted UniFrac distance matrix [52]. The visualization of beta-diversity was illustrated using non-metric multidimensional scaling (NMDS) analysis based on the phylogenetic distance. Rarefaction curves were assembled and plotted using the SigmaPlot 12.5 software to estimate whether the sequencing depth was sufficient. Only dominant OTUs (>1% relative abundance) across all samples were selected. Venn diagram was used to show the similarity of OTUs among the two different groups (Rhizosphere-Phyllosphere, RAT-PAT, RRT-PRT) using ‘VennDiagram’ package in R (version 3.3.1) [53]. Heatmap was performed to show the top 50 most abundant and different genera in rhizosphere and phyllosphere using HemI software [54]. Analysis of similarities (ANOSIM) and PERMANOVA analysis was used to investigate the significant differences based on unweighted UniFrac distance among different groups. All analyses were performed using functions in the ‘vegan’ package in R (version 3.3.1) [53,55]. Two-tailed independent-sample t-test was performed in SPSS 22.0 software (SPSS, Chicago, IL) to test the significant differences of alpha-diversity, beta-diversity, and the relative abundances of bacterial groups at phyla/subphyla level among different groups (Rhizosphere-Phyllosphere, RAT-PAT, RRT-PRT). The comparison results of significant dissimilarity among different groups were displayed with SigmaPlot 12.5.

2.7. Phylogenetic Structure of Bacterial Community

To evaluate the assembly processes of the bacterial communities, we analyzed phylogenetic structure with null model theory. The abundance-unweighted mean nearest taxon distance (MNTD) was calculated with 999 random sets to represent phylogenetic turnover. Subsequently, the command ‘ses.mntd’ in the ‘picante’ package of R was applied to calculate the standardized effect size of the MNTD (ses.MNTD) [56,57]. Generally, the obtained significant (p < 0.05) negative (positive) ses.MNTD values across all communities indicated the phylogenetic clustering (over-dispersion) and coexisting taxa more closely (distantly) related than null expectations, respectively [56,58,59]. Furthermore, the beta mean nearest taxon distance metric (betaMNTD) was calculated based on abundance-unweighted to characterize phylogenetic beta-diversity (phylogenetic turnover in community composition). In addition, the standardized effect size of beta mean nearest taxon distance (ses.betaMNTD, usually represented by betaNTI), which is the standard deviations that the observed betaMNTD departs from the mean of the null distribution (1000 null iterations) based on random shuffling of taxon labels across the tips of the phylogeny [56,60,61], was calculated to evaluate the phylogenetic level (phylogenetic turnover) and indicate the dominant assembly processes (deterministic or stochastic processes) of different communities. A betaNTI value of >+2 or <−2, which suggested phylogenetic turnover is greater or less than the null expectation, is usually considered to relate to deterministic process [61,62,63].

2.8. Nucleotide Sequence Accession Numbers

The obtained raw sequences were submitted to the NCBI (National Center for Biotechnology Information) Sequence Read Archive database under accession number SRP189428.

3. Results

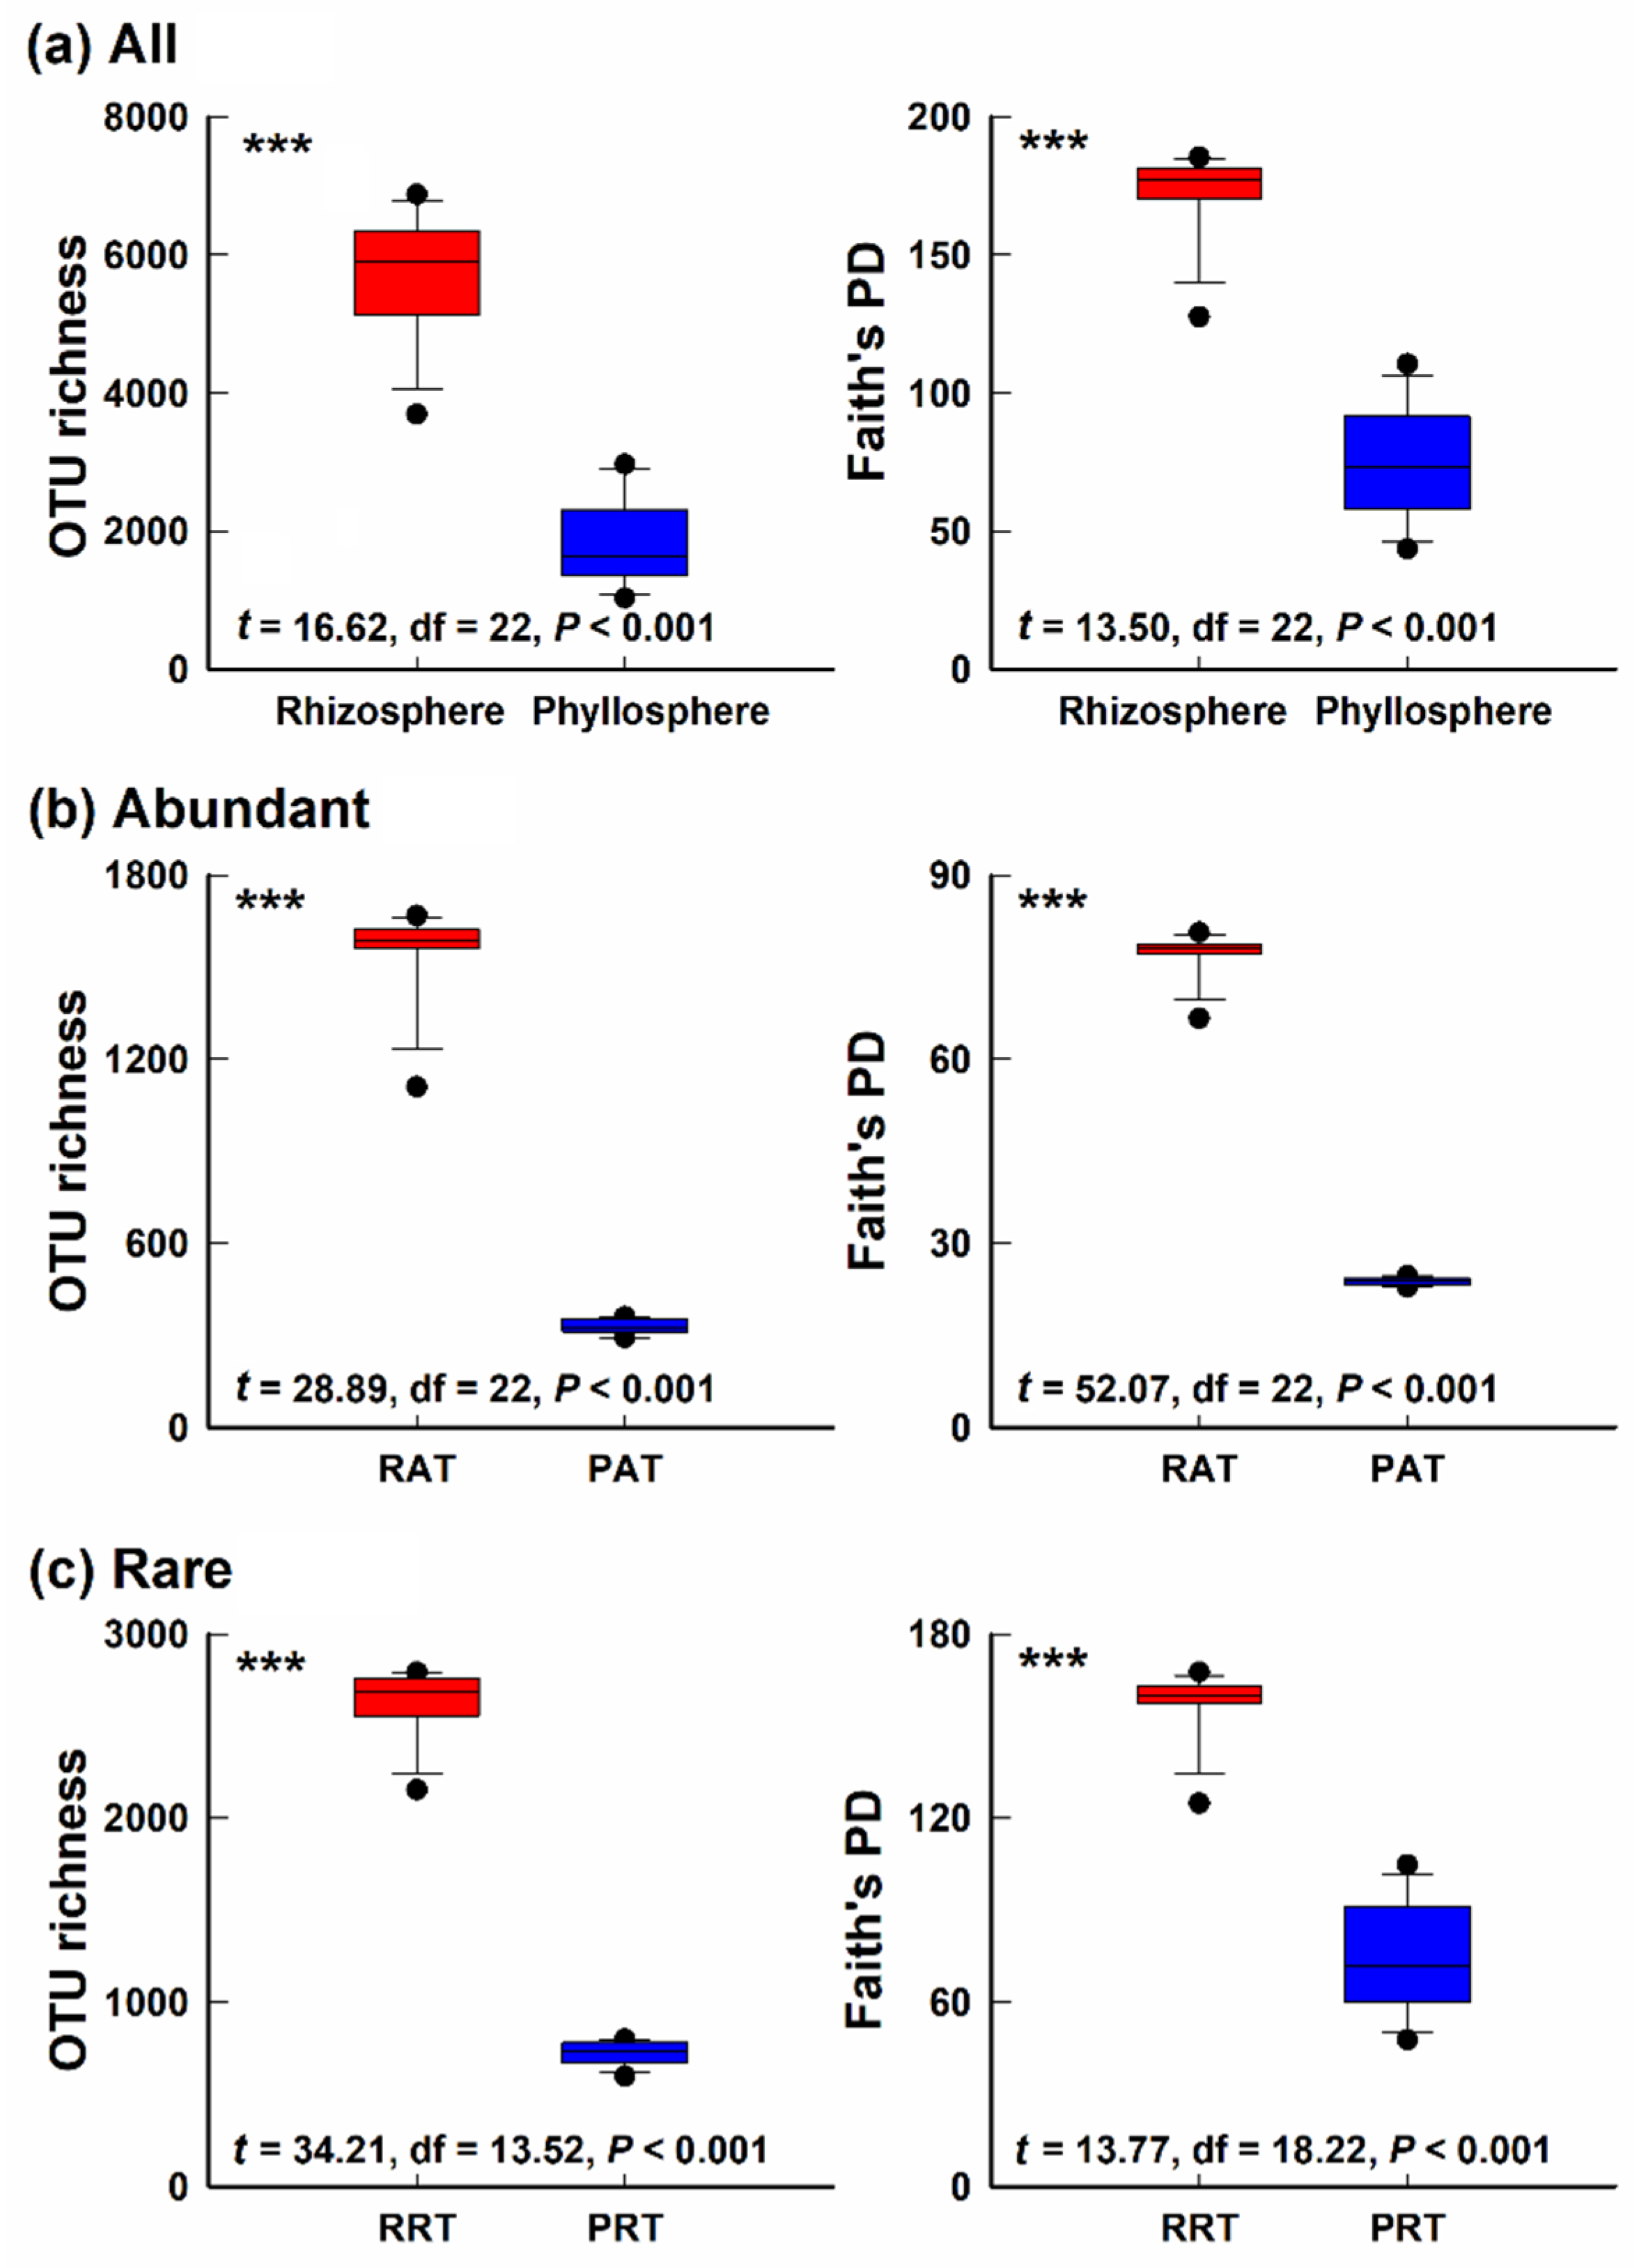
3.1. Alpha-Diversity of Bacterial Community in Different Epiphytic Compartments

Across all samples of rhizosphere and phyllosphere, we obtained a total of 701,103 filtered sequences after quality filtering, and the number of effective sequences ranged from 20,061 to 40,081. To minimize bias associated with sequencing depth or coverage, all samples were rarefied to the lowest number of sequences across the whole set of samples by random resampling (20,061 sequences per sample). At the 97% sequence similarity cut-off level, 11,925 clusters (bacterial OTUs) were detected with 481,464 (=20,061 × 24) sequences. The rarefaction curves of the rhizosphere and phyllosphere bacterial communities showed that saturation was approximately reached, suggesting that sequencing depth was sufficient for the whole samples in this study (Figure S1). Based on the cut-off level of 0.01% relative abundance, we obtained a set of abundant taxa (17.3%) of 1862 OTUs and a set of rare taxa (82.7%) of 8927 OTUs in the rhizosphere, and in the phyllosphere sets of 393 OTUs for the abundant taxa (6.4%) and of 5771 OTUs for the rare taxa (93.6%) of (Figure S2).
Alpha-diversity was calculated to evaluate the richness and evenness of the bacterial community comprehensively, and the value of each index was calculated or estimated based on OTU richness and Faith’s PD. The alpha-diversity of bacterial communities in the rhizosphere and phyllosphere presented a consistent result across abundant taxa, rare taxa and all bacterial taxa, indicating that the alpha-diversity of rhizosphere bacterial communities was significantly higher than those of phyllosphere communities (two-tailed independent-sample t-test, p < 0.001) (Figure 1). In our study, we also observed that the alpha-diversity and proportion of rare bacterial taxa were significantly higher than those of the abundant bacterial taxa (two-tailed independent-sample t-test, p < 0.001) (Figure 1, Figure S2), although the abundance of rare taxa was lower [33,35,51].

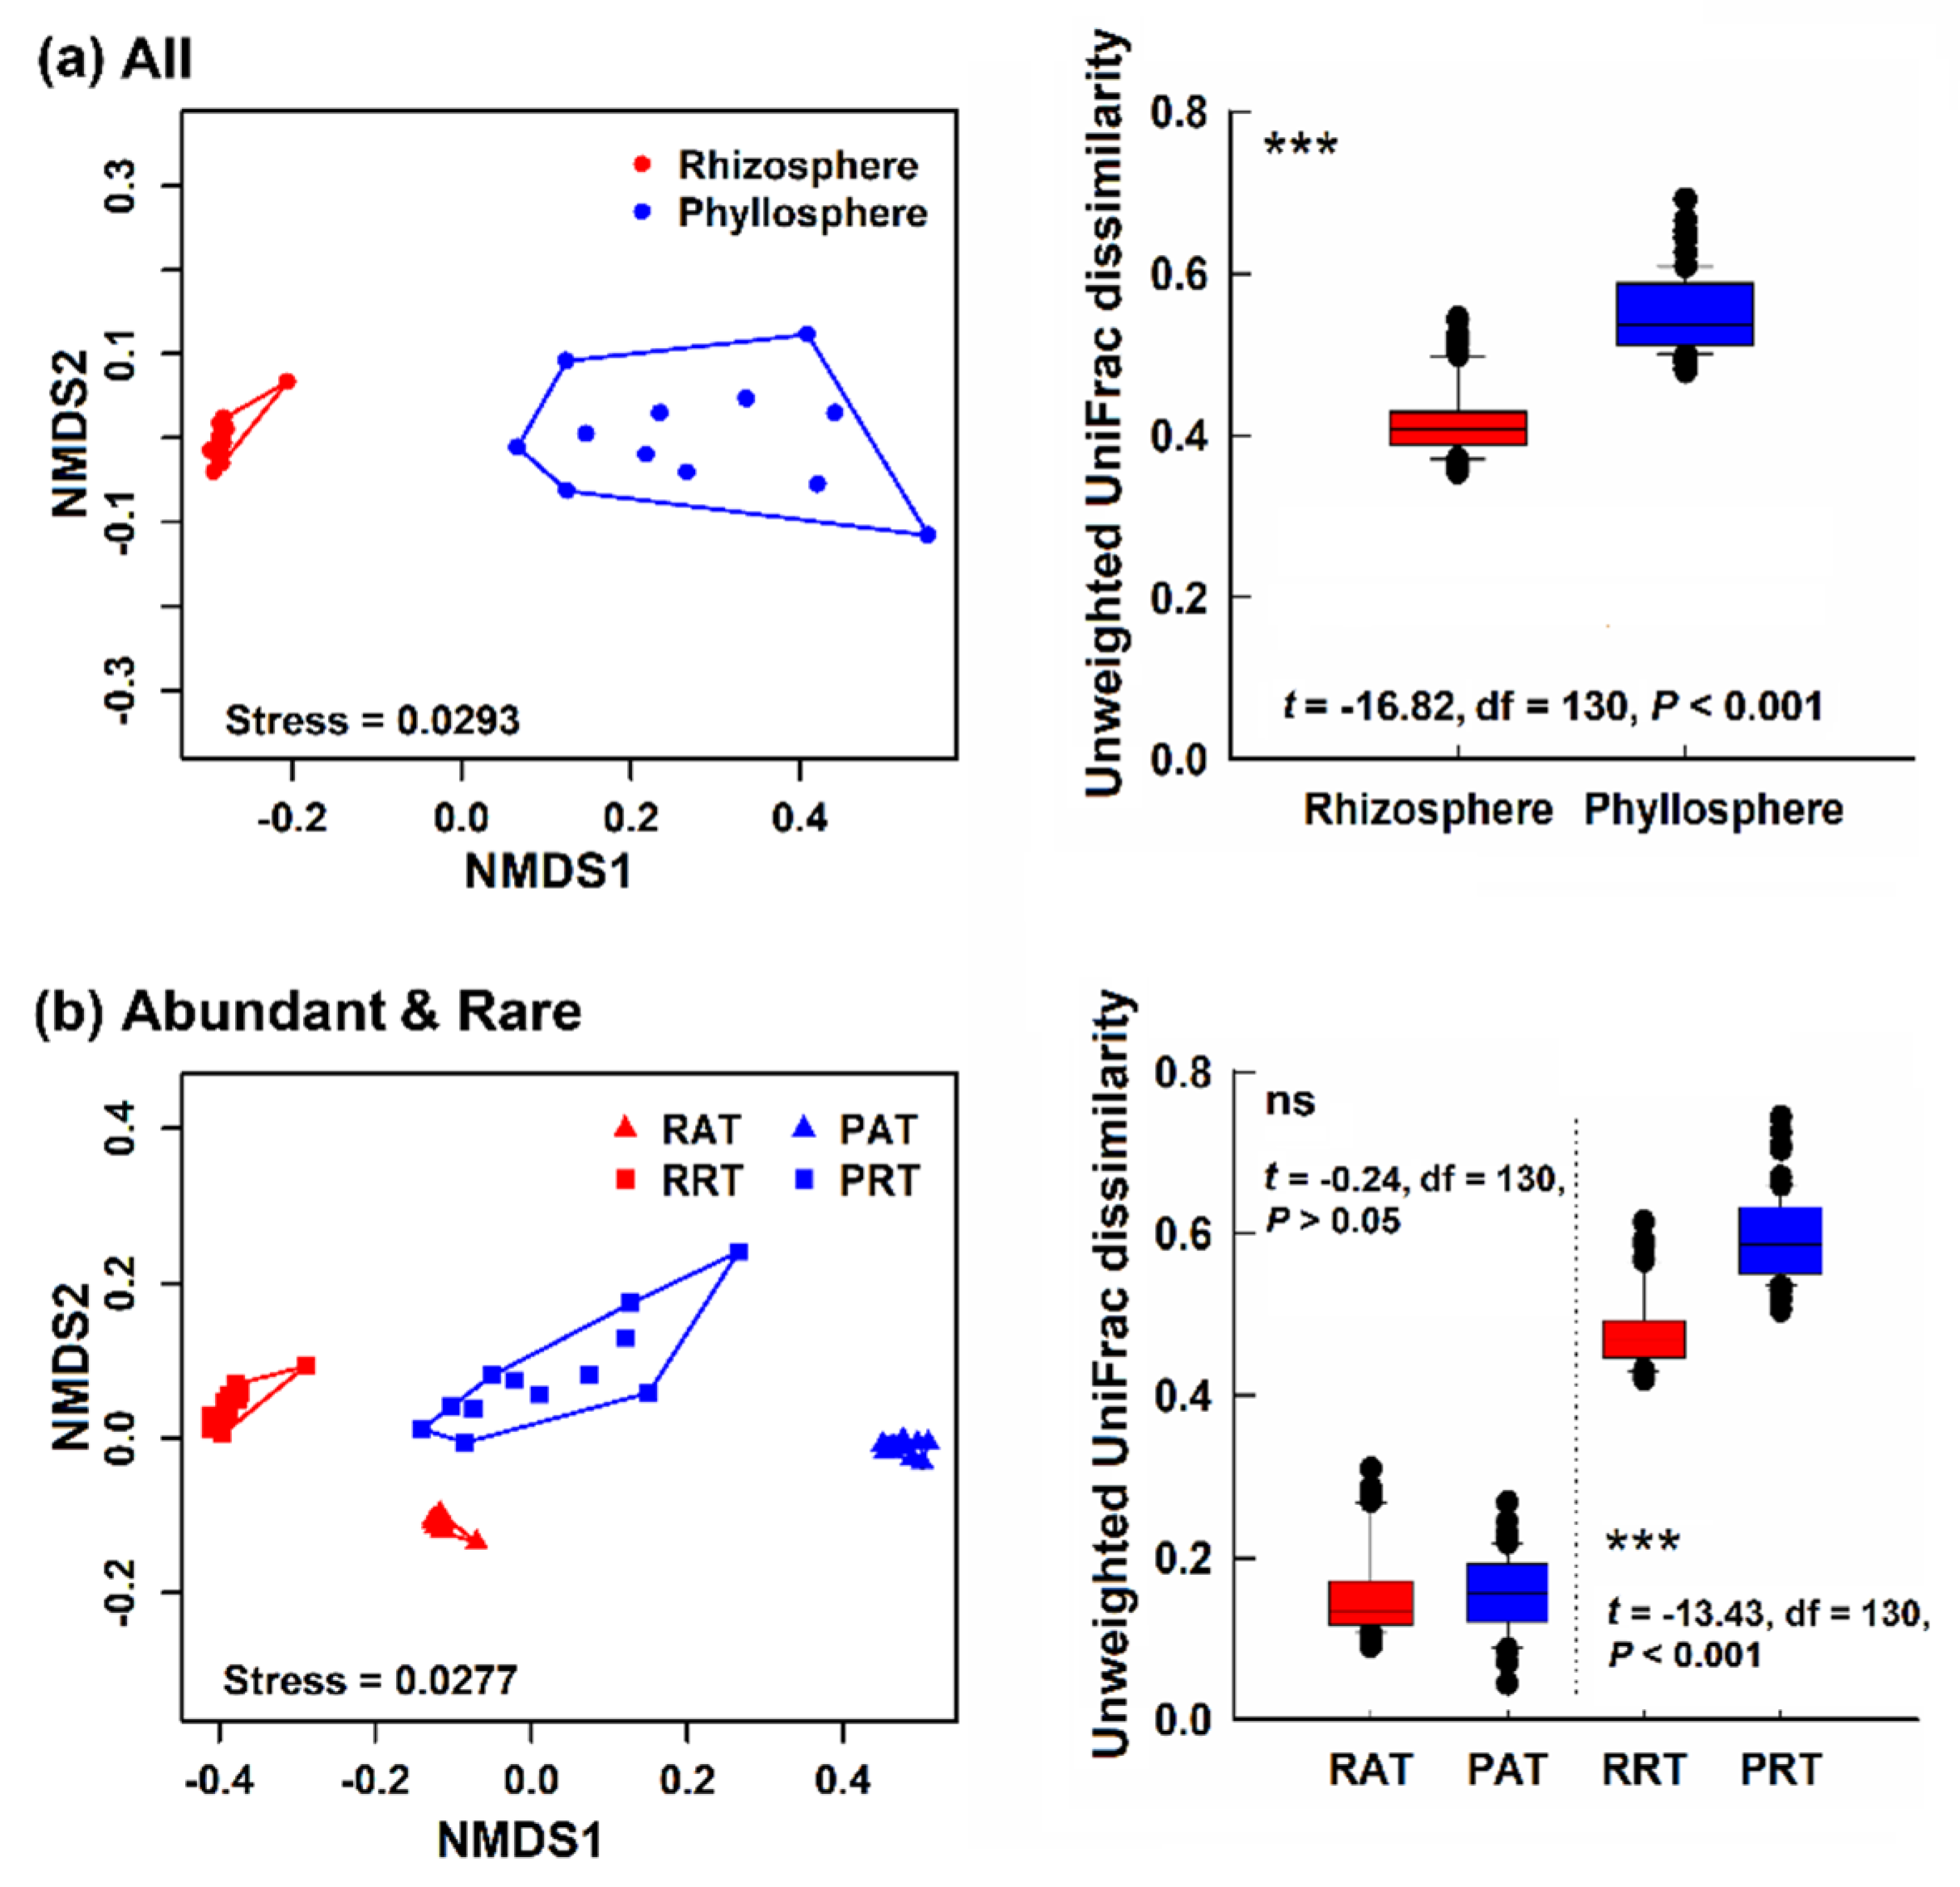
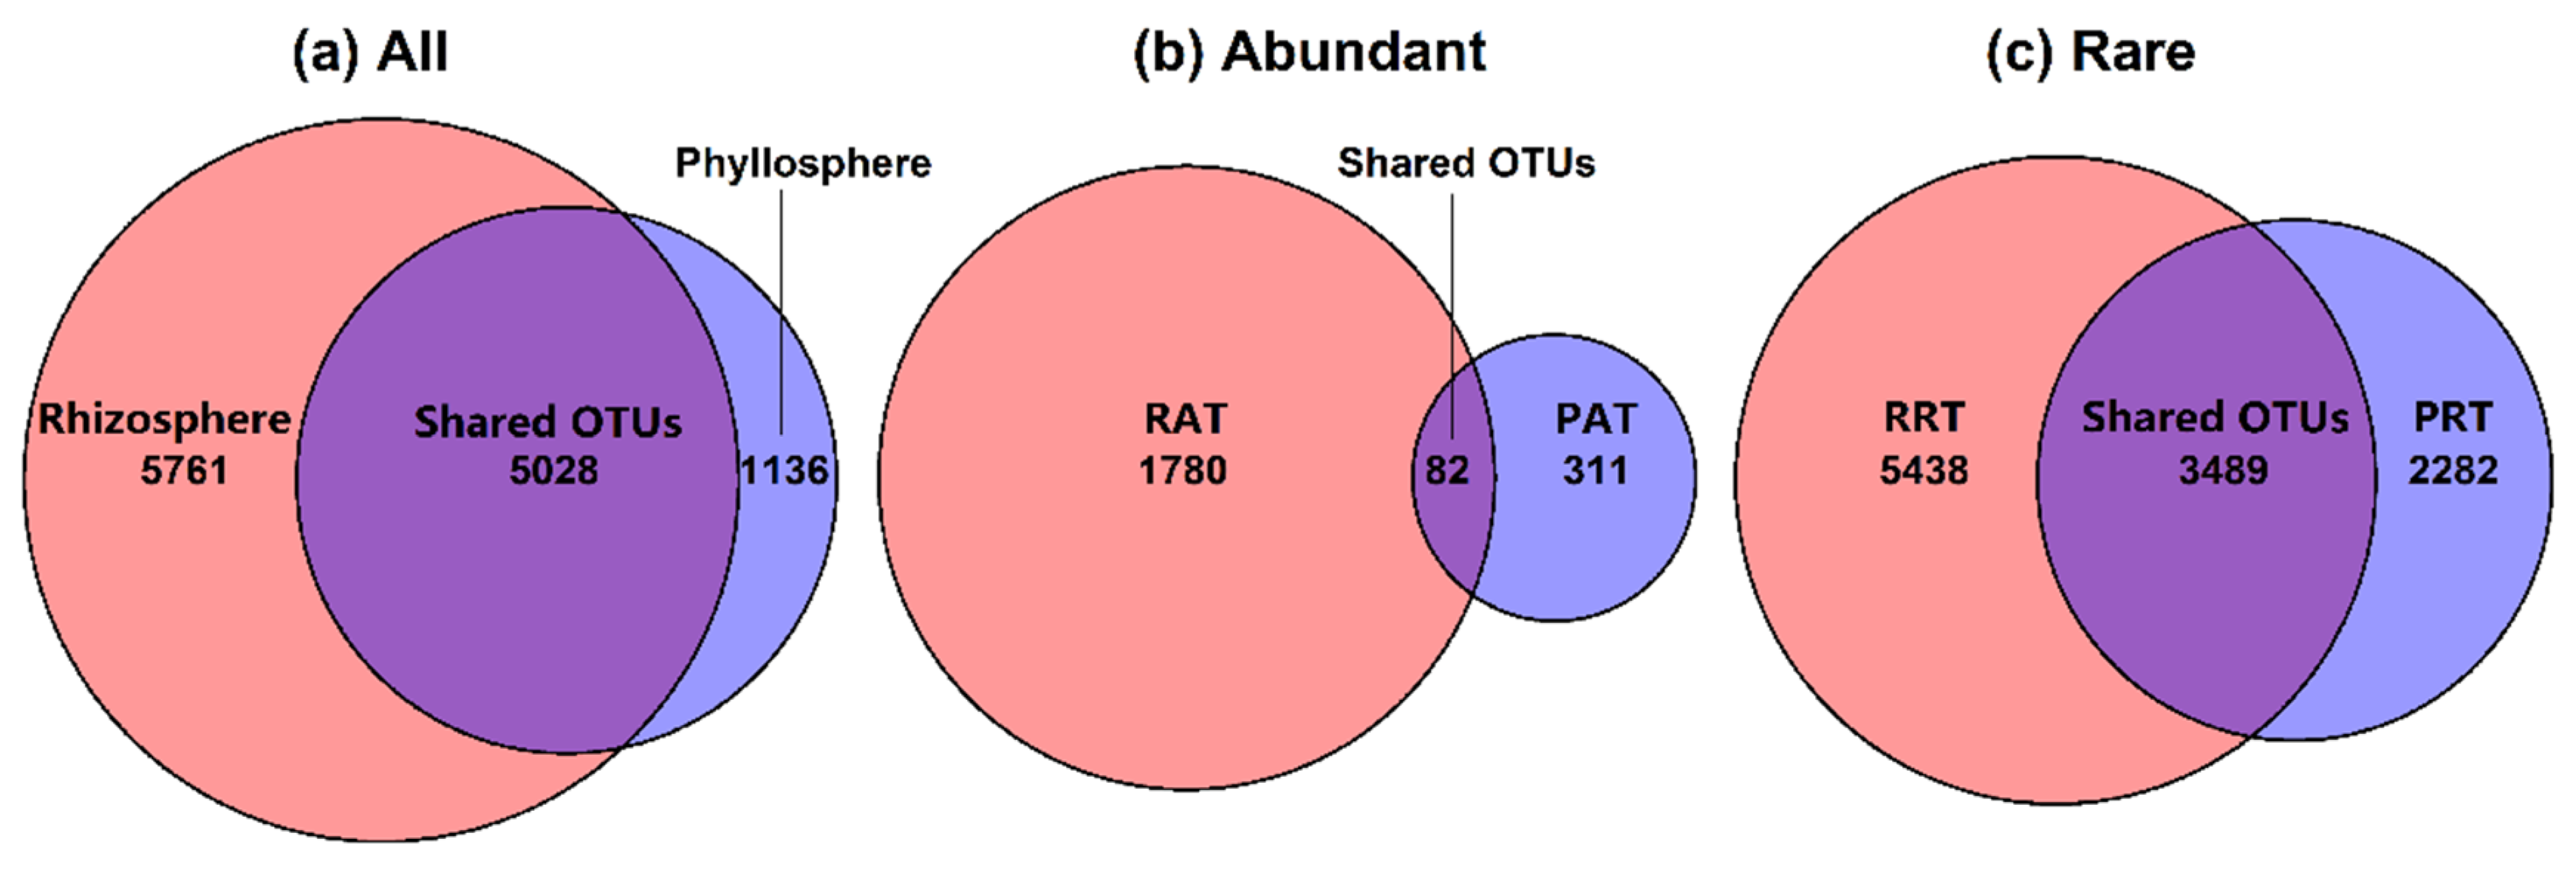
3.2. Bacterial Community Structure in Different Epiphytic Compartments

In order to determine the beta-diversity differences in bacterial community structure between rhizosphere and phyllosphere samples, we conducted a non-metric multidimensional scaling (NMDS) analysis based on phylogenetic distance and visualized the results by drawing the two-dimensional distribution of the samples. Obviously, the distribution and clustering of phyllosphere samples on the NMDS graph were more discrete than those of rhizosphere samples, which means the intra-group differences of phyllosphere community composition were significantly greater than those of rhizosphere (two-tailed independent-sample t-test, p < 0.001), and these results were consistent with the box chart results (Figure 2a). Both analysis of similarities (ANOSIM) (R = 0.9437~1.0, p < 0.001) and permutational analysis of variance (PERMANOVA) (R2 = 0.3272~0.9302, p < 0.001) based on unweighted UniFrac dissimilarity confirmed that the clusters of different groups were statistically significant (Table S3). As can be seen from Figure 2b, the results shown by the comparison of abundant and rare taxa were consistent with the total bacterial communities in the rhizosphere and phyllosphere, and the intra-group difference is mainly due to rare groups.

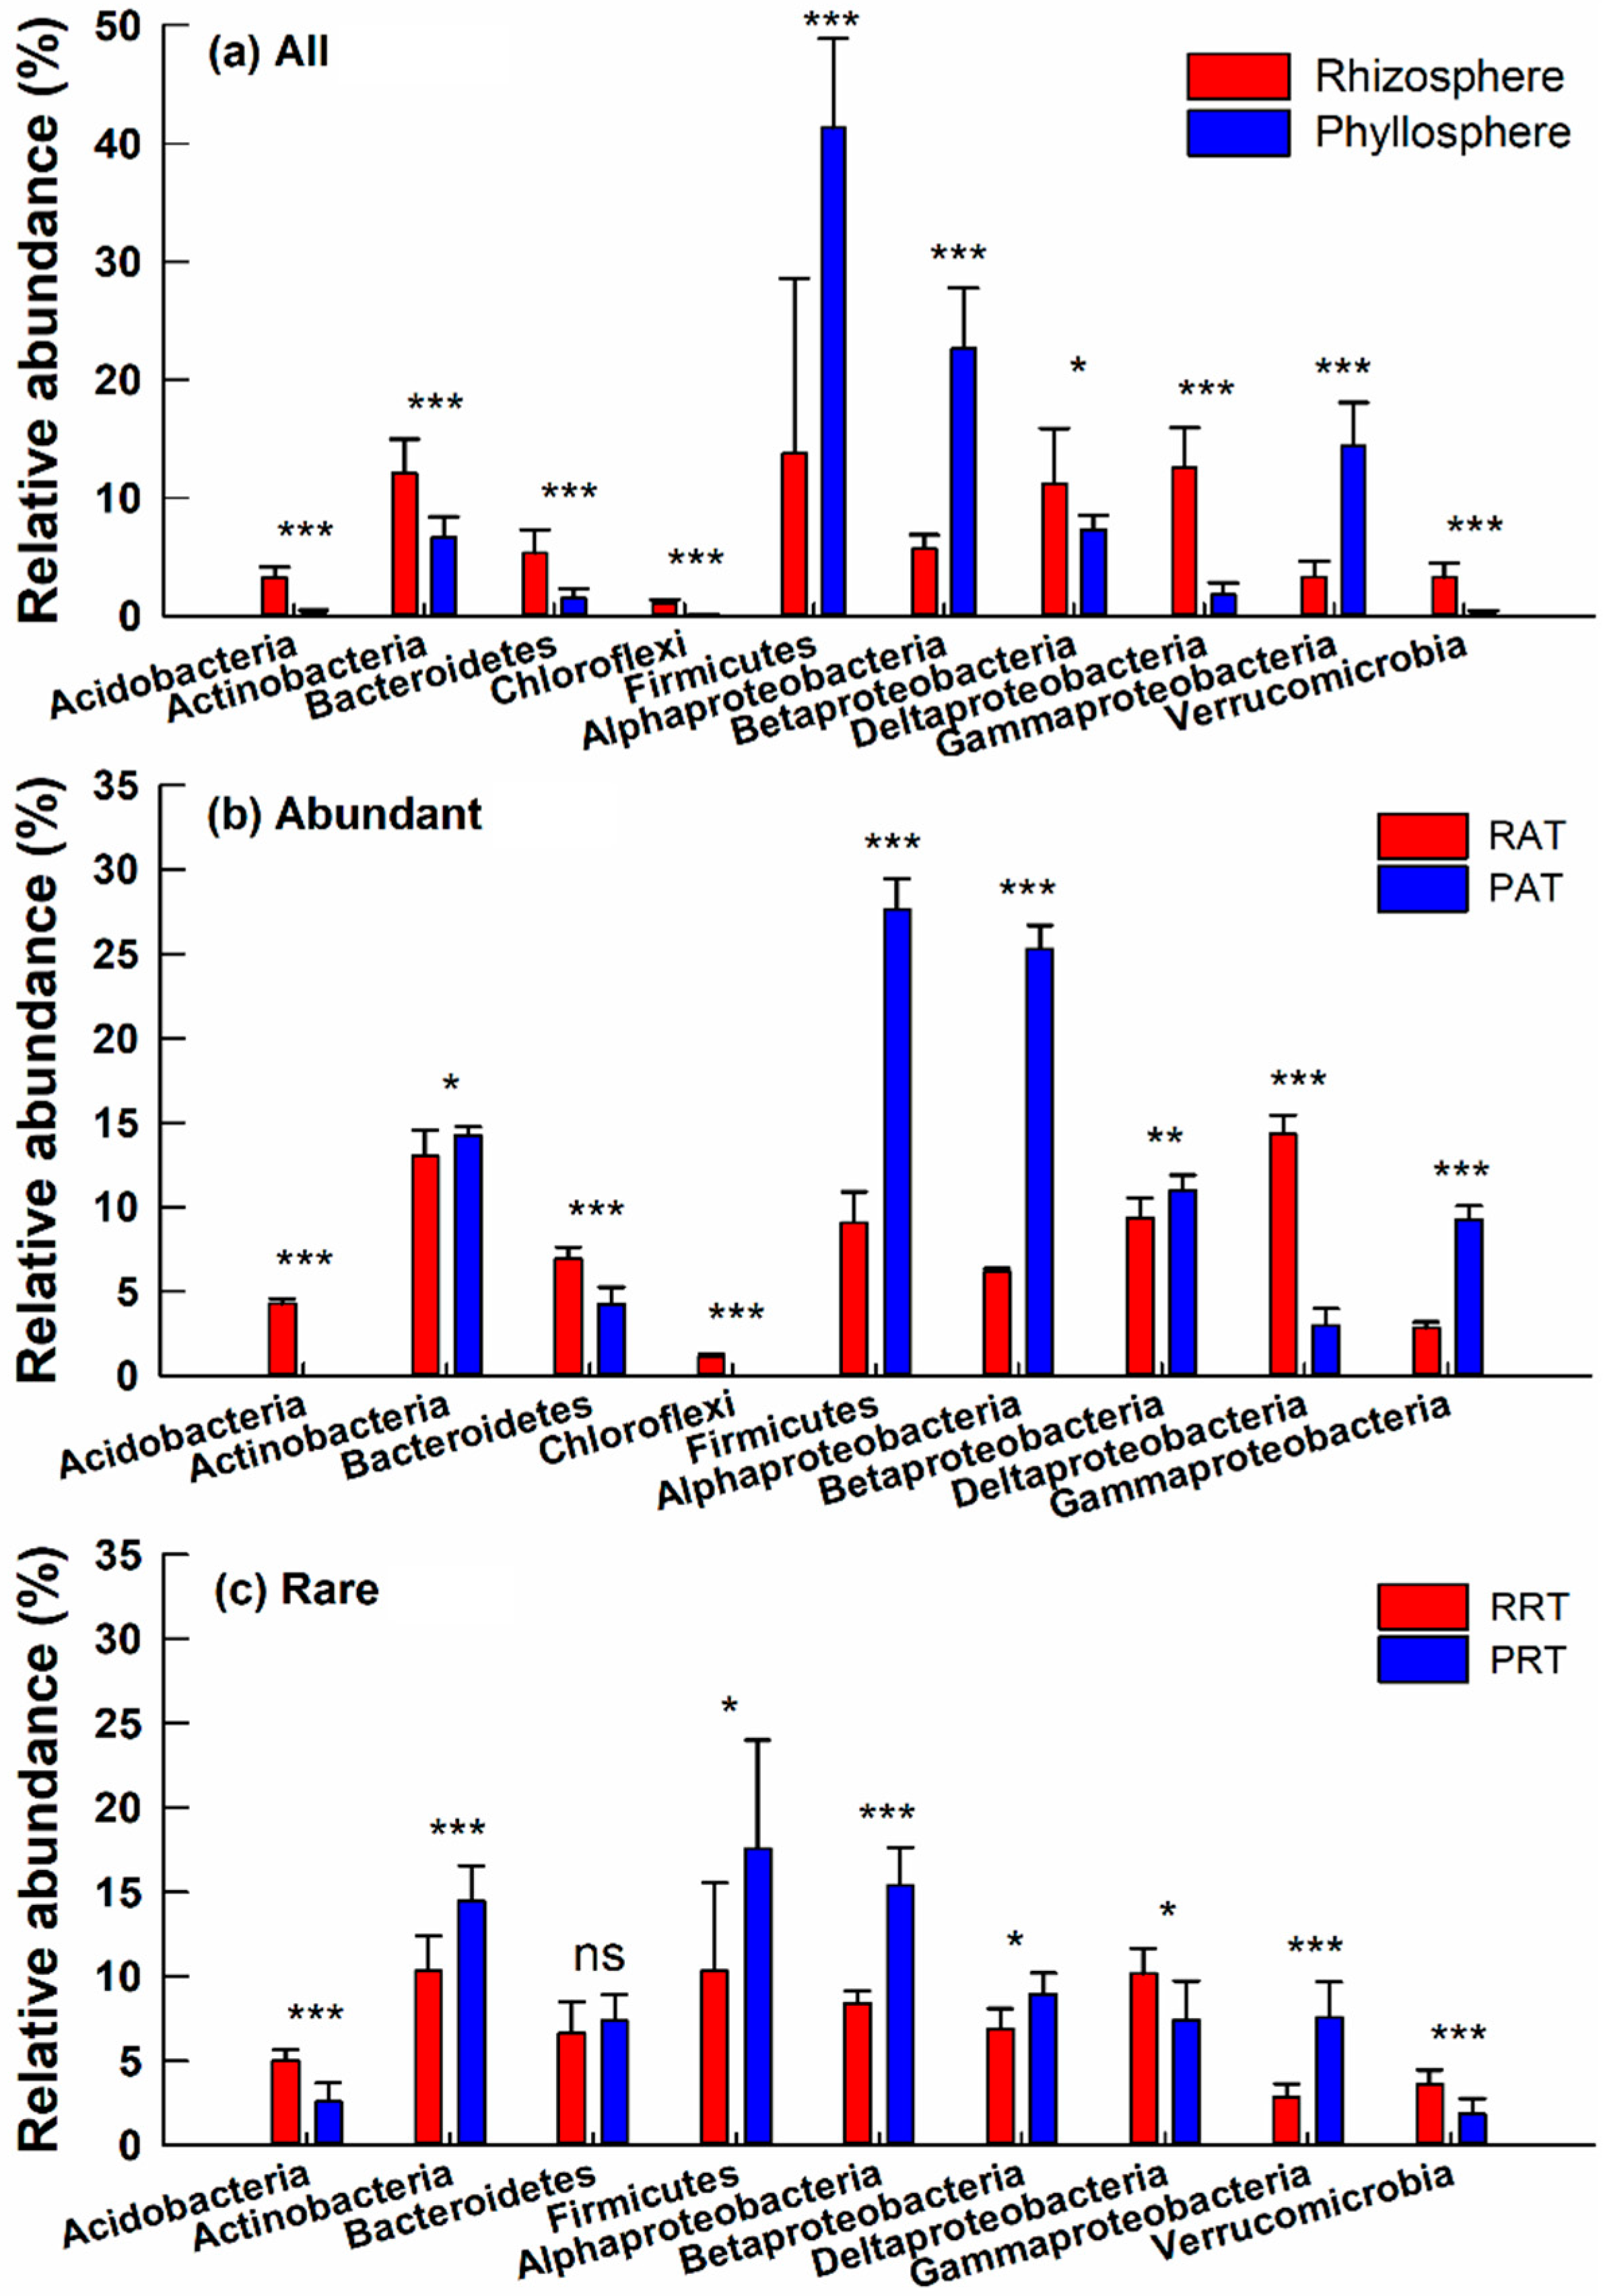
3.3. Taxonomic Differences of Bacterial Community across Different Groups

The bacterial community of the whole set of analyzed samples was composed of 33 phyla, 83 classes, 160 orders, 329 families, and 991 genera. Obviously, there were significant differences among major taxonomic groups of different epiphytic compartments in all, abundant and rare bacterial taxa, respectively (Figure 3).
At the phyla/subphyla level, there were significant differences in the dominant bacteria (relative abundance > 1%) across the different groups (Figure 3 and Table S2). Minor (the phyla with a relative abundance < 1%) and unclassified bacteria were not rendered in the Figure 3. For all bacterial taxa, Actinobacteria (12.14 ± 2.70%), Betaproteobacteria (11.21 ± 4.48%), Deltaproteobacteria (12.55 ± 3.25%) were significantly abundant in the rhizosphere (two-tailed independent-sample t-test, p < 0.05) (Figure 3a). Nevertheless, Firmicutes (41.33 ± 7.22%) and Alphaproteobacteria (22.64 ± 4.90%) exhibited significantly higher abundance in the phyllosphere (two-tailed independent-sample t-test, p < 0.001), and similar results were found for other abundant and rare bacterial taxa (Figure 3). There were no Acidobacteria in the phyllosphere abundant taxa (PAT) (Figure 3b). Chloroflexi (1.12 ± 0.13%) while only a relatively small proportion was the unique bacterial group to RAT (Figure 3b). Verrucomicrobia only occurred among the rare taxa, and their relative abundance in the rhizosphere (3.62 ± 0.75%) was significantly higher than that in the phyllosphere (two-tailed independent-sample t-test, p < 0.001) (Figure 3c). It could not be ignored that there were more unclassified bacteria (23.16 ± 4.60%) than in the phyllosphere (two-tailed independent-sample t-test, p < 0.001) (Table S2). As Venn diagram shown, we could confirm that, more OTUs that shared between rhizosphere and phyllosphere were rare taxa (3489 OTUs) other than abundant taxa (82 OTUs) (Figure 4).
According to the relative abundance and significant difference, we selected the top 50 genera using the ‘vegan’ package in R, and the results were displayed in a Heatmap (Figure S3). Gaiella (Actinobacteria) was significantly more abundant in the rhizosphere, while Microbacterium (Actinobacteria) was only abundant in the phyllosphere (two-tailed independent-sample t-test, p < 0.001) (Figure S3). Lactococcus (Firmicutes) in the phyllosphere had the greatest abundance across all selected genera (Figure S3). Note that Geobacter (Deltaproteobacteria) and Sideroxydans (Betaproteobacteria) were significantly decreased in the phyllosphere, whereas Halomonas (Gammaproteobacteria) and Caulobacter (Alphaproteobacteria) were significantly enriched in the phyllosphere (two-tailed independent-sample t-test, p < 0.001) (Figure S3).

3.4. Phylogenetic Structure of Bacterial Community

Phylogenetic structure analysis was performed to get an in-depth understanding of the assembly processes of bacterial community assembly (i.e., deterministic processes versus stochastic processes) [57]. The standardized effect sizes of the mean-nearest-taxon-distance (ses.MNTD) and betaNTI obtained showed that: (i) average calculated ses.MNTD values of rhizosphere and phyllosphere were less than −4 (Figure 5a), suggesting the bacterial communities of two epiphytic compartments tended to be more phylogenetically clustered than random; however, the differences of phylogenetic clustering between them was not significant (two-tailed independent-sample t-test, p > 0.05) (Figure 5a). (ii) The betaNTI values of rhizosphere were significantly > +2 (Figure 5b), indicating the phylogenetic turnover of rhizosphere community was greater than the null expectation, and the assembly processes of rhizosphere were only related to deterministic processes. In phyllosphere, about 30% betaNTI values distributed between −2 and +2 (Figure 5b), which means that both deterministic and stochastic processes driving the assembly of bacterial communities of phyllosphere, but the deterministic processes were dominant processes (69.70%).

4. Discussion

4.1. Differences of Alpha- and Beta- Diversity in Bacterial Community of Two Epiphytic Compartments

Consistent with previous studies on perennial plants [2,8,13,36], we observed that the alpha-diversity of bacteria in the rhizosphere was significantly higher than that in the phyllosphere, whereas the bacterial communities of the rhizosphere had a lower beta-diversity (Figure 1, Figure 2). Compared with the rhizosphere, the phyllosphere is a habitat with a shorter lifespan, and is more fragile with less organic matter [8,12], while the rhizosphere space contains a large amount of photoassimilates by exudation from the root [8,13,17,21,64]. In other words, the root exudates and the net sequestration of organic carbon and nitrogen by roots help to selectively stimulate the multiplication of specific bacteria in the rhizosphere, thereby increasing the overall abundance and reducing the beta-diversity of the rhizosphere bacterial community [8,17,21,64], thus promoting the differentiation of bacterial communities in the two epiphytic compartments through substrate-driven selection [12,65]. Previous studies reported that the phyllosphere habitat has more inoculation sources than the rhizosphere, and that the range of typical bacterial titers of the phyllosphere is at least one order of magnitude lower than that of the rhizosphere [66,67,68,69]. The diversity difference between rhizosphere and phyllosphere is probably related to the fundamental physiological differences between the two habitats mentioned above.
The Venn diagram results showed that the OTUs shared between rhizosphere and phyllosphere account for about half of the total OTUs (Figure 4), indicating that most bacteria are universal and may colonize in different epiphytic compartments of plants, but their abundance was not equal. These shared bacteria probably play fundamental roles in maintaining the stability of bacterial communities in the micro-ecosystem and are essential components of bacterial communities in different habitats [35,51].

4.2. Similar Taxonomic Composition and Distinct Individual Classes or Genera Across Different Groups

Both rhizosphere and phyllosphere bacterial communities were mainly composed of Firmicutes, Actinobacteria and Proteobacteria, but their compositions differed by their several individual classes or genera. The similarity of the taxonomic composition of rhizosphere and phyllosphere bacterial communities was partly related to the fact that they share their initial inoculating source, namely soil [13]. More unclassified bacteria was found in the rhizosphere, indicating that there were abundant bacterial category in rhizosphere remained to be detected beyond current understanding.
The most significantly abundant Firmicutes were found in the phyllosphere, where they can produce endospores with strong stress resistance and these endospores help plants resist dehydration and extreme conditions [70]. As can be seen from the Heatmap, Lactococcus (Firmicutes), which has been reported to have extreme sensitivity and tolerance to a variety of antibiotics [71,72], is significantly enriched in the phyllosphere compared to other genera, indicating that there might be many antibiotic-like substances in the phyllosphere of P. australis. Zhou et al. (2019) proposed that the phyllosphere of staple crops was a reservoir of antibiotic resistance genes [73]. Their findings are consistent with our speculation, indicating that Lactococcus is enriched in phyllosphere for the purpose of helping plants resist such adverse external factors [73]. Gaiella (Actinobacteria) can carry out nitrate reduction, helping plants to assimilate carbohydrates, organic acids, and amino acids [74,75,76] (Figure S3), so it accumulates in the rhizosphere to support the plant’s ability to absorb nutrients from soil. In addition, Halomonas (Gammaproteobacteria) was reported to be a kind of halophilic (salt-tolerating) bacteria growing in the range of 5–25% salinity [77]. The most known members of this genus are motile and are able to utilize glycerol and trehalose [78]. According to Finkel et al. (2011), the abundant presence of Halomonas in phyllosphere samples is not surprising, since the phyllosphere habitat usually has higher salinity [79]. The same results were found in our study, Halomonas is significantly abundant in the phyllosphere (Figure S3), suggesting that the phyllosphere may has a higher salinity suitable for Halomonas growth. The phyllosphere salinity and the growth of are primarily related to ambient temperature or other related factors (such as water availability) [79]. In the present study, samples were collected in summer, and the average summer temperature in Nanjing is usually above 35 °C, high temperature and the direct exposure to the atmosphere and sunlight cause the considerable evaporation of water from the leaf surface, although the hydrophobic waxy cuticle of the epidermal cells reduces some of the evaporation [12]. Geobacter (Deltaproteobacteria), which was reported to be an anaerobic respiration bacterium with useful bioremediation capabilities, and able to oxidize organic compounds and metals into environmentally friendly carbon dioxide according to Childers et al. (2002) and Bond et al. (2003), has a significantly higher abundance in the rhizosphere [80,81].

4.3. Diversity and Composition of Abundant Taxa and Rare Taxa

Doubtlessly, the rare taxa make a significant contribution to the alpha-diversity and beta-diversity, whereas rare taxa have a lower richness than abundant taxa. The distinction in diversity and richness between abundant and rare taxa may be due to the fact, that abundant taxa can grow and reproduce within a wider range of resources, while the reproduction of rare taxa is limited by specific substrate conditions, so we can detect the presence of multiple species of rare taxa, but that is not manifested in their abundance [35,51,82]. The observation that the OTUs shared between RRT and phyllosphere rare taxa (PRT) in the rare subcommunities account for a large proportion of total shared bacteria, also illustrates this conclusion (Figure 4). Previous studies have shown that the lower abundance of rare taxa actually protects them from actively being eliminated, including virus lysis and predation, which could reduce the exposure of rare taxa to extinction risk [25,31,50,51].
In both the rhizosphere and the phyllosphere, rare taxa contribute more to the higher beta-diversity than abundant taxa, which is attributed to bacteria with a lower abundance or other undefined species and to the random immigration of new species in rare subcommunities [83,84]. The remarkable differences in structure of rare subcommunities makes it possible for them to act as a diversity seed bank which might contain several surprising unexplored biological resources and could maintain community dynamic stability [24,28,31,50]. In addition, only a relatively small proportion of Chloroflexi, which have been reported to have a better biological phosphorus removal effect in activated sludge according to Kragelund et al. (2007), was found in RAT [85].
There were a large number of different OTUs between RAT and PAT in the total of abundant taxa (Figure 4), which could came down to two reasons. On the one hand, the RAT bank has more and more bacterial species than the PAT bank per se [8], on the other hand, and more importantly, the rhizosphere plays a more complex and indispensable role during the growth and development of plants, requiring higher multitude of bacteria to constitute the rhizosphere bacterial community, and these abundant taxa probably play a leading role globally in mediating biogeochemical cycling [9,27].

4.4. Phylogenetic Structure of Bacterial Community in Different Epiphytic Compartments

The importance of deterministic and stochastic processes in assembling the microbial community structure had been emphasized in recent years [61]. Our results showed that deterministic processes dominantly control communities assembly processes both in the rhizosphere and the phyllosphere (Figure 5b), and it is probably mainly composed of the influence of environmental selection. Because the rhizosphere habitat provides more biological buffering through exudation of plant’s root and protection of soil physical and chemical environment [8,9,64], and the phyllosphere habitat is not only influenced by plants directly but also affected by regional climatic conditions [8,12,65].
However, stochastic processes plays more important roles and have a more pronounced influence on bacterial community assembly in the phyllosphere than in the rhizosphere (Figure 5b). The probability of random colonization of microorganisms in the phyllosphere of perennial plants is greater than that in the rhizosphere, due to physiological characteristics of leaves mentioned above and more dispersal caused by atmospheric disturbances [11,12,36,65], which may be the reason for a certain proportion of stochastic processes in phyllosphere. Moreover, we suppose that the certain proportion of the contribution of stochastic processes in phyllosphere is one of the reasons for the higher beta-diversity in phyllosphere. Chase (2007) reported that communities in drier ponds with drought are more similar and have a lower beta-diversity due to niche selection caused by drought (deterministic processes) [86]. Jiang and Patel (2008) also found a similar conclusion in their study on the importance of disturbance in mediation of community assembly [87]. Thus, although deterministic processes are very important in assembly processes of epiphytic bacterial communities of plants, the influence of stochastic processes on the community structure cannot be ignored, either.

5. Conclusions

Overall, our work demonstrates the dissimilarity in composition, structure, and assembly of the bacterial communities in different epiphytic compartments (rhizosphere and phyllosphere) of P. australis, as well as the relative contributions of abundant and rare taxa. In this study, the rhizosphere’s bacterial community showed higher alpha-diversity, lower beta-diversity, more complex community, and more deterministic assembly processes than that of the phyllosphere. In addition to this, the high proportion and low abundance of rare taxa suggest that the rare taxa are a highly diverse and largely unexplored microbial biosphere. However, further research into the specific ecological processes involved in assembly mechanisms of epiphytic bacteria on aquatic plants should address this hypothesis in our study more carefully for a better understanding of the colonization of epiphytic bacterium.

Supplementary Materials

The following are available online at https://www.mdpi.com/1424-2818/11/6/98/s1, Figure S1: Rarefaction curves of observed OTUs in rhizosphere and phyllosphere compartments of Phragmitas australis, Figure S2: Rank abundance curve for the obtained OTUs, Figure S3: Heatmap show the top 50 most different and abundant genera in different epiphytic compartments, Table S1: List of the physicochemical properties of bulk sediments in this study (n = 5), Table S2: Relative abundance of dominant bacterial phyla/subphyla (relative abundance > 1.0%) in different epiphytic compartments (mean ± SE), Table S3: Unweighted UniFrac dissimilarity of bacterial communities among different groups.

Author Contributions

Conceptualization, J.Z. and D.Z.; methodology, R.H. (Rujia He), S.W.; software, C.J. and R.H. (Rui Huang); validation, Q.Z., R.H. (Rujia He), and D.Z.; formal analysis, Q.Z. and X.Z.; investigation, Q.Z., X.Z., S.W. and X.H.; resources, J.Z. and D.Z.; writing—original draft preparation, Q.Z. and X.Z.; writing—review and editing, Q.Z., R.H. (Rujia He), C.J. and D.Z.; visualization, Q.Z.; supervision, D.Z.; project administration, D.Z.

Funding

This research was funded by National Key R&D Program of China (2016YFC0402710), National Natural Science Foundation of China (31730013, 41621002, 41571108, 41671078 and 41871096), Natural Science Foundation of Jiangsu Province, China (BK20181311), the Fundamental Research Funds for the Central Universities (2018B43414, 2019B17814), the Key Research Program of Frontier Science, CAS (QYZDJ-SSW-DQC030), and China Postdoctoral Science Foundation (2018M642147).

Acknowledgments

We thank Yutong Wu for his assistance with samples collection work.

Conflicts of Interest

The authors declare no conflict of interest.

References

  1. Chambers, R.M.; Meyerson, L.A.; Saltonstall, K. Expansion of Phragmites australis into tidal wetlands of North America. Aquat. Bot. 1999, 64, 261–273. [Google Scholar] [CrossRef]
  2. Bowen, J.L.; Kearns, P.J.; Byrnes, J.E.K.; Wigginton, S.; Allen, W.J.; Greenwood, M.; Tran, K.; Yu, J.; Cronin, J.T.; Meyerson, L.A. Lineage overwhelms environmental conditions in determining rhizosphere bacterial community structure in a cosmopolitan invasive plant. Nat. Commun. 2017, 8, 433. [Google Scholar] [CrossRef] [PubMed]
  3. Meyerson, L.A.; Cronin, J.T.; Pyšek, P. Phragmites australis as a model organism for studying plant invasions. Biol. Invasions 2016, 18, 2421–2431. [Google Scholar] [CrossRef]
  4. Achenbach, L.; Lambertini, C.; Brix, H. Phenotypic traits of Phragmites australis clones are not related to ploidy level and distribution range. AoB Plants 2012. [Google Scholar] [CrossRef] [PubMed]
  5. Eller, F.; Skalova, H.; Caplan, J.S.; Bhattarai, G.P.; Burger, M.K.; Cronin, J.T.; Guo, W.Y.; Guo, X.; Hazelton, E.L.G.; Kettenring, K.M.; et al. Cosmopolitan species as models for ecophysiological responses to global change:the common reed Phragmites australis. Front. Plant Sci. 2017, 8, 1833. [Google Scholar] [CrossRef] [PubMed]
  6. Li, L.P.; Han, W.X.; Thevs, N.; Jia, X.H.; Ji, C.J.; Jin, D.M.; He, P.; Schmitt, A.O.; Cirella, G.T.; Zerbe, S. A comparison of the functional traits of common reed (Phragmites australis) in Northern China: Aquatic vs. terrestrial ecotypes. PLoS ONE 2014, 9, e89063. [Google Scholar] [CrossRef]
  7. Wen, B.L.; Li, X.Y.; Yang, F.; Lu, X.R.; Li, X.J.; Yang, F.Y. Growth and physiology responses of Phragmites australis to combined drought-flooding condition in inland saline-alkaline marsh, Northeast China. Ecol. Eng. 2017, 108, 234–239. [Google Scholar] [CrossRef]
  8. Bulgarelli, D.; Schlaeppi, K.; Spaepen, S.; Ver Loren van Themaat, E.; Schulze-Lefert, P. Structure and functions of the bacterial microbiota of plants. Annu. Rev. Plant Biol. 2013, 64, 807–838. [Google Scholar] [CrossRef]
  9. Philippot, L.; Raaijmakers, J.M.; Lemanceau, P.; van der Putten, W.H. Going back to the roots: The microbial ecology of the rhizosphere. Nat. Rev. Microbiol. 2013, 11, 789–799. [Google Scholar] [CrossRef]
  10. Knief, C.; Ramette, A.; Frances, L.; Alonso-Blanco, C.; Vorholt, J.A. Site and plant species are important determinants of the Methylobacterium community composition in the plant phyllosphere. ISME J. 2010, 4, 719–728. [Google Scholar] [CrossRef]
  11. Vacher, C.; Hampe, A.; Porte, A.J.; Sauer, U.; Compant, S.; Morris, C.E. The phyllosphere: Microbial jungle at the plant-climate interface. Annu. Rev. Ecol. Evol. Syst. 2016, 47, 1–24. [Google Scholar] [CrossRef]
  12. Vorholt, J.A. Microbial life in the phyllosphere. Nat. Rev. Microbiol. 2012, 10, 828–840. [Google Scholar] [CrossRef] [PubMed]
  13. Wagner, M.R.; Lundberg, D.S.; Del Rio, T.G.; Tringe, S.G.; Dangl, J.L.; Mitchell-Olds, T. Host genotype and age shape the leaf and root microbiomes of a wild perennial plant. Nat. Commun. 2016, 7, 12151. [Google Scholar] [CrossRef] [PubMed]
  14. Rico, L.; Ogaya, R.; Terradas, J.; Peñuelas, J. Community structures of N2-fixing bacteria associated with the phyllosphere of a Holm oak forest and their response to drought. Plant Biol. 2014, 16, 586–593. [Google Scholar] [CrossRef] [PubMed]
  15. Beckers, B.; Op De Beeck, M.; Weyens, N.; Boerjan, W.; Vangronsveld, J. Structural variability and niche differentiation in the rhizosphere and endosphere bacterial microbiome of field-grown poplar trees. Microbiome 2017, 5, 25. [Google Scholar] [CrossRef] [PubMed]
  16. Edwards, J.; Johnson, C.; Santos-Medellin, C.; Lurie, E.; Podishetty, N.K.; Bhatnagar, S.; Eisen, J.A.; Sundaresan, V. Structure, variation, and assembly of the root-associated microbiomes of rice. Proc. Natl. Acad. Sci. USA 2015, 112, E911–E920. [Google Scholar] [CrossRef] [PubMed] [Green Version]
  17. Fan, K.K.; Cardona, C.; Li, Y.T.; Shi, Y.; Xiang, X.J.; Shen, C.C.; Wang, H.F.; Gilbert, J.A.; Chu, H.Y. Rhizosphere-associated bacterial network structure and spatial distribution differ significantly from bulk soil in wheat crop fields. Soil Biol. Biochem. 2017, 113, 275–284. [Google Scholar] [CrossRef]
  18. Ofek-Lalzar, M.; Sela, N.; Goldman-Voronov, M.; Green, S.J.; Hadar, Y.; Minz, D. Niche and host-associated functional signatures of the root surface microbiome. Nat. Commun. 2014, 5, 4950. [Google Scholar] [CrossRef] [PubMed]
  19. Peiffer, J.A.; Spor, A.; Koren, O.; Jin, Z.; Tringe, S.G.; Dangl, J.L.; Buckler, E.S.; Ley, R.E. Diversity and heritability of the maize rhizosphere microbiome under field conditions. Proc. Natl. Acad. Sci. USA 2013, 110, 6548–6553. [Google Scholar] [CrossRef] [PubMed] [Green Version]
  20. Zhang, Y.Z.; Xu, J.; Riera, N.; Jin, T.; Li, J.Y.; Wang, N. Huanglongbing impairs the rhizosphere-to-rhizoplane enrichment process of the citrus root-associated microbiome. Microbiome 2017, 5, 97. [Google Scholar] [CrossRef]
  21. Bulgarelli, D.; Rott, M.; Schlaeppi, K.; Ver Loren van Themaat, E.; Ahmadinejad, N.; Assenza, F.; Rauf, P.; Huettel, B.; Reinhardt, R.; Schmelzer, E.; et al. Revealing structure and assembly cues for Arabidopsis root-inhabiting bacterial microbiota. Nature 2012, 488, 91–95. [Google Scholar] [CrossRef] [PubMed]
  22. Schlaeppi, K.; Dombrowski, N.; Oter, R.G.; Ver Loren van Themaat, E.; Schulze-Lefert, P. Quantitative divergence of the bacterial root microbiota in Arabidopsis thaliana relatives. Proc. Natl. Acad. Sci. USA 2014, 111, 585–592. [Google Scholar] [CrossRef] [PubMed]
  23. Chen, W.D.; Pan, Y.B.; Yu, L.Y.; Yang, J.; Zhang, W.J. Patterns and processes in marine microeukaryotic community biogeography from Xiamen coastal waters and intertidal sediments, Southeast China. Front. Microbiol. 2017, 8, 1912. [Google Scholar] [CrossRef] [PubMed]
  24. Logares, R.; Audic, S.; Bass, D.; Bittner, L.; Boutte, C.; Christen, R.; Claverie, J.M.; Decelle, J.; Dolan, J.R.; Dunthorn, M.; et al. Patterns of rare and abundant marine microbial eukaryotes. Curr. Biol. 2014, 24, 813–821. [Google Scholar] [CrossRef] [PubMed]
  25. Pedrós-Alió, C. The rare bacterial biosphere. Annu. Rev. Mar. Sci. 2012, 4, 449–466. [Google Scholar] [CrossRef] [PubMed]
  26. Sogin, M.L.; Morrison, H.G.; Huber, J.A.; Mark Welch, D.; Huse, S.M.; Neal, P.R.; Arrieta, J.M.; Herndl, G.J. Microbial diversity in the deep sea and the underexplored “rare biosphere”. Proc. Natl. Acad. Sci. USA 2006, 103, 12115–12120. [Google Scholar] [CrossRef] [PubMed]
  27. Kim, T.S.; Jeong, J.Y.; Wells, G.F.; Park, H.D. General and rare bacterial taxa demonstrating different temporal dynamic patterns in an activated sludge bioreactor. Appl. Microbiol. Biotechnol. 2013, 97, 1755–1765. [Google Scholar] [CrossRef]
  28. Galand, P.E.; Casamayor, E.O.; Kirchman, D.L.; Lovejoy, C. Ecology of the rare microbial biosphere of the Arctic Ocean. Proc. Natl. Acad. Sci. USA 2009, 106, 22427–22432. [Google Scholar] [CrossRef] [Green Version]
  29. Xue, Y.; Chen, H.; Yang, J.R.; Liu, M.; Huang, B.; Yang, J. Distinct patterns and processes of abundant and rare eukaryotic plankton communities following a reservoir cyanobacterial bloom. ISME J. 2018, 12, 2263–2277. [Google Scholar] [CrossRef] [Green Version]
  30. Debroas, D.; Hugoni, M.; Domaizon, I. Evidence for an active rare biosphere within freshwater protists community. Mol. Ecol. 2015, 24, 1236–1247. [Google Scholar] [CrossRef] [Green Version]
  31. Lynch, M.D.J.; Neufeld, J.D. Ecology and exploration of the rare biosphere. Nat. Rev. Microbiol. 2015, 13, 217–229. [Google Scholar] [CrossRef] [PubMed]
  32. Campbell, B.J.; Yu, L.Y.; Heidelberg, J.F.; Kirchman, D.L. Activity of abundant and rare bacteria in a coastal ocean. Proc. Natl. Acad. Sci. USA 2011, 108, 12776–12781. [Google Scholar] [CrossRef] [PubMed] [Green Version]
  33. Jousset, A.; Bienhold, C.; Chatzinotas, A.; Gallien, L.; Gobet, A.; Kurm, V.; Küsel, K.; Rillig, M.C.; Rivett, D.W.; Salles, J.F.; et al. Where less may be more: How the rare biosphere pulls ecosystems strings. ISME J. 2017, 11, 853–862. [Google Scholar] [CrossRef] [PubMed]
  34. Shade, A.; Hogan, C.S.; Klimowicz, A.K.; Linske, M.; McManus, P.S.; Handelsman, J. Culturing captures members of the soil rare biosphere. Environ. Microbiol. 2012, 14, 2247–2252. [Google Scholar] [CrossRef] [PubMed]
  35. Jiao, C.C.; Zhao, D.Y.; Huang, R.; Cao, X.Y.; Zeng, J.; Lin, Y.Q.; Zhao, W.J. Abundant and rare bacterioplankton in freshwater lakes subjected to different levels of tourism disturbances. Water 2018, 10, 16. [Google Scholar] [CrossRef]
  36. Lundberg, D.S.; Lebeis, S.L.; Paredes, S.H.; Yourstone, S.; Gehring, J.; Malfatti, S.; Tremblay, J.; Engelbrektson, A.; Kunin, V.; del Rio, T.G.; et al. Defining the core Arabidopsis thaliana root microbiome. Nature 2012, 488, 86–90. [Google Scholar] [CrossRef] [PubMed]
  37. Redford, A.J.; Bowers, R.M.; Knight, R.; Linhart, Y.; Fierer, N. The ecology of the phyllosphere: Geographic and phylogenetic variability in the distribution of bacteria on tree leaves. Environ. Microbiol. 2010, 12, 2885–2893. [Google Scholar] [CrossRef]
  38. Laforest-Lapointe, I.; Messier, C.; Kembel, S.W. Tree leaf bacterial community structure and diversity differ along a gradient of urban intensity. MSystems 2017, 2, 16. [Google Scholar] [CrossRef]
  39. Bolger, A.M.; Lohse, M.; Usadel, B. Trimmomatic: A flexible trimmer for Illumina sequence data. Bioinformatics 2014, 30, 2114–2120. [Google Scholar] [CrossRef]
  40. Magoč, T.; Salzberg, S.L. FLASH: Fast length adjustment of short reads to improve genome assemblies. Bioinformatics 2011, 27, 2957–2963. [Google Scholar] [CrossRef]
  41. Kozich, J.J.; Westcott, S.L.; Baxter, N.T.; Highlander, S.K.; Schloss, P.D. Development of a Dual-Index Sequencing Strategy and Curation Pipeline for Analyzing Amplicon Sequence Data on the MiSeq Illumina Sequencing Platform. Appl. Environ. Microbiol. 2013, 79, 5112–5120. [Google Scholar] [CrossRef] [PubMed] [Green Version]
  42. Kunin, V.; Engelbrektson, A.; Ochman, H.; Hugenholtz, P. Wrinkles in the rare biosphere: Pyrosequencing errors can lead to artificial inflation of diversity estimates. Environ. Microbiol. 2010, 12, 118–123. [Google Scholar] [CrossRef] [PubMed]
  43. Schloss, P.D. The Effects of Alignment Quality, Distance Calculation Method, Sequence Filtering, and Region on the Analysis of 16S rRNA Gene-Based Studies. PLoS Comput. Biol. 2010, 6, e1000844. [Google Scholar] [CrossRef] [PubMed]
  44. Edgar, R.C.; Haas, B.J.; Clemente, J.C.; Quince, C.; Knight, R. UCHIME improves sensitivity and speed of chimera detection. Bioinformatics 2011, 27, 2194–2200. [Google Scholar] [CrossRef] [PubMed] [Green Version]
  45. Wang, Q.; Garrity, G.M.; Tiedje, J.M.; Cole, J.R. Naïve Bayesian classifier for rapid assignment of rRNA sequences into the new bacterial taxonomy. Appl. Environ. Microbiol. 2007, 73, 5261–5267. [Google Scholar] [CrossRef] [PubMed]
  46. Schloss, P.D.; Westcott, S.L.; Ryabin, T.; Hall, J.R.; Hartmann, M.; Hollister, E.B.; Lesniewski, R.A.; Oakley, B.B.; Parks, D.H.; Robinson, C.J.; et al. Introducing mothur: Open-source, platform-independent, community-supported software for describing and comparing microbial communities. Appl. Environ. Microbiol. 2009, 75, 7537–7541. [Google Scholar] [CrossRef] [PubMed]
  47. Bokulich, N.A.; Subramanian, S.; Faith, J.J.; Gevers, D.; Gordon, J.I.; Knight, R.; Mills, D.A.; Caporaso, J.G. Quality-filtering vastly improves diversity estimates from Illumina amplicon sequencing. Nat. Methods 2013, 10, 57–59. [Google Scholar] [CrossRef] [PubMed]
  48. Price, M.N.; Dehal, P.S.; Arkin, A.P. FastTree: Computing large minimum evolution trees with profiles instead of a distance matrix. Mol. Biol. Evol. 2009, 26, 1641–1650. [Google Scholar] [CrossRef]
  49. Gong, J.; Shi, F.; Ma, B.; Dong, J.; Pachiadaki, M.; Zhang, X.; Edgcomb, V.P. Depth shapes alpha- and beta-diversities of microbial eukaryotes in surficial sediments of coastal ecosystems. Environ. Microbiol. 2015, 17, 3722–3737. [Google Scholar] [CrossRef]
  50. Jiao, S.; Luo, Y.T.; Lu, M.M.; Xiao, X.; Lin, Y.B.; Chen, W.M.; Wei, G.H. Distinct succession patterns of abundant and rare bacteria in temporal microcosms with pollutants. Environ. Pollut. 2017, 225, 497–505. [Google Scholar] [CrossRef]
  51. Liu, L.; Yang, J.; Yu, Z.; Wilkinson, D.M. The biogeography of abundant and rare bacterioplankton in the lakes and reservoirs of China. ISME J. 2015, 9, 2068–2077. [Google Scholar] [CrossRef] [PubMed]
  52. Lozupone, C.; Knight, R. UniFrac: A new phylogenetic method for comparing microbial communities. Appl. Environ. Microbiol. 2005, 71, 8228–8235. [Google Scholar] [CrossRef] [PubMed]
  53. R Core Team. R: A Language and Environment for Statistical Computing; R Foundation for Statistical Computing: Vienna, Austria, 2017; Available online: https://www.R-project.org/ (accessed on 13 April 2019).
  54. Deng, W.K.; Wang, Y.B.; Liu, Z.X.; Cheng, H.; Xue, Y. HemI: A toolkit for illustrating heatmaps. PLoS ONE 2014, 9, e111988. [Google Scholar] [CrossRef] [PubMed]
  55. Dixon, P. VEGAN, a package of R functions for community ecology. J. Veg. Sci. 2003, 14, 927–930. [Google Scholar] [CrossRef]
  56. Stegen, J.C.; Lin, X.J.; Konopka, A.E.; Fredrickson, J.K. Stochastic and deterministic assembly processes in subsurface microbial communities. ISME J. 2012, 6, 1653–1664. [Google Scholar] [CrossRef] [Green Version]
  57. Webb, C.O.; Ackerly, D.D.; McPeek, M.A.; Donoghue, M.J. Phylogenies and community ecology. Annu. Rev. Ecol. Syst. 2002, 33, 475–505. [Google Scholar] [CrossRef]
  58. Kembel, S.W.; Cowan, P.D.; Helmus, M.R.; Cornwell, W.K.; Morlon, H.; Ackerly, D.D.; Blomberg, S.P.; Webb, C.O. Picante: R tools for integrating phylogenies and ecology. Bioinformatics 2010, 26, 1463–1464. [Google Scholar] [CrossRef] [Green Version]
  59. Wang, J.J.; Soininen, J.; He, J.Z.; Shen, J. Phylogenetic clustering increases with elevation for microbes. Environ. Microbiol. Rep. 2012, 4, 217–226. [Google Scholar] [CrossRef]
  60. Fine, P.V.A.; Kembel, S.W. Phylogenetic community structure and phylogenetic turnover across space and edaphic gradients in western Amazonian tree communities. Ecography 2011, 34, 552–565. [Google Scholar] [CrossRef]
  61. Zhou, J.Z.; Ning, D.L. Stochastic community assembly: Does it matter in microbial ecology? Microbiol. Mol. Biol. Rev. 2017, 81. [Google Scholar] [CrossRef]
  62. Hardy, O.J. Testing the spatial phylogenetic structure of local communities: Statistical performances of different null models and test statistics on a locally neutral community. J. Ecol. 2008, 96, 914–926. [Google Scholar] [CrossRef]
  63. Stegen, J.C.; Lin, X.J.; Fredrickson, J.K.; Chen, X.Y.; Kennedy, D.W.; Murray, C.J.; Rockhold, M.L.; Konopka, A. Quantifying community assembly processes and identifying features that impose them. ISME J. 2013, 7, 2069–2079. [Google Scholar] [CrossRef] [PubMed]
  64. Garcia, J.; Kao-Kniffin, J. Microbial group dynamics in plant rhizospheres and their implications on nutrient cycling. Front. Microbiol. 2018, 9, 1516. [Google Scholar] [CrossRef] [PubMed]
  65. Lindow, S.E.; Brandl, M.T. Microbiology of the phyllosphere. Appl. Environ. Microbiol. 2003, 69, 1875–1883. [Google Scholar] [CrossRef] [PubMed]
  66. Fahlgren, C.; Hagstrom, A.; Nilsson, D.; Zweifel, U.L. Annual variations in the diversity, viability, and origin of airborne bacteria. Appl. Environ. Microbiol. 2010, 76, 3015–3025. [Google Scholar] [CrossRef] [PubMed]
  67. Harrison, R.M.; Jones, A.M.; Biggins, P.D.E.; Pomeroy, N.; Cox, C.S.; Kidd, S.P.; Hobman, J.L.; Brown, N.L.; Beswick, A. Climate factors influencing bacterial count in background air samples. Int. J. Biometeorol. 2005, 49, 167–178. [Google Scholar] [CrossRef]
  68. Maron, P.A.; Lejon, D.P.H.; Carvalho, E.; Bizet, K.; Lemanceau, P.; Ranjard, L.; Mougel, C. Assessing genetic structure and diversity of airborne bacterial communities by DNA fingerprinting and 16S rDNA clone library. Atmos. Environ. 2005, 39, 3687–3695. [Google Scholar] [CrossRef]
  69. Whitman, W.B.; Coleman, D.C.; Wiebe, W.J. Prokaryotes: The unseen majority. Proc. Natl. Acad. Sci. USA 1998, 95, 6578–6583. [Google Scholar] [CrossRef] [Green Version]
  70. Gibbons, N.; Murray, R. Proposals concerning the higher taxa of bacteria. Int. J. Syst. Evol. Microbiol. 1978, 28, 1–6. [Google Scholar] [CrossRef]
  71. Hummel, A.S.; Hertel, C.; Holzapfel, W.H.; Franz, C.M. Antibiotic resistances of starter and probiotic strains of lactic acid bacteria. Appl. Environ. Microbiol. 2007, 73, 730–739. [Google Scholar] [CrossRef]
  72. Mathur, S.; Singh, R. Antibiotic resistance in food lactic acid bacteria—A review. Int. J. Food Microbiol. 2005, 105, 281–295. [Google Scholar] [CrossRef]
  73. Zhou, S.Y.D.; Zhu, D.; Giles, M.; Yang, X.R.; Daniell, T.; Neilson, R.; Zhu, Y.G. Phyllosphere of staple crops under pig manure fertilization, a reservoir of antibiotic resistance genes. Environ. Pollut. 2019, 252, 227–235. [Google Scholar] [CrossRef] [PubMed]
  74. Albuquerque, L.; Franca, L.; Rainey, F.A.; Schumann, P.; Nobre, M.F.; da Costa, M.S. Gaiella occulta gen. nov., sp. nov., a novel representative of a deep branching phylogenetic lineage within the class Actinobacteria and proposal of Gaiellaceae fam. nov. and Gaiellales ord. nov. Syst. Appl. Microbiol. 2011, 34, 595–599. [Google Scholar] [CrossRef] [PubMed]
  75. Novello, G.; Gamalero, E.; Bona, E.; Boatti, L.; Mignone, F.; Massa, N.; Cesaro, P.; Lingua, G.; Berta, G. The Rhizosphere Bacterial Microbiota of Vitis vinifera cv. Pinot Noir in an Integrated Pest Management Vineyard. Front. Microbiol. 2017, 8, 1528. [Google Scholar] [CrossRef] [PubMed]
  76. Severino, R.; Froufe, H.J.C.; Barroso, C.; Albuquerque, L.; Lobo-da-Cunha, A.; da Costa, M.S.; Egas, C. High-quality draft genome sequence of Gaiella occulta isolated from a 150 m deep mineral water borehole and comparison with the genome sequences of other deep-branching lineages of the phylum Actinobacteria. MicrobiologyOpen 2019, e840. [Google Scholar] [CrossRef] [PubMed]
  77. Vreeland, R.H.; Anderson, R.; Murray, R.G. Cell wall and phospholipid composition and their contribution to the salt tolerance of Halomonas elongata. J. Bacteriol. 1984, 160, 879–883. [Google Scholar] [CrossRef] [PubMed]
  78. Mata, J.A.; Martinez-Canovas, J.; Quesada, E.; Bejar, V. A detailed phenotypic characterisation of the type strains of Halomonas species. Syst. Appl. Microbiol. 2002, 25, 360–375. [Google Scholar] [CrossRef]
  79. Finkel, O.M.; Burch, A.Y.; Lindow, S.E.; Post, A.F.; Belkin, S. Geographical Location Determines the Population Structure in Phyllosphere Microbial Communities of a Salt-Excreting Desert Tree. Appl. Environ. Microbiol. 2011, 77, 7647–7655. [Google Scholar] [CrossRef] [Green Version]
  80. Bond, D.R.; Lovley, D.R. Electricity production by Geobacter sulfurreducens attached to electrodes. Appl. Environ. Microbiol. 2003, 69, 1548–1555. [Google Scholar] [CrossRef]
  81. Childers, S.E.; Ciufo, S.; Lovley, D.R. Geobacter metallireducens accesses insoluble Fe(III) oxide by chemotaxis. Nature 2002, 416, 767–769. [Google Scholar] [CrossRef]
  82. Hambright, K.D.; Beyer, J.E.; Easton, J.D.; Zamor, R.M.; Easton, A.C.; Hallidayschult, T.C. The niche of an invasive marine microbe in a subtropical freshwater impoundment. ISME J. 2015, 9, 256–264. [Google Scholar] [CrossRef] [PubMed]
  83. Dini-Andreote, F.; de Cássia Pereira e Silva, M.; Triadó-Margarit, X.; Casamayor, E.O.; van Elsas, J.D.; Salles, J.F. Dynamics of bacterial community succession in a salt marsh chronosequence: Evidences for temporal niche partitioning. ISME J. 2014, 8, 1989–2001. [Google Scholar] [CrossRef] [PubMed]
  84. Orrock, J.L.; Watling, J.I. Local community size mediates ecological drift and competition in metacommunities. Proc. R. Soc. B Biol. Sci. 2010, 277, 2185–2191. [Google Scholar] [CrossRef] [PubMed] [Green Version]
  85. Kragelund, C.; Levantesi, C.; Borger, A.; Thelen, K.; Eikelboom, D.; Tandoi, V.; Kong, Y.H.; van der Waarde, J.; Krooneman, J.; Rossetti, S.; et al. Identity, abundance and ecophysiology of filamentous Chloroflexi species present in activated sludge treatment plants. FEMS Microbiol. Ecol. 2007, 59, 671–682. [Google Scholar] [CrossRef] [PubMed]
  86. Chase, J.M. Drought mediates the importance of stochastic community assembly. Proc. Natl. Acad. Sci. USA 2007, 104, 17430–17434. [Google Scholar] [CrossRef] [PubMed] [Green Version]
  87. Jiang, L.; Patel, S.N. Community assembly in the presence of disturbance: A microcosm experiment. Ecology 2008, 89, 1931–1940. [Google Scholar] [CrossRef]
Figure 1. Comparisons of operating taxonomic units (OTU) richness and Faith’s phylogenetic diversity (PD) of bacterial communities in different epiphytic compartments of Phragmitas australis. (a) All, whole bacteria taxa; (b) Abundant, abundant bacteria taxa; (c) Rare, rare bacteria taxa. The top and bottom boundaries of each box indicate the third and first quartile values, respectively, and lines within each box represent the median values, whiskers show 95% range, and points are outliers. ***, indicates significant differences among different groups (p < 0.001, n = 12 for each group) according to two-tailed independent-sample t-test. RAT, rhizosphere abundant taxa; PAT, phyllosphere abundant taxa; RRT, rhizosphere rare taxa; PRT, phyllosphere rare taxa.
Diversity 11 00098 g001
Figure 2. Comparisons of beta-diversity in different epiphytic compartments. (a) All, whole bacteria taxa; (b) Abundant & Rare, abundant bacteria taxa and rare bacteria taxa. Left, Non-metric multidimensional scaling (NMDS) ordination of bacterial communities based on unweighted Unifrac distance (phylogeny dissimilarity). Right, the pairwise unweighted Unifrac dissimilarity of bacterial communities between different epiphytic compartments. The top and bottom boundaries of each box indicate the third and first quartile values, respectively, and lines within each box represent the median values, whiskers show 95% range, and points are outliers. ***, indicate significant differences among different groups (n = 12 for each group) (two-tailed independent-sample t-test, ***, p < 0.001; ns, no significance). RAT, rhizosphere abundant taxa; PAT, phyllosphere abundant taxa; RRT, rhizosphere rare taxa; PRT, phyllosphere rare taxa.
Diversity 11 00098 g002
Figure 3. Relative abundance of dominant bacterial communities at the level of phyla/subphyla in different epiphytic compartments. (a) All, whole bacteria taxa; (b) Abundant, abundant bacteria taxa; (c) Rare, rare bacteria taxa. Only phyla/subphyla with relative abundance > 1.0% were shown, and phyla with relative abundance < 1% were designated as minor. Stars indicate significant differences between rhizosphere and phyllosphere (n = 12 for each group) (two-tailed independent-sample t-test, *, p < 0.05; **, p < 0.01; ***, p < 0.001; ns, no significance). RAT, rhizosphere abundant taxa; PAT, phyllosphere abundant taxa; RRT, rhizosphere rare taxa; PRT, phyllosphere rare taxa.
Diversity 11 00098 g003
Figure 4. Venn diagram showing the numbers of unique and shared operating taxonomic units (OTUs) across different groups. (a) All, whole bacteria taxa; (b) Abundant, abundant bacteria taxa; (c) Rare, rare bacteria taxa. RAT, rhizosphere abundant taxa; PAT, phyllosphere abundant taxa; RRT, rhizosphere rare taxa; PRT, phyllosphere rare taxa.
Diversity 11 00098 g004
Figure 5. Phylogenetic structure of bacterial communities associated with rhizosphere and phyllosphere of Phragmitas australis based on null model analysis. (a) Comparisons of the standardized effect size of the mean nearest taxon distance (ses.MNTD). The top and bottom boundaries of each box indicate the third and first quartile values, respectively, and lines within each box represent the median values, whiskers show 95% range, and points are outliers; ns, means no significant differences among different groups (n = 12 for each group) according to two-tailed independent-sample t-test. (b) Distribution of beta nearest taxon index (betaNTI). Positive (negative) betaNTI value represents greater (less) than excepted turnover in phylogenetic composition. The horizontal dotted gray line (above +2 or below −2 are statistically significant) shows the 95% confidence intervals around the expectation under neutral community assembly.
Diversity 11 00098 g005

