Article

Recent Trends in Research on the Genetic Diversity of Plants: Implications for Conservation

by
Yasmin G. S. Carvalho
1,
Luciana C. Vitorino
1,*,
Ueric J. B. de Souza
2,3 and
Layara A. Bessa
1
1
Laboratory of Plant Mineral Nutrition, Instituto Federal Goiano campus Rio Verde, Rodovia Sul Goiana, km 01, Zona Rural, Rio Verde, GO 75901-970, Brazil
2
Laboratory of Genetics and Biodiversity, Instituto de Ciências Biológicas, Universidade Federal de Goiás—UFG, Avenida Esperança s/n, campus Samambaia, Goiânia, GO 74690-900, Brazil
3
National Institute for Science and Technology in Ecology, Evolution and Conservation of Biodiversity, Universidade Federal de Goiás, Goiânia, GO 74690-900, Brazil
*
Author to whom correspondence should be addressed.
Diversity 2019, 11(4), 62; https://doi.org/10.3390/d11040062
Submission received: 21 March 2019 / Revised: 15 April 2019 / Accepted: 16 April 2019 / Published: 18 April 2019

Abstract

:
Genetic diversity and its distribution, both within and between populations, may be determined by micro-evolutionary processes, such as the demographic history of populations, natural selection, and gene flow. In plants, indices of genetic diversity (e.g., k, h and π) and structure (e.g., FST) are typically inferred from sequences of chloroplast markers. Given the recent advances and popularization of molecular techniques for research in population genetics, phylogenetics, phylogeography, and ecology, we adopted a scientometric approach to compile evidence on the recent trends in the use of cpDNA sequences as markers for the analysis of genetic diversity in botanical studies, over the years. We also used phylogenetic modeling to assess the relative contribution of relatedness or ecological and reproductive characters to the genetic diversity of plants. We postulated that genetic diversity could be defined not only by microevolutionary factors and life history traits, but also by relatedness, so that species more closely related phylogenetically would have similar genetic diversities. We found a clear tendency for an increase in the number of studies over time, confirming the hypothesis that the advances in the area of molecular genetics have supported the accumulation of data on the genetic diversity of plants. However, we found that the vast majority of these data have been produced by Chinese authors, and refer specifically to populations of Chinese plants. Most of the data on genetic diversity have been obtained for species in the International Union for Conservation of Nature (IUCN) category NE (Not Evaluated), which indicates a relative lack of attention on threatened species. In general, we observed very high FST values in the groups analyzed and, as we focused primarily on species that have not been evaluated by the IUCN, the number of plant species that are threatened with extinction may be much greater than that indicated by the listing of this organization. We also found that the number of haplotypes (k) was influenced by the type of geographic distribution of the plant, while haplotype diversity (h) was affected by the type of flower, and the fixation index (FST), by the type of habitat. The plant species most closely-related phylogenetically have similar levels of genetic diversity. Overall, then, it will important to consider phylogenetic dependence in future studies that evaluate the effects of life-history traits on plant genetic diversity.

Graphical Abstract

1. Introduction

Genetic diversity can be defined as any quantitative measure of the variability of a population, which reflects the equilibrium between mutation and the loss of genetic variation [1,2]. The development of molecular markers for plants, initially isoenzymes (e.g., [3]), provided access to the genetic variability found in the accessions, which was useful for characterizing the germoplasm and for genetic improvement, based on specific markers [4]. Given their genetic link, DNA markers can be used to detect allelic variation in the genes underlying the target characteristics [5].
Following the popularization and modernization of laboratory techniques for the analysis of genetic markers [6], primers developed for the detection of variability in accessions of plants of agricultural value have gradually been transferred to plants of ecological interest (e.g., [7,8,9,10,11]). With this, indices of genetic diversity (e.g., the number of alleles, number of haplotypes—k, haplotype diversity—h, nucleotide diversity—π, observed and expected heterozygosity—HO and HE) and population structuring, such as FST [12,13], RST, GST and ϴST, have been applied increasingly in other areas, such as phylogenetics, phylogeography, biogeography, molecular ecology, ecological genetics, genetic geography, and landscape genetics [14]. In plants, chloroplast DNA (cpDNA) markers predominate, especially in ecological studies.
In most angiosperms, the cpDNA is inherited through the maternal lineage, has a low mutation rate, and is rarely subject to recombination [15,16,17]. Estimates of genetic diversity based on cpDNA sequences can be used to provide inferences on the evolutionary history of plant species, including possible recolonization routes, diversification events, and gene flow [18,19,20]. This approach has been used not only to analyze ecologically important species, such as those with a high degree of endemism [21], but also medicinal plants [22], and those with commercial potential [23].
Some of the technology now available, such as New Generation Sequencing (NGS), has permitted the accumulation of large quantities of molecular data through the analysis of marker regions [24], making estimates of genetic diversity increasingly robust. In recent years, in fact, there have been enormous advances in the speed of analyses, the duration of readings and transfer rates, together with a dramatic reduction in the costs per base analyzed [25]. The advent and evolution of these techniques has led to an increase in the number of publications, and a progressive expansion in related areas, in particular those with an ecological perspective. Some studies, such as that of Souza et al. [26], have evaluated the tendencies in the scientific literature on plant population genetics, although, in this specific case, the study focused only on species from the Brazilian Cerrado savanna. Given this, we decided to test the hypothesis that the popularization of molecular techniques has supported a general tendency for an increasing number of publications that use cpDNA sequences to obtain estimates of genetic diversity in plants. We used a scientometric approach to collect data and provide evidence on the propensities of the use of these markers in botanical studies over time.
In the studies in which the genetic diversity or variation in plants is the principal focus, ecological or reproductive characteristics are rarely dealt with explicitly, and in most cases, the study only elucidates the fact that the principal factor determining the loss of genetic diversity is the reduction in effective population size caused by habitat fragmentation. This fragmentation reduces populations to small isolates, which are subject to increasing genetic drift and inbreeding, and reduced gene flow [27]. However, life-history traits, such as pollination and seed dispersal modes have received little attention in terms of their potential contribution to the loss of genetic diversity. Ballesteros-Mejia et al. [28] used the phylogenetic generalized least squares (PGLS) approach to explain the phylogenetic independence of the predictor variables and verify the robustness of the results of generalized linear models (GLMs) that confirmed the effects of the pollination mode and breeding system on the patterns of genetic differentiation in Neotropical plant species. A number of other studies [29,30,31,32] have attempted to relate genetic diversity to the life history traits of the plant, although as the data are not normally distributed, in general, they have either been transformed for the application of an analysis of variance (ANOVA) or a GLM has been applied. These studies have thus overlooked the phylogenetic relationships among the species analyzed, although other research has shown that all the species in a monophyletic group, that is, species that share a common ancestor, tend to be more similar to one another than species selected at random from a phylogenetic tree, and cannot be considered to be independent data points in statistical analyses [33,34].
Given these considerations, we investigated the relative influence of phylogenetic relationships and ecological or reproductive traits on the genetic diversity of plants. We test the hypothesis that genetic diversity may be determined not only by micro-evolutionary factors and life history traits, but also by the phylogenetic relationships of the species, with more closely-related species having more similar genetic characteristics. To this end, we (i) verified the number of scientific papers that report on studies using cpDNA markers to investigate plant genetic diversity, and the nationality of the authors that publish most in this field, (ii) identified the plant species and families that were the subject of most studies, and recorded their ecological and reproductive characteristics, and (iii) related the data on the life history of the species to the published estimates of genetic diversity and structure, and demonstrate the importance of phylogeny for studies that relate life history traits to genetic diversity in plants.

2. Methods

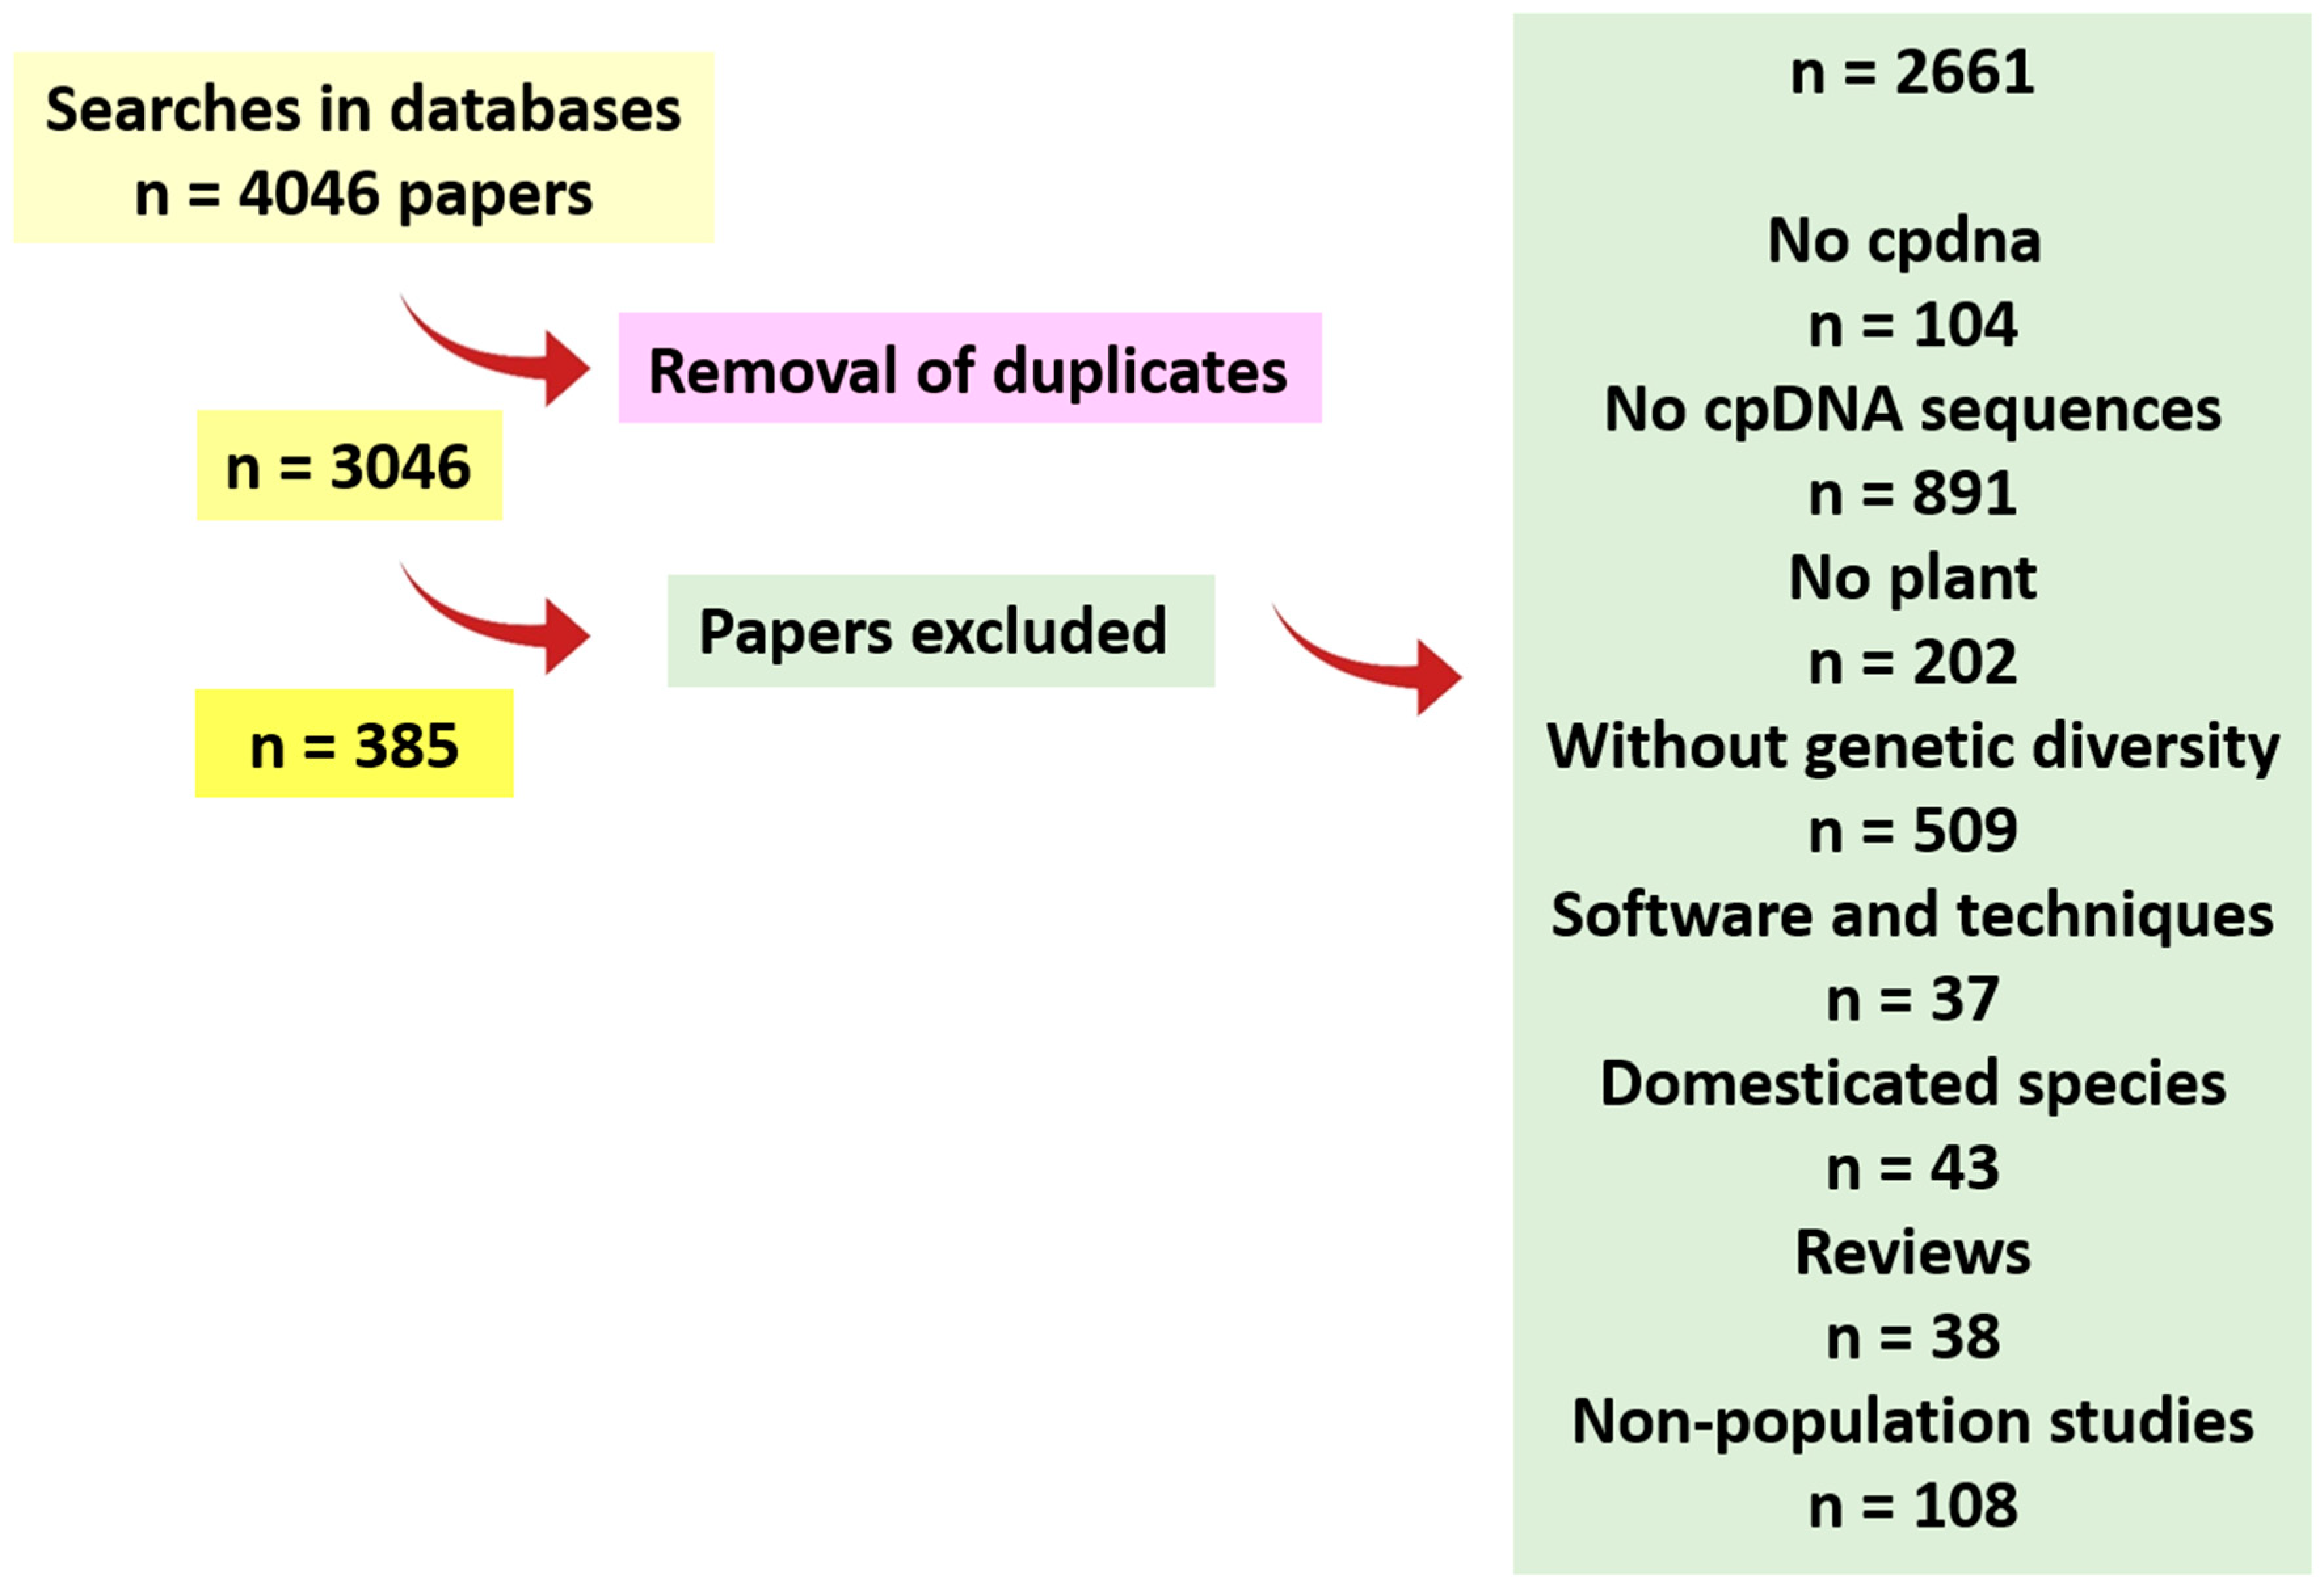
2.1. Scientometric Data

To evaluate tendencies in the publications on plant genetics, the “Web of Science”, “Scopus”, and “Pubmed” databases were searched using the key words: [cpDNA* AND genetic diversity*]; [chloroplast DNA* AND genetic diversity*]. The search was limited only by topics, and ran until the end of March, 2018.
The papers identified in this search were reviewed to identify and exclude all those that (i) did not employ cpDNA markers (but only referred to the cpDNA), (ii) focused on organisms other than plants (i.e., animals, microorganisms, and algae, except green algae), (iii) focused on molecular markers linked to the cpDNA, but were not cpDNA sequences per se, i.e., microsatellites or Simple Sequence Repeats (SSRs), Restriction Fragment Length Polymorphisms (RFLPs), Randomly Amplified Polymorphic DNA (RAPD), Amplified Fragment Length Polymorphisms (AFLPs), Single Nucleotide Polymorphisms (SNPs) or Polymerase Chain Reaction, associated with the DNA Fragment Polymorphism obtained by Restriction Enzymes (PCR-RFLP), (iv) reported on the development of software and/or techniques, (v) reported on the development or analysis of proteins or (vi) used the cpDNA for the analysis of phenomena other than genetic diversity. All other papers were included in the analysis.
The following information was compiled from each of the papers selected for analysis: (i) year of publication, (ii) journal, (iii) impact factor (Journal Citation Reports - JCR), (iv) number of citations (Web of Science), (v) nationality of the corresponding author, (vi) geographic study area, (vii) plant family, (viii) number of haplotypes (k), (ix) haplotype diversity (h), (x) nucleotide diversity (π), and (xi) genetic differentiation of populations (FST). For each study species, the following data were also compiled, based on the IUCN database (International Union for Conservation of Nature [35] and the scientific literature, for information on life history (ecological and reproductive) traits: (i) life form (tree, shrub, subshrub, epiphyte, herb, grass, vine), (ii) habitat (specialist or non-specialist), (iii) geographic distribution (ample or restricted), (iv) IUCN category (DD—Data Deficient, NE—Not Evaluated, LC—Least Concern, NT—Near Threatened, VU—Vulnerable, EN—Endangered, CR—Critically Endangered), (v) reproductive cycle (short cycle or perennial), (vi) type of flower (monoecious or dioecious), and (vii) type of pollinator (insect, wind, water).
To remove the effects of the general tendency for the number of papers to increase over time, the number of papers obtained in each year was divided by the total number of papers found in the Thomson-ISI database, and this value was multiplied by 106, following the approach of Souza et al. [26]. The growth in the number of publications was evaluated using linear regression models, as well as the residuals of these models, to analyze the number of papers published per year as a function of time.
The diversity of the journals was estimated using Shannon–Wiener’s diversity index [(H′ = −∑pi * Ln pi), (pi = ni/N)], where pi = the relative abundance of each journal, ni = the number of journals registered in the respective period, and N = the total number of journals. The mean impact factors of the papers published by the corresponding authors of different nationalities were compared using Tukey’s test (significance level of p = 0.05). This analysis was run only for the nationalities that had more than two publications. The analyses were run in the R environment [36].

2.2. Genetic Diversity versus Phylogeny, and Ecological and Reproductive Traits

As few data were obtained on the genetic diversity and other characteristics of gymnosperms, and these data were often incomplete, and only angiosperms were included in these analyses. To evaluate the phylogenetic effects of the ecological and reproductive characteristics of the species on their genetic diversity, we obtained a reference phylogeny for each species included in the analyses. These phylogenies were constructed using Phylomatic master tree R20160415, obtained from the Phylomatic platform, using the modern classification of the angiosperm phylogenetic groups (APG IV, [37,38]). As no information was available on the length of the branches, we attributed an arbitrary value of one in all cases, and this did not have any significant influence on the results [39]. This phylogeny was used as the explanatory variable to predict evolutionary traits (see [40]) in the phylogenetic modeling based on phylogenetic eigenvector maps (PEMs). The PEMs provides a robust phylogenetic signal for the analysis of the genetic diversity of the target species, and were produced in the MPSEM package [41] of the R environment, version 3.4.3.

3. Results

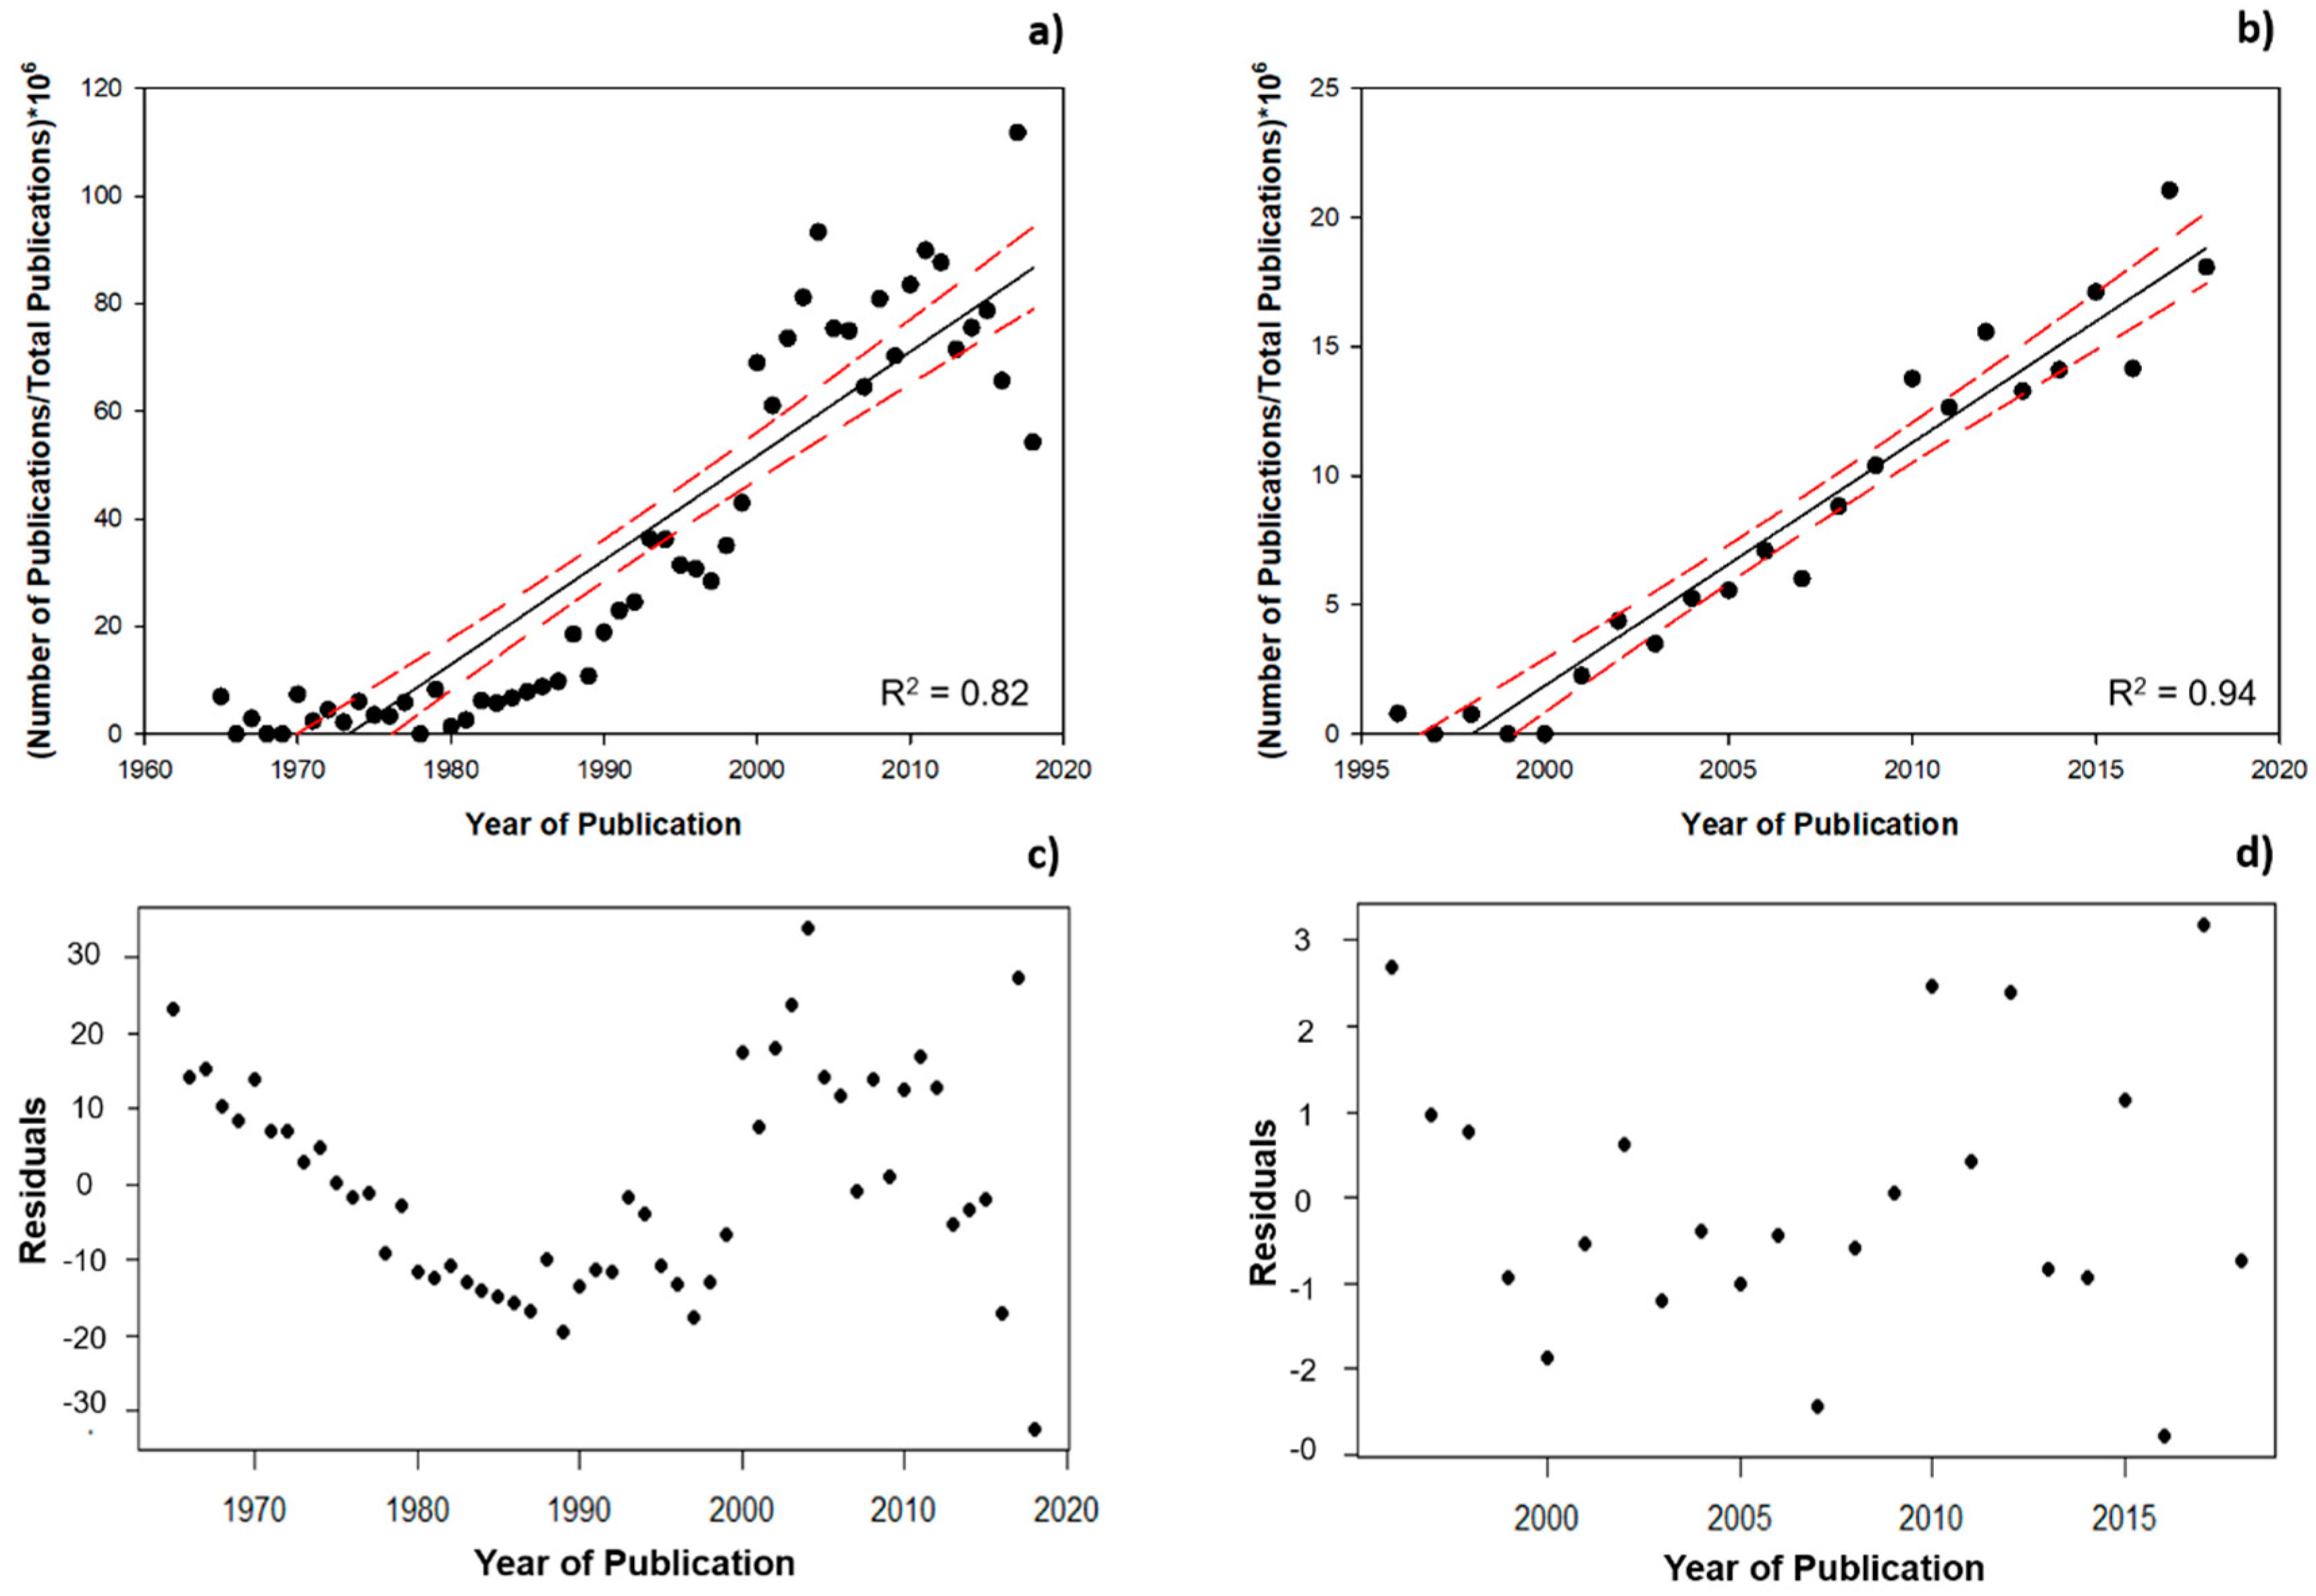
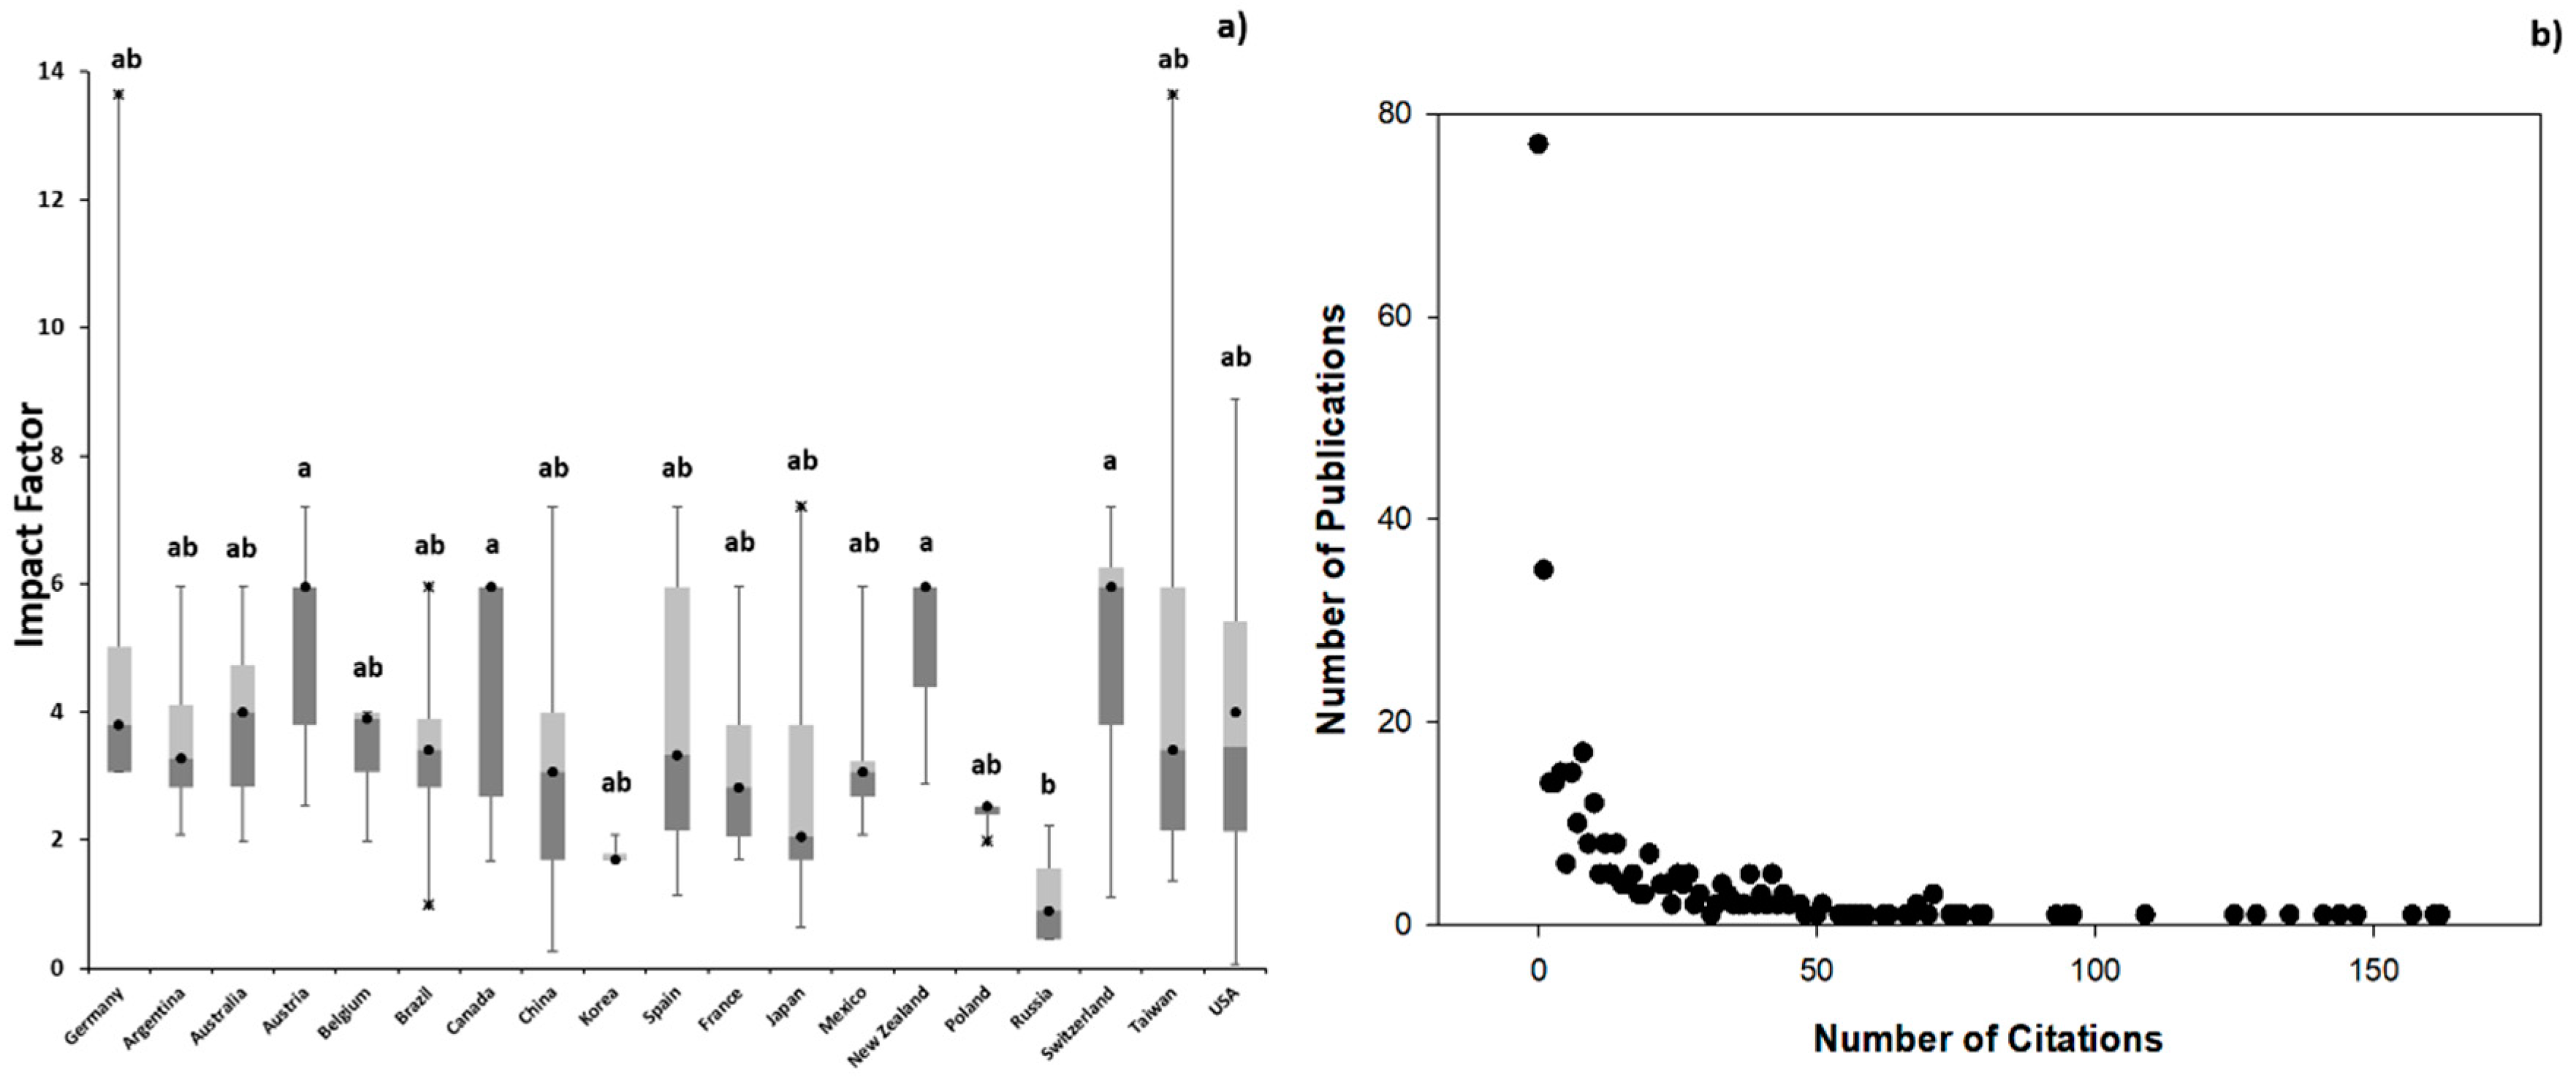
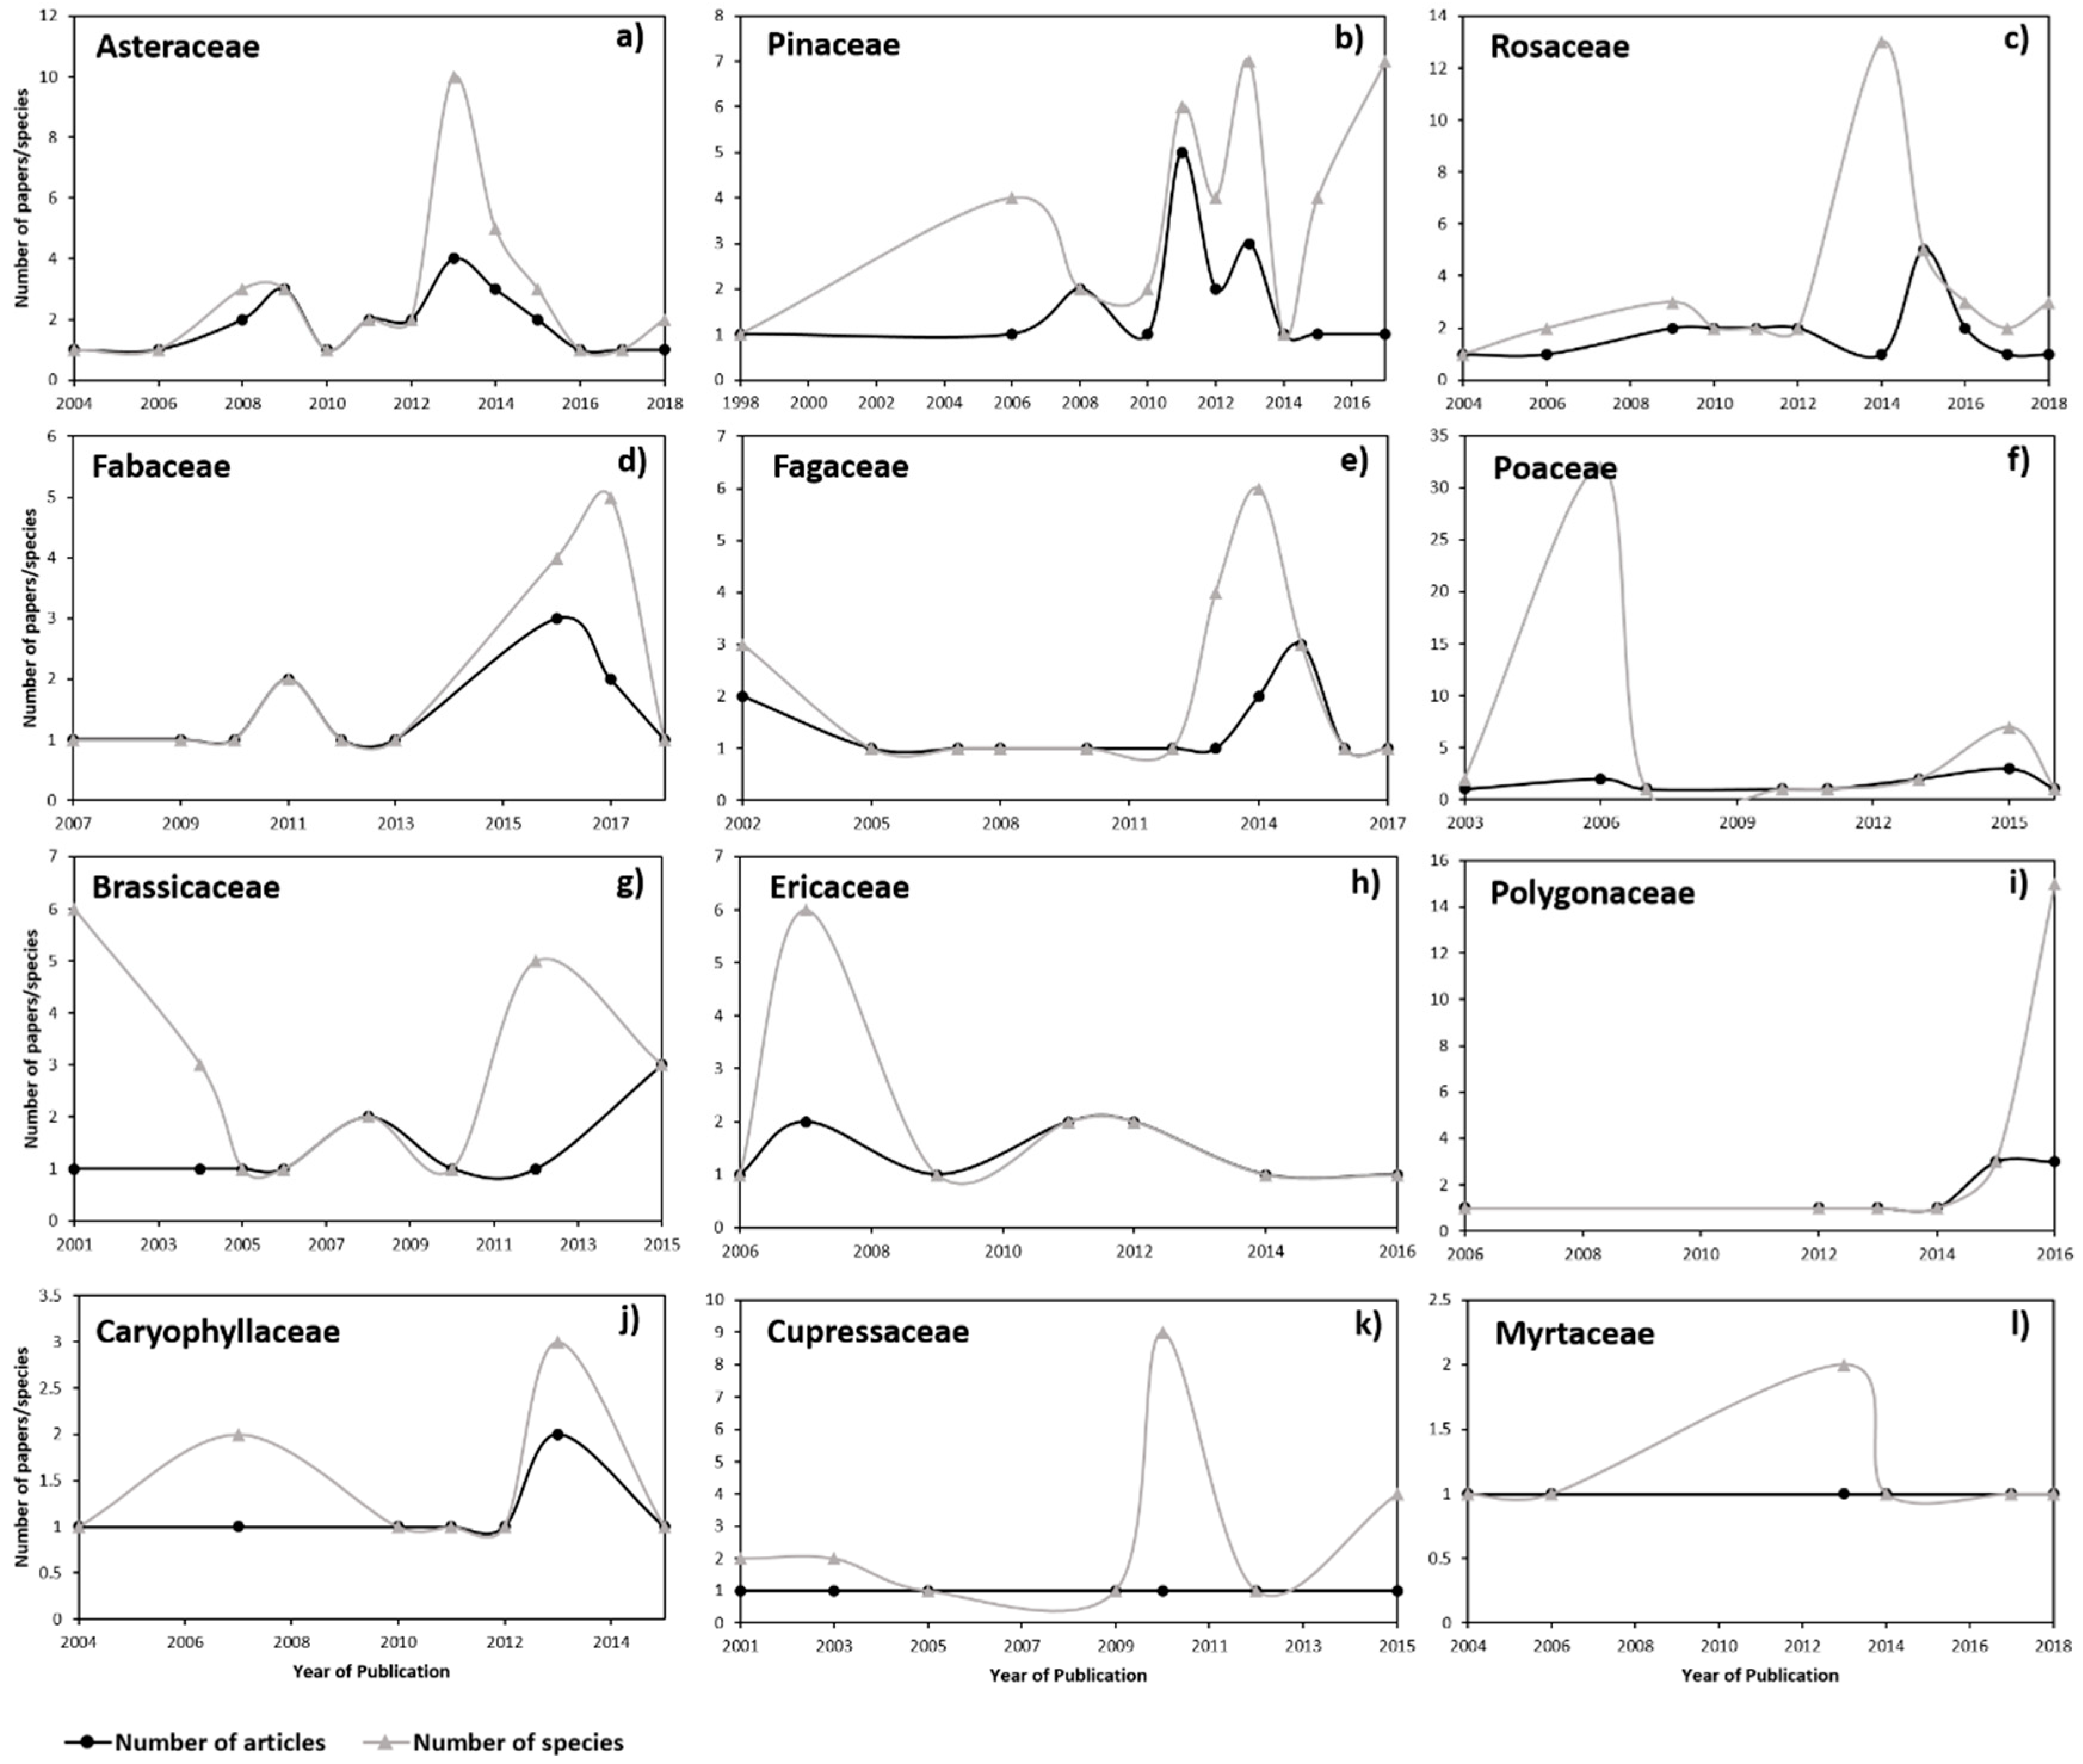
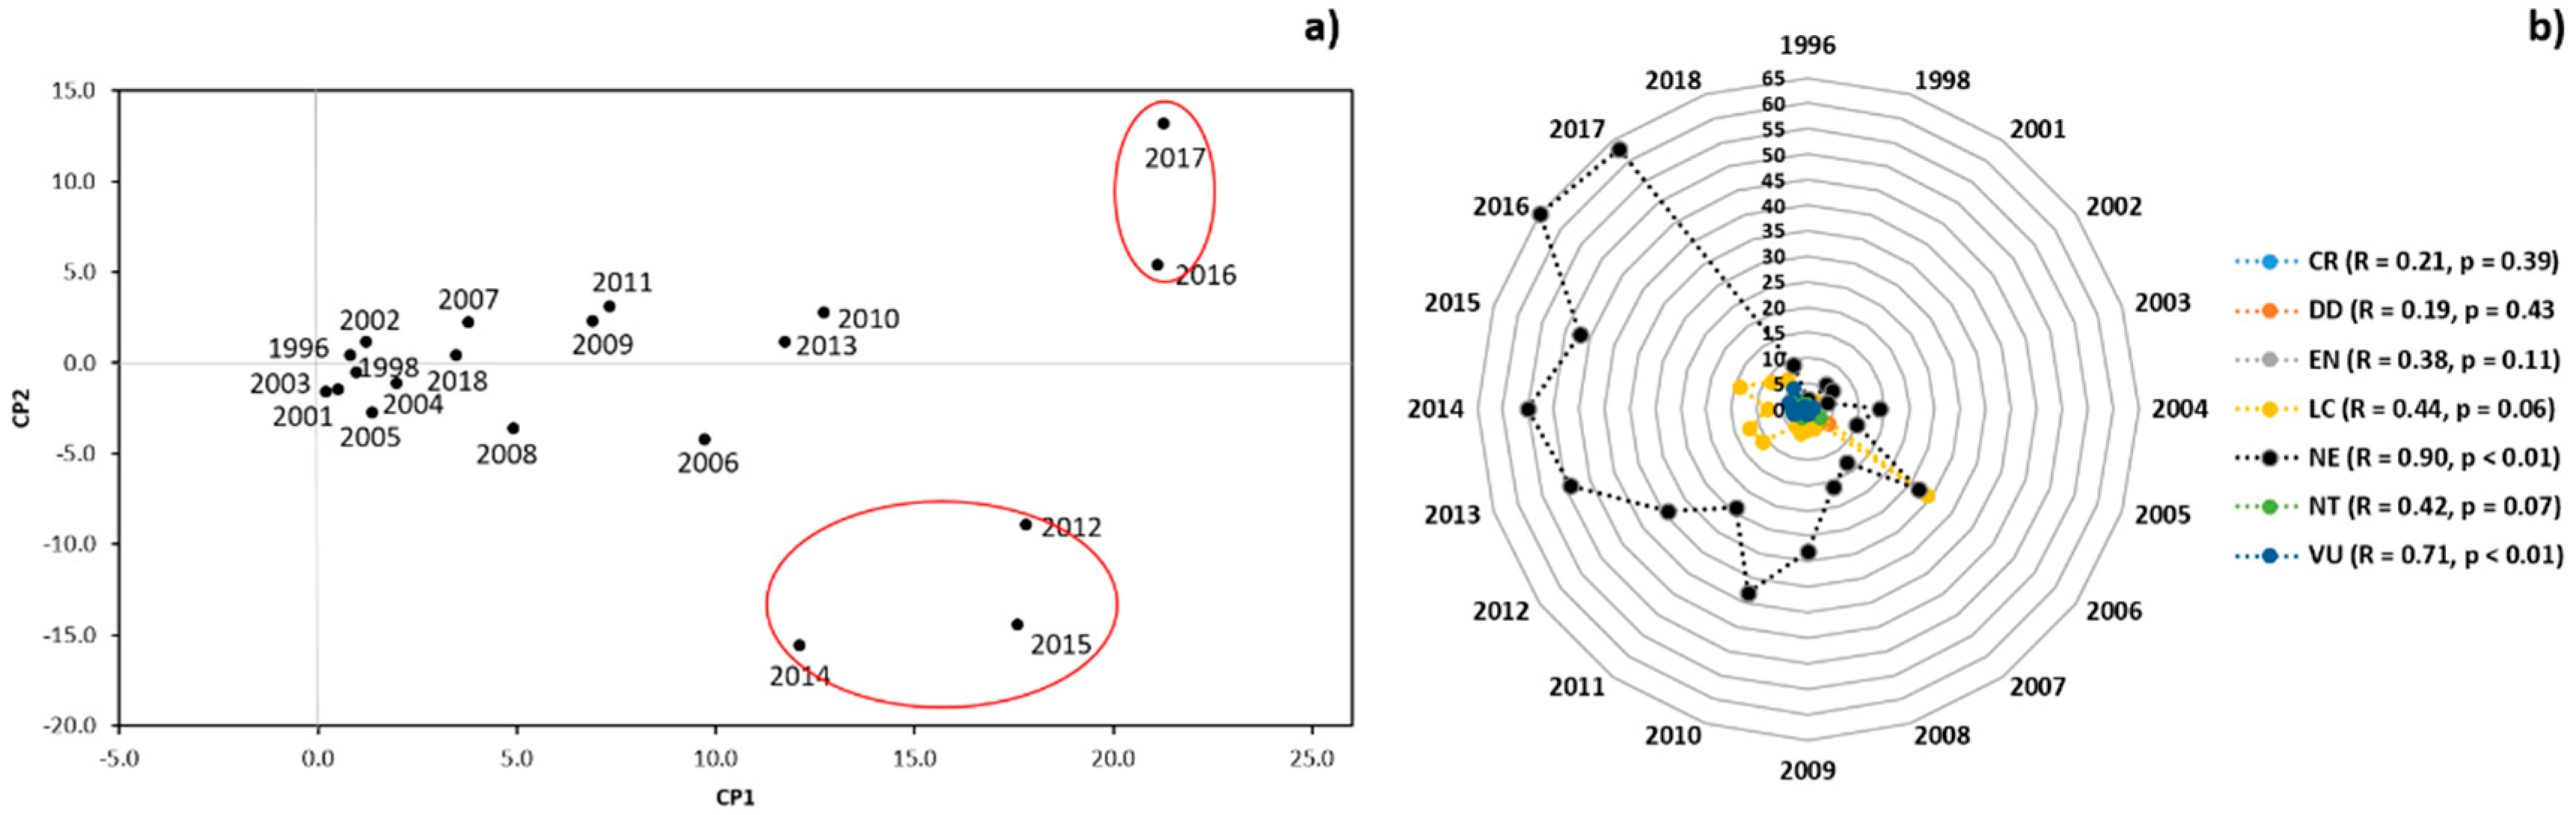
3.1. Scientometric Data

A total of 4046 scientific papers were identified in the three databases, although only 385 satisfied the selection criteria adopted in the initial review (Figure 1), and were included in the study. The earliest paper identified was published in 1996 and discusses the evolutionary biology and gene flow of populations of Aquilegia chrysantha and Aquilegia longissima, based on data on the trnL-trnF region of the chloroplast.
The number of publications involving the use of cpDNA sequences as markers tended to increase over time. This trend was confirmed by the significant adjustment of the linear regression model (Figure 2a), and was most apparent in the 1980s. In the 1960s and 1970s, the number of publications/total number of publications*106 was less than five per year, while the threshold of 20 publications per annum was reached only in the 1990s. When only the publications that used cpDNA markers to obtain estimates of genetic diversity are analyzed, there was a gradual increase in the number of papers published over time (Figure 2b). The adjustment of both data sets to the linear model is supported by the random distribution of the residuals (Figure 2c,d).
Overall, 21.82% of the publications that used cpDNA markers to estimate genetic diversity were indexed in all three databases searched (i.e., Pubmed, Scopus, and Web of Science). A larger percentage (34.53%) was indexed only in Pubmed, while 19.62% were found in either Scopus or the Web of Science. The remaining 24.03% were indexed simultaneously in the latter two databases.
The papers are distributed in 73 different journals, of which 35 published only a single paper (9.09% of all publications), with the other papers being divided among the remaining 38 journals. The largest number of papers (54, or 14.02% of the total) were published in Molecular Ecology (Figure S1a), with the first being published in 2001. The second journal that most published papers was Plos One, with 32 (8.32% of the total), with the first being published in 2011, and a further six in 2012. The diversity of journals in which papers that used cpDNA markers for the analysis of genetic diversity has increased significantly over time (Figure S1b).
The corresponding authors of the papers belonged to 49 different nationalities, although a majority (39.1%) were Chinese (Figure S2a), followed by Japanese (9.6%) and American (9.1%). Together, authors of these three countries contributed 57.8% of the papers published in this field of research.
The papers identified in the literature search referred to research in 171 different study areas, varying from a whole continent, such as North America, to countries and geographic features, including mountain ranges, peninsulas, and islands. Almost half (85, 49.71%) of these areas were targeted in only a single paper. Once again, three countries predominated the study areas, with China being the focal area in 21.1% of the papers, Japan in 6.1%, and the United States, in 4.7% (Figure S2b). Chinese authors analyzed primarily the genetic diversity of plants sampled in China. In addition to China and Japan, other Asian countries, such as Taiwan and Korea, were among the principal geographic areas targeted in the different studies.
The mean impact factor of the journals varied significantly (p < 0.0001) according to the nationality of the corresponding author (Figure 3a). The highest impact factors were recorded for authors from Switzerland (5.11), Canada (5.94), Austria (5.08), and New Zealand (4.90), while the lowest mean was recorded for authors from Russia (1.11).
Only 10 (2.61%) of the papers have been cited more than 100 times (Figure 3b), whereas 20.10% have never been cited in another published paper. The most cited papers are those of Jakob and Blatnner [42], with 162 citations, Wang et al. [43] with 161, Zhang et al. [44] with 157, and Anderson et al. [45], with 147. While all these papers are more than eight years old, no systematic relationship was found between the publication date and the number of citations.
Data were recorded on 639 species, representing 137 plant families and five groups (algae, bryophytes, pteridophytes, gymnosperms, and angiosperms). Of these species, 507 (in 118 families) were angiosperms (Table S1). The family with the largest number of study species (46) was the Poaceae, although these species were included in only 11 publications. The nest most diverse families were the Panacea and the Rosaceae, both with 38 species, targeted in 18 and 20 publications, respectively. These families were followed by the Asteraceae (35 species in 25 publications) and Fagaceae (23 species in 14 papers). Some of these more diverse families, such as the Asteraceae, Pinaceae, Rosaceae, Fabaceae, Fagaceae, Poaceae, and Polygonaceae, were related significantly with the increase in the number of publications over time (Figure 4).
There was a tendency for the number of plant families analyzed in the publications to increase over the years. This pattern was observed in the principal components analysis (Figure 5a), with papers published in recent years including many families that were not evaluated in the early studies. In addition, a number of families recurred in 2012, and in 2014–2017.
The IUCN category was not used as a criterion for the selection of study species, even though some categories (LC, NE, NT, and VU) were related significantly with the year of publication. There was a prevalence of species in the Not Evaluated (NE) category, followed by other, less restrictive categories, such as LC (Figure 5b).
The prevalence of studies on species in the Not Evaluated (NE) IUCN category was most accentuated in the years after 2006, peaking in 2016. Overall, the vast majority (81.66%) of the species were in the NE category, followed by LC (13.21%), VU and NT (1.58%), DD (1.38%), and EN (0.59%). A tendency was also observed for the studies to focus on species for which data on genetic diversity were not available, so that only 50 (7.84%) of the species registered here were targeted in more than one publication, in particular, Carpinus laxiflowera (Betulaceae), Dunnia sinensis (Rubiaceae), Euonymus oxyphyllus (Celastraceae), Leucomeris decora (Asteraceae), Nouelia insignis (Asteraceae), and Pseudotsuga menziesii (Pinaceae), which were each included in three studies. Only 27 angiosperm species were included in more than one publication, 24 in Asia, two in North America, and one in South America.
In the angiosperms, herbs were the life form most studied (43.00% of the total number of species), followed by trees (24.07%), shrubs (22.09%), grasses (9.27%), subshrubs (0.78%), vines (0.59%), and epiphytes, with 0.20% (Figure S3a). A majority of the species (62.13%) were classified as habitat specialists, while 35.50% were non-specialists, and 12 (2.37%) were not classified (Figure S3b). Just over half (54.24%) of the species have an ample geographic distribution, while 44.77% have a restricted distribution, and five (0.99%) lack reliable data (Figure S3c).
Just under half (48.52%) of the species were classified as perennials, and only 7.89% as short cycle, while a relatively large percentage (43.59%) were not classified (Figure S3d). The type of flower was not classified for the vast majority (83.63%) of species, while 12.82% were monoecious, and 3.55%, dioecious (Figure S3e). Similarly, no data were available on the pollinator of most species (84.02%), although 11.05% are known to be pollinated by insects, 4.73% by the wind, and 0.20% by water (Figure S3f).

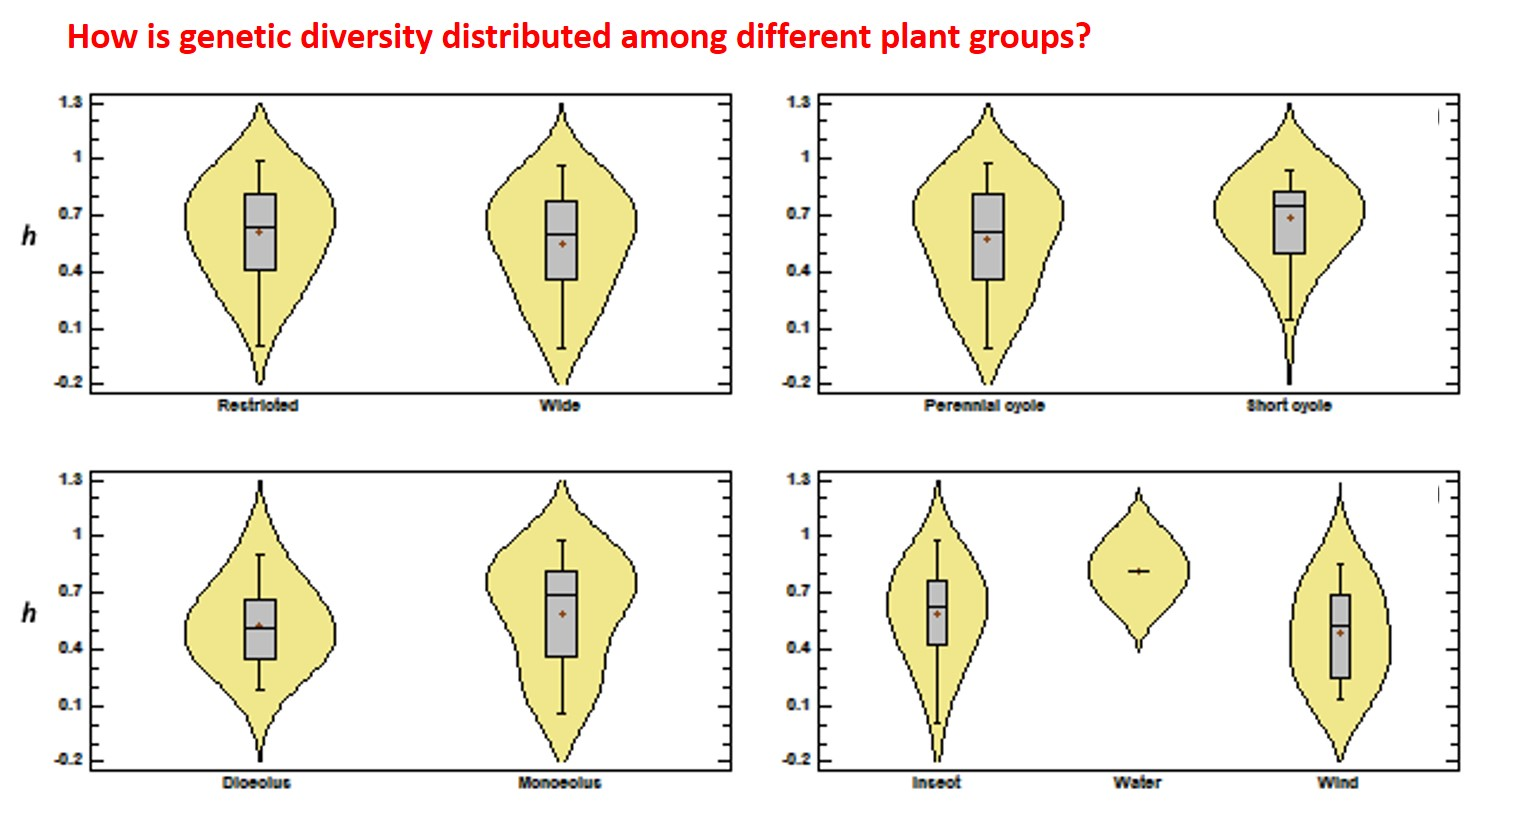
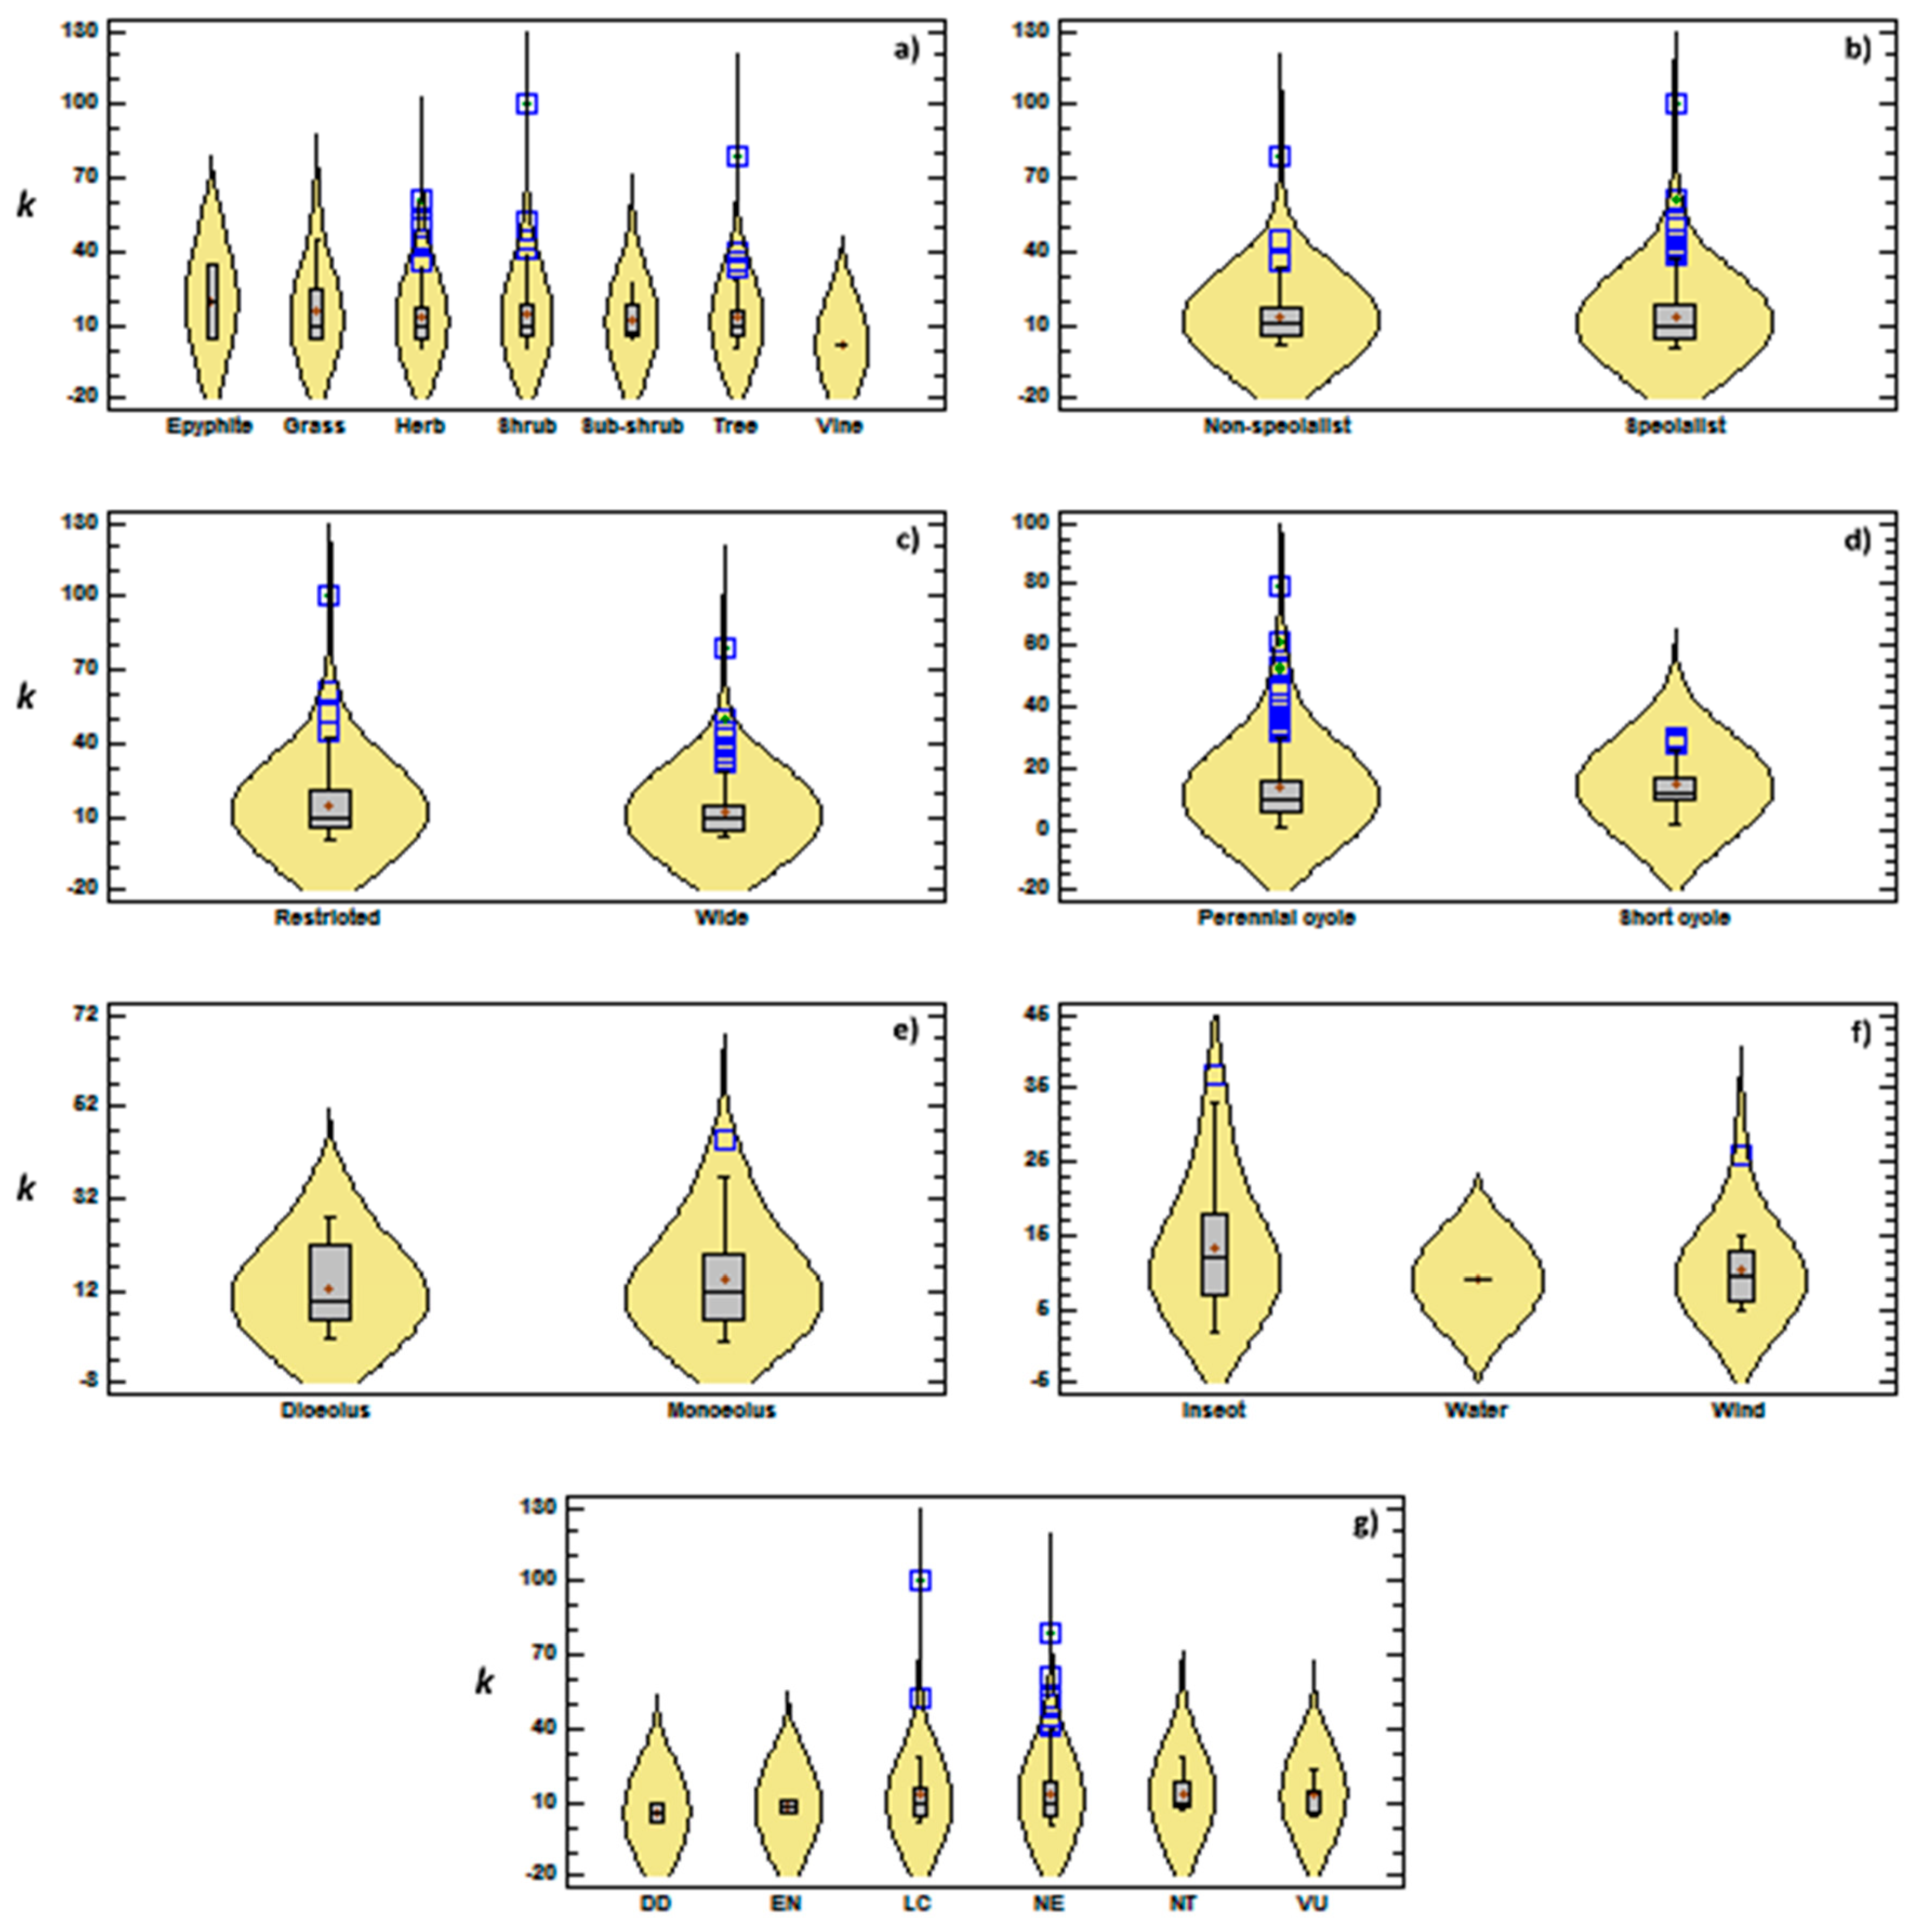
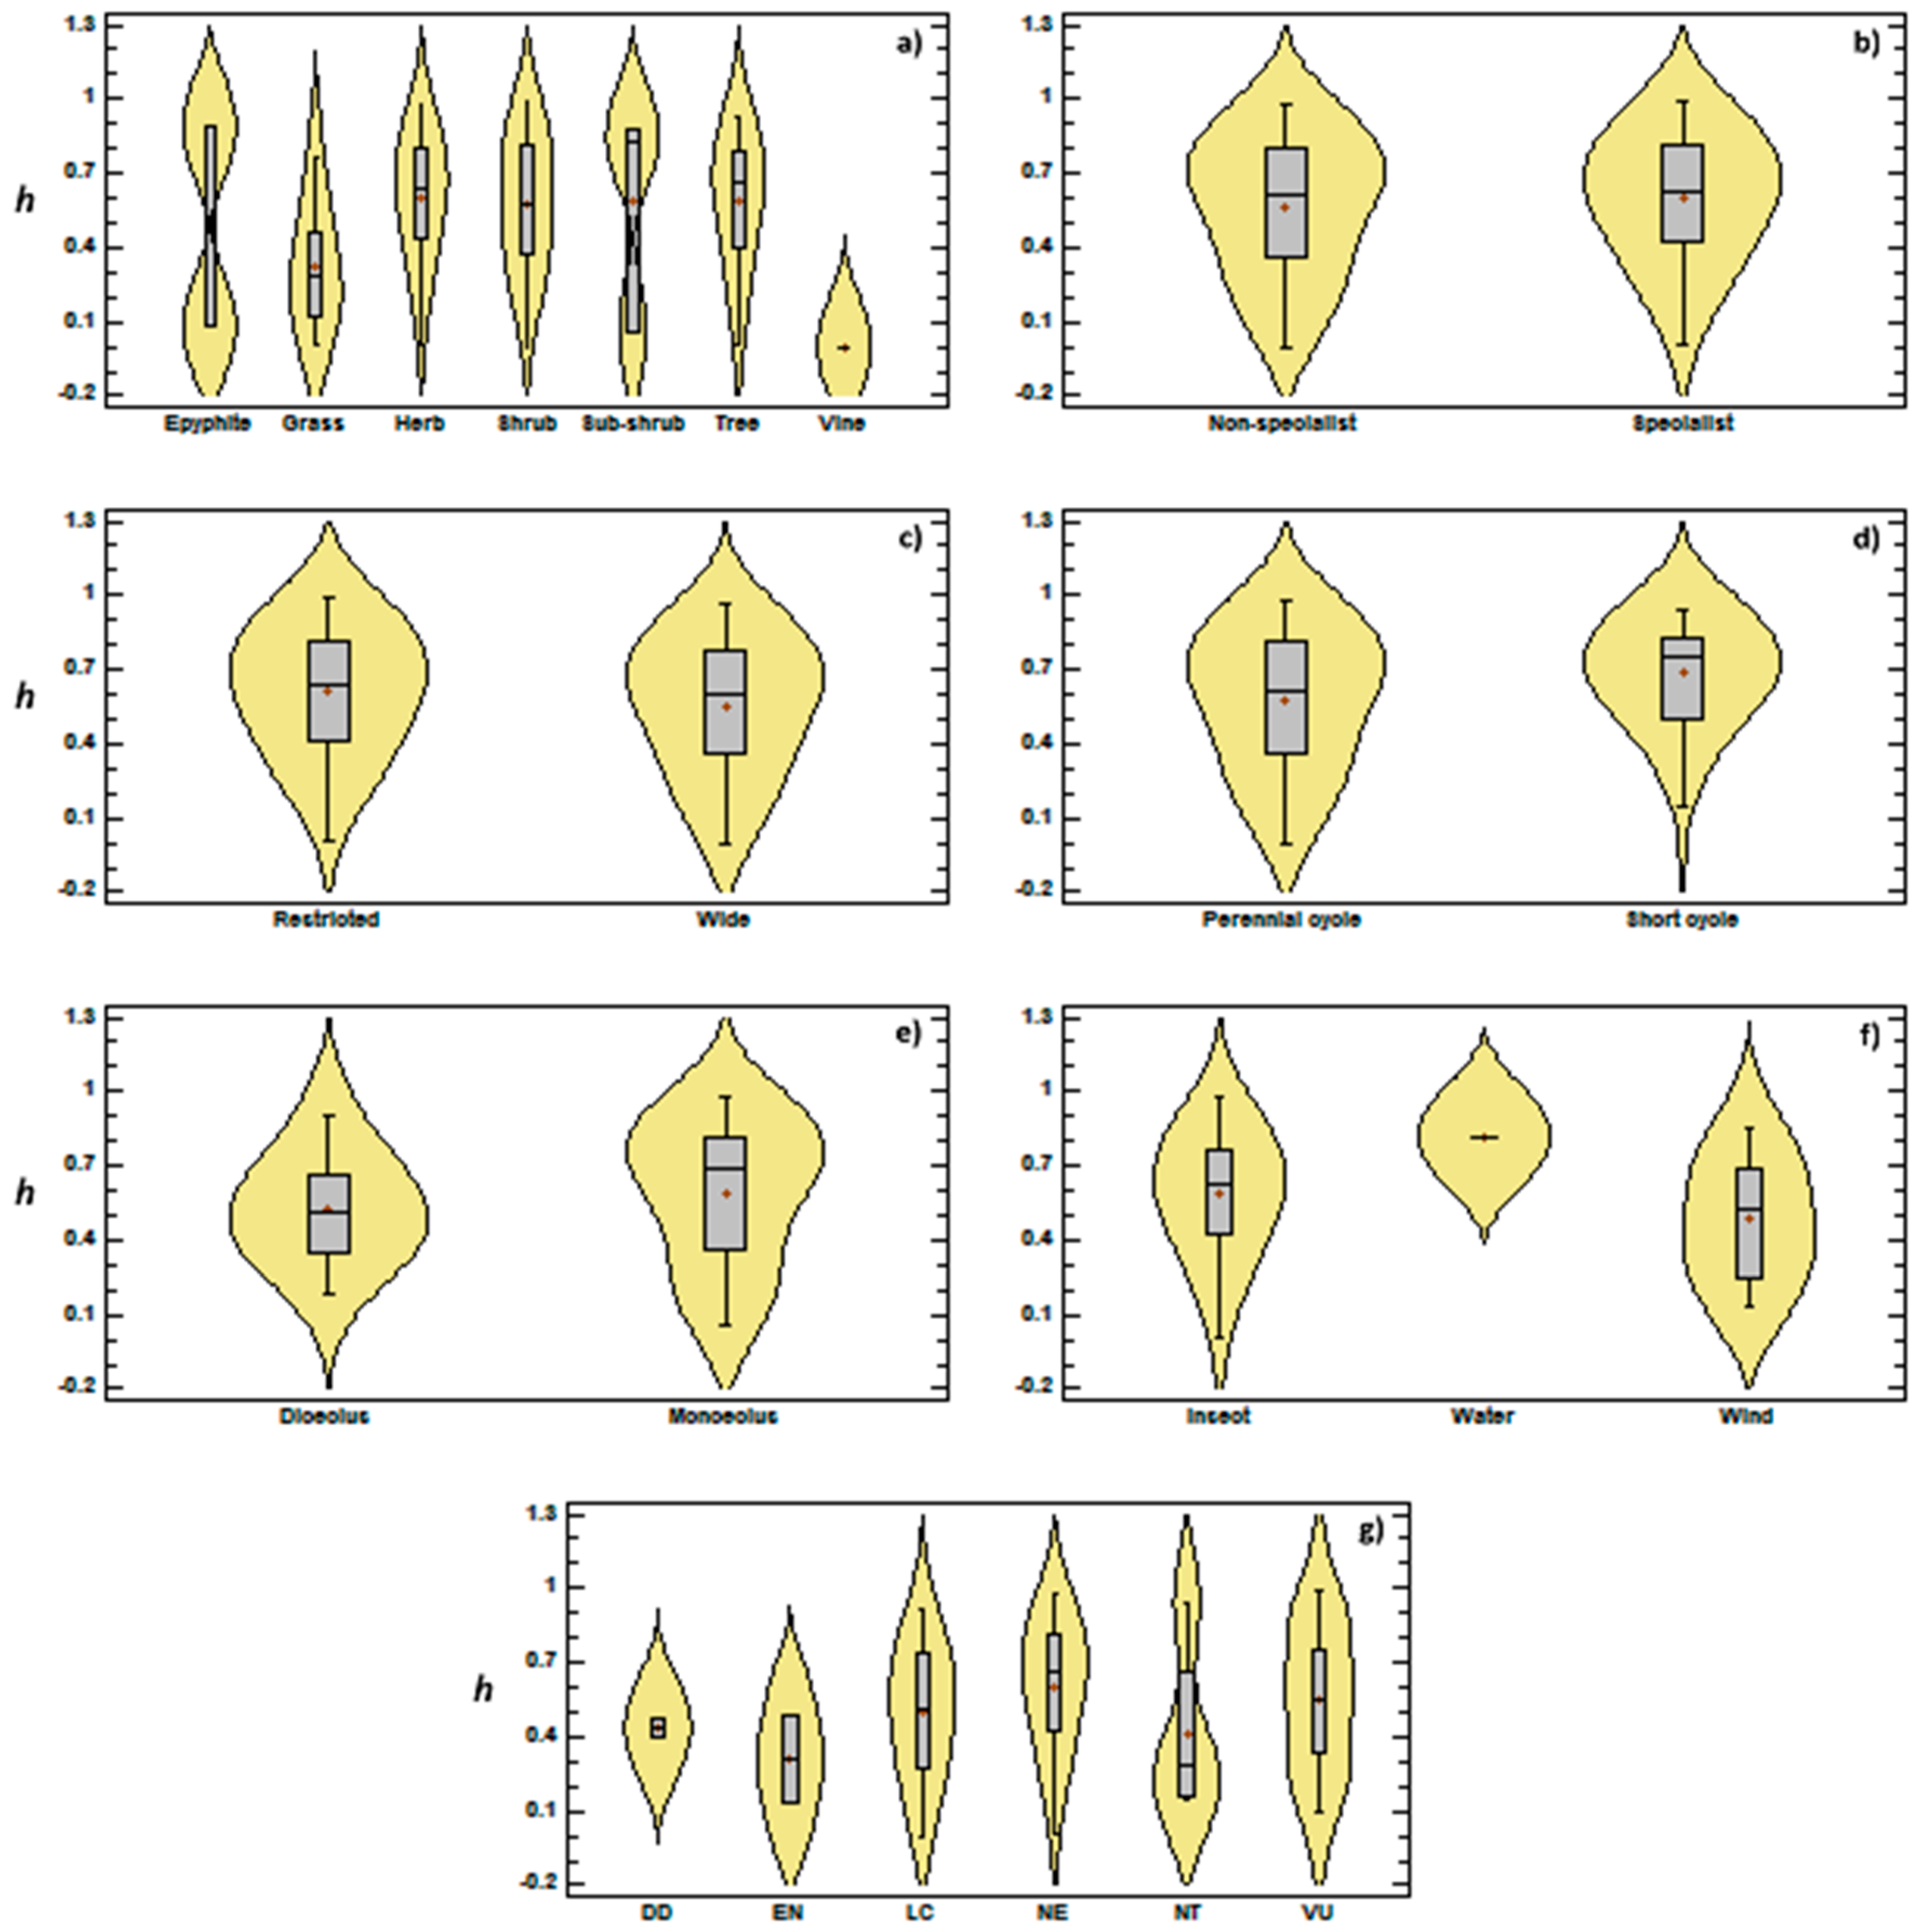
3.2. Genetic Diversity vs. Phylogeny, and Ecological and Reproductive Traits

The largest mean number of haplotypes (k = 20) was observed in the epiphytes, and the lowest number (k = 2), in the vines (Figure 6a). Habitat specialists and non-specialists had a similar mean number of haplotypes, of approximately 13. Unexpectedly, species with a restricted geographic distribution had a higher k (k = 14.9) than those with an ample distribution (k = 11.8). Perennial and short cycle species both had k values of approximately 13, as did dioecious and monoecious species (k ≈ 13.5). The species pollinated by insects and the wind both had mean k values of approximately 12, whereas those pollinated by water had a slightly lower mean (k = 9). In terms of the IUCN categories, the lowest k values were recorded in DD (6.00) and NE (8.5) species.
The lowest mean haplotype diversity (h = 0.32) was recorded in the grasses (Figure 7a). Once again, the h values were similar between specialists and non-specialists (h ≈ 0.59) and between species with more ample and more restricted distributions (h ≈ 0.58). The h of short-cycle species was slightly higher (h = 0.68) than that of perennial species (h = 0.57). The h was also slightly higher in monoecious species (h = 0.66) than in dioecious ones (h = 0.52). The species pollinated by the wind had the lowest mean haplotype diversity (h = 0.48), while the lowest value for an IUCN category was recorded in the endangered (EN) species (h = 0.30).
In the case of nucleotide diversity (π), many outliers were observed, and the highest mean values (π = 0.005) were recorded in shrubs and grasses (Figure 8a). The value was approximately 0.007 for specialist and non-specialist species. Once again, species with a restricted distribution presented a higher value (π = 0.009) than those with a more ample distribution (π = 0.003). Short-cycle species presented a slightly lower value (π = 0.003) than those with a perennial cycle. Species with monoecious and dioecious flowers had similar nucleotide diversity (π ≈ 0.002). In relation to the IUCN categories, the NT group had the highest mean (π = 0.007).
In general, the fixation index was high in all the group analyzed, with mean values of between 0.4 and 0.7. The herbs (Figure 9a) had the highest mean (FST = 0.67). Specialist plant presented a higher index (0.64) than non-specialists. Plants with a restricted distribution also had a higher index (FST = 0.68) than those with an ample distribution (FST = 0.54), although little difference was found between perennial and short-cycle plants (FST ≈ 0.57). Plants with monoecious flowers had a higher index (FST = 0.62) than those with dioecious flowers (FST = 0.48). Plants pollinated by insects and the wind also had very similar indices, of approximately 0.55, whereas the highest means for the different IUCN categories were recorded for the NE and VU plants.
Overall, phylogeny appears to have a fundamental influence on the genetic diversity data (Table 1), and was highly significant, both when analyzed separately and when combined with other variables. The number of alleles was influenced by the type of distribution (R2 = 0.015; p = 0.025), phylogeny (R2 = 0.829; p > 0.001), and by this factor combined with all other variables. When phylogeny was combined with only one other variable, the life form had a significant influence (R2 = 0.878; p > 0.001). Haplotype diversity was influenced only by phylogeny (R2 = 0.799; p > 0.001) and the combination of this factor with all other variables. The life form also influenced h significantly (R2 = 0.861; p > 0.001) when combined only with life form.
Nucleotide diversity (π) was also influenced by phylogeny (R2 = 0.877; p > 0.001), and when combined with one other variable, the IUCN category was the most significant (R2 = 0.918; p > 0.001). In general, FST was the index least influenced by the phylogenetic relationships among the species (R2 = 0.600; p > 0.001). This index was also influenced by the type of habitat (R2 = 0.069; p = 0.035) and the combination of habitat and geographic distribution (R2 = 0.115; p = 0.010). The combination of phylogeny and life form also had a significant influence on genetic structure (R2 = 0.668; p > 0.001).
In the case of the reproductive variables (Table 2), the phylogeny, once again, had the greatest influence on the diversity of the data. The type of flower (monoecious or dioecious) also had a significant influence on the h values (R2 = 0.090; p = 0.046). When phylogeny was considered together with each of the other reproductive characters, the type of pollinator had the greatest influence on k (R2 = 0.833; p > 0.001), h (R2 = 0.769; p > 0.001), and π (R2 = 0.914; p > 0.001). In the case of FST, the association between phylogeny and the life cycle was the most significant (R2 = 0.899; p > 0.001).

4. Discussion

A linear increase was observed in the number of publications that used cpDNA sequences as genetic markers, starting in 1987 (Figure 2b), which may be related directly to the expanding use of the polymerase chain reaction (PCR) technique developed by Kary Mullis, in 1983 [46]. The growth in studies nevertheless became more accentuated only from 1992 onward, which may be accounted for by the development and popularization of universal cpDNA primers (e.g., [47,48,49]). The development of an increasing number of cpDNA markers culminated in studies that require indices of genetic diversity [50]. Given this, publications containing data on genetic diversity derived from these markers began to appear in 1996 (Figure 2b), increasing progressively during subsequent years. Shaw et al. [51] published no less than 21 non-codifying cpDNA sequences that constitute potential markers for the analysis of phylogenetic relationships. In addition, the development of new-generation sequencing (NGS) techniques provided access to an increasing number of populations and species, which supported the expansion of studies based on estimates of genetic diversity, including research in population genetics, phylogeography, and phylogeny [52,53].
China was by far the country with the most publications that used cpDNA markers to analyze genetic diversity (Figure S2). There was also a clear relationship between the number of authors and the study region, which reflects the propensity of researchers to study species found in their home nation. The prominence of China in this scientific field can be accounted for by this country’s history of investment in this type of research. In 1998, the Chinese Ministry for Science and Technology, in collaboration with other government bodies, established a number of private institutions for genomic research, including the Beijing Institute of Genomics (BGI) and the Chinese Academy of Sciences. Through these initiatives, China has become a major force in the field of DNA sequencing, and since the turn of the 21st century, research in genetics has advanced considerably in this country [54]. In 2010, the BGI became a global leader in DNA sequencing, collaborating with researchers around the world, and in 2016, it not only increased the velocity of its sequencing, but also reduced costs [55]. Between 2006 and 2010, China was the country with the second largest number of papers published in a number of different fields of research [56], and the findings of the present study corroborated this general tendency in the specific case of the papers that report on research in genetic diversity based on chloroplast markers. One factor that has reinforced this trend is the hotspot of endemism found in the mountainous region of western China [57]. This, together with the considerable technological advances, has stimulated local research, further reinforcing the focus of Chinese researchers on their own geographic region.
Even so, the large number of papers published by Chinese authors is not reflected in the quality of the publications, in terms of their impact factors. As for other fields of research, there is a clear trend for some papers, in particular, reviews and methodological studies, to have a long-lasting influence and to be cited widely [58], while the vast majority of papers are cited infrequently or not at all. Even so, no systematic relationship was found between the publication date of the paper and the number of times it was cited, which may mean that many recent papers have yet to have an impact, while many older papers are already outdated [59].
The family Poaceae was represented by the largest number of species in the papers published on research in genetic diversity that has used cpDNA sequences as molecular markers. This prominence was predictable, given the economic importance and, to a certain extent, the ecological relevance of this family, which is one of the most widely-studied angiosperm groups [60]. The Pinaceae and Rosaceae were also prominent in terms of both the number of species and publications. Many species of both families are commercially important, due to their medicinal properties and flowers, which stimulates interest in their population genetics, and phylogeographic and phylogenetic characteristics (e.g., [61,62,63,64,65,66,67]). The increase in the number of papers published over time was also associated with an increase in the number of families and species analyzed, reflecting a general tendency for authors to focus on species not studied previously, even when they are aware of the fact that the genetic diversity of different populations of a species may vary considerably.
Most of the species analyzed are herbs, which confirms the influence of medicinal properties on the selection of study species. Sampling considerations also appear to be a factor determining the selection of study species, given the predominance of perennial species with an ample geographic distribution over species with a short cycle and a more restricted distribution.
The predominance of species in the Not Evaluated (NE) category indicates a relative lack of studies of species that have been classified by the IUCN, in particular endangered forms. This indicates that, despite the importance of the IUCN classification as a measure of the risk of extinction of a species [68], and the fact that indices of genetic diversity provide an excellent measure of the conservation status of a species, by providing insights into population bottlenecks and structuring, and inbreeding levels, this parameter has yet to influence the research on cpDNA markers. In other words, this field of research has yet to establish a systematic link between the genetic data and species conservation.
The lowest mean number of haplotypes (k) were recorded in species classified as DD (6.00) and NE (8.5), which indicates that a systematic relationship may exist between genetic diversity and IUCN categorias, which can only be confirmed once more endangered species have been analyzed, and more of the NE species that have been analyzed are classified by the IUCN. Worldwide, the total number of vascular plant species has been estimated at between 219,204 [69] and 308,312 [70], while the IUCN Red List [35] contains only 25,452 assessments of plant species, which represents only 7.25% of the valid species known to exist, worldwide [71]. This means that the vast majority of plant species are yet to be evaluated in terms of priorities for conservation [72]. In addition, the assessments of around one third of the species that have been evaluated by the IUCN are considered to be outdated, given that they were assessed more than 10 years ago or were evaluated using a previous version of the IUCN criteria [73].
The lowest haplotype diversity (k = 0.30) was observed in the EN species, which is an especially important finding, given that the IUCN tends to overlook genetic data. This is important because the risk of extinction may be underestimated when genetic factors are not included in assessments, leading to the application of inadequate management strategies [74]. Spielman et al. [75] found that heterozygosity is 35% lower, on average, in endangered taxa than in unrelated non-threatened species, and that extinction typically occurs only after deleterious genetic effects.
Habitat specialist plants had lower mean genetic structure than non-specialist plants, and a higher mean FST was recorded in more amply distributed plants, in comparison with the species with a more restricted range. These findings were corroborated by the phylogenetic modeling, which showed that the FST values were influenced by habitat and the combination of habitat with distribution. The number of alleles was also influenced by the type of distribution of the plant. This is because species with fewer adaptive restrictions, whether for habitat or geographic distribution tend to have a higher genetic diversity [2]. Habitat specialists and plants with a restricted distribution tend to have less available habitat and smaller populations, which will have an increased propensity for inbreeding, and more structured populations. Species with an ampler distribution tend to have greater phenotypic plasticity, and total genetic variation (allelic and haplotype diversity) greater than species with a more restricted distribution [76].
In general, we observed high levels of genetic structuring in all plant groups, with high levels of structuring typically correlating with low expected heterozygosity at the population level [77]. These findings indicate that many of the plants evaluated have high levels of population structuring, and that the number of endangered plant species is probably much greater than that indicated by the IUCN classification.
On its own, phylogeny had a greater influence on genetic diversity than ecological or reproductive traits. These findings are consistent with previous studies [78,79], which have shown that phylogeny may influence the ecological and morphological characteristics of a species. As closely-related species tend to have similar life-history traits, phylogeny may be an important determinant of plant genetic diversity. This reinforces the conclusion that phylogenetic relationships should not be overlooked in the analysis of plant life-history traits.
When associated with phylogeny, the plant life form influenced k, h and FST. The grasses presented low values for k and h, and a mean FST of 0.55. Hamrick and Godt [30] also found evidence of the influence of life form on genetic diversity, with woody plants having slightly greater diversity than non-woody species with similar life-history traits. Ballesteros-Mejia et al. [28] also recorded higher genetic diversity (h and π) in tree species in comparison with plants of smaller size, although grasses were not analyzed in this case. The lower genetic diversity recorded in the present study for grasses may be related to the widespread domestication of many species of this group. Prolonged periods of intensive artificial selection and improvement have resulted in bottlenecks that have reduced genetic diversity throughout the genome of the plant, and limit the germoplasm available for further advances in the reproduction of the species [80,81]. The genetic diversity of wheat declined considerably between 1950 and 1989 [82], for example, and other studies (e.g., [83]) have shown that the genetic diversity of some tree species has been affected in a similar way.
In addition, many grasses are apomictic, a condition that is normally associated with low levels of genetic variation at the population level (e.g., [84,85,86]), especially in plants that have a short life cycle. On the other hand, many grasses are invasive species, which typically have a greater phenotypic plasticity than more native species. Invasive species typically colonize new areas in smaller numbers (normally with low genetic diversity) and often encounter conditions distinct from those in which they evolved [87].
The type of flower also influenced the h values of the plant species analyzed in the present study. The mean h recorded here was slightly higher in monoecious species than in dioecious ones. This contradicts expectations, given the potential for self fecundation in monoecious flowers, which will tend to increase inbreeding levels in the population. However, mechanisms that restrict the maturation of the ovaries until after that of the pollen may guarantee sexual reproduction in these plants.
While the present study has provided a number of important insights into the influence of phylogeny and life-history traits on the genetic diversity of plants, further research should be encouraged, in particular because of the relative lack of data for some groups, such as algae, cacti, mosses, and palms. We also encountered difficulties for the definition of the reproductive characteristics of many plants. We were unable to identify any genetic data on plant species pollinated by bats, for example. There is a clear need for more robust databases that include information on the ecological, and in particular, the reproductive characteristics of the plants, like that available from BirdLife International for birds, for example.

5. Conclusions

Recent advances in molecular research are reflected in a progressive increase in the number of published papers that report on the genetic diversity of plants, based on cpDNA sequences. Overall, however, these data were published predominantly by Chinese authors, and focused primarily on plants that occur in China. The vast majority of the plant species for which data on genetic diversity are available have yet to be evaluated by the IUCN, even though the analysis of genetic parameters would be extremely useful for the definition of the conservation status of these species, especially as we found evidence of increased structuring in all types of plants, which may reflect the presence of populations of reduced size and potentially endangered species. The number of haplotypes (k) was influenced by the type of geographic distribution, while haplotype diversity (h) reflected the type of flower, and the mean fixation index (FST) was influenced by the type of habitat. However, of all the variables analyzed, phylogeny was the factor that most influenced the genetic diversity of the plants, with phylogenetically proximate species tending to have similar genetic diversity. This reinforces the need for the verification of phylogenetic influences in studies that evaluate the effects of life-history traits on the genetic diversity of plants.

Supplementary Materials

The following are available online at https://www.mdpi.com/1424-2818/11/4/62/s1, Figure S1: (a) Journals with the largest number of papers reporting estimates of genetic diversity derived from cpDNA markers; (b) Variation in the diversity (Shannon-Wiener index) of the journals publishing studies on cpDNA markers over time, Figure S2: (a) The number of publications containing estimates of genetic diversity obtained using cpDNA markers, in relation to the nationality of the corresponding author; (b) The number of publications on genetic diversity based on cpDNA markers, according to the geographic region focused on by the study, Figure S3: Classification of the angiosperm species investigated in the papers that analyzed genetic diversity using cpDNA markers: (a) Life mode; (b) Habitat specialization; (c) Geographic distribution; (d) Reproductive cycle; (e) Type of flower, and (f) Type of pollinator, Table S1: Plant species identified in the publications containing estimates of genetic diversity obtained from the use of cpDNA sequences as molecular markers.

Author Contributions

Conceptualization, L.C.V. and U.J.B.d.S. Formal analysis, Y.G.S.C.; Investigation, Y.G.S.C.; Methodology, L.C.V.; Writing—original draft, Y.G.S.C.; Writing—review & editing, L.C.V., U.J.B.d.S. and L.A.B.

Funding

This research received no external funding.

Acknowledgments

We would like to thank the Goiás Research Foundation (Fundação de Amparo à Pesquisa do Estado de Goiás—FAPEG) for the master scholarship, National Council for Scientific and Technological Development (Conselho Nacional de Desenvolvimento Científico e Tecnológico—CNPq) for the doctoral scholarship and financial support, the Brazilian Federal Agency for the Support and Evaluation of Graduate Education (Coordenação de Aperfeiçoamento de Pessoal de Nível Superior—CAPES) and the Federal Institute Goiano (Instituto Federal Goiano) for the financial support for this study.

Conflicts of Interest

The authors declare no conflict of interest.

References

  1. Hughes, A.; Inouye, B.D.; Johnson, M.T.; Underwood, N.; Vellend, M. Ecological consequences of genetic diversity. Ecol. Lett. 2008, 11, 609–623. [Google Scholar] [CrossRef] [PubMed] [Green Version]
  2. Leffler, E.M.; Bullaughey, K.; Matute, D.R.; Meyer, W.K.; Ségurel, L.; Venkat, A.; Andolfatto, P.; Przeworski, M. Revisiting an old riddle: What determines genetic diversity levels within species? PLoS Biol. 2012, 10, e1001388. [Google Scholar] [CrossRef] [PubMed]
  3. Tanksley, S.D. Molecular markers in plant breeding. Plant Mol. Biol. Rep. 1983, 1, 3–8. [Google Scholar] [CrossRef]
  4. Mohan, M.; Nair, S.; Bhagwat, A.; Krishna, T.G.; Yano, M.; Bhatia, C.R.; Sasaki, T. Genome mapping, molecular markers and marker-assisted selection in crop plants. Mol. Breed. 1997, 3, 87–103. [Google Scholar] [CrossRef]
  5. Collard, B.C.Y.; Mackill, D.J. Marker-assisted selection: An approach for precision plant breeding in the twenty-first century. Philos. Trans. R. Soc. B 2007, 363, 557–572. [Google Scholar] [CrossRef]
  6. Grover, A.; Sharma, P.C. Development and use of molecular markers: Past and present. Crit. Rev. Biotechnol. 2016, 36, 290–302. [Google Scholar] [CrossRef]
  7. Nogueira, A.M.; Ferreira, A.; Ferreira, M.F.S. Transferability of Microsatellites from Psidium guajava to Eugenia, Myrciaria, Campomanesia, and Syzygium Species (Myrtaceae). Plant Mol. Biol. Rep. 2016, 34, 249–256. [Google Scholar] [CrossRef]
  8. Erayman, M.; Ilhan, E.; Güzel, Y.; Eren, A. Transferability of SSR markers from distantly related legumes to Glycyrrhiza species. Turk. J. Agric. For. 2014, 38, 32–38. [Google Scholar] [CrossRef]
  9. Miranda, E.A.G.C.; Boaventura-Novaes, C.R.D.; Braga, R.S.; Reis, E.F.; Pinto, J.F.N.; Telles, M.P.C. Validation of EST-derived microsatellite markers for two Cerrado-endemic Campomanesia (Myrtaceae) species. Genet. Mol. Res. 2016, 15, 16. [Google Scholar] [CrossRef] [PubMed]
  10. De Paula, L.F.A.; Leal, B.S.S.; Rexroth, J.; Porembski, S.; Palma-Silva, C. Transferability of microsatellite loci to Vellozia plicata (Velloziaceae), a widespread species on Brazilian inselbergs. Braz. J. Bot. 2017, 40, 1071–1075. [Google Scholar] [CrossRef]
  11. Camacho, L.M.D.; Schatzer, C.A.F.; Alves-Pereira, A.; Zucchi, M.I.; Carvalho, M.A.M.; Gaspar, M. Development, characterization and cross-amplification of microsatellite markers for Chrysolaena obovata, an important Asteraceae from Brazilian Cerrado. J. Genet. 2017, 96, 47–53. [Google Scholar] [CrossRef]
  12. Wright, S. The interpretation of population structure by F-statistics with special regard to systems of Mating. Evolution 1965, 19, 395–420. [Google Scholar] [CrossRef]
  13. Wright, S. Evolution and the Genetics of Populations. The Theory of Gene Frequencies. v.2; University of Chicago Press: Chicago, IL, USA, 1969; p. 512. [Google Scholar]
  14. Diniz-Filho, J.A.F.; Telles, M.P.C.; Bonatto, S.L.; Eizirik, E.; Freitas, T.R.O.; Marco Junior, P.; Santos, F.R.; Sole-Cava, A.; Soares, T.N. Mapping the evolutionary twiligh zone: Molecular markers, populations and geography. J. Biogeogr. 2008, 35, 753–763. [Google Scholar] [CrossRef]
  15. Gao, Y.; Yin, S.; Yang, H.; Wu, L.; Yan, Y. Genetic diversity and Phylgenetic relationships of seven Amorphophallus species in southwestern China revealed by chloroplast DNA sequences. Mitochondrial DNA 2018, 29, 679–686. [Google Scholar] [CrossRef]
  16. Resende-Moreira, L.C.; Vasconcelos, P.N.; Souto, A.P.; Menezes, A.P.A.; Lemos-Filho, J.P.; Lovato, M.B. East-west divergence in central Brazilian Cerrado revealed by cpDNA sequences of a bird-dispersed tree species. Biochem. Syst. Ecol. 2017, 70, 247–253. [Google Scholar] [CrossRef]
  17. Zhao, X.L.; Gao, X.F.; Zhu, Z.M.; Gao, Y.D.; Xu, B. The demographic response of a deciduous shrub (the Indigofera bungeana complex, Fabaceae) to the Pleistocene climate changes in East Asia. Sci. Rep. 2017, 7, 697. [Google Scholar] [CrossRef]
  18. Hartl, D.L.; Clark, A.G. Princípios de Genética de Populações, 4th ed.; Artmed Editora: Porto Alegre, Brazil, 2010. [Google Scholar]
  19. Guo, W.; Ng, W.L.; Wu, H.; Li, W.; Zhang, L.; Qiao, S.; Yang, X.; Shi, X.; Huang, Y. Chloroplast Phylgeography of a widely distributed mangrove species, Excoecaria agallocha, in the Indo-West Pacific region. Hydrobiologia 2017, 807, 333–347. [Google Scholar] [CrossRef]
  20. Qiong, L.A.; Zhang, W.; Wang Hao Zeng, L.; Birks, H.J.B.; Zhong, Y. Testing the effect of the Himalayan mountains as a physical barrier to gene flow in Hippophae tibetana Schlect. (Elaeagnaceae). PLoS ONE 2017, 12, e0172948. [Google Scholar] [CrossRef]
  21. Feng, X.; Liu, J.; Chiang, Y.C.; Gong, X. Investigating the genetic diversity, population differentiation and population dynamics of Cycas segmentifida (Cycadaceae) endemic to Southwest China by multiple molecular markers. Front. Plant Sci. 2017, 8. [Google Scholar] [CrossRef]
  22. Wei, S.; Yang, W.; Wang, X.; Hou, Y. High genetic diversity in an endangered medicinal plant, Saussurea involucrata (Saussurea, Asteraceae), in western Tianshan Mountains, China. Conserv. Genet. 2017, 18, 1435–1447. [Google Scholar] [CrossRef]
  23. Chang, Y.-J.; Cao, Y.-F.; Zhang, J.-M.; Tian, L.-M.; Dong, X.-G.; Zhang, Y.; Qi, D.; Zhang, X.-S. Study on chloroplast DNA diversity of cultivated and wild pears (Pyrus L.) in Northern China. Tree Genet. Genomes 2017, 13, 44. [Google Scholar] [CrossRef]
  24. Goodwin, S.; McPherson, J.D.; McCombie, W.R. Coming of age: Ten years of next-generation sequencing technologies. Nat. Rev. Genet. 2016, 17, 333. [Google Scholar] [CrossRef]
  25. Van Dijk El Auger, H.; Jaszczyszyn, Y.; Thermes, C. Ten years of next-generation sequencing technology. Trends Genet. 2014, 30, 418–426. [Google Scholar] [CrossRef] [PubMed]
  26. Souza, U.J.B.D.; Telles, M.P.D.C.; Diniz-Filho, J.A.F. Tendências da literatura científica sobre genética de populações de plantas do Cerrado. Hoehnea 2016, 43, 461–477. [Google Scholar] [CrossRef] [Green Version]
  27. Aguilar, R.; Quesada, M.; Ashworth, L.; Herrerias-Diego, Y.; Lobo, J. Genetic consequences of habitat fragmentation in plant populations: Susceptible signals in plant traits and methodological approaches. Mol. Ecol. 2008, 17, 5177–5188. [Google Scholar] [CrossRef] [PubMed]
  28. Ballesteros-Mejia, L.; Lima, N.E.; Lima-Ribeiro, M.S.; Collevatti, R.G. Pollination mode and mating system explain patterns in genetic differentiation in neotropical plants. PLoS ONE 2016, 11, e0158660. [Google Scholar] [CrossRef]
  29. Hamrick, J.L.; Godt, M.J.W. Allozyme divcrsity in plant species. Plant Population Genetics, Breeding, and Genetic Resources. Sinauer, Sunder-land, MA Jolls, Cl & Chenier, TC. Gynodioccy in Silene vulgaris (Caryophyllaceae): Progeny success, experimental design, and maternal effects. Am. J. Bot. 1989, 76, 1360–1367. [Google Scholar]
  30. Hamrick, J.L.; Godt, M.J.W. Effects of life history traits on genetic diversity in plant species. Philos. Trans. R. Soc. Lond. B 1996, 351, 1291–1298. [Google Scholar] [CrossRef]
  31. Aguinagalde, I.; Hampe, A.; Mohanty, A.; Martín, J.P.; Duminil, J.; Petit, R.J. Effects of life-history traits and species distribution on genetic structure at maternally inherited markers in European trees and shrubs. J. Biogeogr. 2005, 32, 329–339. [Google Scholar] [CrossRef] [Green Version]
  32. Duminil, J.; Fineschi, S.; Hampe, A.; Jordano, P.; Salvini, D.; Vendramin, G.G.; Petit, R.J. Can population genetic structure be predicted from life-history traits? Am. Nat. 2007, 169, 662–672. [Google Scholar] [CrossRef]
  33. Garland, T., Jr. Rate tests for phenotypic evolution using phylogenetically independent contrasts. Am. Nat. 1992, 140, 509–519. [Google Scholar] [CrossRef] [PubMed]
  34. Garland, T., Jr.; Harvey, P.H.; Ives, A.R. Procedures for the analysis of comparative data using phylogenetically independent contrasts. Syst. Biol. 1992, 41, 18–32. [Google Scholar] [CrossRef]
  35. IUCN [Internet]. The IUCN Red List of Threatened Species. Version 2017-3. 2018. Available online: http://www.iucnredlist.org (accessed on 12 July 2018).
  36. R Core Team. R: A Language and Environment for Statistical Computing; R Foundation for Statistical Computing: Vienna, Austria, 2017; Available online: https://www.R-project.org/ (accessed on 31 January 2018).
  37. APG—Angiosperm Phylogeny Group IV. An update of the Angiosperm Phylogeny Group classification for the orders and families of flowering plants: APG IV. Bot. J. Linean Soc. 2016, 181, 1–20. [Google Scholar] [CrossRef] [Green Version]
  38. Gastauer, M.; Meira-Neto, J.A.A. Updated angiosperm family tree for analyzing phylogenetic diversity and community structure. Acta Bot. Bras. 2017, 31, 191–198. [Google Scholar] [CrossRef] [Green Version]
  39. Ackerly, D.D. Taxon sampling, correlated evolution, and independent contrasts. Evolution 2000, 54, 1480–1492. [Google Scholar] [CrossRef]
  40. Guénard, G.; Legendre, P.; Peres-Neto, P. Phylogenetic eigenvector maps: A framework to model and predict species traits. Methods Ecol. Evol. 2013, 4, 1120–1131. [Google Scholar] [CrossRef]
  41. Guénard, G. A Phylogenetic Modelling Tutorial Using Phylogenetic Eigenvector Maps (PEM) as Implemented in R Package MPSEM (0:3-2). 2017. Available online: https://cran.r-project.org/web/packages/MPSEM/vignettes/MPSEM.pdf (accessed on 15 November 2017).
  42. Jakob, S.S.; Blattner, F.R. A chloroplast genealogy of Hordeum (Poaceae): Long-term persisting haplotypes, incomplete lineage sorting, regional extinction, and the consequences for Phylgenetic inference. Mol. Biol. Evol. 2006, 23, 1602–1612. [Google Scholar] [CrossRef] [PubMed]
  43. Wang, L.; Abbott, R.J.; Zheng, W.E.I.; Chen, P.; Wang, Y.; Liu, J. History and evolution of alpine plants endemic to the Qinghai-Tibetan Plateau: Aconitum gymnandrum (Ranunculaceae). Mol. Ecol. 2009, 18, 709–721. [Google Scholar] [CrossRef] [PubMed]
  44. Zhang, Q.; Chiang, T.Y.; George, M.; Liu, J.Q.; Abbott, R.J. Phylgeography of the Qinghai-Tibetan Plateau endemic Juniperus przewalskii (Cupressaceae) inferred from chloroplast DNA sequence variation. Mol. Ecol. 2005, 14, 3513–3524. [Google Scholar] [CrossRef] [PubMed]
  45. Anderson, L.L.; Hu, F.S.; Nelson, D.M.; Petit, R.J.; Paige, K.N. Ice-age endurance: DNA evidence of a white spruce refugium in Alaska. Proc. Natl. Acad. Sci. USA 2006, 103, 12447–12450. [Google Scholar] [CrossRef] [Green Version]
  46. Mullis, K.B. The unusual origin of the polymerase chain reaction. Sci. Am. 1990, 262, 56–65. [Google Scholar] [CrossRef] [PubMed]
  47. Tarbelet, P.; Gielly, L.; Bouvet, J. Universal primers for amplification of three noncoding regions of chloroplast DNA. Plant Mol. Biol. 1991, 17, 1105–1109. [Google Scholar] [CrossRef]
  48. Demesure, B.; Sodzi, N.; Petit, R.J. A set of universal primers for amplification of polymorphic non-coding regions of mitochondrial and chloroplast DNA in plants. Mol. Ecol. 1995, 4, 129–134. [Google Scholar] [CrossRef]
  49. Dumolin-Lapegue, S.; Pemonge, M.-H.; Petit, R.J. An enlarged set of consensus primers for the study of organelle DNA in plants. Mol. Ecol. 1997, 6, 393–397. [Google Scholar] [CrossRef] [PubMed]
  50. Schulman, A.H. Molecular markers to assess genetic diversity. Euphytica 2007, 158, 313–321. [Google Scholar] [CrossRef]
  51. Shaw, J.; Lickey, E.B.; Beck, J.T.; Farmer, S.B.; Liu, W.; Miller, J.; Siripun, K.C.; Winder, C.T.; Schilling, E.E.; Small, R.L. The tortoise and the hare II: Relative utility of 21 noncoding chloroplast DNA sequences for Phylgenetic analysis. Am. J. Bot. 2005, 92, 142–166. [Google Scholar] [CrossRef]
  52. Mardis, E.R. The impact of next-generation sequencing technology on genetics. Trends Genet. 2008, 24, 133–141. [Google Scholar] [CrossRef]
  53. Shendure, J.; Ji, H. Next-generation DNA sequencing. Nat. Biotechnol. 2008, 26, 1135. [Google Scholar] [CrossRef]
  54. Wu, J.; Xiao, J.; Zhang, R.; Yu, J. DNA sequencing leads to genomics progress in China. Sci. China Life Sci. 2011, 54, 290–292. [Google Scholar] [CrossRef] [Green Version]
  55. Cyranoski, D. The Sequencing Superpower. Nature 2016, 534, 462. [Google Scholar] [CrossRef]
  56. De Almeida, E.C.E.; Guimarães, J.A. Brazil’s growing production of scientific articles-how are we doing with review articles and other qualitative indicators? Scientometrics 2013, 97, 287–315. [Google Scholar] [CrossRef]
  57. Bellard, C.; Leclerc, C.; Leroy, B.; Bakkenes, M.; Veloz, S.; Thuiller, W.; Courchamp, F. Vulnerability of biodiversity hotspots to global change. Glob. Ecol. Biogeogr. 2014, 23, 1376–1386. [Google Scholar] [CrossRef]
  58. Miranda, R.; Garcia-Carpinteiro, E. Overcitation and overrepresentation of review papers in the most cited papers. J. Informetr. 2018, 12, 1015–1030. [Google Scholar] [CrossRef]
  59. Wang, J. Citation time window choice for research impact evaluation. Scientometrics 2013, 94, 851–872. [Google Scholar] [CrossRef]
  60. Nakamura, A.T.; Longhi-Wagner, H.M.; Scatena, V.L. Desenvolvimento de óvulo, fruto e semente de espécies de Poaceae (Poales). Rev. Bras. Bot. 2009, 165–176. [Google Scholar] [CrossRef]
  61. Xiang, Q.-P.; Wei, R.; Shao, Y.-Z.; Yang, Z.-Y.; Wang, X.-Q.; Zhang, X.-C. Phylgenetic relationships, possible ancient hybridization, and biogeographic history of Abies (Pinaceae) based on data from nuclear, plastid, and mitochondrial genomes. Mol. Phylgenet. Evol. 2015, 82, 1–14. [Google Scholar] [CrossRef] [PubMed]
  62. Potokina, E.K.; Kiseleva, A.A.; Nikolaeva, M.A.; Ivanov, A.S.; Ulianich, O.S.; Potokin, A.F. Analysis of the polymorphism of organelle DNA to elucidate the Phylgeography of Norway spruce in the East European Plain. Russ. J. Genet. Appl. Res. 2015, 5, 430–439. [Google Scholar] [CrossRef]
  63. Potter, K.M.; Hipkins, V.D.; Mahalovich, M.F.; Means, R.E. Nuclear genetic variation across the range of ponderosa pine (Pinus ponderosa): Phylgeographic, taxonomic and conservation implications. Tree Genet. Genomes 2015, 11, 38. [Google Scholar] [CrossRef]
  64. Yang, Y.-X.; Wang, M.-L.; Zhu, J.; Yan, M.-Y.; Li, Z.-H. Nucleotide polymorphism and Phylgeographic history of an endangered conifer species Pinus bungeana. Biochem. Syst. Ecol. 2015, 64, 89–96. [Google Scholar] [CrossRef]
  65. Faghir, M.B.; Attar, F.; Farazmand, A.; Kazempour, S. Phylgeny of the genus Potentilla (Rosaceae) in Iran based on nrDNA ITS and cpDNA trnL-F sequences with a focus on leaf and style characters’ evolution. Turk. J. Bot. 2014, 38, 417–429. [Google Scholar] [CrossRef]
  66. Fu, P.-C.; Gao, Q.-B.; Zhang, F.-Q.; Xing, R.; Khan, G.; Wang, J.-L.; Liu, H.-R.; Chen, S.-L. Responses of plants to changes in Qinghai–Tibetan Plateau and glaciations: Evidence from Phylgeography of a Sibiraea (Rosaceae) complex. Biochem. Syst. Ecol. 2016, 65, 72–82. [Google Scholar] [CrossRef]
  67. Khan, G.; Zhang, F.; Gao, Q.; Fu, P.; Zhang, Y.; Chen, S. Spiroides shrubs on Qinghai-Tibetan Plateau: Multilocus Phylgeography and palaeodistributional reconstruction of Spiraea alpina and S. Mongolica (Rosaceae). Mol. Phylgenet. Evol. 2018, 123, 137–148. [Google Scholar] [CrossRef]
  68. Lamoreux, J.; Akçakaya, H.R.; Bennun, L.; Collar, N.J.; Boitani, L.; Brackett, D.; Bräutigam, A.; Brooks, T.M.; Da Fonseca, G.A.B.; Mittermeier, R.A.; et al. Value of the IUCN Red List. Trends Ecol. Evolut. 2003, 18, 214–215. [Google Scholar] [CrossRef]
  69. Wilson, J.B.; Peet, R.K.; Dengler, J.; Pärtel, M. Plant species richness: The world records. J. Veg. Sci. 2012, 23, 796–802. [Google Scholar] [CrossRef]
  70. Christenhusz, M.J.M.; Byng, J.W. The number of known plants species in the world and its annual increase. Phytotaxa 2016, 261, 201–217. [Google Scholar] [CrossRef]
  71. The Plant List Version 1.1. 2013. Available online: http://www.theplantlist.org/ (accessed on 24 October 2018).
  72. Darrah, S.E.; Bland, L.M.; Bachman, S.P.; Clubbe, C.P.; Trias-Blasi, A. Using coarse-scale species distribution data to predict extinction risk in plants. Divers. Distrib. 2017, 23, 435–447. [Google Scholar] [CrossRef] [Green Version]
  73. IUCN Standards and Petitions Subcommittee. Guidelines for Using the IUCN Red List Categories and Criteria. Version 11 (February 2014). Prepared by the Standards and Petitions Working Group of the IUCN SSC Biodiversity Assessments Subcommittee; IUCN Standards and Petitions Subcommittee. 2014. Available online: http://www.iucnredlist.org/documents/RedListGuidelines.pdf (accessed on 10 March 2014).
  74. Frankham, R. Genetics and extinction. Biol. Cons. 2005, 126, 131–140. [Google Scholar] [CrossRef]
  75. Spielman, D.; Brook, B.W.; Frankham, R. Most species are not driven to extinction before genetic factors impact them. Proc. Natl. Acad. Sci. USA 2004, 101, 15261–15264. [Google Scholar] [CrossRef] [Green Version]
  76. Falk, E.D.D.A.; Falk, D.A.; Holsinger, K.E.; Holsinger, K.E. Genetics and Conservation of Rare Plants; Oxford University Press on Demand: Oxford, UK, 1991. [Google Scholar]
  77. Meirmans, P.G.; Hedrick, P.W. Assessing population structure: FST and related measures. Mol. Ecol. Resour. 2010, 11, 5–18. [Google Scholar] [CrossRef]
  78. Harvey, P.H.; Pagel, M.D. The Comparative Method in Evolutionary Biology; Oxford University Press: Oxford, UK, 1991. [Google Scholar]
  79. Bennett, P.M.; Owens, I.P.F. Evolutionary Ecology of Birds: Life Histories, Mating Systems, and Extinction; Oxford University Press: Oxford, UK, 2002. [Google Scholar]
  80. Tanksley, S.D.; McCouch, R. Seed banks and molecular maps: Unlocking genetic potential from the wild. Science 1997, 277, 1063–1066. [Google Scholar] [CrossRef]
  81. Doebley, J.F.; Gaut, B.S.; Smith, B.D. The Molecular Genetics of Crop Domestication. Cell 2006, 127, 1309–1321. [Google Scholar] [CrossRef] [Green Version]
  82. Reif, J.C.; Zhang, P.; Dreisigacker, S.; Warburton, M.L.; van Ginkel, M.; Hoisington, D.; Bohn, M.; Melchinger, A.E. Wheat genetic diversity trends during domestication and breeding. Theor. Appl. Genet. 2005, 110, 859–864. [Google Scholar] [CrossRef]
  83. Hollingsworth, P.M.; Dawson IKGoodall-Copestake, W.P.; Richardson, J.E.; Weber, J.C.; Sotelo Montes, C.; Pennington, R.T. Do farmers reduce genetic diversity when they domesticate tropical trees? A case study from Amazonia. Mol. Ecol. 2005, 14, 497–501. [Google Scholar] [CrossRef]
  84. De Oliveira, F.A.; Vigna, B.B.Z.; Silva, C.C.; Favero, A.P.; Matta, F.P.; Azevedo, A.L.S.; Souza, A.P. Apomixis-related genes identified from a coexpression network in Paspalum notatum, a Neotropical grass. bioRxiv 2018, 369280. [Google Scholar] [CrossRef]
  85. Radhakrishna, A.; Dwivedi, K.K.; Srivastava, M.K.; Roy, A.K.; Malaviya, D.R.; Kaushal, P. Transcriptomic data of pre-meiotic stage of floret development in apomictic and sexual types of guinea grass (Panicum maximum Jacq.). Data Brief 2018, 18, 590–593. [Google Scholar] [CrossRef]
  86. Kaushal, P.; Dwivedi, K.K.; Radhakrishna, A.; Saxena, S.; Paul, S.; Srivastava, M.K.; Baig, M.J.; Roy, A.K.; Malaviya, D.R. Ploidy dependent expression of apomixis and its components in guinea grass (Panicum maximum Jacq.). Euphytica 2018, 214, 152. [Google Scholar] [CrossRef]
  87. Davidson, A.M.; Jennions, M.; Nicotra, A.B. Do invasive species show higher phenotypic plasticity than native species and, if so, is it adaptive? A meta-analysis. Ecol. Lett. 2011, 14, 419–431. [Google Scholar] [CrossRef]
Figure 1. Diagram of the steps taken to refine the results of the searches and select the papers on plant genetic diversity based on chloroplast sequences analyzed in the present study.
Diversity 11 00062 g001
Figure 2. Variation in the total number of publications, per annum, between 1965 and March 2018, that (a) used cpDNA sequences as markers, and (b) used cpDNA markers to obtain estimates of genetic diversity, and the residuals (per annum) of the regression models for the studies that (c) used cpDNA sequences as markers, and (d) used cpDNA markers to obtain estimates of genetic diversity.
Diversity 11 00062 g002
Figure 3. (a) Mean impact factors of the journals in which papers on chloroplast markers were published by corresponding authors of different nationalities (more than two publications). The means with different letters above them are significantly different from each other, based on Tukey’s test (p ≤ 0.05). (b) The number of papers (based on estimates of genetic diversity obtained from cpDNA sequences) ranked by the number of times they have been cited in other publications.
Diversity 11 00062 g003
Figure 4. Yearly variation in the number of species of the most diverse plant families and the number of papers (studies of genetic diversity based on chloroplast markers) in which they were analyzed, over the past 21 years.
Diversity 11 00062 g004
Figure 5. (a) Ordination plot of the principal components analysis (PCA) of the data on the plant families recorded in the publications presenting estimates of plant genetic diversity obtained using chloroplast markers, by year, (b) radar plot of the species analyzed by year and International Union for Conservation of Nature (IUCN) category (DD—Data Deficient; NE—Not Evaluated; LC—Least Concern; NT—Near Threatened; VU—Vulnerable; EN—Endangered; CR—Critically Endangered).
Diversity 11 00062 g005
Figure 6. Mean number of haplotypes (k) observed in the different angiosperm groups targeted in studies that used chloroplast markers: (a) life mode; (b) habitat specialist/non-specialist; (c) geographic distribution; (d) reproductive cycle; (e) type of flower; (f) type of pollinator, and (g) IUCN category. + = average; □ = outliers.
Diversity 11 00062 g006
Figure 7. Mean haplotype diversity (h) observed in the different angiosperm groups targeted in studies that used chloroplast markers: (a) life mode; (b) habitat specialist/non-specialist; (c) geographic distribution; (d) reproductive cycle; (e) type of flower; (f) type of pollinator, and (g) IUCN category. + = average.
Diversity 11 00062 g007
Figure 8. Mean nucleotide diversity (π) observed in the different angiosperm groups targeted in studies that used chloroplast markers: (a) life mode; (b) habitat specialist/non-specialist; (c) geographic distribution; (d) reproductive cycle; (e) type of flower; (f) type of pollinator, and (g) IUCN category. + = average; □ = outliers.
Diversity 11 00062 g008
Figure 9. Mean Fixation index (Fst) observed in the different angiosperm groups targeted in studies that used chloroplast markers: (a) life mode; (b) habitat specialist/non-specialist; (c) geographic distribution; (d) reproductive cycle; (e) type of flower; (f) type of pollinator, and (g) IUCN category. + = average.
Diversity 11 00062 g009
Table 1. Values of R2 and p calculated for the influence of phylogeny and ecological variables, and the different combinations of these variables, on the genetic diversity (k, h and π) and FST of plants. The data were obtained from studies that used cpDNA markers for the analysis of genetic diversity.
Variables kphpπpFSTp
Dist0.0150.0254 × 10−70.9902 × 10−40.7890.0370.058
Phyl0.8292 × 10−160.7992 × 10−160.8772 × 10−160.6004 × 10⁻⁸
LF0.0150.7810.0220.6500.0200.7280.0640.293
Hab3 × 10−50.9940.0040.5870.0070.3730.0690.035
IUCN0.0060.8410.0110.6740.0110.7030.0110.784
Dist and Phyl0.8322 × 10−160.8262 × 10−160.8812 × 10−160.6162 × 10⁻⁸
LF and Dist0.0280.4450.0220.7430.0200.8050.1270.052
Hab and Dist0.0200.0920.0040.75640.0080.5580.1150.010
Dist and IUCN0.0230.2830.0120.7830.0120.7900.0430.389
LF and Phyl0.8782 × 10−160.8612 × 10−160.8992 × 10−160.6681 × 10⁻⁸
Hab and Phyl0.8582 × 10−160.8072 × 10−160.8802 × 10−160.6513 × 10⁻⁹
Hab and IUCN0.0060.9550.0170.7140.0190.6580.0850.145
IUCN and Phyl0.8382 × 10−160.8032 × 10−160.9182 × 10−160.6556 × 10⁻⁹
LF and IUCN0.0200.9210.0340.7670.0310.8290.0720.556
LF and Hab0.0150.9010.0270.7100.0300.6300.1320.076
Dist and IUCN and Phyl0.8662 × 10−160.8112 × 10−160.9242 × 10−160.7141 × 10⁻¹⁰
Dist and IUCN and LF0.0030.6670.0340.8270.0320.8700.1320.175
Hab and Dist and Phyl0.8632 × 10−160.0832 × 10−160.8862 × 10−160.7103 × 10⁻¹¹
Hab and Dist and IUCN0.0280.3390.0180.7750.0190.7530.1230.062
IUCN and Phyl and LF0.8942 × 10−160.8642 × 10−160.9422 × 10−160.6951 × 10⁻⁸
IUCN and Phyl and Hab0.8662 × 10−160.8112 × 10−160.9242 × 10−160.7141 × 10⁻¹⁰
LF and Hab and Dist0.0300.5460.0270.7800.0310.6970.2140.005
Phyl and LF and Dist0.8832 × 10−160.8992 × 10−160.9012 × 10−160.6962 × 10⁻⁹
LF and Hab and Phyl0.9072 × 10−160.8702 × 10−160.9042 × 10−160.7177 × 10⁻¹⁰
LF and Hab and IUCN0.0210.9680.0400.7850.0430.7460.1420.188
Dist and IUCN and Hab and Phyl0.8722 × 10−160.8452 × 10−160.9342 ×10−160.7461 × 10⁻¹¹
LF and Dist and Hab and Phyl0.9202 × 10−160.9232 × 10−160.9082 × 10−160.7810.023
LF and Dist and IUCN and Phyl0.9012 × 10−160.9062 × 10−160.9452 × 10−160.7091 × 10⁻⁸
LF and Hab and Dist and IUCN0.0380.7310.0400.8260.0430.7990.2211 × 10−12
LF and IUCN and Hab and Phyl0.9212 × 10−160.8732 × 10−160.9482 × 10−160.7503 × 10⁻¹⁰
Dist and IUCN and Hab and Phyl and LF0.9362 × 10−160.9312 × 10−160.9562 × 10−160.7899 × 10⁻¹²
Residual0.063 0.069 0.043 0.059
LF: Life form; Dist: Distribution; Phyl: Phylogeny; Hab: Habitat; k: Number of haplotypes; h: Haplotype diversity; π: Nucleotide diversity. Significant values are highlighted in bold type.
Table 2. Values of R2 and p calculated for the influence of phylogeny and reproductive variables, and the different combinations of these variables, on the genetic diversity (k, h and π) and FST of plants. The data were obtained from studies that used cpDNA markers for the analysis of genetic diversity.
Variables kphpπpFSTp
LC0.0010.7770.0300.3240.0020.7360.0150.483
F0.0010.8140.0900.0461 × 10−40.9860.0020.895
P0.0030.7855 × 10−40.8520.0030.6650.0030.830
Phyl0.8292 × 10−160.6901 × 10−40.9042 × 10−160.8687 × 10⁻¹⁵
LC and F0.0020.9500.1120.1220.0020.9420.0170.796
LC and Phyl0.8302 × 10−160.7032 × 10−40.9132 × 10−160.8992 × 10⁻¹⁶
LC and P0.0060.8580.0360.6880.0060.7810.0240.677
F and Phyl0.8322 × 10−160.7629 × 10−60.9052 × 10−160.8742 × 10⁻¹⁴
F and P0.0090.6860.0990.1710.0030.9080.0120.887
P and Phyl0.8332 × 10−160.7695 × 10−60.9142 × 10−160.8751 × 10⁻¹⁴
LC and F and P0.0110.8340.1190.2660.0070.9350.0290.840
LC and F and Phyl0.8322 × 10−160.7692 × 10−50.9142 × 10−160.9132 × 10⁻¹⁶
LC and P and Phyl0.8342 × 10−160.8101 × 10−60.9222 × 10−160.9162 × 10⁻¹⁶
F and P and Phyl0.8342 × 10−160.9005 × 10−110.9152 × 10−160.8816 × 10⁻¹⁴
LC and F and P and Phyl0.8352 × 10−160.9283 × 10−120.9242 × 10−160.9252 × 10⁻¹⁶
Resíduo0.063 0.072 0.075 0.074
LC: Life Cycle; F: Flower; P: Pollinator; Phyl: Phylogeny; k: Number of haplotypes; h: Haplotype diversity; π: Nucleotide diversity.

