Article

Prokaryotic Dynamics in the Meromictic Coastal Lake Faro (Sicily, Italy)

1
Department of Chemical, Biological, Pharmaceutical and Environmental Sciences, University of Messina, 98166 Messina, Italy
2
Department of Geoscience, University of Calgary, Calgary, T2N 1N4, Canada
3
Institute for the Biological Resources and Marine Biotechnology, National Research Council (IRBIM-CNR), 98122 Messina, Italy
*
Author to whom correspondence should be addressed.
These authors contributed equally to this work.
posthumous
Diversity 2019, 11(3), 37; https://doi.org/10.3390/d11030037
Submission received: 17 January 2019 / Revised: 22 February 2019 / Accepted: 27 February 2019 / Published: 6 March 2019

Abstract

:
Lake Faro, in the North-Eastern corner of Sicily (Italy), shows the typical stratification of a meromictic tempered basin, with a clear identification of the mixolimnion and the monimolimnion, separated by an interfacial chemocline. In this study, an annual-scaled study on the space-time distribution of the microbial communities in water samples of Lake Faro was performed by both ARISA (Amplified Ribosomal Intergenic Spacer Analysis) and CARD-FISH (Catalyzed Reporter Deposition-Fluorescence In Situ Hybridization) approaches. A correlation between microbial parameters and both environmental variables (i.e., temperature, pH, dissolved oxygen, redox potential, salinity, chlorophyll-a) and mixing conditions was highlighted, with an evident seasonal variability. The most significative differences were detected by ARISA between the mixolimnion and the monimolimnion, and between Spring and Autumn, by considering layer and season as a factor, respectively.

1. Introduction

Among ecosystems of scientific interest, meromictic lakes represent complex and quite rare systems with peculiar characteristics that make them optimal candidates as study models in microbial ecology. The physicochemical pattern, along the water column of meromictic lakes, indirectly reproduces the primordial assessment of the ocean. Meromictic lakes are characterized by a stratification of the water column into an upper oxygenic layer (namely the mixolimnion), a bottom anoxygenic layer (namely the monimolimnion), and a transition zone, the chemocline, that separates the former zones [1,2,3]. Meromictic lakes are located worldwide, even in Antarctica, where the Ace Lake remains the most well-characterized [4]. In meromictic basins, vertical gradients of nutrients determine a vertical zonation of the planktonic microbial community [1,5,6], with consequences on the biogeochemical cycling of nutrients and the anaerobic decomposition of organic matter. The metabolic diversity of prokaryotes allows the exploitation of the entire chemical gradient of the water column [7], with huge blooms that often occur around the chemocline [8]. This latter represents a barrier for microbial dispersion as it separates different functional microbial groups [9]. Unique bacterial groups are often correlated with specific depths. For example, cyanobacteria are abundant in oxic layers [4,10], anaerobic phototrophic bacteria are generally associated with the chemocline, and sulfur bacteria can predominate within anoxic layers [11,12,13].
Although the microbial community dynamics has been analyzed in several meromictic lakes worldwide [2,4,6,9,14,15,16,17,18,19,20,21], our current knowledge of the microbiology of the meromictic Lake Faro (Sicily, Italy) remains scarce [3,22,23,24].
In this context, this study was aimed at investigating the spatial (along the water column) and temporal (throughout the year) variations in microbial community structure inhabiting Lake Faro, in order to obtain a more comprehensive understanding of the microbial dynamics in this peculiar environment, and to detect potential correlations between environmental parameters and bacterial community structure. Microbiological results, obtained by applying the Amplified Ribosomal Intergenic Spacer Analysis and the Catalyzed Reporter Deposition-Fluorescence In Situ Hybridization on a monthly basis, were related to the main chemical-physical properties of lake water at each sampling time and depth.

2. Materials and Methods
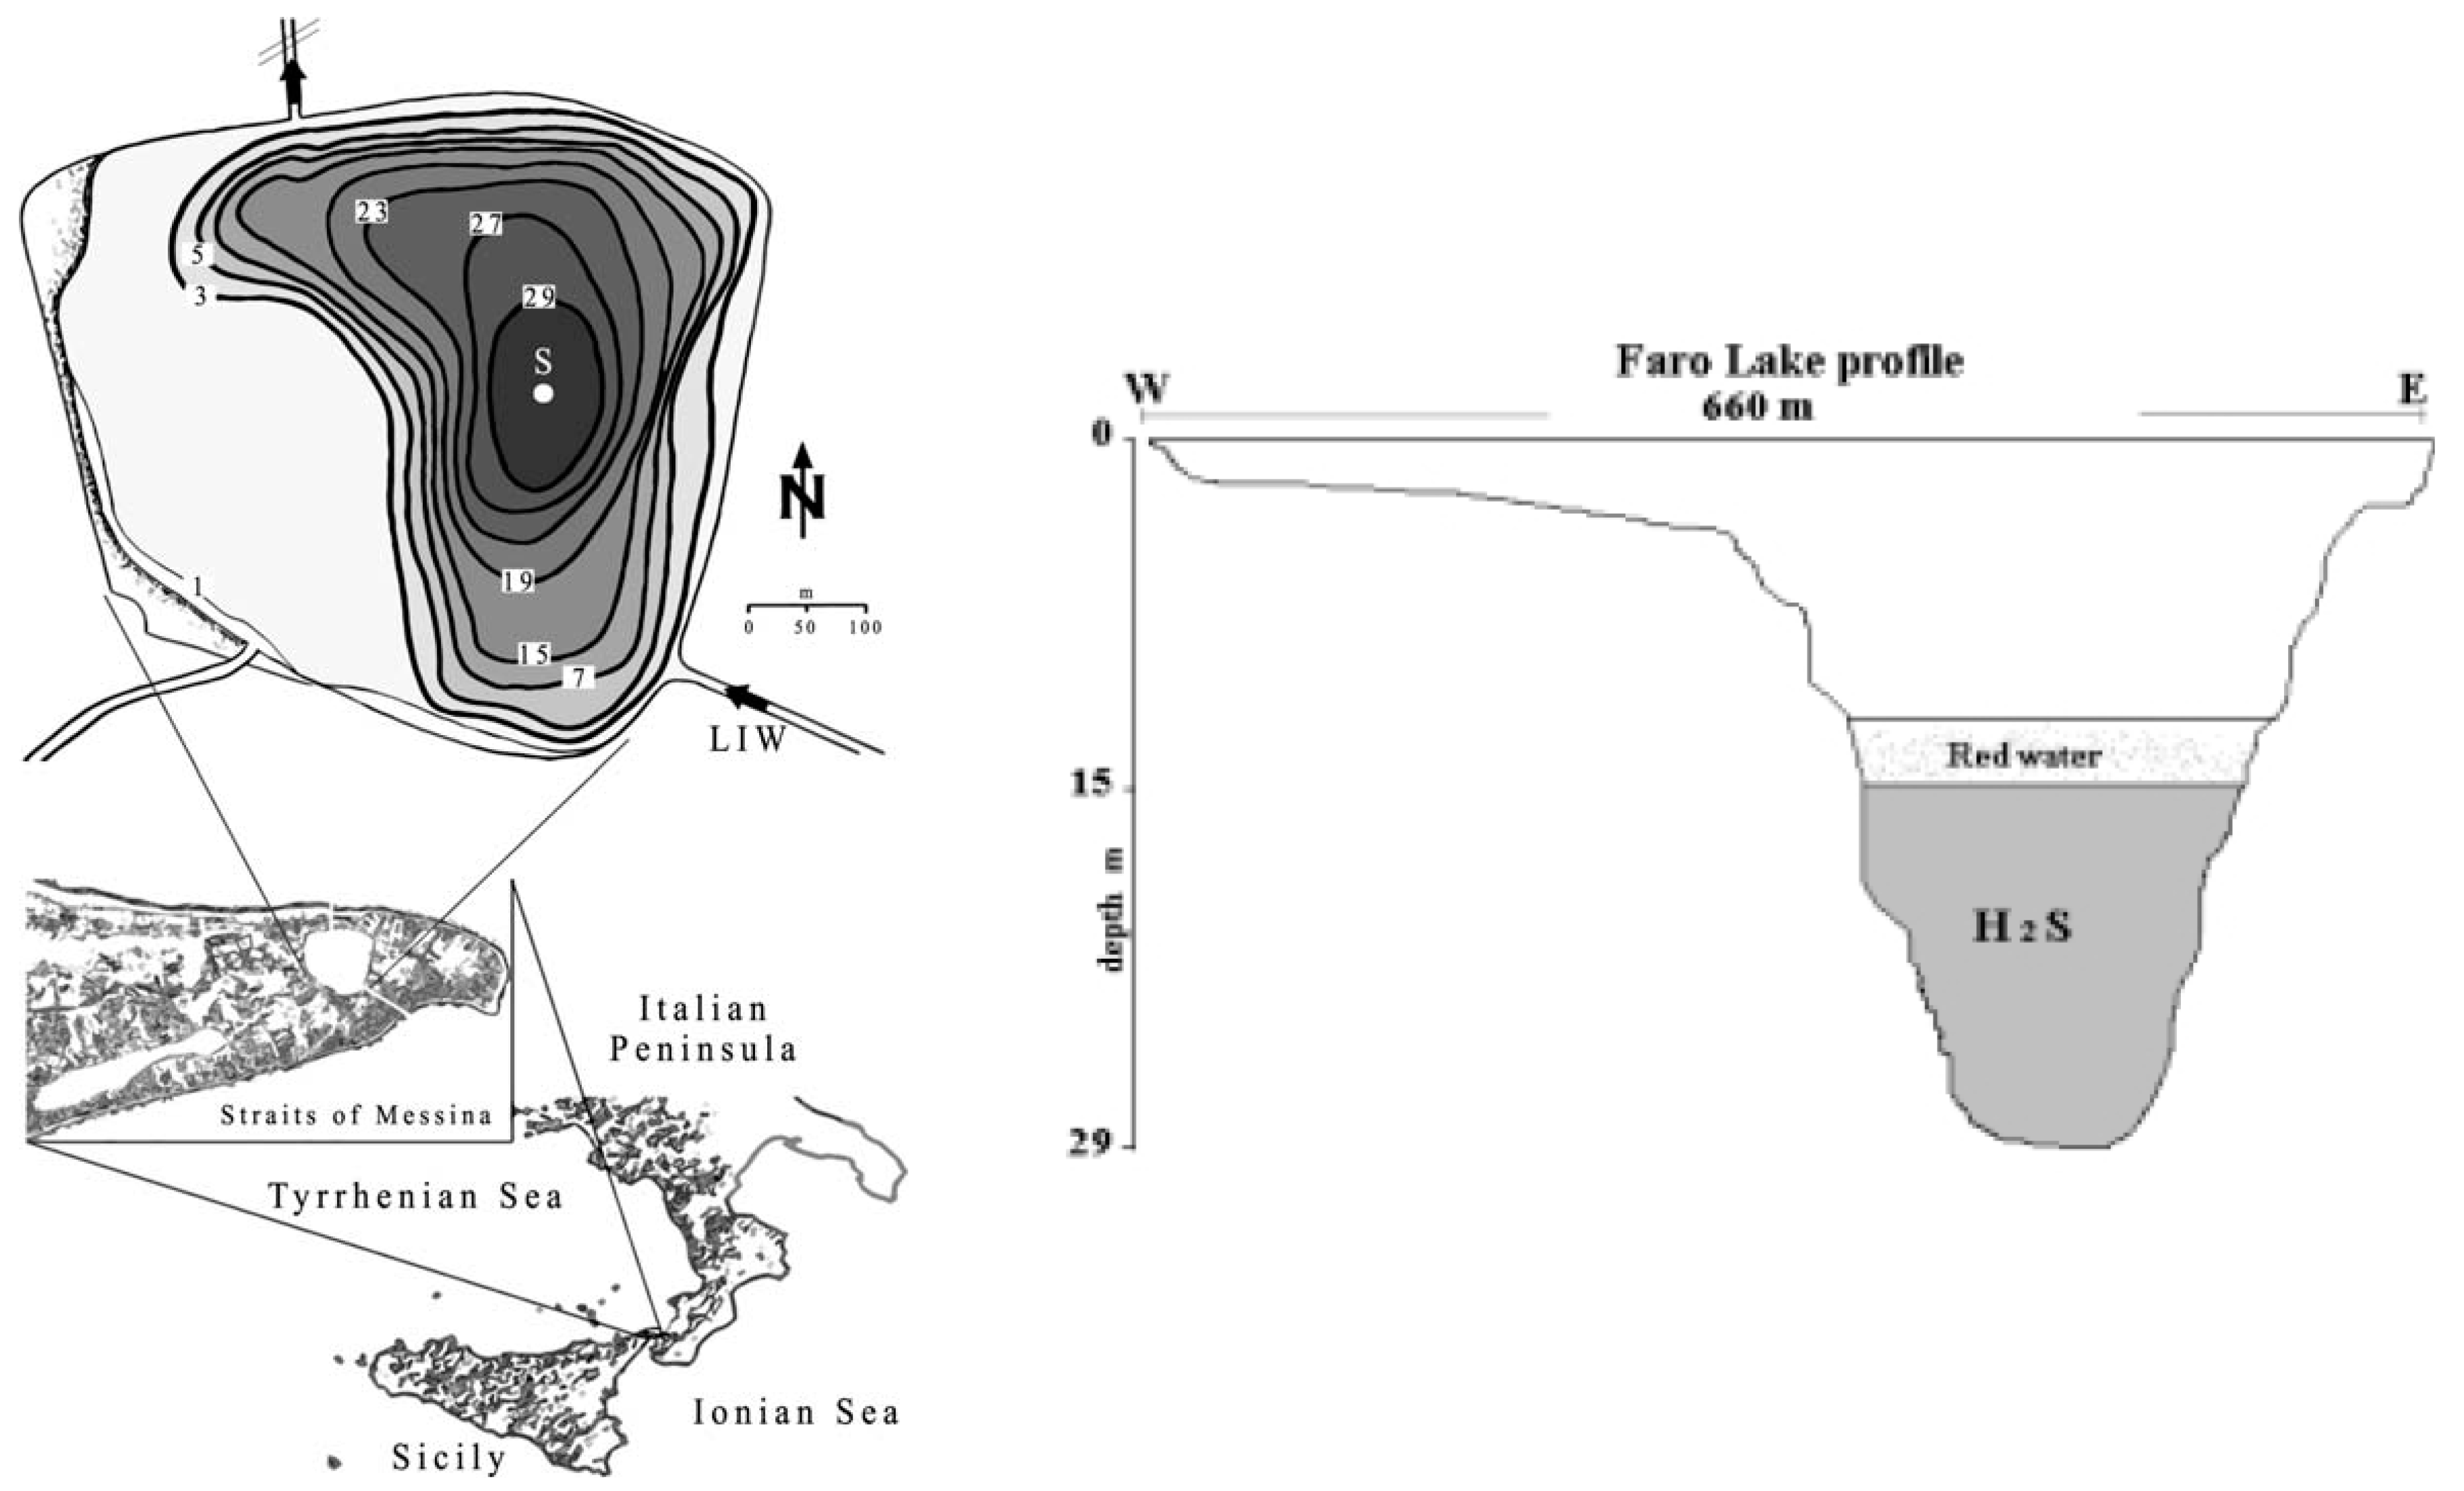
2.1. Study Area

Lake Faro is a small meromictic pond (0.263 km2), located in the northeastern corner of Sicily, Italy, which features a funnel-shape profile, with a steep sloping bottom that declines to a central basin reaching a depth of 29 m (Figure 1).
The lake is connected via a shallow channel to the Straits of Messina, and with the Tyrrhenian Sea via another channel, which is silted up most of the time, and artificially opened for a few days, generally during the hottest summer period establishing, in order to allow water circulation into the lake [23]. Salinity seasonally varies from 34 to 38. The chemical stratification of the water column is almost completely permanent, because of the considerable depth of the lake and reduced water exchange with the sea. The lake shows the typical characteristics of a meromictic lake: an oxygenated mixolimnion (which rarely exceeds 15 m in depth) and a sulfide-rich anoxic monimolimnion separated by a transition layer (chemocline), where the dissolved oxygen concentration decreases sharply with depth.

2.2. Water Sample Collection

Water samples were collected monthly during 2010 in Lake Faro at six depths (i.e., 0, 10, 15, 20, 25, and 29 m) from the surface to the bottom in oxic (mixolimnion), transitional (chemocline) and anoxic layer (monimolimnion) (maximum depth ~29 m). A Niskin bottle pre-treated with a HCl 10 N solution was used for sampling. At each sampling time, chemical and physical parameters were measured on-site by using a portable multiparametric probe (CTD YSI 6600 V2).
Samples were stored in HCl pre-conditioned tanks at 4 °C and processed within two hours after sampling. Nutrient detection (ammonia, nitrites, nitrates, phosphates) and molecular analyses were performed as described below.

2.2.1. Nutrient Analyses

Nutrient analyses were carried out at each sampling time. Ammonia (N–NH4+), nitrites (N–NO2−), nitrates (N–NO3−) and phosphates (P–PO43−) concentrations were estimated by using standard spectrophotometric techniques. All spectrophotometric measurements were performed using a Varian Cary 50 Probe and converting the absorbance into micromoles per liter by applying appropriate factors derived from calibration curves developed for each chemical species.
Anoxic samples were subjected to a pretreatment to remove sulfides by acidifying samples up to pH 2 with 50% H2SO4 (reagent grade, 95–98%), followed by releasing of hydrogen sulfide gas by blowing with N2 for 30 minutes [23]. The procedure was repeated three times.

2.2.2. Ammonia, Nitrites and Nitrates

Ammonia was determined as indophenol blue, which is formed by reaction of ammonia with phenol dissolved in alkaline buffered solution and with the presence of the oxidant hypochlorite and sodium ferrocyanide as a catalyst. After 24 h, spectrophotometer measurements were performed at 630 nm [26].
The concentration of nitrites was determined by reaction with solfanilamide in hydrochloric acid followed by a second reaction with N-(1-naphthyl) ethylenediamine hydrochloride. The absorbance of the diazonium salt thus formed was measured spectrophotometrically at 543 nm after color development [27].
Nitrates were analyzed by the reduction to nitrite on cadmium-copper column at pH 8.0 as described by Wood et al. [28].

2.2.3. Phosphates

The concentration of phosphates was determined spectrophotometrically by reaction with ammonium molybdate and potassium tartrate under acidic conditions. The resulting phosphomolybdic acid was reduced by ascorbic acid and then with the formation of molybdenum blue, which was detected by measuring absorbance at 885 nm [29].

2.2.4. TC/TOC/TN Analyses

Total carbon (TC), total organic carbon (TOC) as NPOC (non-organic carbon purgeable) and total nitrogen (TN) samples were analyzed using a TOC analyzer equipped with N-module of Shimadzu TNM-1. Potassium hydrogen phthalate was used as standard (CT and NPOC), with calibration curve intervals of 10–30–50–100 mg/L; potassium nitrate reagent grade was used as standard for analyses of TN, with calibration curve intervals 0.5–1.0–1.5–2.0 mg/L (high curve) and 0.05–0.10–0.20–0.50 mg/L (low curve).

2.3. Microbial Abundances and Distribution

2.3.1. Total Counts

Total counts were determined at each sampling time. Subsamples (1–5 mL) were fixed at room temperature with a paraformaldehyde solution (final concentration, 2%) [30], filtered on black polycarbonate membranes (Isopore; pore size, 0.22 µm; diameter 25 mm) and kept frozen until processing. Counts of DAPI-stained cells (4’,6-diamidino-2-phenilindole, Sigma; final concentration 5 µg/mL) were carried out by epifluorescence microscopy. More than 300 cells per sample were counted in randomly selected eye-fields. Results were expressed in cells/mL.

2.3.2. Automated Ribosomal Intergenic Spacer Analysis (ARISA)

Genomic DNA for ARISA was extracted using the Ultra Clean Soil DNA Ex167 traction Kit (MoBio) as recommended by Stepanauskas et al. [31] and Luna et al. [32]. The quality of DNA samples was estimated by electrophoresis on agarose gel (0.8%) and quantitative estimation was determined by measuring at the nanodrop® ND-1000 (ThermoFisher Scientific, Waltham, MA, United States).
Extracted DNA was amplified in duplicate by using the bacteria-specific primers ITSReub (5’-GCCAAGGCATCCACC-3’) and ITSF (5’-GTCGTAACAAGGTAGCCGTA-3’) [33], with the latter being labeled with the phosphoramidite dye FAM. Normalized DNA quantities of 25 ng per reaction were used to perform PCR reactions as described by Ramette [34]. PCR was carried out with an initial denaturation step at 94 °C for 3 min, followed by 30 cycles of 94 °C for 45 s, 55 °C for 45 s, 72 °C for 90 s, with a final extension at 72 °C for 5 min. A standardized amount of amplified DNA (100 ng of DNA, as determined spectrophotometrically) was added to a separation mix containing 0.5 µL of internal size standard Map Marker 1000 ROX (50–1000 bp), 0.5 µL of tracking dye and 14 µL of deionized Hi-Di formamide. The preparation was denatured 3 min at 95 °C and kept on ice at least 5 min before being further processed by the sequencer as described by Ramette [34]. ARISA profiles were obtained and processed as described by Porporato et al. [35]. Briefly, only peaks ranging from 350 bp and 1300 bp were considered, and the detection threshold applied to the ARISA profiles was 0.2% of the total fluorescence. The peak heights of all the ARISA profiles collected were standardized following the procedures described by Dunbar et al. [36].

2.3.3. Catalyzed Reporter Deposition–Fluorescence In Situ Hybridization (CARD-FISH)

At each sampling time, on the basis of the measured physical and chemical parameters, three samples (i.e., representatives of mixolimnion, chemocline and monimolimnion layers) were selected to examine the spatial and temporal distribution of microbial communities throughout the different lake layers by CARD-FISH. The probes used in this study are listed in the Supplementary Table S1 [37,38,39,40,41,42,43,44,45]. Subsamples were fixed with a paraformaldehyde solution (final concentration, 2%) for one hour at room temperature. Aliquots (2–5 mL) of subsample aliquots were filtered at low pressure (200 mbar) onto 0.22 μm polycarbonate membranes (type GTTP; diameter, 47 mm), and all membranes were stored at −20 °C until further processing. Membranes were cut into sections and embedded in agarose gel (0.2%, w/v; gel strength 300 g/cm2). Bacterial cells were permeabilized by a lysozyme solution (10 mg/mL) for one hour at 37 °C. Endogenous peroxidases were inactivated by using 0.01 M HCl at room temperature for 10 min. Hybridization was performed according to the protocol by Pernthaler and Amann [46]. After the hybridization and amplification steps, filter sections were washed twice in 96% ethanol before drying, then counterstained with DAPI (1 μg/mL, m/v) and mounted on a glass slide with Citifluor and Vectashield in a 4:1 (v/v) proportion. Counts were performed by using a Zeiss epifluorescence microscope, by enumerating at least 500 DAPI-stained cells in 20 fields covering an area of 100 μm × 100 μm each.

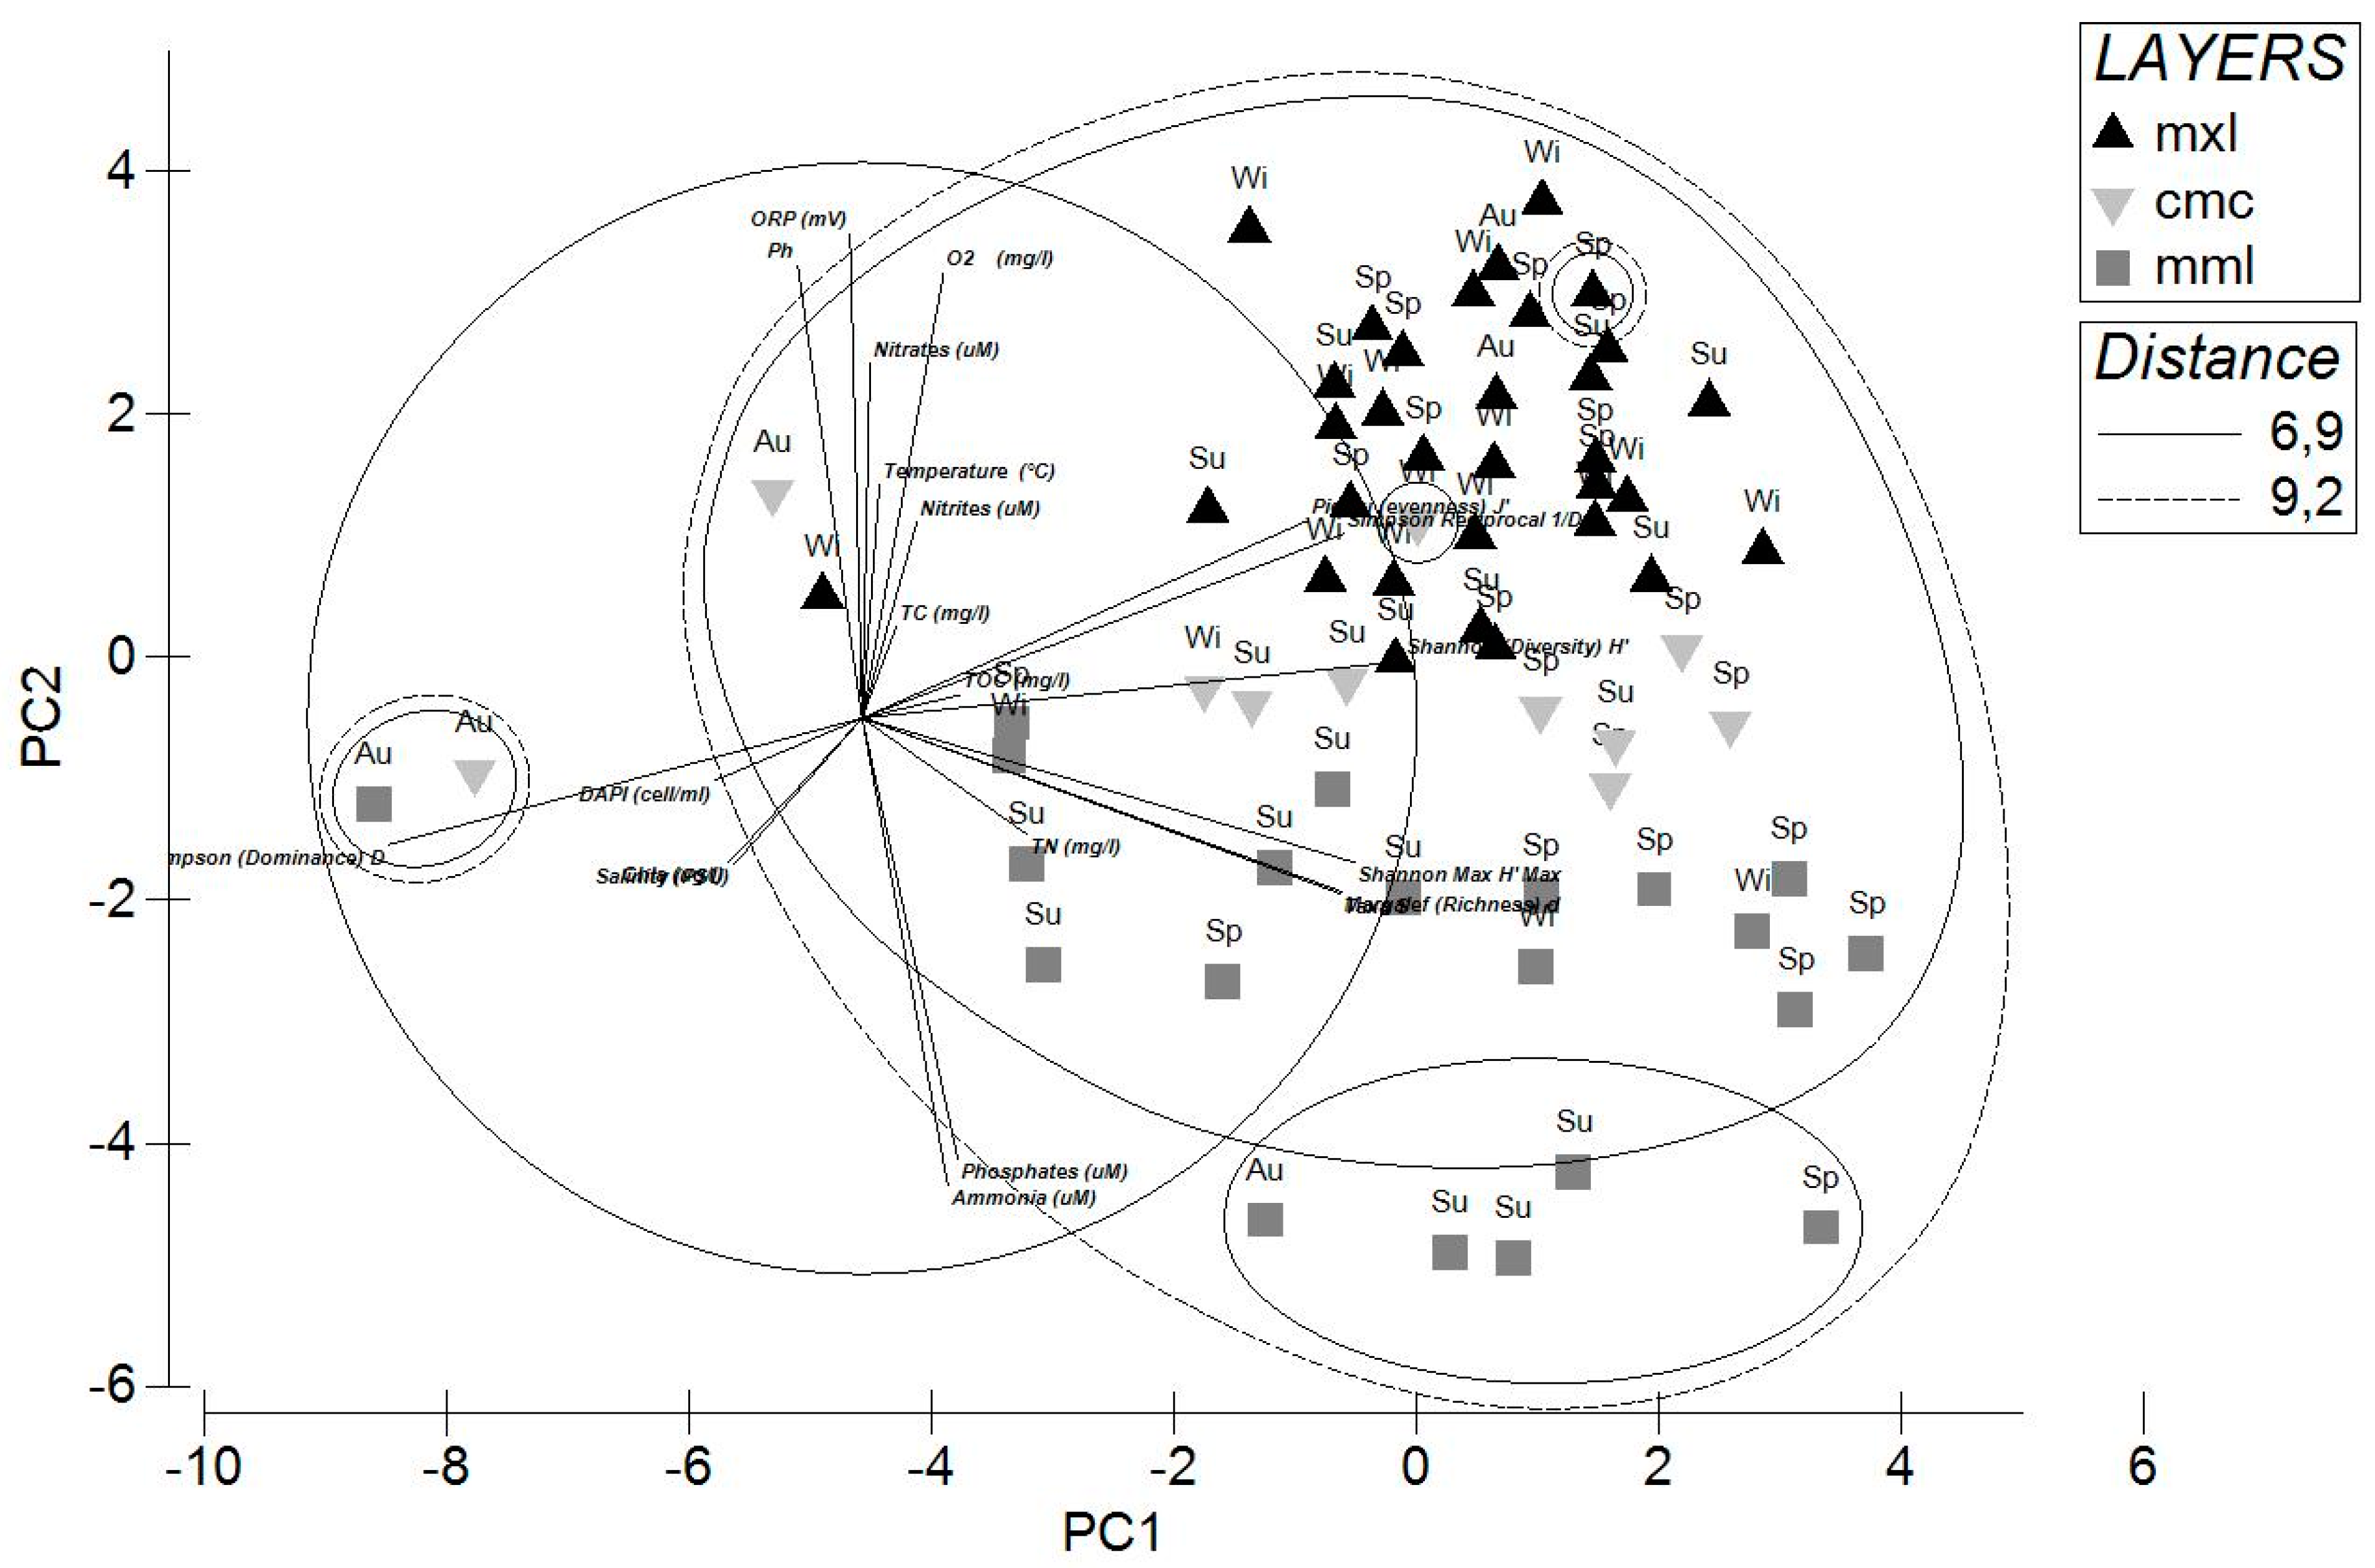
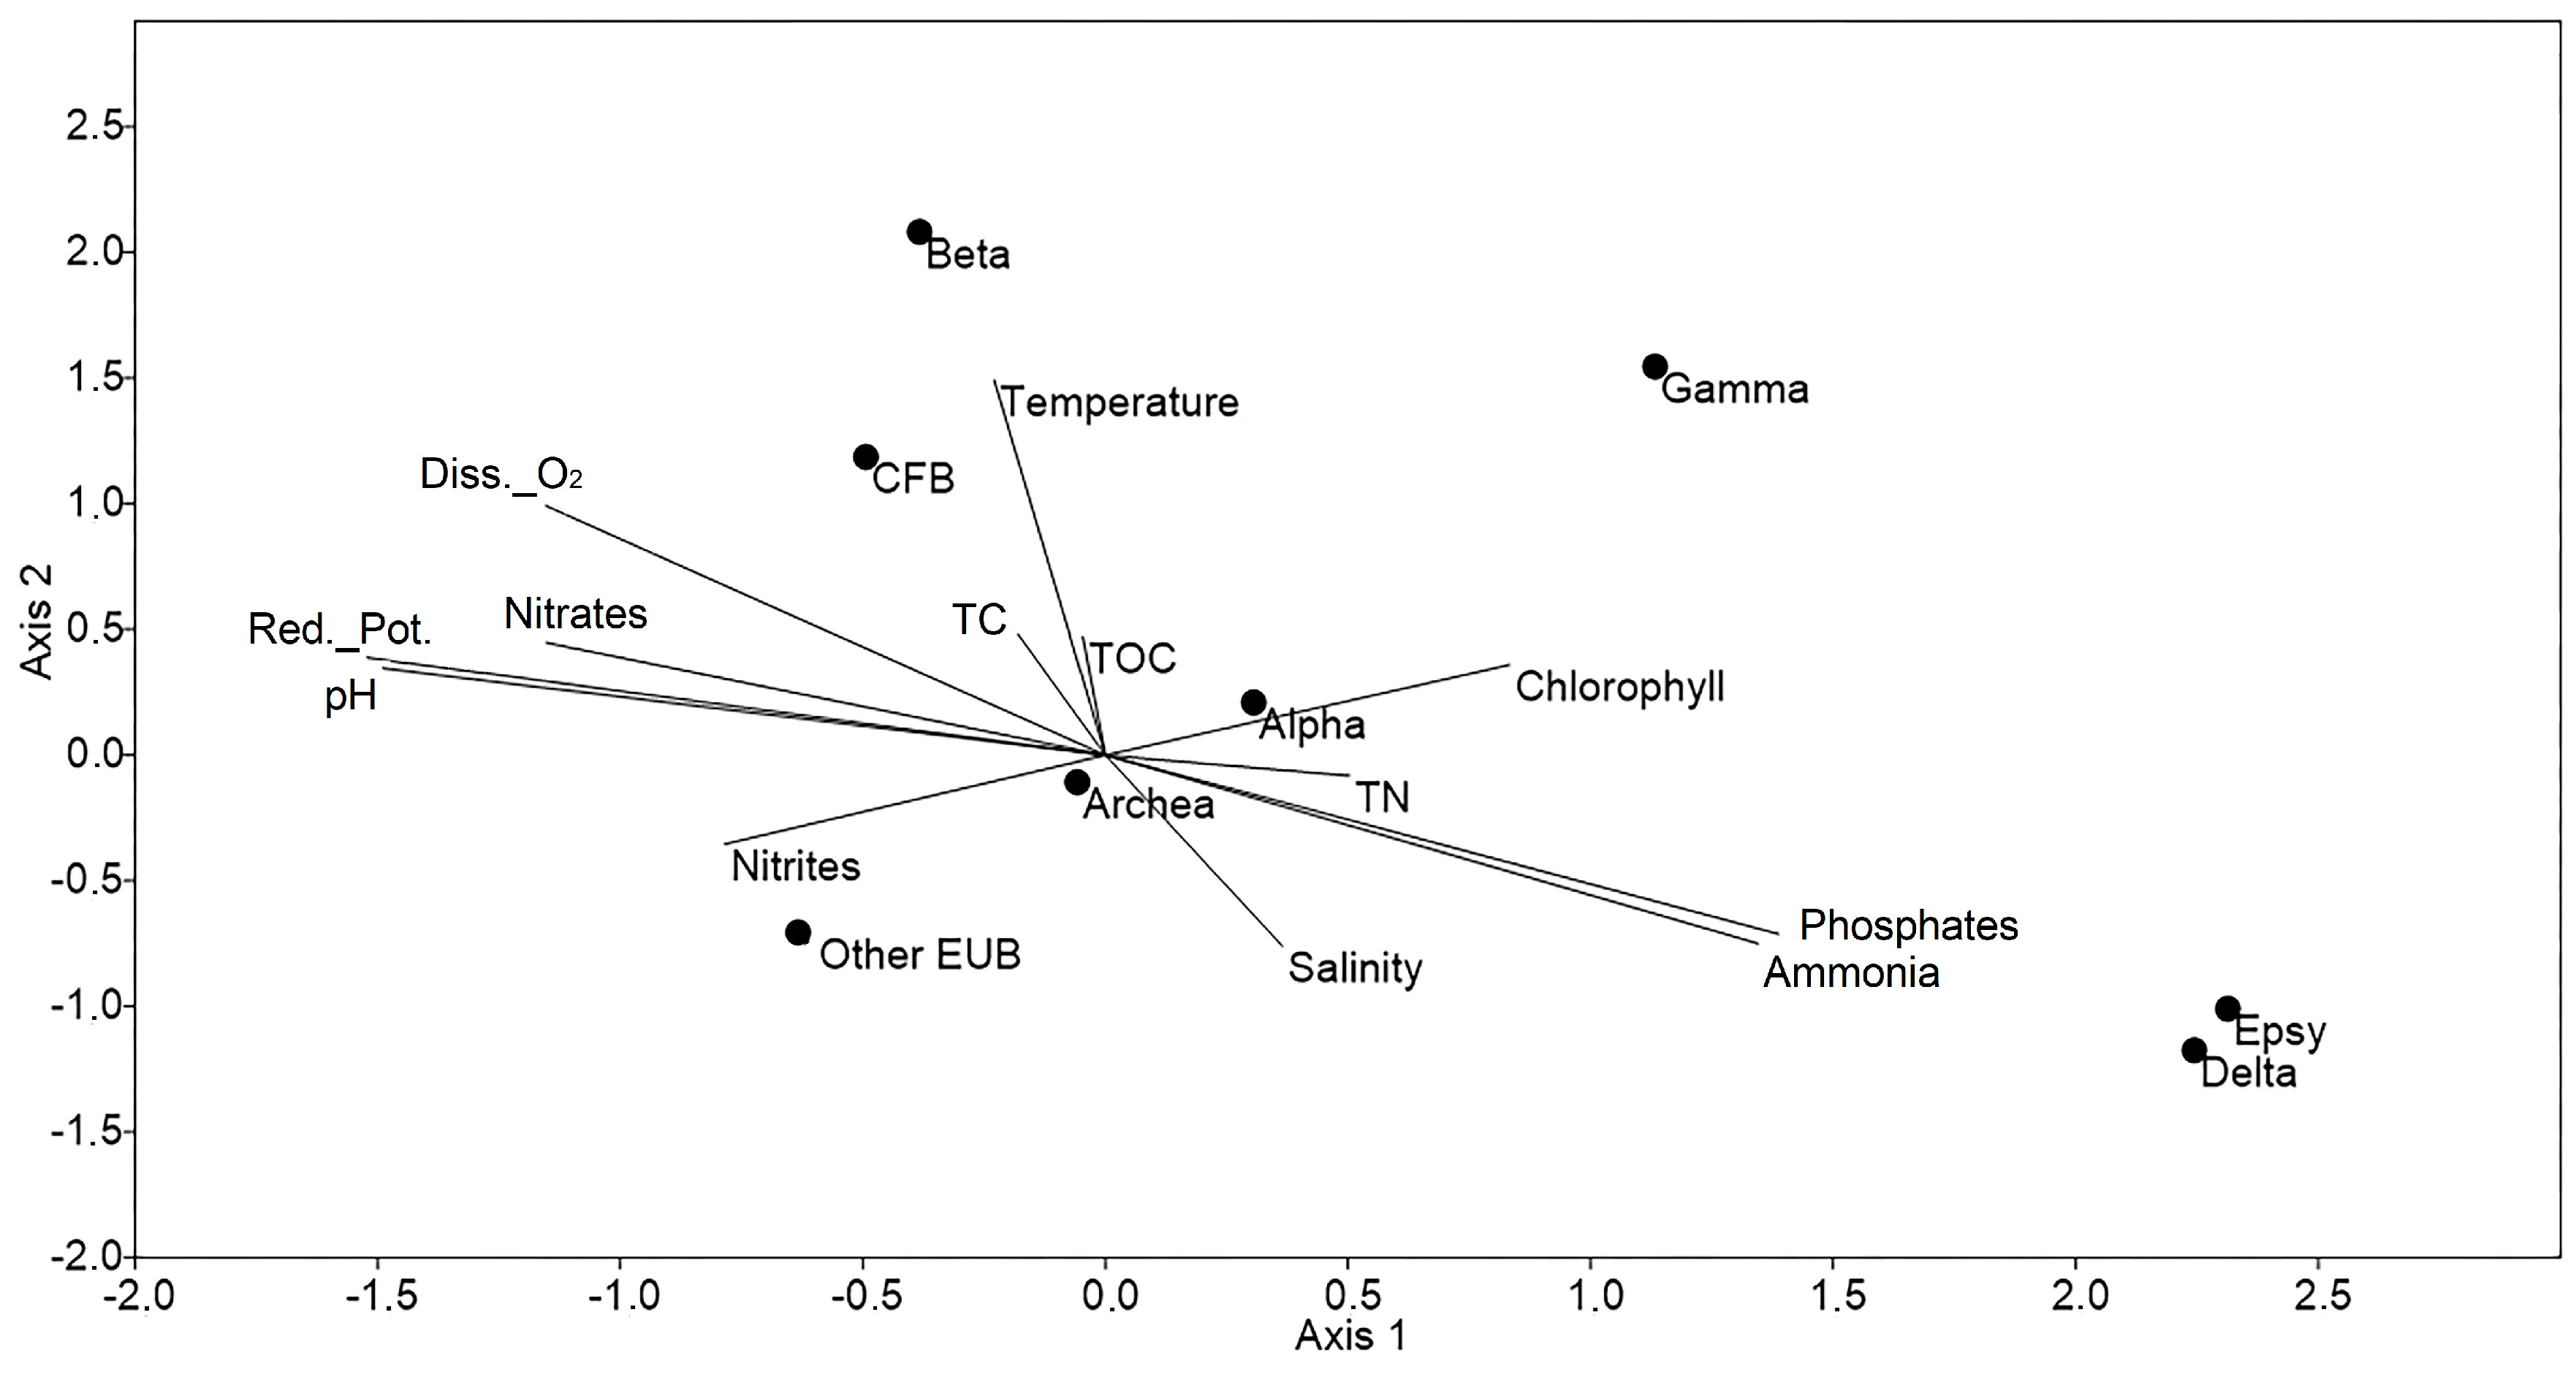
2.4. Statistical Analyses

Microbial community diversity, as determined by ARISA, was expressed by calculating the Shannon-Wiener index (H’) and the evenness (Pielou index, J) [47]. These calculations were performed using Primer 6 Plymouth Marine Laboratory, Roborough, United Kingdom. For these calculations, it was assumed that the number of peaks represented the species number (phylotype/genotype richness) and that the band intensity peak height represented the relative abundance of each bacterial species.
Not-metric multi-dimensional scaling (nMDS) (Primer 6 Plymouth Marine Laboratory, Roborough, United Kingdom) was used to verify the influence of layer factor and season factor on the whole data set obtained from ARISA. Additional similarity percentage (SIMPER) routine and not-metric multi-dimensional scaling (nMDS) analysis were computed using CARD-FISH results. Analysis of similarities (ANOSIM) was carried out in order to assess statistical differences between bacterial community structures in multivariate data sets. A Monte Carlo randomization was used to test the statistical significance of R. The Similarity percentages (SIMPER) routine in Primer 6 was used to identify the species responsible for particular aspects of the multivariate structure found in the Bray–Curtis similarity matrix.
Principal component analysis (PCA) was used to evaluate similarities between communities, and Canonical Correspondence Analysis (CCA) was finally performed with the software Past (PAleontological Statistics) software package for education and data analysis (version 3.0) [48], in order to explore possible contributions of environmental parameters to community structure.

3. Results

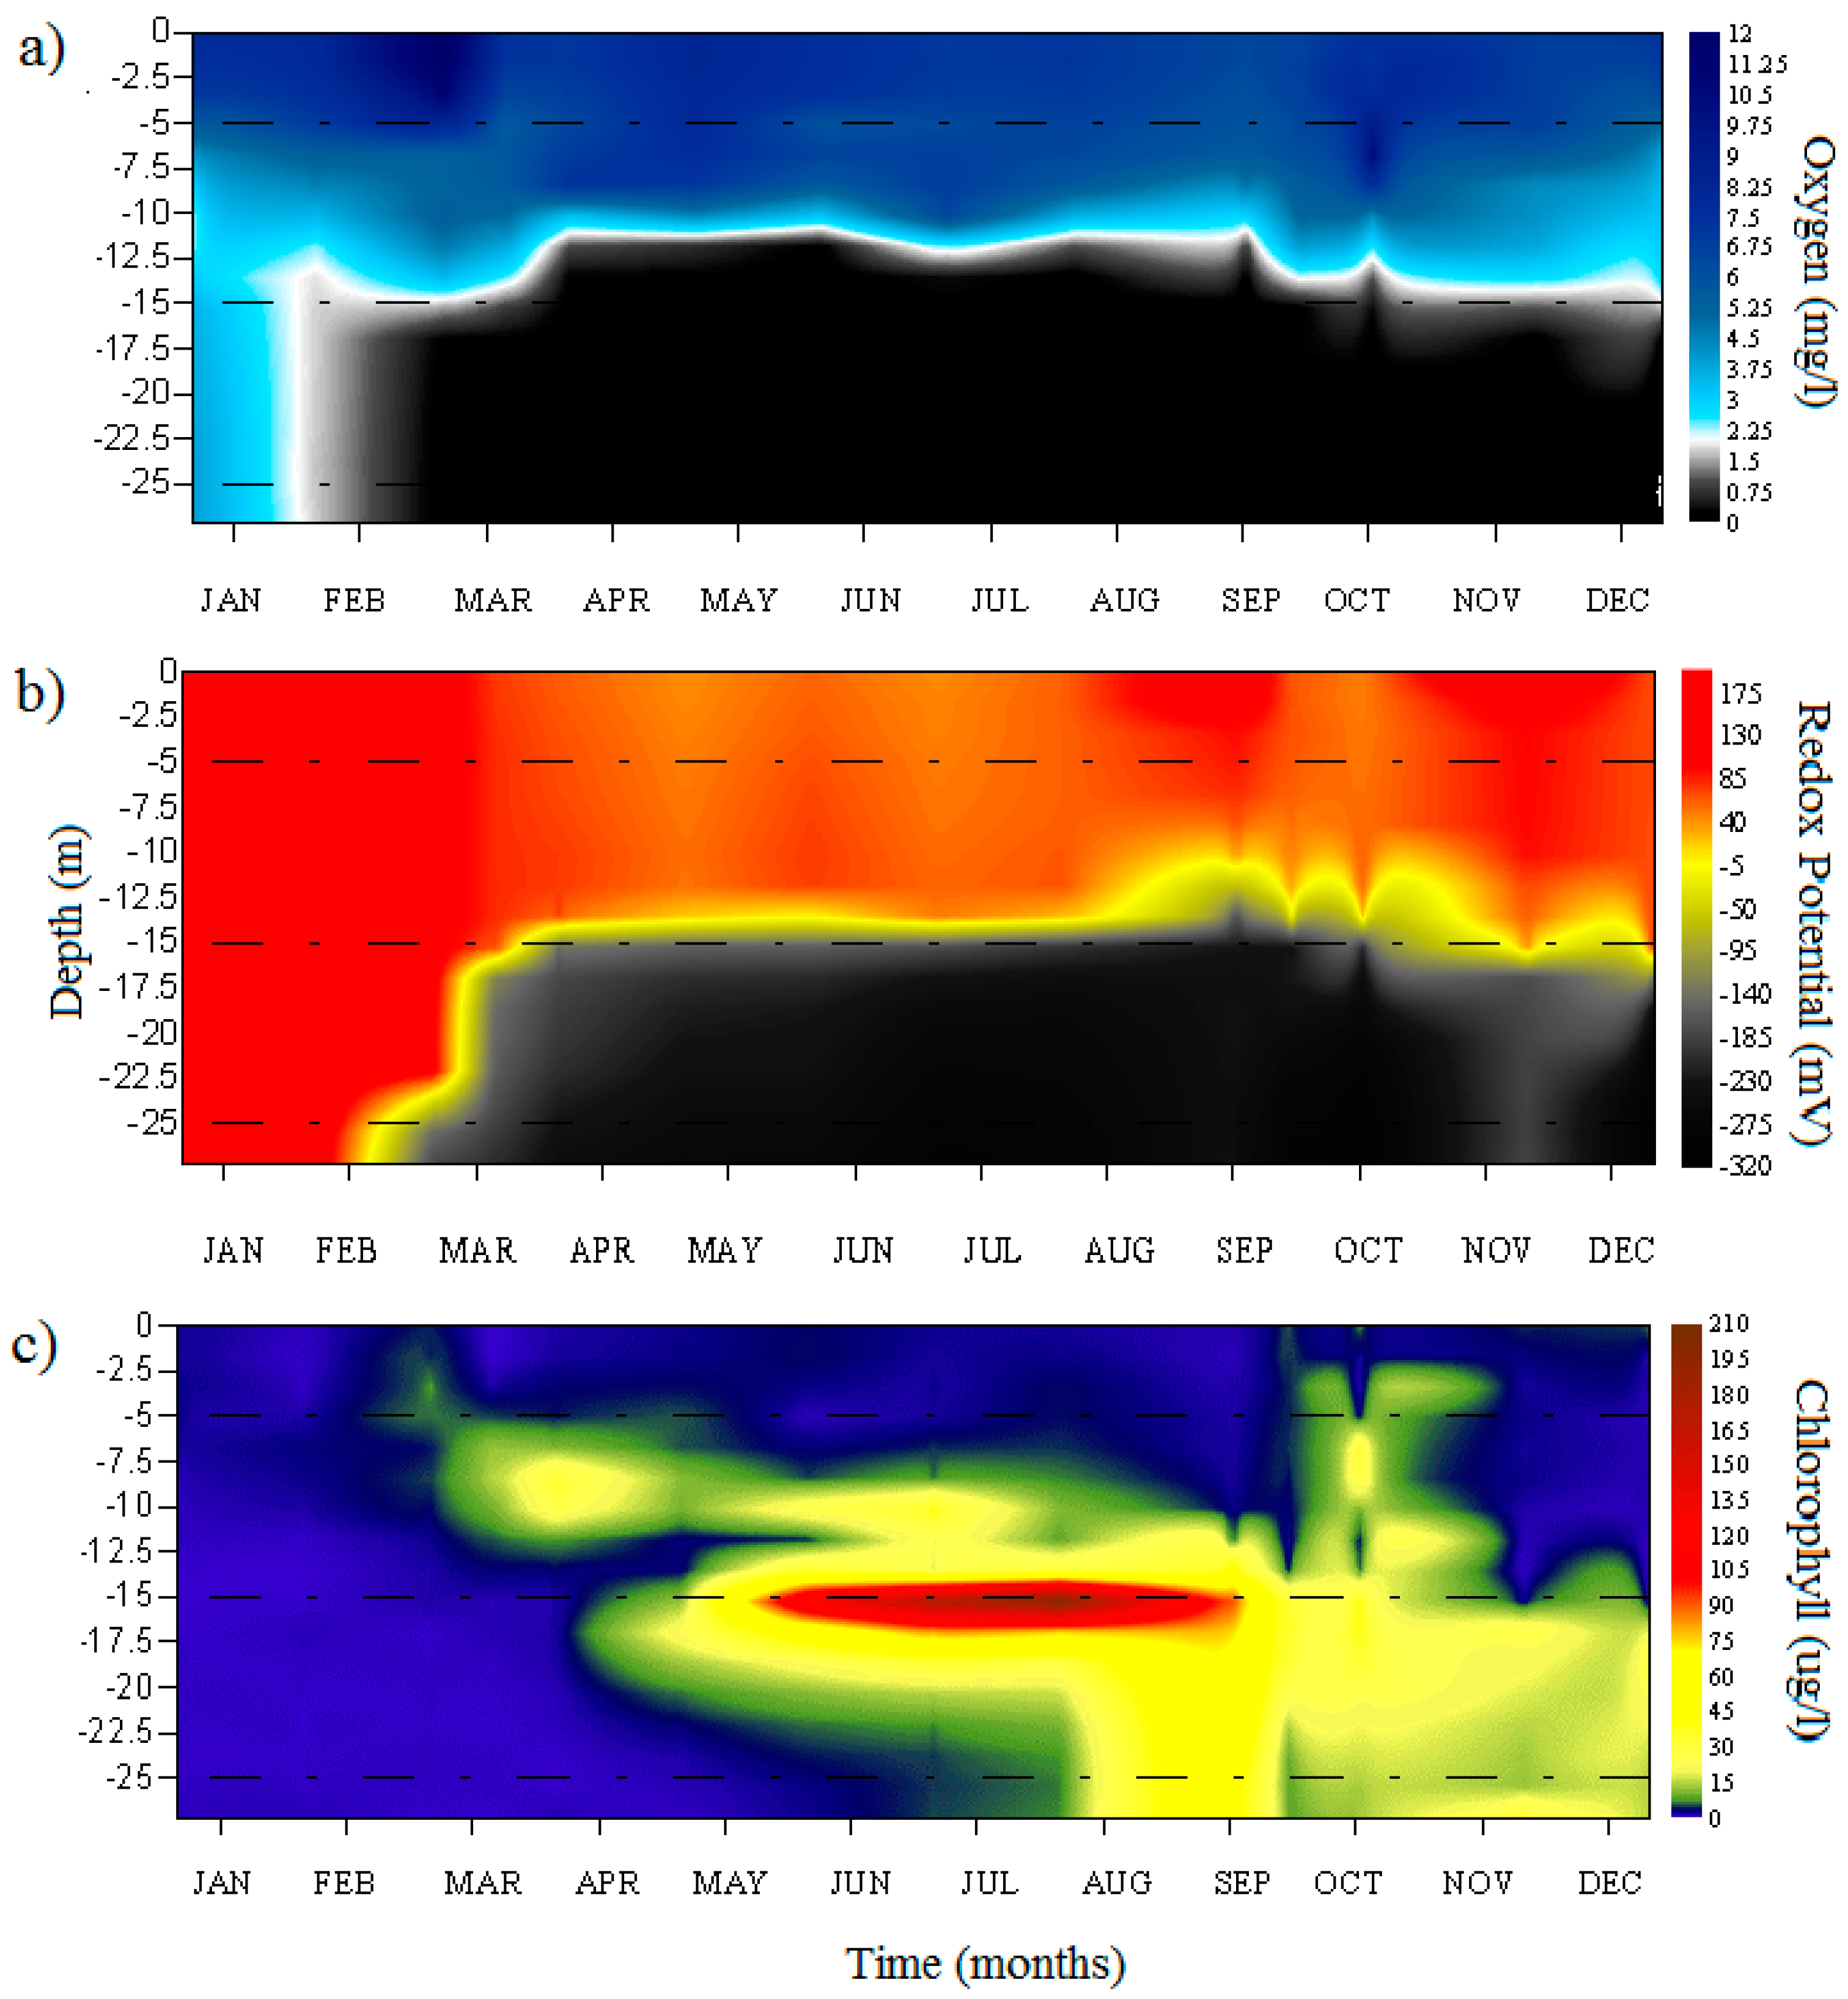
3.1. Environmental Parameters

Oxic and anoxic layers of Lake Faro differed in several hydrological parameters. Dissolved oxygen (Figure 2a) and redox potential (Figure 2b) profiles showed that the interface between oxic and anoxic layers was located at a depth ranging from 12 to 24 m in the period between March and December 2010. In particular, the anoxic layer disappeared in January and February, due to the mixing of the water column. With the exception of January and February, the redox potential showed a very strong stratification during the entire sampling period. The highest values were detected between 0 and 5 m, where it was about 50 mV, with a maximum of 175 mV. In spring-summer period an inversion from positive to strongly negative values (−195 mV) occurred between 15 m and the bottom, reaching values of up to −300 mV. A strong stratification was also observed for dissolved oxygen, so that in the spring period, the water column appeared clearly divided into three layers: an upper mixolimnion (0 to 5 m), where the dissolved oxygen concentration never dropped below 6 mg/L; a chemocline (12–14 m), where oxygen underwent a sudden reduction down to zero; and a lower layer (from 13–15 m up to the bottom) that was totally oxygen-free. Interestingly, in the period of September–December the chemocline progressively decreased from about 11 to about 14 m. The highest value recorded during the sampling period was found at 3 m in March (12 mg/L). Chlorophyll was absent during January and February, in both the oxic and anoxic layers, but a persistent layer occurred in March below 5 m and was maintained in the following months with a concentration ranging from 15 to 45 µg/L (Figure 2c). In the upper layer, the minimum value was <5 µg/L, but below, values rapidly increased, showing a peak of about 200 µg/L at around 15 m that rapidly decreased in September to 20 µg/L.
Temperature in the mixolimnion followed a well-defined seasonal trend. Conversely, it was quite stable at higher depths, especially below 20 m (Supplementary Materials Figure S1a). In January and February, the temperature was constant along the water column, with slightly lower values than were achieved at 0 m (12 °C). The largest fluctuations were observed in the surface layers (0–15 m), where temperature underwent a progressive increase in the warm season, reaching its maximum value of 28 °C at the surface in August.
The salinity ranged from 33.8 to 38.6 (Supplementary Materials Figure S1b). It was lower in the oxic layer, with the only exception being the summer period, during which it achieved a maximum value of 38.6 in August. In the anoxic layer, the salinity was maintained between 36.6 and 33.4 until July.
The density profile (calculated from temperature and salinity values) became progressively more stable along the water column until the end of August, with an increase in the gradient from the surface up to 7 m (Supplementary Materials Figure S1c). As was observed for the temperature profile, an increased homogeneity was observed in the first 15 m from the beginning of September, and most markedly in October. The deepest part of the water column (<13 m) was characterized by density values ranging from 28 and 27.5 for the entire sampling period.

3.2. Nutrient Concentration

Generally, nutrient concentrations increased from the oxic to the anoxic layer, showing some fluctuations across the water column.

3.2.1. Ammonia, nitrites and nitrates

Ammonia presented an irregular pattern, with a distribution correlated with the height of monimolimnion, a highly reducing compartment (Supplementary Materials Figure S2a). Lower values (<5 µM) were detected in the mixolimnion (0–5 m), with the exception of the first months of 2010, when the mixing drove nutrients from the bottom up to the rest of water column, of up to 25 µM. The highest peaks were found in August, with a concentration of 120 µM near the bottom, at 25 m. Around the chemocline, the ammonia concentration was about 10–15 µM, with higher values during the summer period.
Nitrites were always absent in the water from 15 m to the bottom, and concentrations at 13 m appeared null or modest at all sampling dates (Supplementary Materials Figure S2b). The highest values were generally observed at 10 m, but the maximum peak was detected in February at 25 m (1.22 µM). Nitrates were always relatively low at 15 m depth, and absent below 20 m (Supplementary Materials Figure S2c). During January and February, the concentration of nitrates was almost homogeneous, slightly increasing near the bottom. The highest concentration (45 µM) was observed in December at 10 m.

3.2.2. Phosphates

Phosphates showed a trend with depth, with the highest values always determined at 25 m. In the mixolimnion layer the concentration was very low (about 0.04–3 µM) (Supplementary Figure S2d). The concentration of phosphates in the anoxic layer showed an overall upward trend during the period of investigation, with the highest concentrations found in September in the monimolimnion layer at 25 m (19.87 µM).

3.2.3. TC/TOC/TN Analyses

A peak in total carbon (TC) concentration was observed in April, with 61.85 mg/L in the mixolimnion layer. Generally, a strong reduction of TC along depth was observed during spring months, while a slight increase in TC concentration occurred between mixolimnion and monimolimnion during summer months. The peaks of TC corresponded to the higher concentrations of total organic carbon (TOC), which in April reached the maximum concentration of about 46 mg/L in the mixolimnion. Finally, the highest concentrations of total nitrogen (TN) were observed in the mixolimnion during April and October (2.51 and 3.11 mg/L, respectively), and in the monimolimnion during March and July (3.35 and 3.67 mg/L, respectively).

3.3. Microbial Abundances and Distribution

3.3.1. Total Counts

Vertical variations in microbial abundance during the examined period are shown in Supplementary Figure S3. Total microbial abundance, detected after DAPI-staining, was generally higher in the mixolimnion than in the monimolimnion, although the maximum peaks were generally detected in the chemocline. The highest values in the mixolimnion were found in the period between February and July between 0 and 13 m, and ranged from 1.51 to 5.36 × 10⁶ cells/mL (maximum reached in June at 12 m). In the chemocline, the microbial abundance was variable throughout the whole period, with values from 1.4 to 9.3 × 10⁶ cells/mL, with the latter determined in June at 15 m. From August to September, a denser layer in microbial abundance was observed at around 14 m in the chemocline layer. The highest abundance (7.33 × 10⁶ cells/mL) was determined in the monimolimnion in June.

3.3.2. Microbial Community Structure Determined with ARISA

The computation of diversity indices (Supplementary Table S2) showed that diversity values were quite similar among the three layers throughout the whole year, while some differences occurred in richness indices. Indeed, during the cold months, richness appeared quite stable throughout the water column, but in the spring and summer months, the deeper layer showed a stronger increase.
The nMDS was computed on ARISA data considering layer (mixolimnion, chemocline and monimolimnion) and season (Winter, Spring, Summer and Autumn) as variables, as shown in Supplementary Figure S4a,b, respectively. Figure S4a shows a clearer separation between mixolimnion and monimolimnion, and in Figure S4b, the Summer and Spring clusters are overlapped, while constituting defined groups, and the Autumn cluster is shown to be a distinct group. ANOSIM was computed using the same factors (i.e., layer and season), and the results show a global difference between the two configurations (layer factor: global R = 0.39, significance level = 0.1%; season factor: global R = 0.31; significance level = 0.1%). The most significative differences were detected between mixolimnion and monimolimnion with R= 0.51 and significance level = 0.1% in the pairwise test for the layer factor. For the season factor, the differences were mainly found between Spring and Autumn, with R = 0.51 and significance level = 0.1%. The structuring of the microbial communities appeared to be influenced by both the stratification of the water column and the different seasons.
A PCA plot (Figure 3) was computed combining ARISA data, diversity indices, chemical-physical parameters, DAPI counts and nutrient concentrations. It showed that PC1 and PC2 explain 78.5% of the variability. PC1, representing 27.5% of the total variability, consisted mainly of biological variables as the statistical indices. In particular, the Shannon (Diversity) PC2, which represented an additional 50.8%, was mainly constituted by Redox Potential Ammonia concentration.

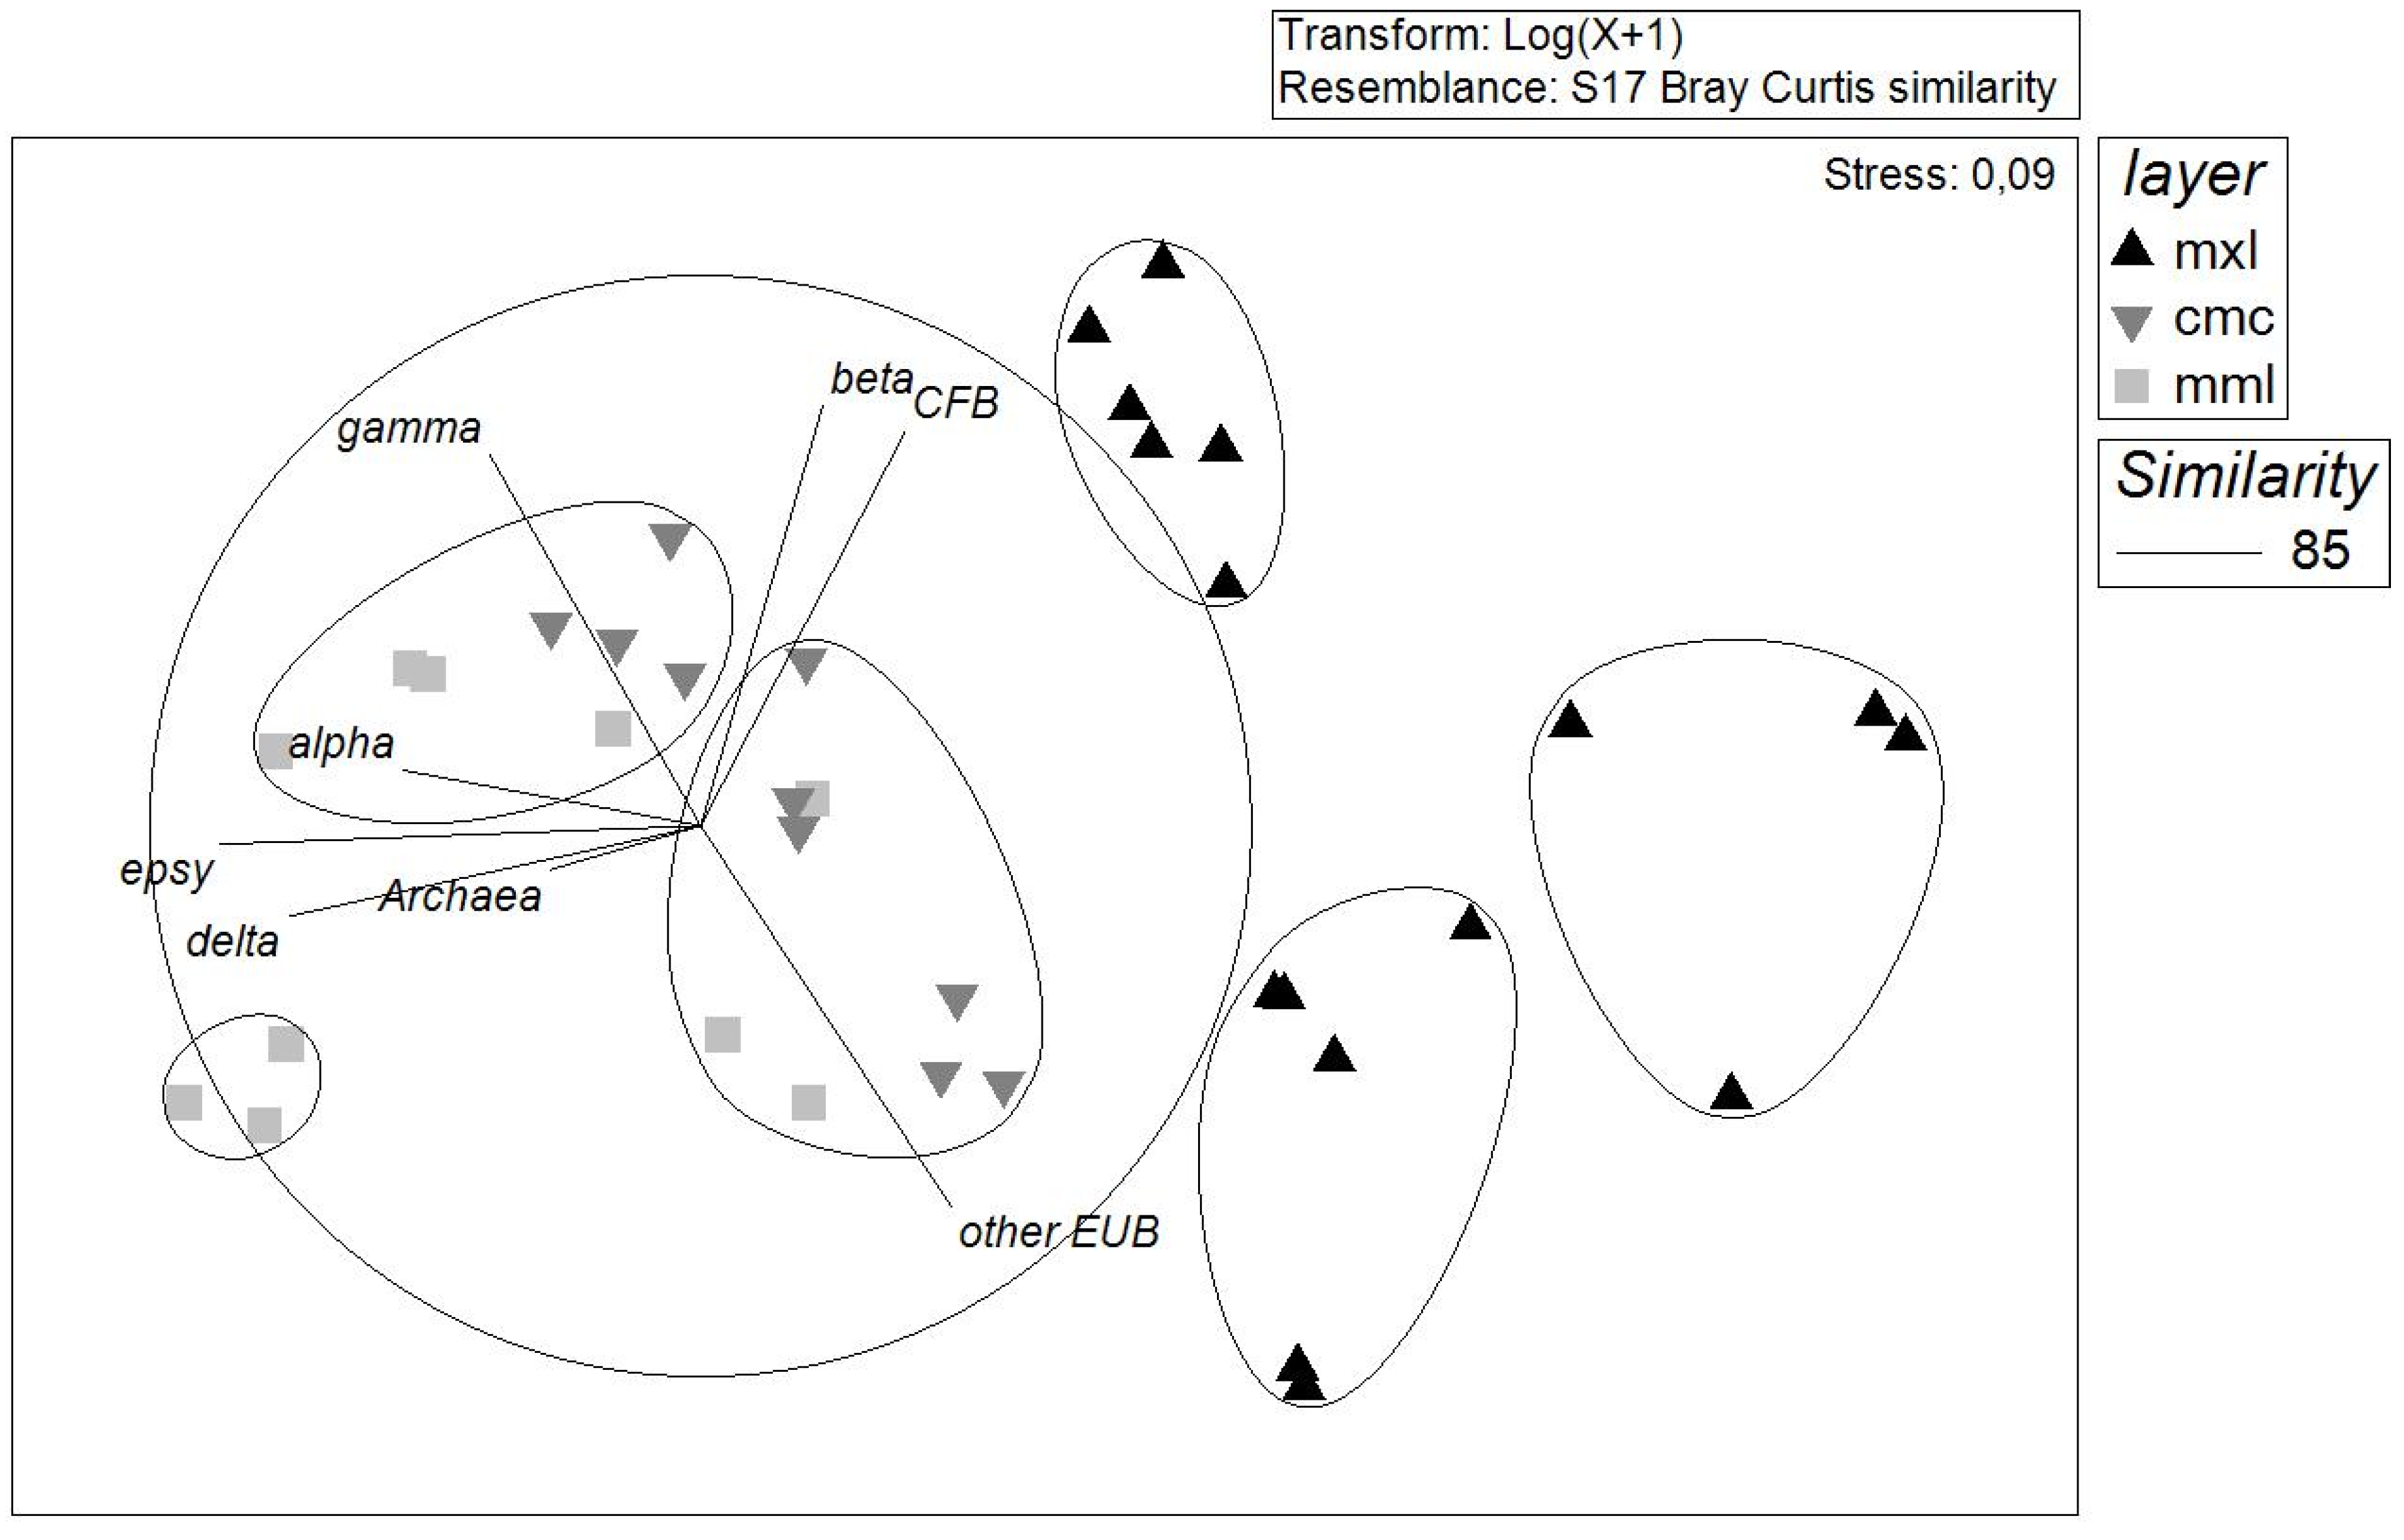
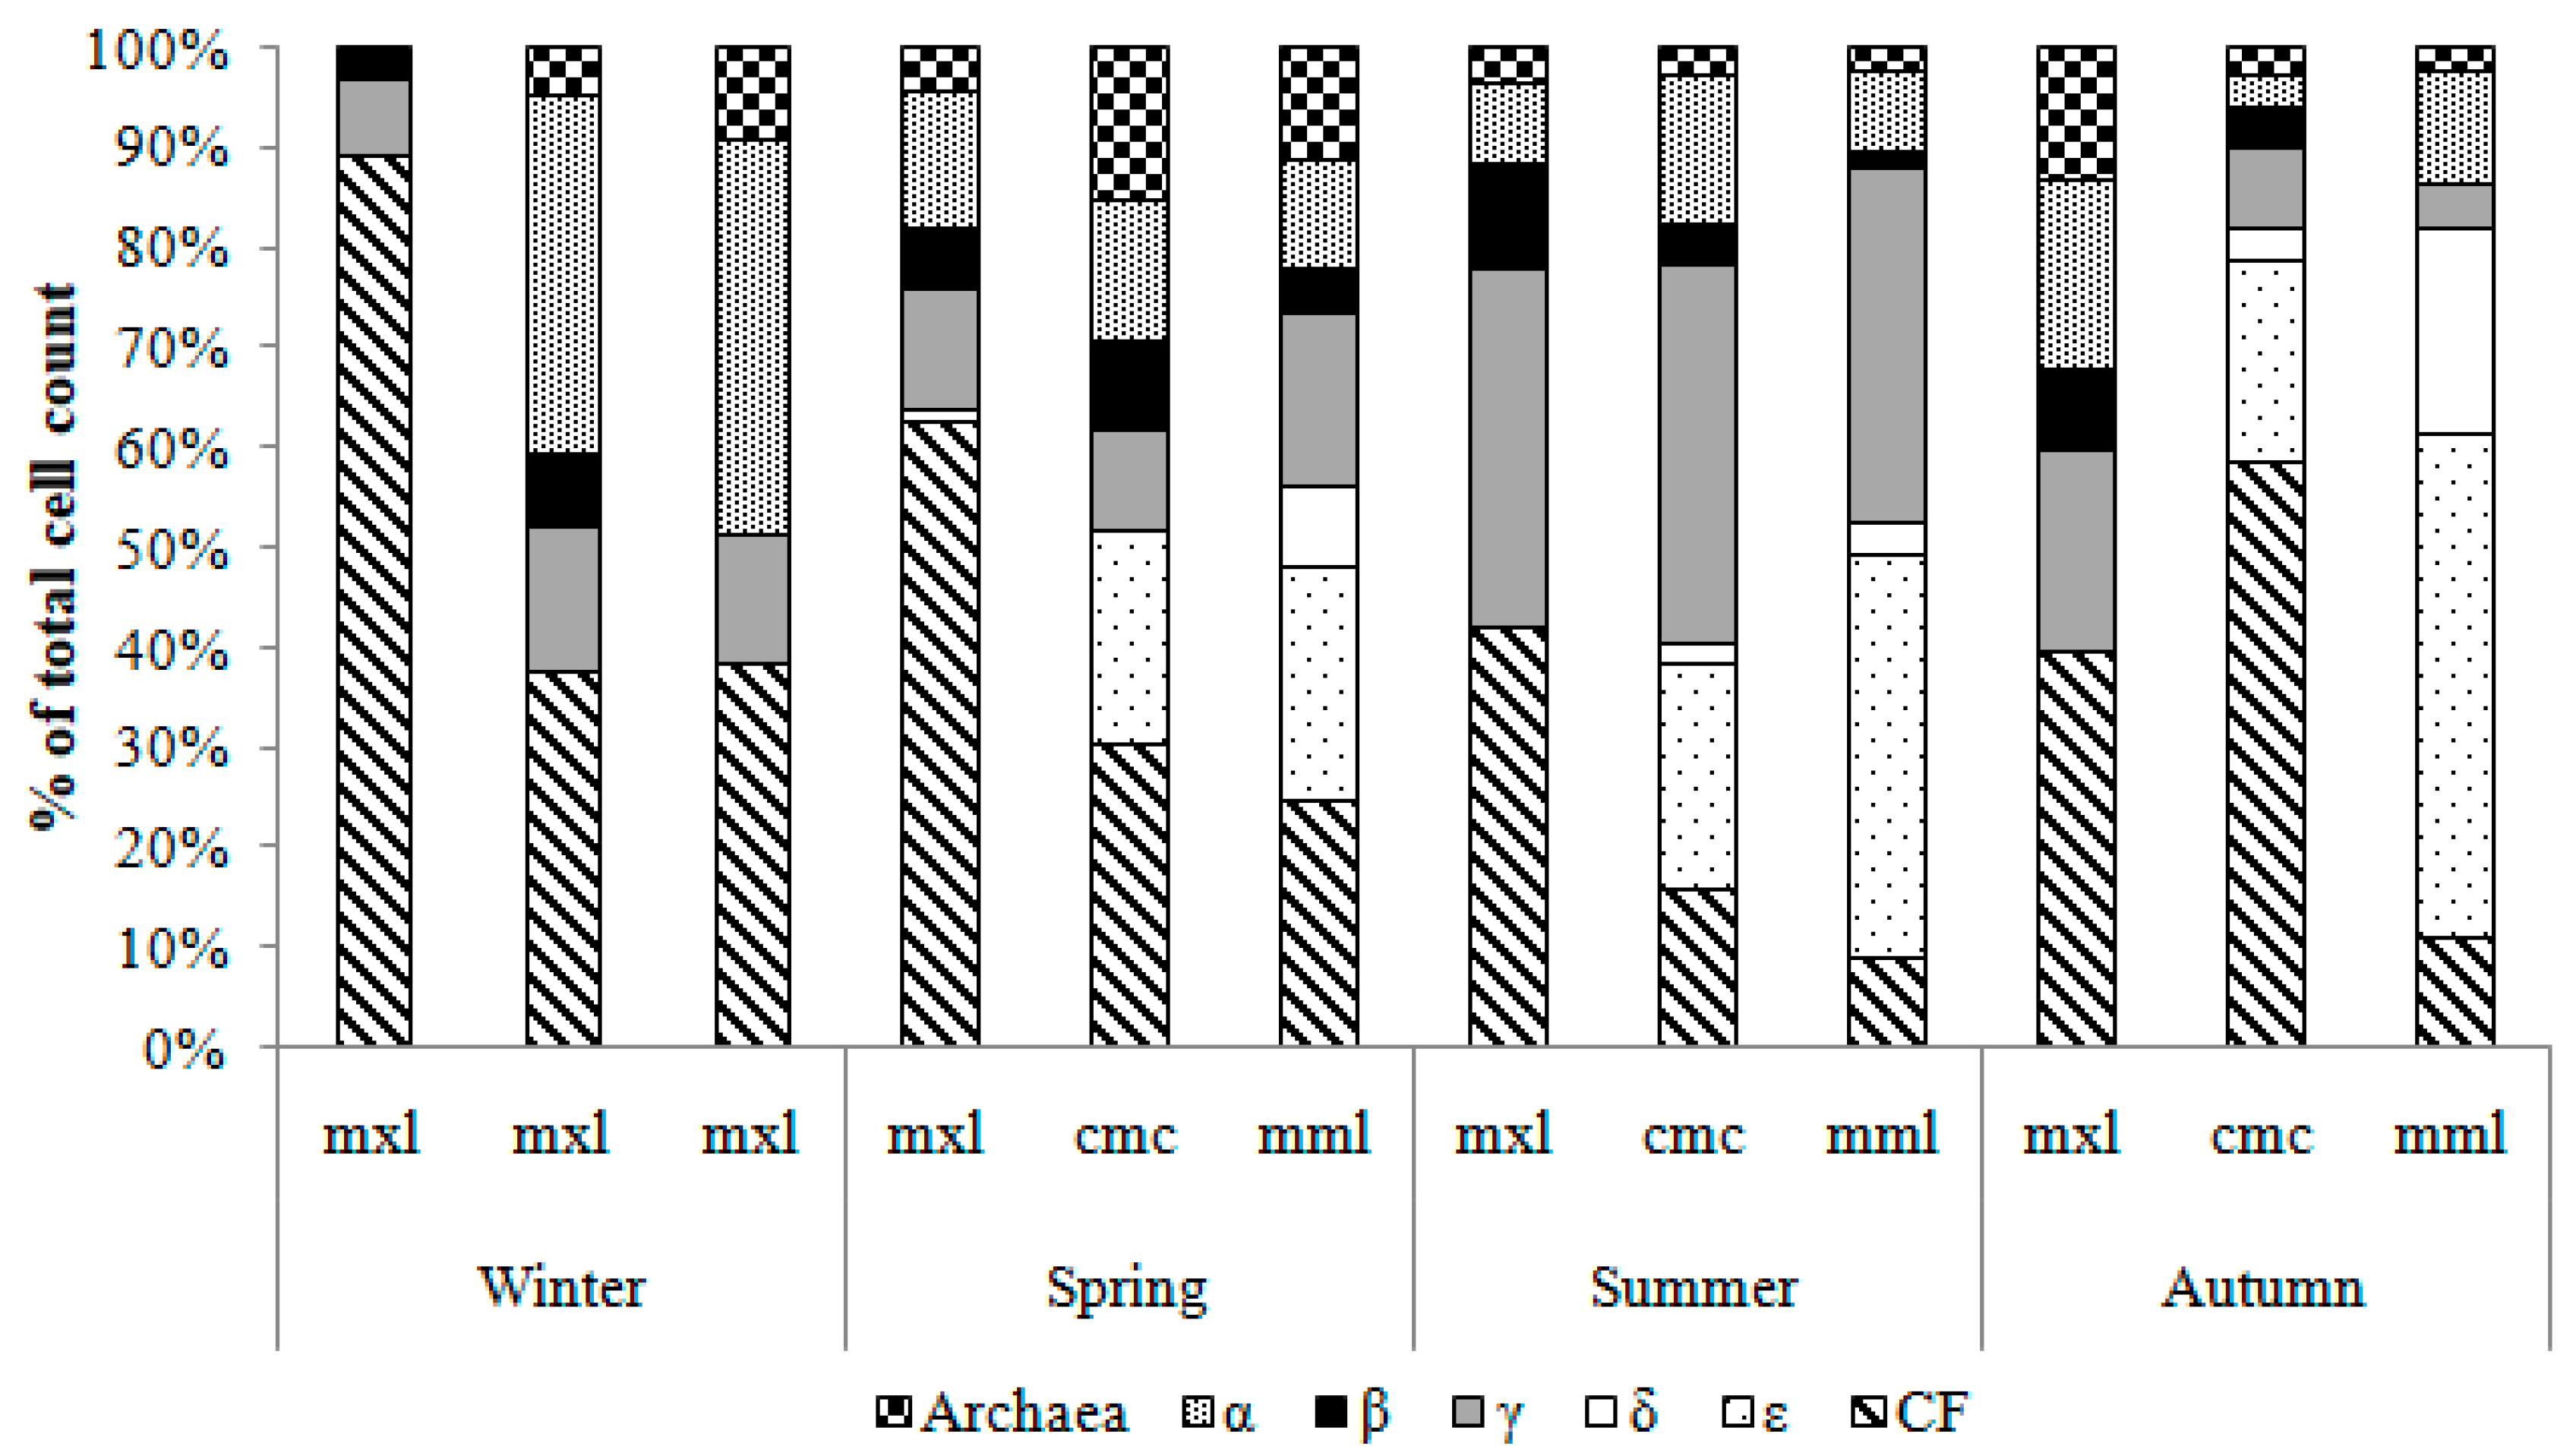
3.3.3. Abundance of the Major Phylogenetic Groups by CARD-FISH Analysis

Vertical variations in microbial abundance analyzed by CARD-FISH during the examined period are shown in Supplementary Table S3, which also summarizes the physical and chemical parameters at selected depths within the mixolimnion (mxl), chemocline (cmc) and monimolimnion (mml) (Figure 4). Overall, between 0.4 and 90% of DAPI-stained cells were visualized. The percentage of DAPI-stained bacteria detected with the probe for Bacteria (Eub338 I-III-HRP) corresponded to the maximum proportion (Figure 4). The fraction of cells detected with Eub338 I-III-HRP probe varied from 61% at the mixolimnion (October) to 77%. At the chemocline, values ranged between 77 and 85% (August). At the monimolimnion, its percentage varied from 65 to 91% (April).
Archaea abundance was relatively low along the different layers and throughout the whole sampling period. In the first months of 2010, this lineage, targeted by the Archaea915-HRP probe, was undetectable in surface waters (mixolimnion), amounting to about 2.6% (April). The situation was different for the chemocline, where the percentage value ranged between 1.2 and 4.5% (April), the highest value determined for this probe. In the monimolimnion, the lowest value was 1.3% and the highest was 3.1% (April).
Within the bacteria, the distribution of several bacterial lineages, including alpha-, beta-, gamma-, delta-, epsilonproteobacteria and the CFB group of bacteroidetes, were taken into account. A large portion (from 18 to 65%) of bacteria escaped detection with the specific probes used. Alphaproteobacterial cells (Alf968-HRP probe) were more abundant at the chemocline than the other layers, with a maximum value of 8.4% in July and the minimum one in October (1.7%). During the winter period, in the mixolimnion, the alphaproteobacteria were undetectable, while for the other months values varied from 1.3 (November) to 8.1% (January). In the monimolimnion the distribution over the time was more stable with a percentage ranging from 2.8 to 5.7%. Betaproteobacteria (Bet42a-HRP probe plus Gam42a competitor) were, on average, higher in the mixolimnion varying from 0.97 (January) to 6.4% (July). No detectable cells were in the monimolimnion during the winter period and gradually the percentage increased to 1.2% in August to start disappearing again. The chemocline showed the highest percentage of Betaproteobacteria (2.5%) in August, and the lowest one in February (1.6%). The most dramatic changes in time and space were observed for gammaproteobacteria, together with epsilonproteobacteria, which were the most abundant portion in summer period. Gammaproteobacteria (Gam42a-HRP probe plus Bet42a competitor) were more abundant in the monimolimnion, ranging between 1.3 (December) and 25% (August), and decreasing gradually. The percentage values were also high in the chemocline during the summer period, ranging from 2.9 to 22% (August). In the mixolimnion, on average, they were less abundant, with values between 1.5 and 22% (August).
Epsilonproteobacteria (Eps914-HRP probe) showed an interesting trend because positive cells were quite abundant in the chemocline and monimolimnion, after the formation of the anoxic layer. The values increased with the summer season reaching 27% in August (monimolimnion), compared to 4% in March. In the chemocline the epsilonproteobacteria reached 14% in August and 1.7% in December. No signal was detected in the mixolimnion during 2010. CFB cells (CF319-HRP probe) were more abundant in the mixolimnion with a maximum value of 37% in April and a minimum value of 5.1% in February. The chemocline and monimolimnion showed a similar development ranging from 30% (chemocline) in October to 7.8% (chemocline) in March, and from 21% (monimolimnion) in May to 6.0% in March (monimolimnion).
The maximum percentage of deltaproteobacteria (Delta495a-c-HRP probe) was in the chemocline and monimolimnion, with percentages ranging between 1.5% (chemocline in September) and 9.9% (monimolimnion in October). In particular, they were mainly related to the families desulfobacteraceae and desulfobulbaceae, which are strictly anaerobe and reduce sulfates to sulfides to obtain energy. In the mixolimnion no detectable cells were marked from January to March and in the remaining months the values were very low between 0.44 (September) and 0.98% (May).
Non-metric multi-dimensional scaling (nMDS) analysis computed on CARD-FISH is shown in Figure 5, showing an evident separation between mixolimnion and monimolimnion. This data was confirmed by the ANOSIM test (global R = 0.5; significance level= 0.1%) and the pairwise test between the three different groups, which showed a higher value between mixolimnion and monimolimnion (R = 0.76; significance level = 0.1%). To explain this distribution, the SIMPER test was carried out, and major average dissimilarity was confirmed between mixolimnion and monimolimnion, with a cumulative value of 51% and a contribution of 17.2% for deltaproteobacteria, and a cumulative value of 34.07 and a contribution 34% for epsilonproteobacteria.
Potential associations between physico-chemical parameters and prokaryotic community structures were analyzed through a CCA analysis (Figure 6). The first two axes accounted for 87.06% of the variance (axis 1: 57.94%, axis 2: 29.12%). The first axis is mainly defined by epsilonproteobacteria and deltaproteobacteria (intraset correlation coefficient: 2.24 and 2.31, respectively); the second axis correlates mainly with betaproteobacteria and gammaproteobacteria (intraset correlation coefficients: 2.08 and 1.54, respectively). Based on this approach, the abundance of some groups seemed to be strongly correlated with specific parameters. For example, the abundance of betaproteobacteria was correlated with a peak of temperature during August, while epsilonproteobacteria and deltaproteobacteria occurred at higher abundance in concomitance with peaks of ammonia and phosphate concentrations (in the monimolimnion between July and December).

4. Discussion

Meromictic lakes are extreme environments, currently recognized as study models for relating microbial distributions/ecophysiological roles to persistent chemical gradients [6]. In this study, the prokaryotic community inhabiting the meromictic Lake Faro was monitored over a period of one year in terms of both structure and abundance, and results were put in relation to main environmental variables and seasonality, in order to individuate main factors driving the microbial stratification [23]. It is noteworthy that the general structure of meromictic lakes (deriving from the establishment of stable physico-chemical gradients) cannot be considered absolutely static as meteorological events and weather condition changes can influence the extent of each layer [49]. No dystrophic crisis with a total anoxia, due to the rising of the water column from the anoxic layer to the surface, took place during the observation period, as previously reported [50,51]. However, a total mixing of the water column, caused by a high-speed and persistent Sirocco storm, was observed in the first months of the year (between January and the beginning of March). To the best of our knowledge, this phenomenon has never been recorded in the same area and may represent an occasional event [22,23,25]. At the end of March, the initial formation of stratification occurred around 23 m in depth. Finally, from the end of March up to the end of the sampling period, the water column became strongly stratified and the mixolimnion was located at depths of 12–15 m. As a consequence, the chemocline experienced strong variability during the study period.
In addition to the influence exerted by seasons and weather conditions, environmental parameters in the Lake Faro were affected by human and biological activities. Indeed, the progressive increase in salinity, with a maximum value of 38.6 in August in the first 10 m of the water column, was caused by the influx of seawater through the “Canale degli Inglesi”, occasionally operated by shellfish farmers. Instead, the stratification of redox potential and dissolved oxygen throughout the water column was probably due to the coupled effect of environmental conditions and biological factors, such as the algal blooms after the spring season. Interestingly, the chlorophyll pattern showed a stable localization of pigments in the anoxic layer at 15 m, from mid-May to September, corresponding to the “red layer”, populated by phototrophic sulfur bacteria [52,53,54]. While the phosphate and chlorophyll a concentration suggested an essential mesotrophic aspect in Lake Faro, nitrogenous nutrient concentration were more attributable to an oligotrophic lake [22].
The different physico-chemical conditions of Lake Faro could influence bacterial group distributions, due to the occurrence of vertical stratification that separates water masses and as a consequence of the establishment of unique bacterial communities at various depths, as observed in other meromictic systems [2]. From a microbiological point of view, the abundance of microorganisms reported in the present study was slightly higher than estimations previously performed in the same basin [3,23,55] and in other meromictic lakes [9,16,19,56]. The structure of bacterial communities differed among the mixolimnion, chemocline and monimolimnion layers, in line with observations by Gugliandolo et al. [3]. Furthermore, differences were encountered between Spring and Autumn, suggesting a direct influence of hydrological parameters on the relative abundances of bacterial taxa. In particular, the Redox Potential and NH4+ concentration were the main forces controlling the distribution patterns of the bacterial communities in Lake Faro, with a clear stratification into the three different layers (i.e., mixolimnion, chemocline and monimolimnion) in terms of OTUs. The bacterial community diversity in Lake Faro, as determined by computing the Shannon index on data from ARISA, was consistent with meromictic lakes from France to Canada, i.e., [20,57,58], but the results were more frequently higher, i.e., [59,60,61] or lower [2] than other meromictic lakes worldwide (including Antarctica). Bacterial diversity increased with depth, from oxic to anoxic layers, mainly during the Spring months. This phenomenon has been frequently reported for meromictic lakes, as was the case, for example, for the Canadian Lake Mahoney [58], the French Lake Pavin [6], the Antarctic Ace Lake [4], and three saline lakes in Central Asia [2]. Probably, abundant nutrients in the anoxic layer promote diversity and the occurrence of a more complex and diverse microbial community may be requested to better perform the multistep mineralization process [2]. The PCA computed on ARISA and chemical-physical data confirmed the separation present between the mixolimnion and both the chemocline and monimolimnion. The microbial community composition appeared to be driven by environmental parameters, which strongly differed among the three layers, and seasonal factors.
A more in-depth analysis of the prokaryotic community was performed by the CARD-FISH analysis, which confirmed a spatial and temporal separation between layers at phylum level. Consistently with their oxido-fermentative ability toward organic matter, bacteroidetes and gammaproteobacteria were found from the surface to the bottom, for the whole sampling period. However, the former showed the maximum value in the mixolimnion in April, whereas for gammaproteobacteria this was in August in the monimolimnion layer. In particular, members of gammaproteobacteria were probably involved in the sulfur cycle, especially in the monimolimnion, which was characterized by a high amount of sulfides. Differently from Gugliandolo et al. [3] betaproteobacteria were not among the predominant taxa in Lake Faro [3]. Conversely, deltaproteobacteria and epsilonproteobacteria explained most of the differences encountered in community structure in the mixolimnion and monimolimnion of Lake Faro. The phylogenetic diversity and prevalence of epsilonproteobacteria have been documented for a variety of marine habitats, such as anoxic basins [56,62,63], deep-sea hydrothermal vents [64,65], marine sediments [66,67], marine snow assemblages [68], and as symbionts of deep-sea invertebrates [69]. Although sulfur metabolism and microaerophily appear to be common characteristics of epsilonproteobacteria [70], little is known about their metabolism in anoxic waters. Epsilonproteobacteria in deep anoxic waters appeared to contain significant amounts of rRNA that were readily detectable by CARD-FISH, suggesting that they are still viable and possibly metabolically active. Noguerola et al. [71] reported the prevalence of Epsilonproteobacteria in the meromictic Lake Banyoles, in particular during winter in a transition zone in the water column characterized by opposite gradients of oxygen and sulfide, called redoxcline. Epsilonproteobacteria were almost absent during Summer, which was characterized by an increase in green sulfur bacteria. The authors highlighted the important role of this phylogenetic group in carbon and sulfur cycles, performing different metabolic functions, such as autotrophy, mixothrophy and heterotrophy [72]. Finally, Archaea showed a variable pattern among layers in relation to the sampling period. Their abundance was generally similar in the three layers from June to September and showed a slight decrease with depth from October to December. Moreover, the chemocline appeared to be more abundant in Archea in March and April. These findings are in contrast with observations by Gugliandolo et al. [3], who reported an increase in archaeal sequences from surface to bottom), as it observed in the present survey only from January to February.
In line with observations on other meromictic lakes [1,4,12,58,73], even if located in different geographical areas, Lake Faro hosts a prokaryotic community whose structure is linked to the vertical separation between oxic and anoxic zones. Such strict correlation was enforced by the long-timescale observation carried out in this study. Moreover, the study provides the basis for further investigation, such as a deeper evaluation of the phylogenetic composition of the entire prokaryotic community and the search of functional genes involved in biogeochemical cycles.

Supplementary Materials

The following are available online at https://www.mdpi.com/1424-2818/11/3/37/s1, Figure S1: Canonical correspondence analysis (CCA) of Lake Faro based on relative abundance of taxa detected by CARD-FISH. Environmental variables are represented as vectors, Table S1: List of 5—HRP labeled oligonucleotide probes used in this study, Table S2: Diversity indices computed in this study per month and lake stratum, Table S3: Physical and chemical parameters recorded by the CTD probe, nutrients concentration, DAPI counts, TC/TOC/TN concentration determined in the selected samples for CARD-FISH analysis (mxl: mixolimnion; cmc: chemocline; mml: monimolimnion).

Author Contributions

Conceptualization, L.M., A.L. and C.R.1; Methodology, L.M., A.L., C.R.1, M.S., M.S.1; Software, L.M., C.R. (Carmela Raffa) and C.R. (Carmen Rizzo); Investigation, L.M. and C.R.1; Data Curation, C.R. (Carmela Raffa) and C.R. (Carmen Rizzo); Writing—Original Draft Preparation, L.M., A.L., C.R.1.; Writing—Review and Editing, all authors; Supervision, L.M., E.D., A.L. and M.S.

Funding

This research received no external funding.

Acknowledgments

The authors wish to thank the Max Planck Institute in Bremen (Germany) for the technical and scientific support to Carmela Raffa during her stay. In particular, C.R. (Carmela Raffa) thanks Albane Ramette for his suggestions on multivariate statistics, and Theresa Hargesheimer and Jeanine Geelhoed for their help on ARISA binning. Our thanks also to Rosabruna La Ferla (IRBIM-CNR, Italy) for the use of the epifluorescence microscope, Giuseppa Pulicanò (University of Messina, Italy) for support during chemical analyses, Dr. Marco Pansera (ISMAR-CNR, Italy) and Filippo Interdonato (University of Messina, Italy) for their support during sampling and lab activities, respectively.

Conflicts of Interest

The authors declare no conflict of interest.

References

  1. Andrei, A.Ş.; Robeson, M.S.; Baricz, A.; Coman, C.; Muntean, V.; Ionescu, A.; Etiope, G.; Alexe, M.; Sicora, C.I.; Podar, M.; et al. Contrasting taxonomic stratification of microbial communities in two hypersaline meromictic lakes. ISME J. 2015, 9, 2642–2656. [Google Scholar] [CrossRef] [PubMed]
  2. Baatar, B.; Chiang, P-W.; Rogozin, D.Y.; Wu, Y.T.; Tseng, C-H.; Yang, C-Y.; Chiu, H-H.; Oyuntsetseg, B.; Degermendzhy, A.G.; Tang, S-L. Bacterial communities of three saline meromicticlakes in central Asia. PLoS ONE 2016, 11, e0150847. [Google Scholar] [CrossRef] [PubMed]
  3. Gugliandolo, C.; Lentini, V.; Maugeri, T. Distribution and diversity of bacteria in a saline meromictic lake as determined by PCR-DGGE of 16S rRNAgene fragments. Curr. Microbiol. 2010, 63, 3367–3373. [Google Scholar]
  4. Lauro, F.M.; DeMaere, M.Z.; Yau, S.; Brown, M.V.; Ng, C.; Wilkins, D.; Raftery, M.J.; Gibson, J.A.; Andrews-Pfannkoch, C.; Lewis, M.; et al. An integrative study of a meromictic lake ecosystem in Antarctica. ISME J. 2010, 5, 879–895. [Google Scholar] [CrossRef] [PubMed]
  5. Camacho, A.; Erez, J.; Chicote, A.; Florin, M.; Squires, M.M.; Lehmann, C.; Bachofen, R. Microbial microstratification, inorganic carbon photoassimilation and dark carbon fixation at the chemocline of the meromictic Lake Cadagno (Switzerland) and its relevance to the food web. Aquat. Sci. 2001, 63, 91–106. [Google Scholar] [CrossRef]
  6. Lehours, A.C.; Bardot, C.; Thenot, A.; Debroas, D.; Fonty, G. Anaerobic microbial communities in Lake Pavin, a unique meromictic lake in France. Appl. Environ. Microbiol. 2005, 71, 7389–7400. [Google Scholar] [CrossRef] [PubMed]
  7. Fenchel, T.; King, G.H.; Blackburn, T.H. Bacterial Biogeochemistry, the Ecophysiology of Mineral Cycling; Elsevier Science, Academic Press: Cambridge, MA, USA, 1998; pp. 307–309. [Google Scholar]
  8. Nõges, T.; Solovjova, I. The formation and dynamics of deep bacteriochlorophyll maximum in the temperate and partly meromictic Lake Verevi. Hydrobiologia 2005, 547, 73–81. [Google Scholar] [CrossRef]
  9. Øvreas, L.; Forney, L.; Daae, F.L.; Torsvik, V. Distribution of bacterioplankton in meromictic Lake Saelenvannet, as determined by denaturing gradient gel electrophoresis of PCR-amplified gene fragments coding for 16S rRNA. Appl. Environ. Microbiol. 1997, 63, 3367–3373. [Google Scholar] [PubMed]
  10. Peura, S.; Eiler, A.; Bertilsson, S.; Nykänen, H.; Tiirola, M.; Jones, R.I. Distinct and diverse anaerobic bacterial communities in boreal lakes dominated by candidate division OD1. ISME J. 2012, 6, 1640–1652. [Google Scholar] [CrossRef] [PubMed]
  11. Rogozin, D.Y.; Trusova, M.Y.; Khromechek, E.B.; Degermendzhy, A.G. Microbial community of the chemocline of the meromictic Lake Shunet (Khakassia, Russia) during summer stratification. Microbiology 2010, 79, 253–261. [Google Scholar] [CrossRef]
  12. Comeau, A.M.; Harding, T.; Galand, P.E.; Vincent, W.F.; Lovejoy, C. Vertical distribution of microbial communities in a perennially stratified Arctic lake with saline, anoxic bottom waters. Sci. Rep. 2012, 2, 604. [Google Scholar] [CrossRef] [PubMed]
  13. Yau, S.; Lauro, F.M.; Williams, T.J.; DeMaere, M.Z.; Brown, M.V.; Rich, J.; Gibson, J.A.; Cavicchioli, R. Metagenomic insights into strategies of carbon conservation and unusual sulfur biogeochemistry in a hypersaline Antarctic lake. ISME J. 2013, 7, 1944–1961. [Google Scholar] [CrossRef] [PubMed]
  14. Ramsing, N.B.; Fossing, H.; Ferdelmann, T.G.; Andersen, F.; Thamdrup, B. Distribution of bacterial populations in a stratified fjord (Mariager Fjord, Denmark) quantified by in situ hybridization and related to chemical gradients in the water column. Appl. Environ. Microbiol. 1996, 62, 1391–1404. [Google Scholar] [PubMed]
  15. Teske, A.; Wawer, C.; Muyzer, G.; Ramsing, N.B. Distribution of sulfate-reducing bacteria in a stratified fjord (Mariager Fjord, Denmark) as evaluated by most-probable-number counts and denaturing gradient gel electrophoresis of PCR-amplified ribosomal DNA fragments. Appl. Environ. Microbiol. 1996, 62, 1405–1415. [Google Scholar] [PubMed]
  16. Tuomi, P.; Torsvik, T.; Heldal, M.; Bratbak, G. Bacterial population dynamics in a meromictic lake. Appl. Environ. Microbiol. 1997, 63, 2181–2188. [Google Scholar] [PubMed]
  17. Bosshard, P.P.; Santini, Y.; Grüter, D.; Stettler, R.; Bachofen, R. Bacterial diversity and community composition in the chemocline of the meromictic alpine Lake Cadagno as revealed by 16S rDNA analysis. FEMS Microbiol. Ecol. 2000, 31, 173–182. [Google Scholar] [CrossRef] [PubMed]
  18. Humayoun, S.B.; Bano, N.; Hollibaugh, J.T. Depth distribution of microbial diversity in Mono Lake, a meromictic soda lake in California. Appl. Environ. Microbiol. 2003, 69, 1030–1042. [Google Scholar] [CrossRef] [PubMed]
  19. Koizumi, Y.; Kojima, H.; Oguri, K.; Kitazato, Y.; Fukui, M. Vertical and temporal shifts in microbial communities in the water column and sediment of saline meromictic Lake Kaiike (Japan), as determined by a 16S rDNA-based analysis, and related to physicochemical gradients. Environ. Microbiol. 2004, 6, 622–637. [Google Scholar] [CrossRef] [PubMed]
  20. Lehours, A.C.; Evans, P.; Bardot, C.; Joblin, K.; Gérard, F. Phylogenetic diversity of archaea and bacteria in the anoxic zone of a meromictic lake (Lake Pavin, France). Appl. Environ. Microbiol. 2007, 6, 2016–2019. [Google Scholar] [CrossRef] [PubMed]
  21. Kondo, R.; Nakagawa, A.; Mochizuki, L.; Osawa, K.; Fujioka, Y.; Butani, J. Dominant bacterioplankton populations in the meromictic Lake Suigetsu as determined by denaturing gradient gel electrophoresis of 16S rRNA gene fragments. Limnology 2009, 10, 63–69. [Google Scholar] [CrossRef]
  22. Saccà, A.; Borrego, C.M.; Renda, R.; Triadò-Margarit, X.; Bruni, V.; Guglielmo, L. Predation impact of ciliated and flagellated protozoa during a summer bloom of brown sulfur bacteria in a meromictic coastal lake. FEMS Microbiol. Ecol. 2009, 70, 42–52. [Google Scholar] [CrossRef] [PubMed]
  23. Saccà, A.; Guglielmo, L.; Bruni, V. Vertical and temporal microbial community patterns in a meromictic coastal lake influenced by the Straits of Messina upwelling system. Hydrobiologia 2008, 600, 89–104. [Google Scholar] [CrossRef]
  24. La Cono, V.; La Spada, G.; Arcadi, E.; Placenti, F.; Smedile, F.; Ruggeri, G.; Michaud, L.; Raffa, C.; De Domenico, E.; Sprovieri, M.; et al. Partaking of Archaea to biogeochemical cycling in oxygen-deficient zones of meromictic saline Lake Faro (Messina, Italy). Environ. Microbiol. 2012, 15, 1717–1733. [Google Scholar] [CrossRef] [PubMed]
  25. Giuffrè, G.; Pezzani, R. Annual nano-microphytoplankton succession in the meromictic brackish Lake Faro (Messina - Sicily) in relation to physical-chemical conditions. Nat. Sicil. 2005, 29, 153–168. [Google Scholar]
  26. Aminot, A.; Chaussepied, M. Manuel del Analyses Chimiques en Milieu Marin; Centre National pour l’Exploration des Oceans: Brest, France, 1983; pp. 107–118. [Google Scholar]
  27. Bendschneider, K.; Robinson, R.J. A new spectrophotometric determination of nitrite in sea water. J. Mar. Res. 1952, 11, 87–96. [Google Scholar]
  28. Wood, E.D.; Armstrong, A.J.; Richards, F.A. Determination of nitrate in sea water by cadmium-copper reduction to nitrite. J. Mar. Biol. Ass. U.K. 1967, 47, 23–31. [Google Scholar] [CrossRef]
  29. Murphy, J.; Riley, J.P. A modified single solution method for the determination of phosphate in natural waters. An. Chem. Acta 1962, 27, 31–36. [Google Scholar] [CrossRef]
  30. Porter, K.J.; Feig, Y.S. The use of DAPI for identifying and counting aquatic microflora. Limnol. Oceanogr. 1980, 25, 943–948. [Google Scholar] [CrossRef]
  31. Stepanauskas, R.; Moran, M.A.; Bergamaschi, B.A.; Hollibaugh, J.T. Covariance of bacterioplankton composition and environmental variables in a temperate delta system. Aquat. Microb. Ecol. 2003, 31, 85–98. [Google Scholar] [CrossRef]
  32. Luna, G.M.; Dell’Anno, A.; Danovaro, R. DNA extraction procedure: a critical issue for bacterial diversity assessment in marine sediments. Environ. Microbiol. 2006, 8, 308–320. [Google Scholar] [CrossRef] [PubMed]
  33. Cardinale, M.; Brusetti, L.; Quatrini, P.; Borin, S.; Puglia, A.M.; Rizzi, A.; Zanardini, E.; Sorlini, C.; Corselli, C.; Daffonchio, D. Comparison of different primer sets for use in automated ribosomal intergenic spacer analysis of complex bacterial communities. Appl. Environ. Microbiol. 2004, 70, 6147–6156. [Google Scholar] [CrossRef] [PubMed]
  34. Ramette, A. Quantitative community fingerprinting methods for estimating the abundance of operational taxonomic units in natural microbial communities. Appl. Environ. Microbiol. 2009, 75, 2495–2505. [Google Scholar] [CrossRef] [PubMed]
  35. Porporato, E.M.; Lo Giudice, A.; Michaud, L.; De Domenico, E.; Spanò, N. Diversity and antibacterial activity of the bacterial communities associated with two Mediterranean sea pens, Pennatula phosphorea and Pteroeides spinosum (Anthozoa: Octocorallia). Microb. Ecol. 2013, 66, 701–714. [Google Scholar] [CrossRef] [PubMed]
  36. Dunbar, J.; Ticknor, L.O.; Kuske, C.R. Phylogenetic specificity and reproducibility and new method for analysis of terminal restriction fragment profiles of 16S rRNA genes from bacterial communities. Appl. Environ. Microbiol. 2001, 67, 190–197. [Google Scholar] [CrossRef] [PubMed]
  37. Amann, R.I.; Binder, B.J.; Olson, R.J.; Chisholm, S.W.; Devereux, R.; Stahl, D.A. Combination of 16S rRNA- targeted oligonucleotide probes with flow cytometry for analyzing mixed microbial populations. Appl. Environ. Microbiol. 1990, 56, 1919–1925. [Google Scholar] [PubMed]
  38. Daims, H.; Bruhl, A.; Amann, R.; Schleifer, K.H.; Wagner, M. The domain-specific probe EUB338 is insufficient for the detection of all Bacteria: Development and evaluation of a more comprehensive probe set. System. Appl. Microbiol. 1999, 22, 434–444. [Google Scholar] [CrossRef]
  39. Stahl, D.A.; Amann, R. Development and application of nucleic acid probes. In Nucleic Acid Techniques in Bacterial Systematics; Stackebrandt, E., Goodfellow, M., Eds.; John Wiley and Sons: Hoboken, NJ, USA, 1991; pp. 205–248. [Google Scholar]
  40. Neef, A.; Amann, R.; Schlesner, H.; Schleifer, K.H. Monitoring a widespread bacterial group: in situ detection of planctomycetes with 16S rRNA-targeted probes. Microbiology 1998, 144, 3257–3266. [Google Scholar] [CrossRef] [PubMed]
  41. Manz, W.; Amann, R.; Ludwig, W.; Wagner, M.; Schleifer, K.H. Phylogenetic oligodeoxynucleotide probes for the major subclasses of proteobacteria: problems and solutions. Syst. Appl. Microbiol. 1992, 15, 593–600. [Google Scholar] [CrossRef]
  42. Loy, A.; Lehner, A.; Lee, N.; Adamczyk, J.; Meier, H.; Ernst, J.; Schleifer, K.H.; Wagner, M. Oligonucleotide microarray for 16S rRNA gene based detection of all recognized lineages of sulfate reducing prokaryotes in the environment. Appl. Environ. Microbiol. 2002, 68, 5064–5081. [Google Scholar] [CrossRef] [PubMed]
  43. Loy, A.; Maixner, F.; Wagner, M.; Horn, M. probeBase—An online resource for rRNA-targeted oligonucleotide probes: New features. Nucleic Acids Res. 2007, 35, D800–D804. [Google Scholar] [CrossRef] [PubMed]
  44. Manz, W.; Amann, R.; Ludwig, W.; Vancanneyt, M.; Schleifer, K.H. Application of a suite of 16S rRNA specific oligonucleotide probes designed to investigate bacteria of the phylum Cytophaga-Flavobacter-Bacteroides in the natural environment. Microbiology 1996, 142, 1097–1106. [Google Scholar] [CrossRef] [PubMed]
  45. Wallner, G.; Amann, R.; Beisker, W. Optimizing fluorescent in situ hybridization of suspended cells with rRNA-targeted oligonucleotide probes for the flow cytometric identification of microorganisms. Cytometry 1993, 14, 136–143. [Google Scholar] [CrossRef] [PubMed]
  46. Pernthaler, A.; Amann, R. Simultaneous fluorescence in situ hybridization of mRNA and rRNA in environmental bacteria. Appl. Environ. Microbiol. 2004, 70, 5426–5433. [Google Scholar] [CrossRef] [PubMed]
  47. Danovaro, R.; Luna, G.M.; Dell’Anno, A.; Pietrangeli, B. Comparison of two fingerprinting techniques, terminal restriction fragment length polymorphism and automated ribosomal intergenic spacer analysis, for determination of bacterial diversity in aquatic environments. Appl. Environ. Microbiol. 2006, 72, 5982–5989. [Google Scholar] [CrossRef] [PubMed]
  48. Hammer, Ø.; Harper, D.A.T.; Ryan, P.D. PAST: Paleontological Statistics software for education and data analysis. Palaeontol. Electronica 2001, 4, 1–9. [Google Scholar]
  49. Rodrigo, M.A.; Miracle, M.R.; Vicente, E. The meromictic Lake La Cruz (Central Spain). Patterns of stratification. Aquat. Sci. 2001, 63, 406–416. [Google Scholar] [CrossRef]
  50. Crisafi, P. Nuove osservazioni sulla distribuzione dell’idrogeno solforato nel lago di Faro (Messina). Atti Soc. Pelorit. Sci. Fis. Mat. Nat. 1956, 4, 309–314. [Google Scholar]
  51. Sorokin, Y.I.; Donato, N. On the carbon and sulphur metabolism in the meromictic Lake Faro (Sicily). Hydrobiologia 1975, 47, 241–252. [Google Scholar] [CrossRef]
  52. Genovese, S. Sul fenomeno dell’ ”acqua rossa” riscontrato nello stagno salmastro di Faro. Atti Soc. Pelorit. Sci. Fis. Mat. Nat. 1961, 7, 269–271. [Google Scholar]
  53. Trüper, H.G.; Genovese, S. Characterization of photosynthetic sulfur bacteria causing red water in Lake Faro (Messina, Sicily). Limnol. Oceanog. 1968, 13, 225–232. [Google Scholar] [CrossRef]
  54. Bruni, V.; Grillo, O.C. Ulteriori indagini sulla presenza dell’acqua rossa nel lago di Faro. Atti Soc. Pelorit. Sci. Fis. Mat. Nat. 1981, 24, 291–299. [Google Scholar]
  55. Acosta Pomar, L.; Bruni, V.; Decembrini, F.; Giuffrè, G.; Maugeri, T.L. Distribution and activity of picophytoplankton in a brackish environment. Progr. Oceanogr. 1988, 21, 129–138. [Google Scholar] [CrossRef]
  56. Grote, J.; Jost, G.; Labrenz, M. Epsilonproteobacteria represent the major portion of chemoautotrophic bacteria in sulfidic waters of pelagic redoxclines of the Baltic and Black Seas. Appl. Environ. Microbiol. 2008, 74, 7546–7551. [Google Scholar] [CrossRef] [PubMed]
  57. Dimitriu, P.A.; Pinkart, H.C.; Peyton, B.M.; Mormile, M.R. Spatial and temporal patterns in the microbial diversity of a meromictic soda lake in Washington State. Appl. Environ. Microbiol. 2008, 74, 4877–4888. [Google Scholar] [CrossRef] [PubMed]
  58. Klepac-Ceraj, V.; Hayes, C.A.; Gilhooly, W.P.; Lyons, T.W.; Kolter, R.; Pearson, A. Microbial diversity under extreme euxinia: Mahoney Lake, Canada. Geobiology 2012, 10, 223–235. [Google Scholar] [CrossRef] [PubMed]
  59. Bowman, J.P.; McCammon, S.A.; Rea, S.M.; McMeekin, T.A. The microbial composition of three limnologically disparate hypersaline Antarctic lakes. FEMS Microbiol. Lett. 2000, 183, 81–88. [Google Scholar] [CrossRef] [PubMed]
  60. Casamayor, E.O.; Triadó-Margarit, X.; Castañeda, C. Microbial biodiversity in saline shallow lakes of the Monegros Desert, Spain. FEMS Microbiol. Ecol. 2013, 85, 503–518. [Google Scholar] [CrossRef] [PubMed]
  61. Tiodjio, R.E.; Sakatoku, A.; Nakamura, A.; Tanaka, D.; Fantong, W.Y.; Tchakam, K.B. Bacterial and archaeal communities in Lake Nyos (Cameroon, Central Africa). Sci. Rep. 2014, 4, 6151. [Google Scholar] [CrossRef] [PubMed]
  62. Lin, X.; Wakeham, S.G.; Putnam, I.F.; Astor, Y.M.; Scranton, M.I.; Chistoserdov, A.Y.; Taylor, G.T. Comparison of vertical distributions of prokaryotic assemblages in the anoxic Cariaco Basin and Black Sea by use of fluorescence in situ hybridization. Appl. Environ. Microbiol. 2006, 4, 2679–2690. [Google Scholar] [CrossRef] [PubMed]
  63. Grote, J.; Labrenz, M.; Pfeiffer, B; Jost, G.; Jürgens, K. Quantitative distributions of Epsilonproteobacteria and a Sulfurimonas subgroup in pelagic redoxclines of the Central Baltic Sea. Appl. Environ. Microbiol. 2007, 73, 7155–7161. [Google Scholar] [CrossRef] [PubMed]
  64. Campbell, B.J.; Craig Cary, S. Abundance of reverse tricarboxylic acid cycle genes in free-living microorganisms at deep-sea hydrothermal vents. Appl. Environ. Microbiol. 2004, 70, 6282–6289. [Google Scholar] [CrossRef] [PubMed]
  65. Takai, K.; Campbell, B.J.; Cary, S.C.; Suzuki, M.; Oida, H.; Nunoura, T.; Hirayama, H.; Nakagawa, S.; Suzuki, Y.; Inagaki, F.; et al. Enzymatic and genetic characterization of carbon and energy metabolisms by deep-sea hydrothermal chemolithoautotrophic isolates of Epsilonproteobacteria. Appl. Environ. Microbiol. 2005, 71, 7310–7320. [Google Scholar] [CrossRef] [PubMed]
  66. Li, L.; Kato, C.; Horikoshi, K. Bacterial diversity in deep-sea sediments from different depths. Biodiv. Conserv. 1999, 8, 659–677. [Google Scholar] [CrossRef]
  67. Yanagibayashi, M.; Nogi, Y.; Li, L.; Kato, C. Changes in the microbial community in Japan Trench sediment from a depth of 6292 m during cultivation without decompression. FEMS Microbiol. Lett. 1999, 170, 271–279. [Google Scholar] [CrossRef] [PubMed]
  68. Rath, J.; Wu, K.Y.; Herndl, G.J.; DeLong, E.F. High phylogenetic diversity in a marine-snow-associated bacterial assemblage. Aquat. Microb. Ecol. 1998, 14, 261–269. [Google Scholar] [CrossRef]
  69. Campbell, B.J.; Stein, J.L.; Craig Cary, S. Evidence of chemolithoautotrophy in the bacterial community associated with Alvinella pompejana, a hydrothermal vent polychaete. Appl. Environ. Microbiol. 2003, 69, 5070–5078. [Google Scholar] [CrossRef] [PubMed]
  70. Vandamme, P.; De Ley, J. Proposal for a new family, Campylobacteraceae. Int. J. Syst. Bacteriol. 1992, 41, 451–455. [Google Scholar] [CrossRef]
  71. Noguerola, I.; Picazo, A.; Llirós, M.; Camacho, A.; Borrego, C.M. Diversity of freshwater Epsilonproteobacteria and dark inorganic carbon fixation in the sulphidic redoxcline of a meromictic karstic lake. FEMS Microbiol. Ecol. 2015, 91, 7. [Google Scholar] [CrossRef] [PubMed]
  72. Campbell, B.J.; Engel, A.S.; Porter, M.L. The versatile Epsilonproteobacteria: key players in sulphidic habitats. Nat. Rev. Microbiol. 2006, 4, 458–468. [Google Scholar] [CrossRef] [PubMed]
  73. Barberán, A.; Casamayor, E.O. Euxinic freshwater hypolimnia promote bacterial endemicity in continental areas. Microb. Ecol. 2010, 61, 465–472. [Google Scholar] [CrossRef] [PubMed]
Figure 1. Location map and bathymetric chart of Lake Faro indicating the sampling site (S). Arrows show water inflow and outflow when the channels are both open and the Levantine Intermediate Waters (LIW) enter the lake [23,25]; modified.
Diversity 11 00037 g001
Figure 2. Dissolved oxygen (a), redox potential (b) and chlorophyll (c) profiles during 2010 along the water column.
Diversity 11 00037 g002
Figure 3. Principal component analysis computed on ARISA data, diversity indices, chemical-physical parameters, DAPI counts and nutrient concentration (mxl: mixolimnion; cmc: chemocline; mml: monimolimnion).
Diversity 11 00037 g003
Figure 4. Relative amounts of DAPI-stained bacteria detected by CARD-FISH of major bacterial clades, during a one year-long observation according to the season (mxl: mixolimnion; cmc: chemocline; mml: monimolimnion).
Diversity 11 00037 g004
Figure 5. Non-metrical multidimensional scaling (nMDS) analysis (Bray-Curtis similarity matrix) computed on relative abundances of taxonomic groups detected by CARD-FISH (mxl: mixolimnion; cmc: chemocline; mml: monimolimnion).
Diversity 11 00037 g005
Figure 6. Canonical correspondence analysis (CCA) of Lake Faro based on relative abundance of taxa detected by CARD-FISH. Environmental variables are represented as vectors.
Diversity 11 00037 g006

