Article

The Distribution of Planktivorous Damselfishes (Pomacentridae) on the Great Barrier Reef and the Relative Influences of Habitat and Predation

Australian Institute of Marine Science, PMB 3 Townsville MC, Townsville, QLD 4810, Australia
*
Author to whom correspondence should be addressed.
Diversity 2019, 11(3), 33; https://doi.org/10.3390/d11030033
Submission received: 7 January 2019 / Revised: 22 February 2019 / Accepted: 25 February 2019 / Published: 28 February 2019

Abstract

:
Planktivorous damselfishes (Pomacentridae) are diverse and abundant on the Great Barrier Reef (GBR), are important prey for commercially harvested coral trout (Plectropomus spp.) and their feeding mode plays a central role in transferring energy from the plankton to the reef. However, little is known about their distribution patterns throughout the GBR and how those patterns are influenced by predators and habitat despite increasing pressures on both. Here we quantify the distribution and abundance of GBR planktivorous damselfishes, then examine the role of coral trout and habitat in shaping their assemblages. The assemblage structure of planktivorous damselfishes varied across the continental shelf, yet their total abundances varied sub-regionally, dependent on differences in coral habitat. Latitudinal patterns were relatively weak. Damselfish assemblages generally retained characteristics of their sub-regional setting over 20 years and assemblage degradation was only associated with major coral losses. Damselfish numbers were not negatively influenced by top-down control from coral trout. Instead, numbers of coral trout and damselfishes were both positively associated with coral habitat and each other. Our findings suggest that a complexity of factors and interactions shape reef fish assemblages and reinforce the fundamental importance of coral as the foundation of healthy reef communities.

1. Introduction

Coral reef fishes that feed on planktonic organisms are considered key components of reef food chains as they transfer energy from the pelagic zone to the reef environment. For example, planktivorous fishes removed nearly all zooplankton, mostly larvaceans and copepods, from ocean waters near the face of one reef on Australia’s Great Barrier Reef (GBR) [1]. Their role as a primary importer of nutrients from the pelagic zone (see also [2]) is likely to be widespread throughout the GBR given that planktivorous fishes were reported as the regionally dominant trophic group of fishes by weight and number on shallow reef slopes [3]. Damselfishes (Pomacentridae) are the most diverse family of planktivorous fishes on the GBR and can be extremely abundant [3]. While consumption of zooplankton by planktivorous damselfishes contributes to nutrient transfer onto reef environments, these fishes may also provide more indirect ecological benefits: some eat the larvae of coral-feeding crown-of-thorns starfish, possibly constraining starfish population upsurges [4] and associated coral declines, while others that preferentially reside within corals may moderate the bleaching susceptibility of their coral hosts [5]. Additionally, planktivorous damselfishes are a primary source of food for many predatory fishes on the GBR including the commercially important coral trout (Plectropomus spp.) [6,7,8]. While planktivorous damselfishes appear integral to the GBR food chain as both predators of plankton and prey of larger fishes, there is little quantitative information on their distributions and abundances throughout the GBR to inform management. Previous studies have examined the abundance of planktivorous damselfishes across the GBR, but these were restricted to a few clusters of reefs [9,10]. Both of these studies examined whether predatory fishes exerted any control of reef fish assemblage structure, and reported that areas designated as no-take marine reserves had fewer damselfishes than areas open to fishing and that there was variation in the abundance of several damselfish species among reefs and geographic regions of the GBR [9,10].
Knowledge of the underlying factors that drive or alter species distributions and abundances, including environmental drivers and niche-based factors, enhances understanding of how those patterns could change under the many threats facing coral reefs [11] and especially to the foundational corals themselves [12,13,14]. Coral reef damselfishes, including most planktivorous species, are under particular threat because many have either facultative or obligate requirements for corals as habitat [11,15]. These fishes are mostly small and many use coral structures as a shelter from which they emerge to feed and quickly retreat to when threatened by a predator. As such, chronic declines in coral cover in many reef ecosystems [12,16,17], including on the GBR from the mid-1980s to 2012 [18], and following the recent coral bleaching events in 2016 and 2017 [14], have the potential to limit populations of planktivorous damselfishes or alter their assemblage structure. However, planktivorous damselfishes are understudied in the literature, apart from small-scale studies that examine their feeding, trophic status, habitat associations and recruitment [11,19,20,21,22,23]. These studies have revealed coral habitat and niche partitioning seems likely to be an important general determinant of damselfish spatial patterns on coral reefs [21,24]. The fact that damselfish assemblages and those of other fish groups so often decline after coral losses due to major disturbances [25,26,27,28,29] further highlights the fundamental importance of coral habitat for reef fish assemblages and how it may drive their distributions.
Though habitat preferences may initially determine spatial distributions of many reef fishes, patterns established at settlement may later be altered by a wide range of ecological processes, including mortality [30], competitive exclusion [23] and antagonistic behaviours [24]. This is particularly relevant to planktivorous damselfishes because many have little inclination to move once settled and so cannot avoid the processes operating locally that may influence post-settlement survival; in fact many of the smaller-bodied species have very small home ranges and appear to retain high fidelity to settlement sites [20,31]. Trophic processes such as top-down and bottom-up control must play a role in determining the post-settlement composition of planktivorous fish assemblages and of other fish groups, although there are conflicting schools of thought as to which is most influential in marine ecosystems, and to the relative strength of influence [32,33]. Top down control traditionally has been defined as the regulation of food-webs by consumers, whereas bottom up control is regulation by resource availability [34,35]. Since first defined many studies have attempted to find ecological support for both mechanisms, with variable results and some debate over the importance of one over the other (e.g., [35,36]). In more recent times it has generally been accepted that both processes must operate to some extent and the importance of either is likely to vary in space and time [37]. So, how much could top-down or bottom-up processes alter distributional patterns of coral reef planktivorous damselfishes established at settlement? There is some evidence that top-down control of reef fishes may occur through predators changing the abundance of prey species [9,10,38,39], which includes numerous species of planktivorous damselfishes [7,8,40,41,42]. However, given many of these studies are correlative, and that different species within the coral trout complex, whilst being generalist predators, do utilise different prey resources [42], the generality of top-down control of planktivorous damselfishes remains to be confirmed.
The bottom-up influence of zooplankton availability on distributions of planktivorous damselfish that feed on them is unknown on the GBR because plankton communities are rarely surveyed at the same time as fishes and are typically more variable in composition over space and time [43,44]. However, there are marked offshore gradients in the community composition of both phytoplankton and their zooplankton predators on the GBR [43,44,45,46], suggesting that bottom-up processes could influence the distributions of planktivorous damselfishes. Additionally, prey limitation may be an issue for planktivorous damselfishes of the GBR if consumption of nearly all zooplankton in near reef waters on one reef [1] is more widespread.
Here we first quantify the distributions of planktivorous damselfishes throughout the GBR along with their relative abundances, species richness, community compositions and temporal patterns using a unique long-term and broad scale data set from the Australian Institute of Marine Science’s Long-Term Monitoring Program (LTMP). We then assess the relative influence of coral habitat and predation on broad spatial and temporal patterns. We did not have the plankton data to assess bottom-up trophic influences on planktivorous damselfishes but discuss our results in light of available information.

2. Materials and Methods
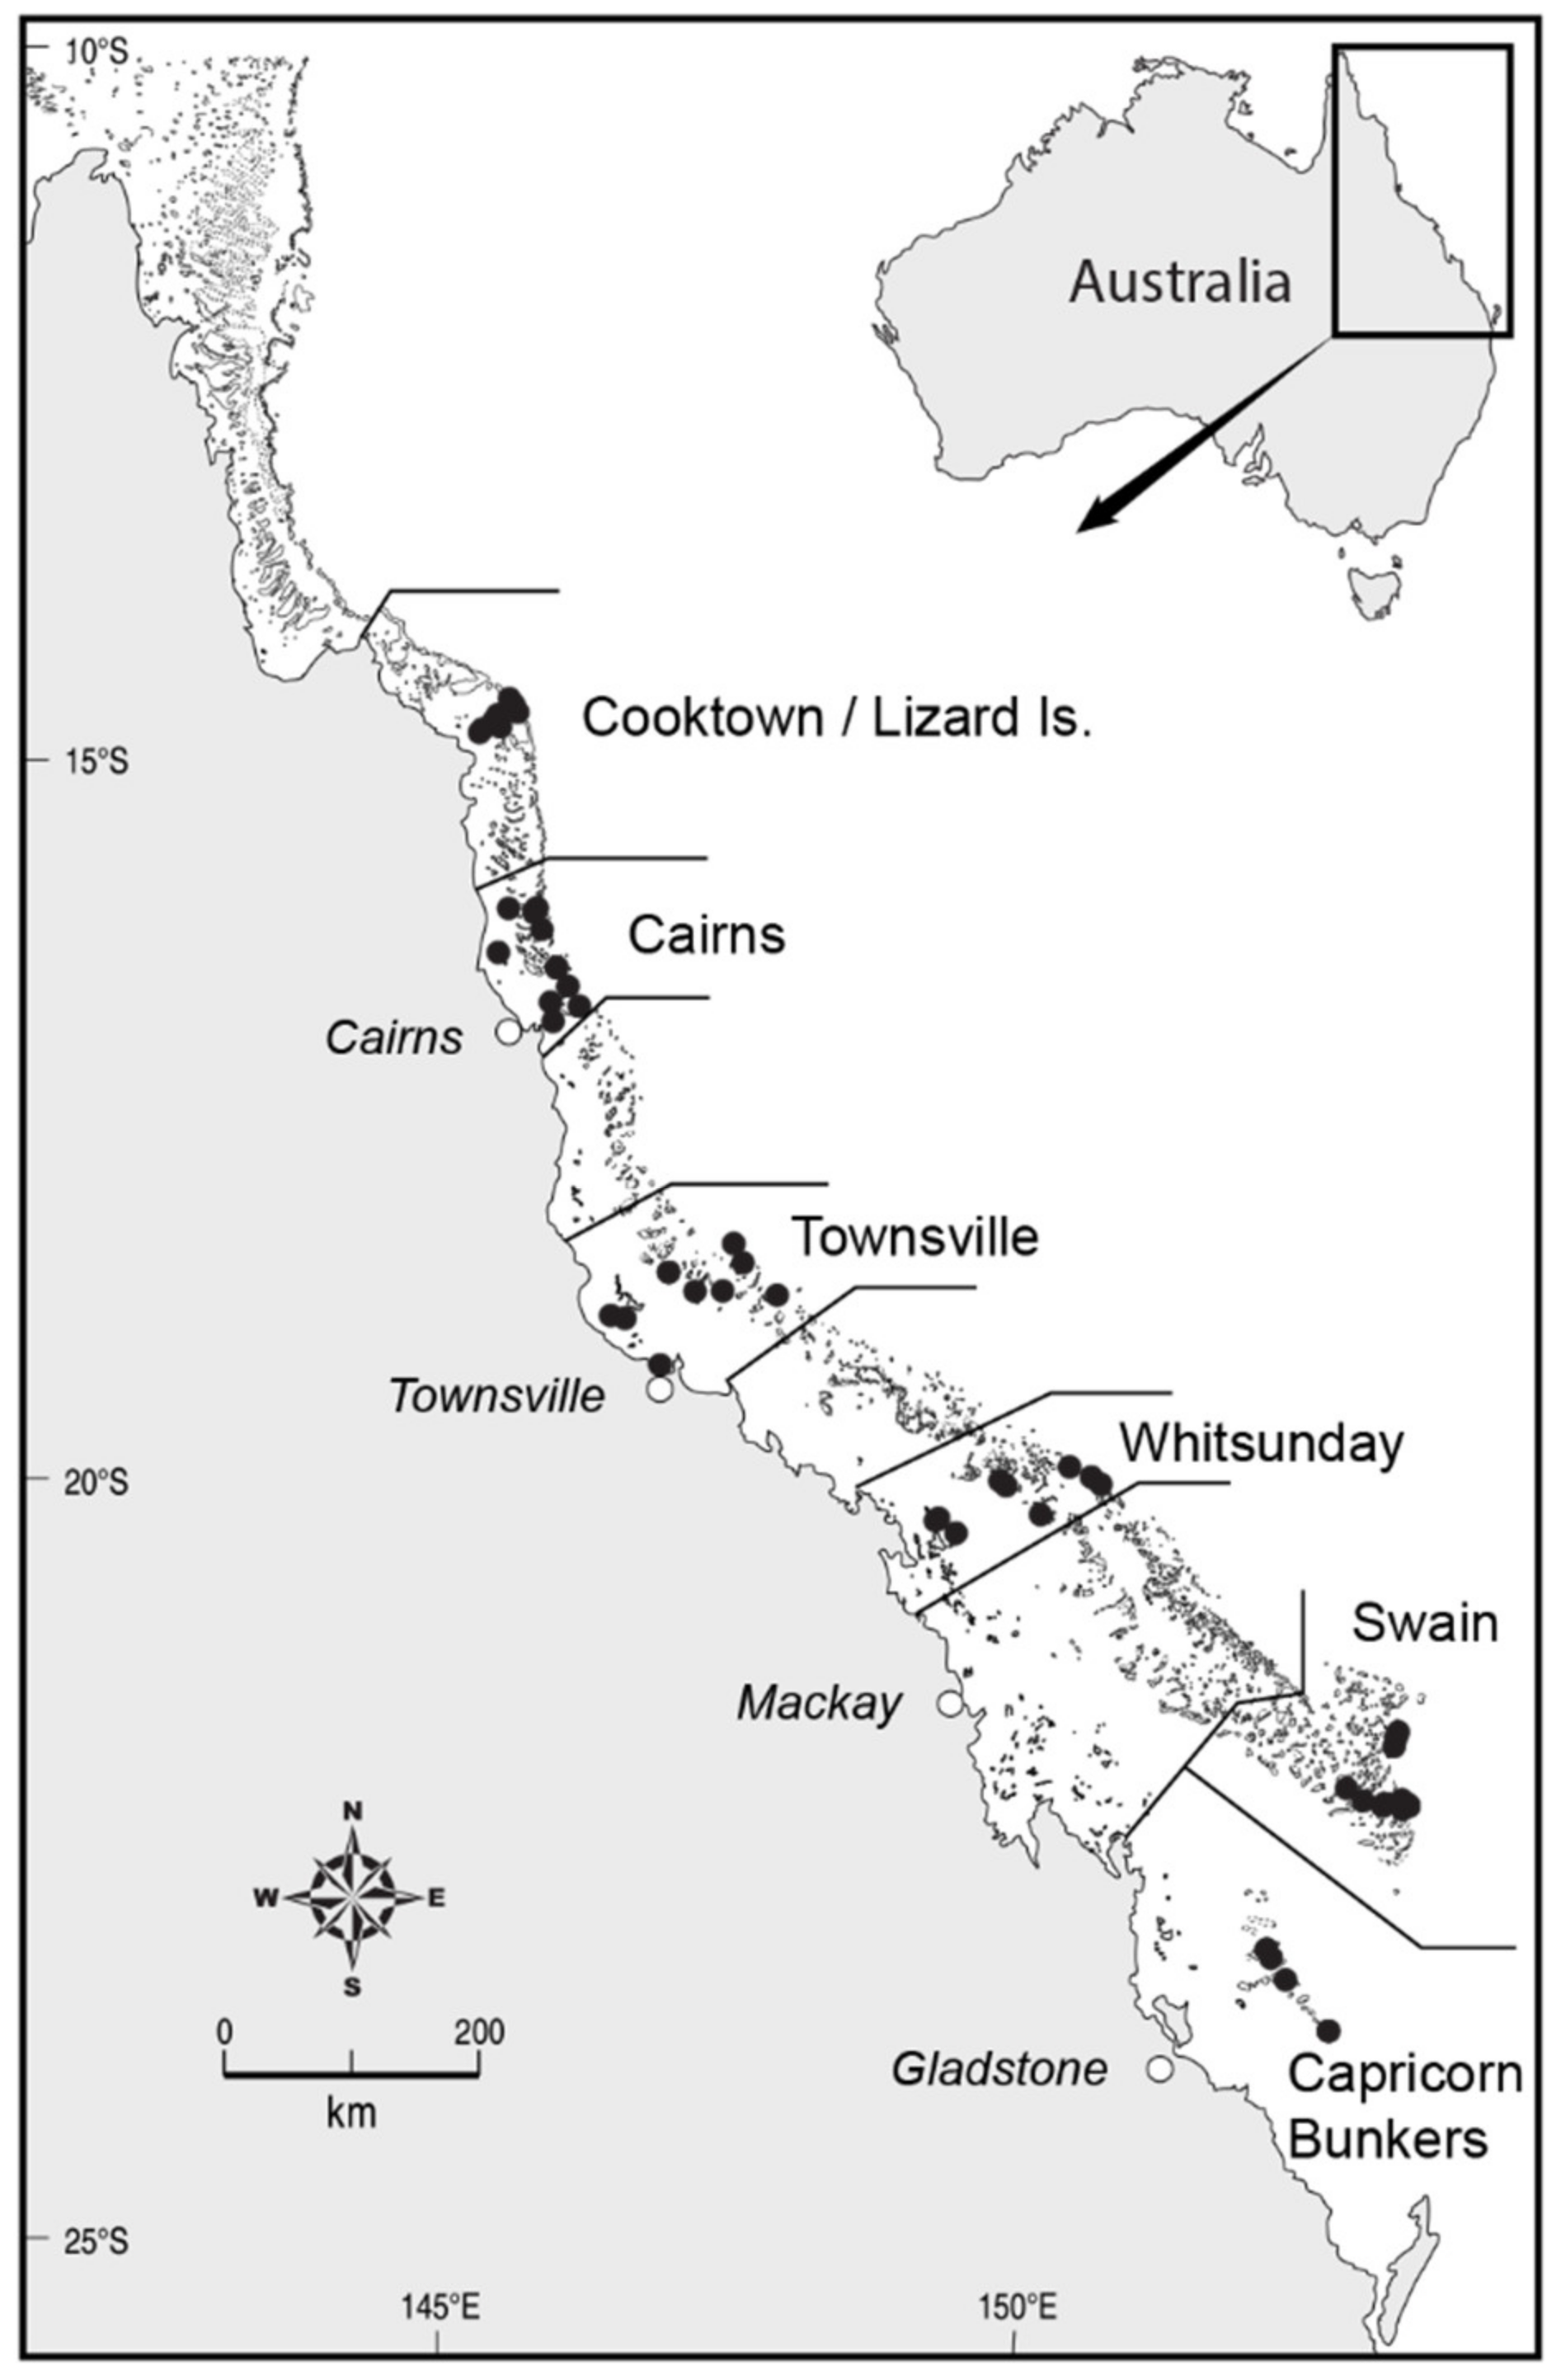
2.1. Survey Methods

Forty-seven reefs have been surveyed annually from 1995 to 2005 and biennially thereafter up to 2017 as part of the LTMP. Survey reefs were distributed across six latitudinal sectors (15° S to 24° S), Cooktown-Lizard Island, Cairns, Townsville, Whitsunday, Swain and Capricorn-Bunker (Figure 1). Within each sector, replicate reefs were surveyed in each of three positions across the continental shelf (inshore, mid-shelf, outer-shelf) where available. As the continental shelf increases in width from north to south, inshore reefs were 5–30 km from land, mid-shelf reefs were 20–200 km from land and outer-shelf reefs were 40–210 km from land, depending on the latitudinal sector (Figure 1). However, due to the geography of the GBR, there are no suitable inshore reefs in the Swain sector and no suitable inshore or mid-shelf reefs in the Capricorn–Bunker sector, resulting in fifteen combinations of sector and shelf (hereafter sub-regions). One inshore reef of the Townsville sector was discounted from analyses due to restricted visibility precluding surveys being conducted in many years.
Reef-associated planktivorous damselfishes, here defined as fishes whose diet is wholly or mostly composed of plankton (not including the medium-bodied schooling genus Abudefduf), were surveyed in a standard reef slope habitat on the northeast flank of each reef. The northeast flanks of GBR reefs are oblique to the prevailing south-easterly weather, ensuring consistency in relative exposure among different reef assemblages and so enabling valid spatial comparisons. Planktivorous damselfishes were surveyed along five permanent 50 m belt transects set at a depth between 6–9 m in each of three sites on each reef (n = 15 transects reef−1 year−1). The start and finish of transects were marked with metal stakes, with smaller rods spaced at approximately 10 m intervals. During each survey a 50 m fibreglass tape was run out along the transect line after the first observer had recorded the abundance of large mobile fishes, including coral trout, in a 5 m wide belt. A second observer then swum back along the transect recording the abundance of all species of damselfish (family Pomacentridae) encountered on a 1m wide belt up-slope from the tape (see [47] for detailed methods). Only a subset of the data is used here, including counts of planktivorous damselfish, snappers (Lutjanidae), emperors (Lethrinidae) and coral trout. Damselfish diets represent a continuum from strict plankton feeders to those that feed wholly on algae [48] and among planktivorous damselfishes, two groups have been differentiated by diet using stable isotope techniques. One group (hereafter planktivores) fed exclusively from the pelagic zone largely on zooplankton, while the other group (hereafter benthic planktivores) utilised both pelagic planktonic food sources, supplemented with benthic prey [22]. Because of the long temporal series of these data, multiple observers have conducted counts. However, there was no evidence of any biases in counts among observers [47]. Digital images were taken concurrently to the fish surveys every metre along each transect of which 40 images were randomly selected for benthic composition quantification [49]. Benthic organisms were identified to the highest taxonomic resolution possible under five points per image (n = 200 points per transect). The data were grouped and converted to estimates of percent cover of hard and soft coral and algae.

2.2. Analyses of Latitudinal and Cross-Shelf Structure of Planktivorous Damselfish Assemblages

All analyses were conducted in R [50] and all plots were produced using the package ggplot2 [51]. Broad patterns in the latitudinal and cross shelf abundance of planktivorous damselfish communities were explored graphically via principal component analysis (PCA). The abundances of 48 species of planktivorous damselfish at each site were transformed prior to analysis using the Hellinger metric to reduce the influence of highly abundant taxa [52] and converted to a Bray-Curtis dissimilarity matrix. Differences in community composition were then analysed using a permutational MANOVA, with fixed effects of Sector, Shelf and Year using the adonis function in the vegan package in R.
Spatio-temporal variation in the abundance and species richness of GBR planktivorous damselfish was modelled using Bayesian hierarchical linear mixed models. Models were fitted separately for the abundance and species richness of each group (planktivores and benthic planktivores), with the fixed factors of Sector, Shelf and Year. Year was modelled as a categorical variable rather than a random autoregressive function; such smoothers tend to flatten over dramatic changes. Reef, Site and Transect were incorporated as random factors to account for the spatial and temporal autocorrelation associated with repeatedly monitoring the same sites. All response variables were modelled against a negative binomial distribution. All models were conducted using the INLA (Integrated Nested Lapace Approximation) package [53]. Specific contrasts compared temporal and time averaged spatial patterns among sub-regions. Inferences about differences in the abundance and species richness of predators relate only to the habitat surveyed and were based on 95% Bayesian Uncertainty Intervals (UIs) for modelled higher posterior density (HPD) median effects, and statistical ‘significance’ was inferred where 95% UIs do not overlap.

2.3. Top-Down versus Habitat Control of Planktivorous Damselfishes

To examine the relative influences of top-down control by coral trout and availability of coral habitat (using hard coral cover as a proxy) on planktivorous damselfish populations, we examined multiple lines of evidence. In simplistic terms, if abundance of planktivorous damselfish were influenced by top-down processes, we would expect to see negative associations between predatory fishes and species of planktivorous damselfishes known to be their prey [7,8,40,41,42]. In contrast, if habitat has a strong influence, we would expect positive associations between benthic condition and numbers of planktivorous damselfishes and predators. We therefore compared the frequency of occurrence of positive and negative relationships between (1) Hard coral cover and the abundance of planktivorous damselfish known to be trout prey, (2) Hard coral cover and the abundance of planktivores, (3) Hard coral cover and the abundance of benthic planktivores, (4) Hard coral cover and trout abundance, (5) Trout abundance and the abundance of their planktivorous damselfish prey. We then tested whether the frequency of occurrence in each of the categories differed significantly from what was expected using a Chi-squared test.
To examine the habitat association of planktivorous damselfishes, we used Boosted Regression Trees (BRTs) [54,55] to determine which variables had the greatest relative influence on the abundance of planktivores, benthic planktivores, coral trout (predators) and those planktivorous damselfishes identified as coral trout prey. Explanatory variables included the percent cover of hard corals, soft corals and coralline/turf algae. We also included the spatial factors of latitudinal sector and position across the continental shelf, temperature from in situ loggers and estimates of substrate rugosity. More details of the temperature data, rugosity estimates and the BRTs can be found in Appendix A. While data from marine reserves were included in the analyses, reserve status was not explicitly used as a variable in the models; even though trout numbers are generally higher in GBR marine reserves [56,57,58], these increases in density were captured in the analyses. All models were fitted using reef averaged data with the gbm package [59].

3. Results

3.1. Distribution of Planktivorous Damselfishes

A total of 1,101,536 individuals from 44 species of planktivorous damselfishes have been recorded on LTMP reefs since 1995. Planktivores accounted for almost 65% of the individuals, while benthic planktivores were less numerous and comprised about 35% of the total number of fishes in this study (Table 1). Species distributions varied considerably, twelve species occurred on over 80% of survey reefs including three species, Acanthochromis polyacanthus, Neoglyphidodon melas, and Pomacentrus lepidogenys that occurred on every survey reef (Table 1). Conversely there were a number of species with more restricted distributions. Planktivores tended to be more conserved in their distributions than benthic planktivores with 52% of twenty-nine species occurring on less than 50% of reefs (Table 1) compared with 27% of fifteen species of benthic planktivores (Table 1).

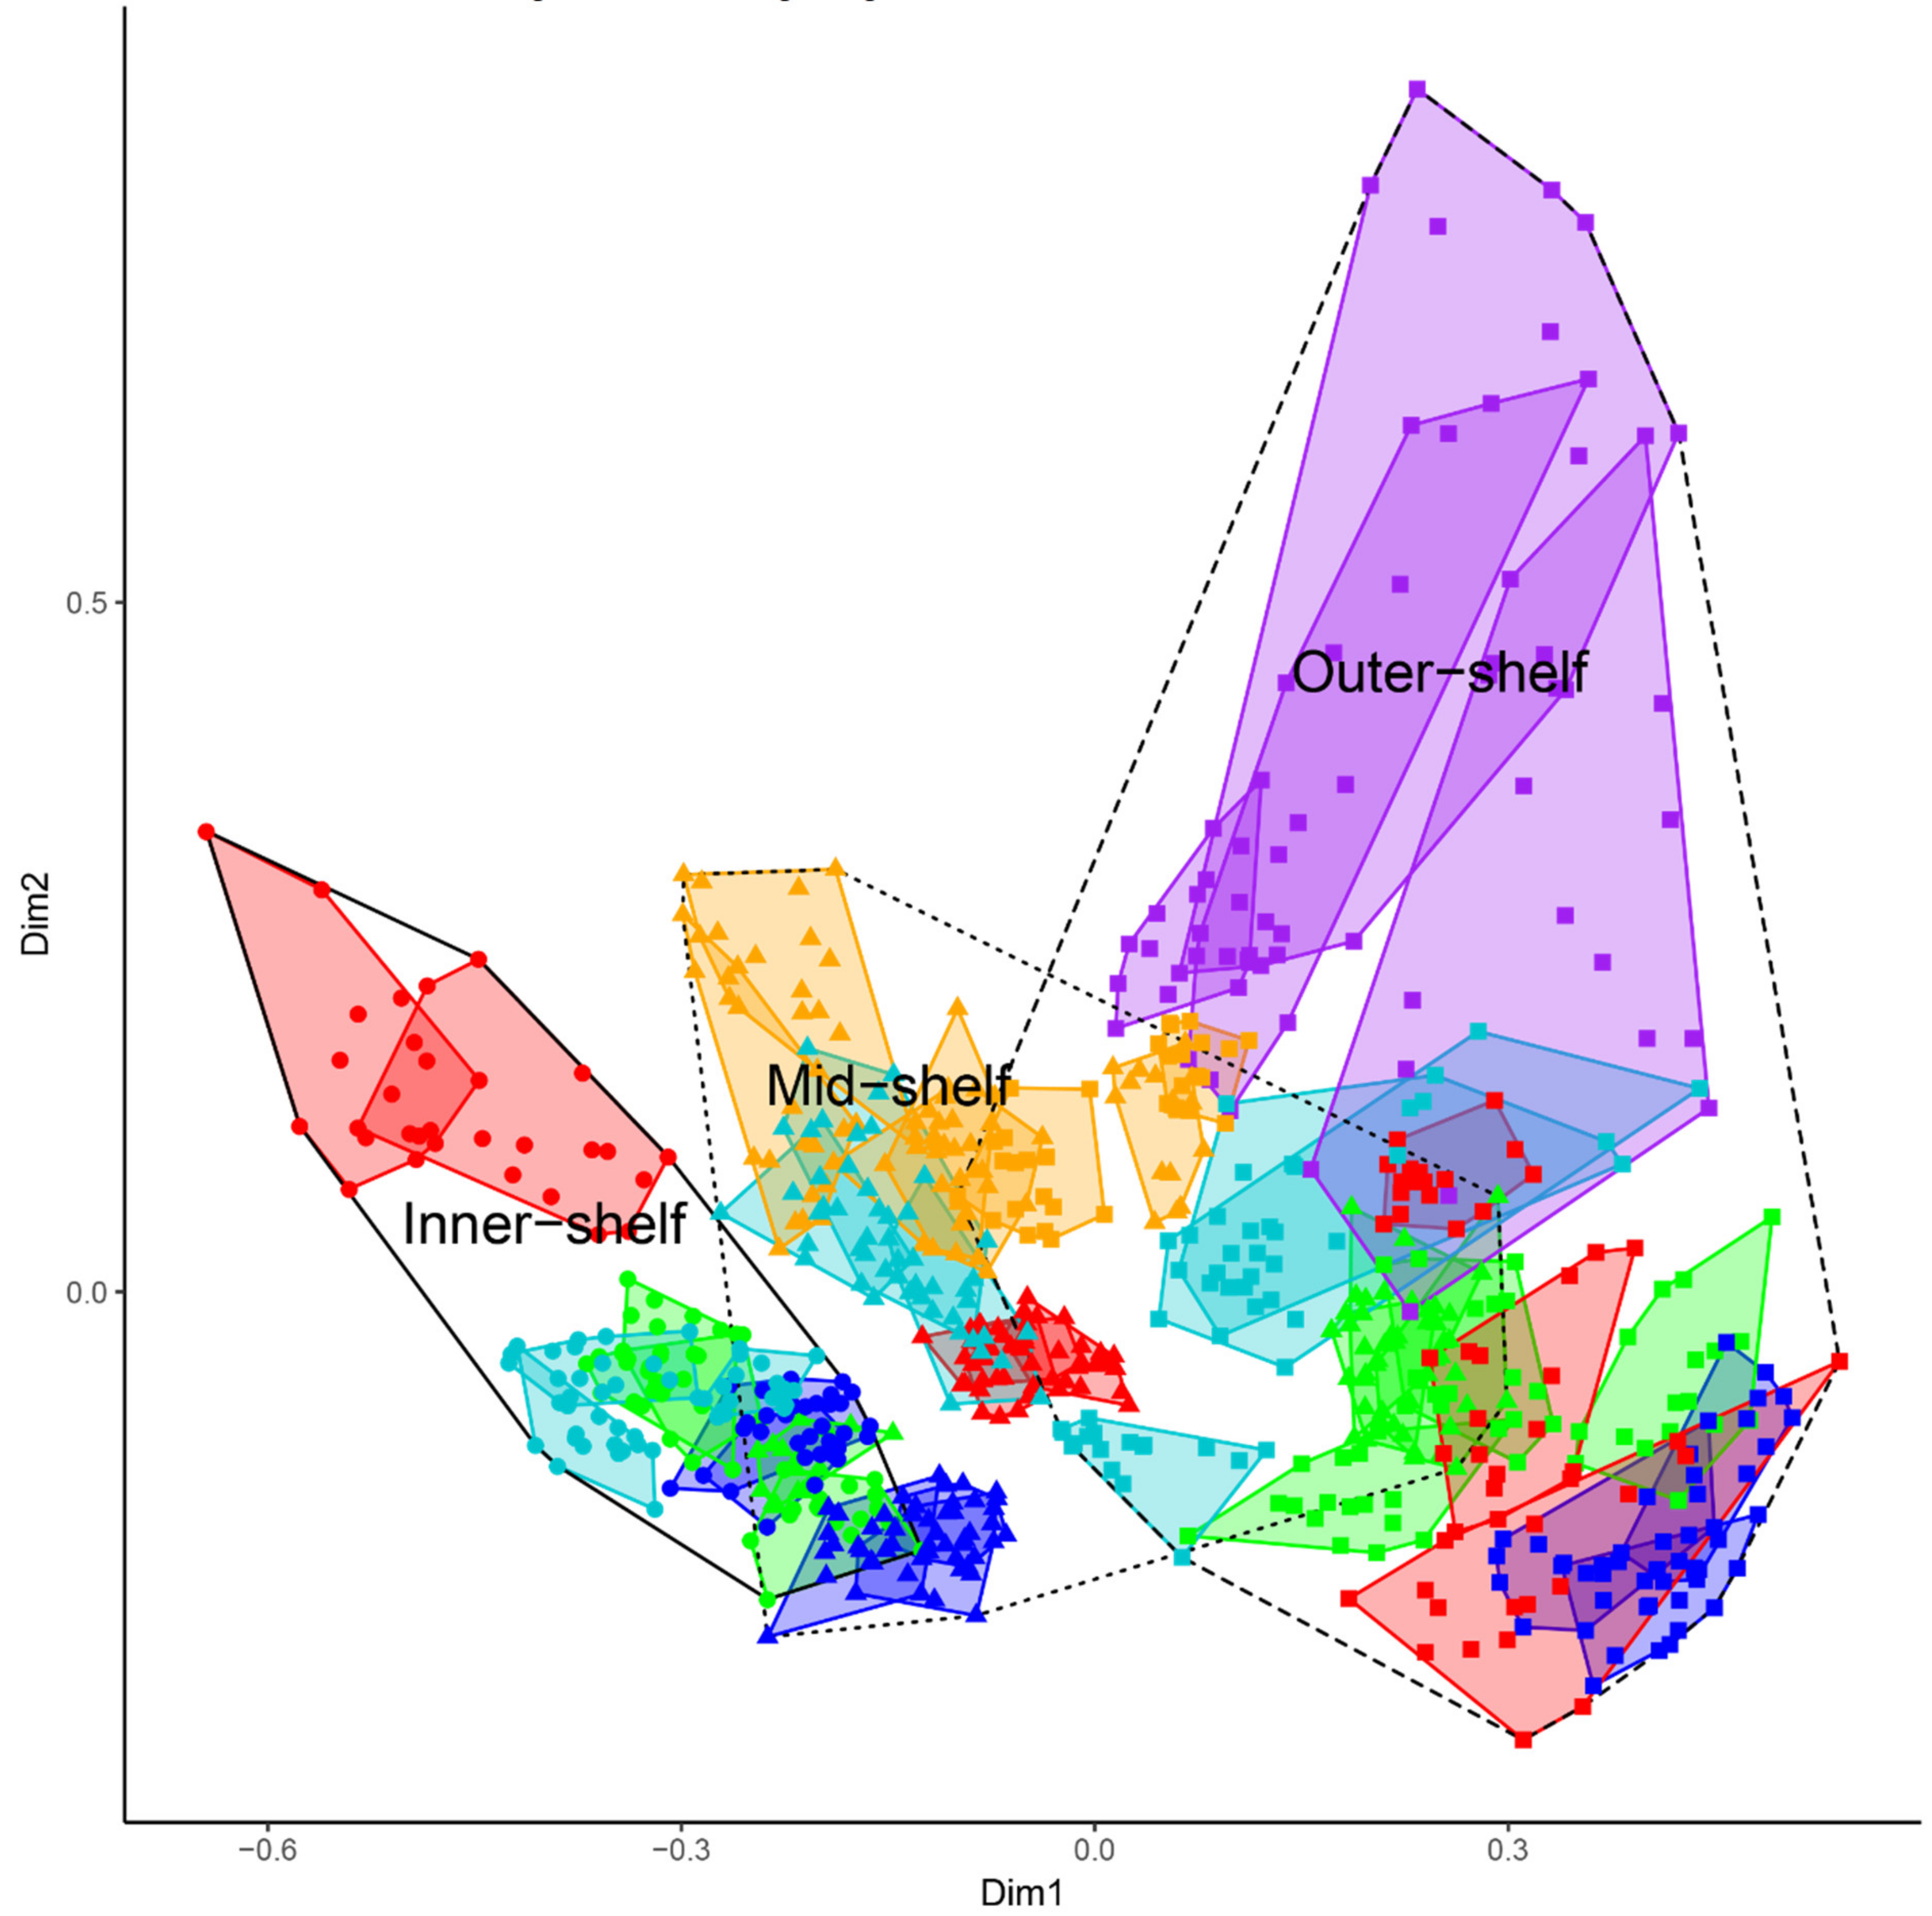
3.1.1. Cross-Shelf Patterns

Thirty eight species of planktivores and benthic planktivores were recorded on inshore reefs, 42 on both mid-shelf and outer-shelf reefs (Table 1). Planktivores were most abundant on mid-shelf reefs, with over half of the individuals recorded on these reefs (Table 1). Conversely, abundances of benthic planktivores were similar on inshore and mid-shelf reefs but much lower on outer reefs (Table 1). Most species were present in all shelf positions, although there were numerous species that were more abundant in one shelf position than the others. For example, 89% of Neopomacentrus cyanomos occurred on inshore reefs, while 99% of Chromis chrysura, Chromis iomelas and Chromis vanderbilti occurred on outer-shelf reefs (Table 1). Only two species were restricted to one shelf position: Neopomacentrus bankieri is an abundant planktivorous damselfish that was recorded only on inshore reefs, while Chromis agilis is a very rare planktivore that was only recorded on outer-shelf reefs (Table 1).

3.1.2. Latitudinal Patterns

The majority of planktivorous and benthic planktivorous damselfishes were found in every latitudinal sector. Only a few species were restricted to the northern or southern GBR. Species with northern restricted distributions (never recorded in the southern Swain or Capricorn-Bunker sectors) included the abundant planktivore N. bankieri, as well as some less abundant species such as Chromis iomelas, N. cyanomos, Chromis lineata, Amblyglyphidodon aureus and Chromis agilis (Table 1). However, the finding that N. bankieri had a northern distribution should be treated cautiously because this species was only recorded on inshore reefs in the north, but no inshore reefs were surveyed in the southern two sectors. Two species had southern restricted distributions, the planktivore Chromis nitida and the benthic planktivore Pomacentrus australis (Table 1).

3.2. Abundance and Species Richness of Planktivorous Damselfishes

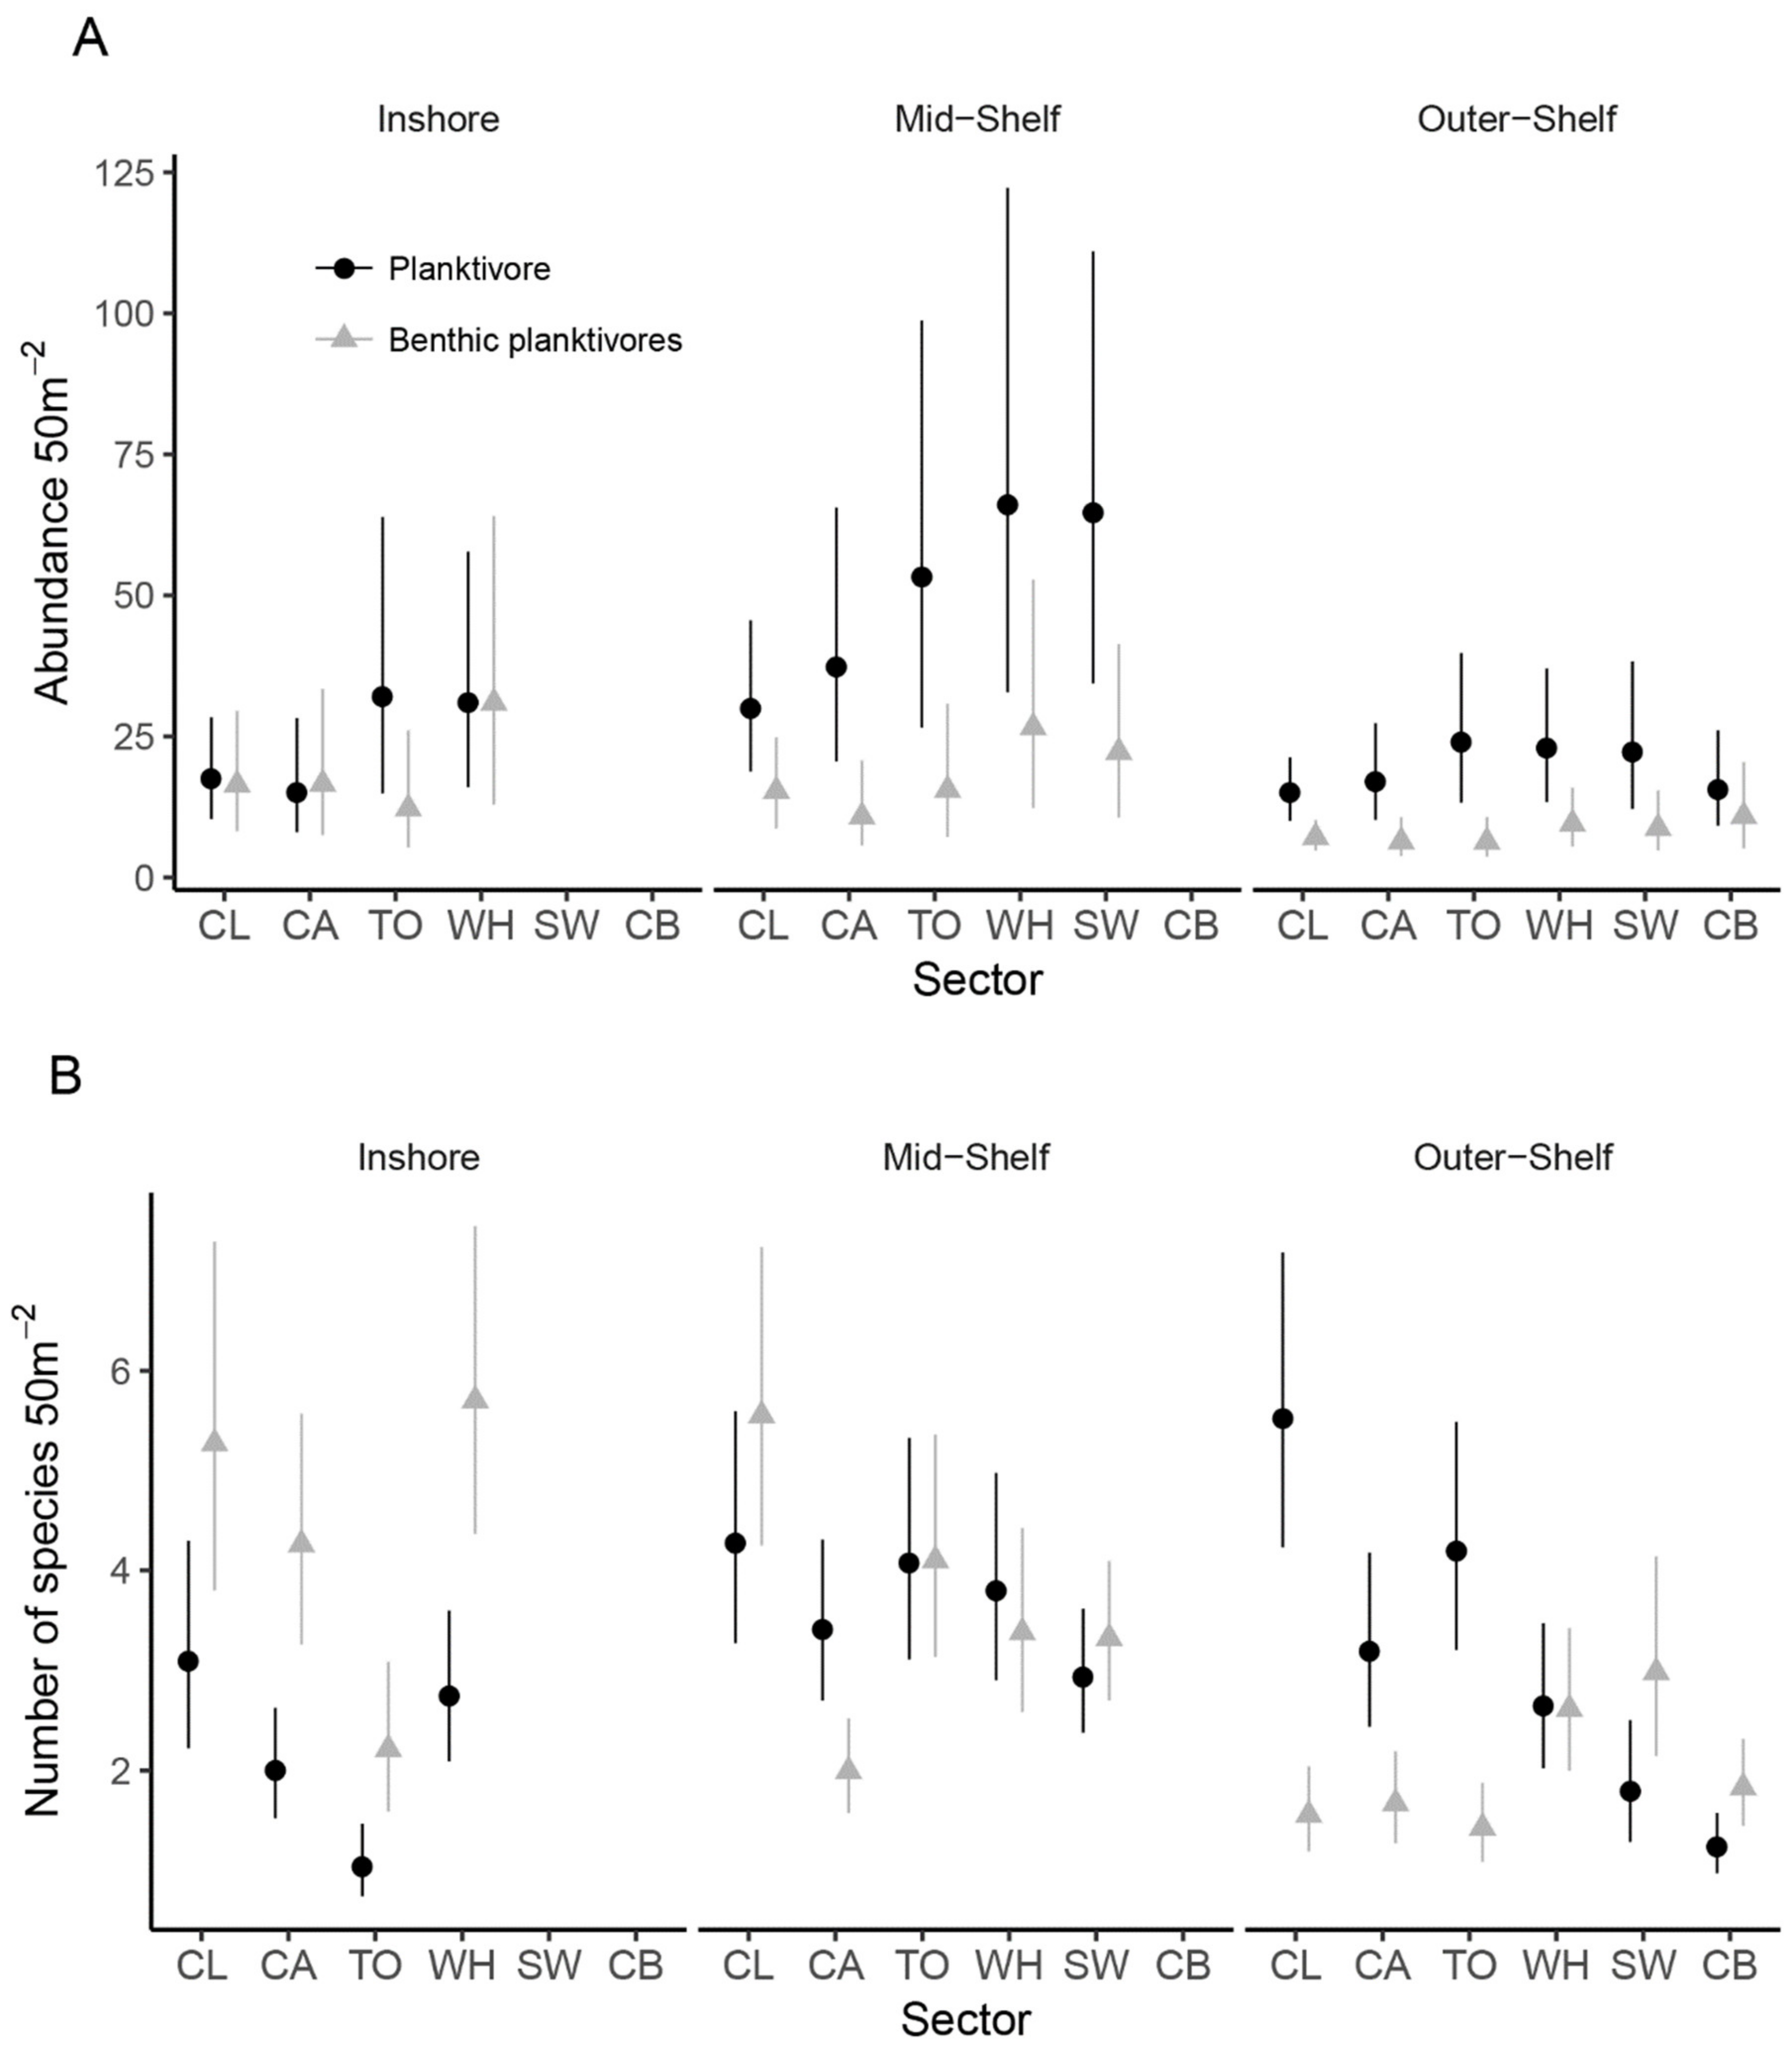
3.2.1. Sub-Regional Community Dynamics

The strongest spatial structure evident in GBR planktivorous fish assemblages was a partitioning of assemblage composition across the continental shelf (Figure 2; Table 2, ADONIS: Shelf SS 130.86, Fmodel = 397.18, p = 0.001). Despite some community overlap, there were distinct inshore, mid- and outer-shelf assemblages of planktivorous damselfishes (Figure 2). All main terms and two way interactions were significant in the ADONIS model (Table 2), but the significant high-order interaction term (Sector*Shelf*Year) indicates that reef fish communities in various sub-regions fluctuated through time independently of each other. Furthermore, the spatial factors of Sector and Shelf accounted for 34% of the variation in reef fish assemblage structure, far larger than the <1% of variation explained by temporal factors combined (Table 2). Effectively, reef fish community structure at each reef varied over time, but each community retained the characteristics of its cross shelf and latitudinal (sub-regional) setting (Figure 2).
The abundance and species richness of planktivorous and benthic planktivorous damselfishes varied among sub-regions resulting in few clear patterns across the shelf or with latitudinal sector (Figure 3). However, in each sector, highest numbers of damselfish planktivores were recorded on mid-shelf reefs (Figure 3). Cross-shelf patterns did differ among the two types of planktivorous damselfishes. The densities of planktivores, but not their species richness, were consistently higher than those of benthic planktivores on mid- and outer-shelf reefs. In contrast benthic planktivores were comparably abundant and more speciose than planktivores on inshore reefs. The only clear latitudinal pattern was a general decline in the species richness of planktivores from the central to the far southern GBR.

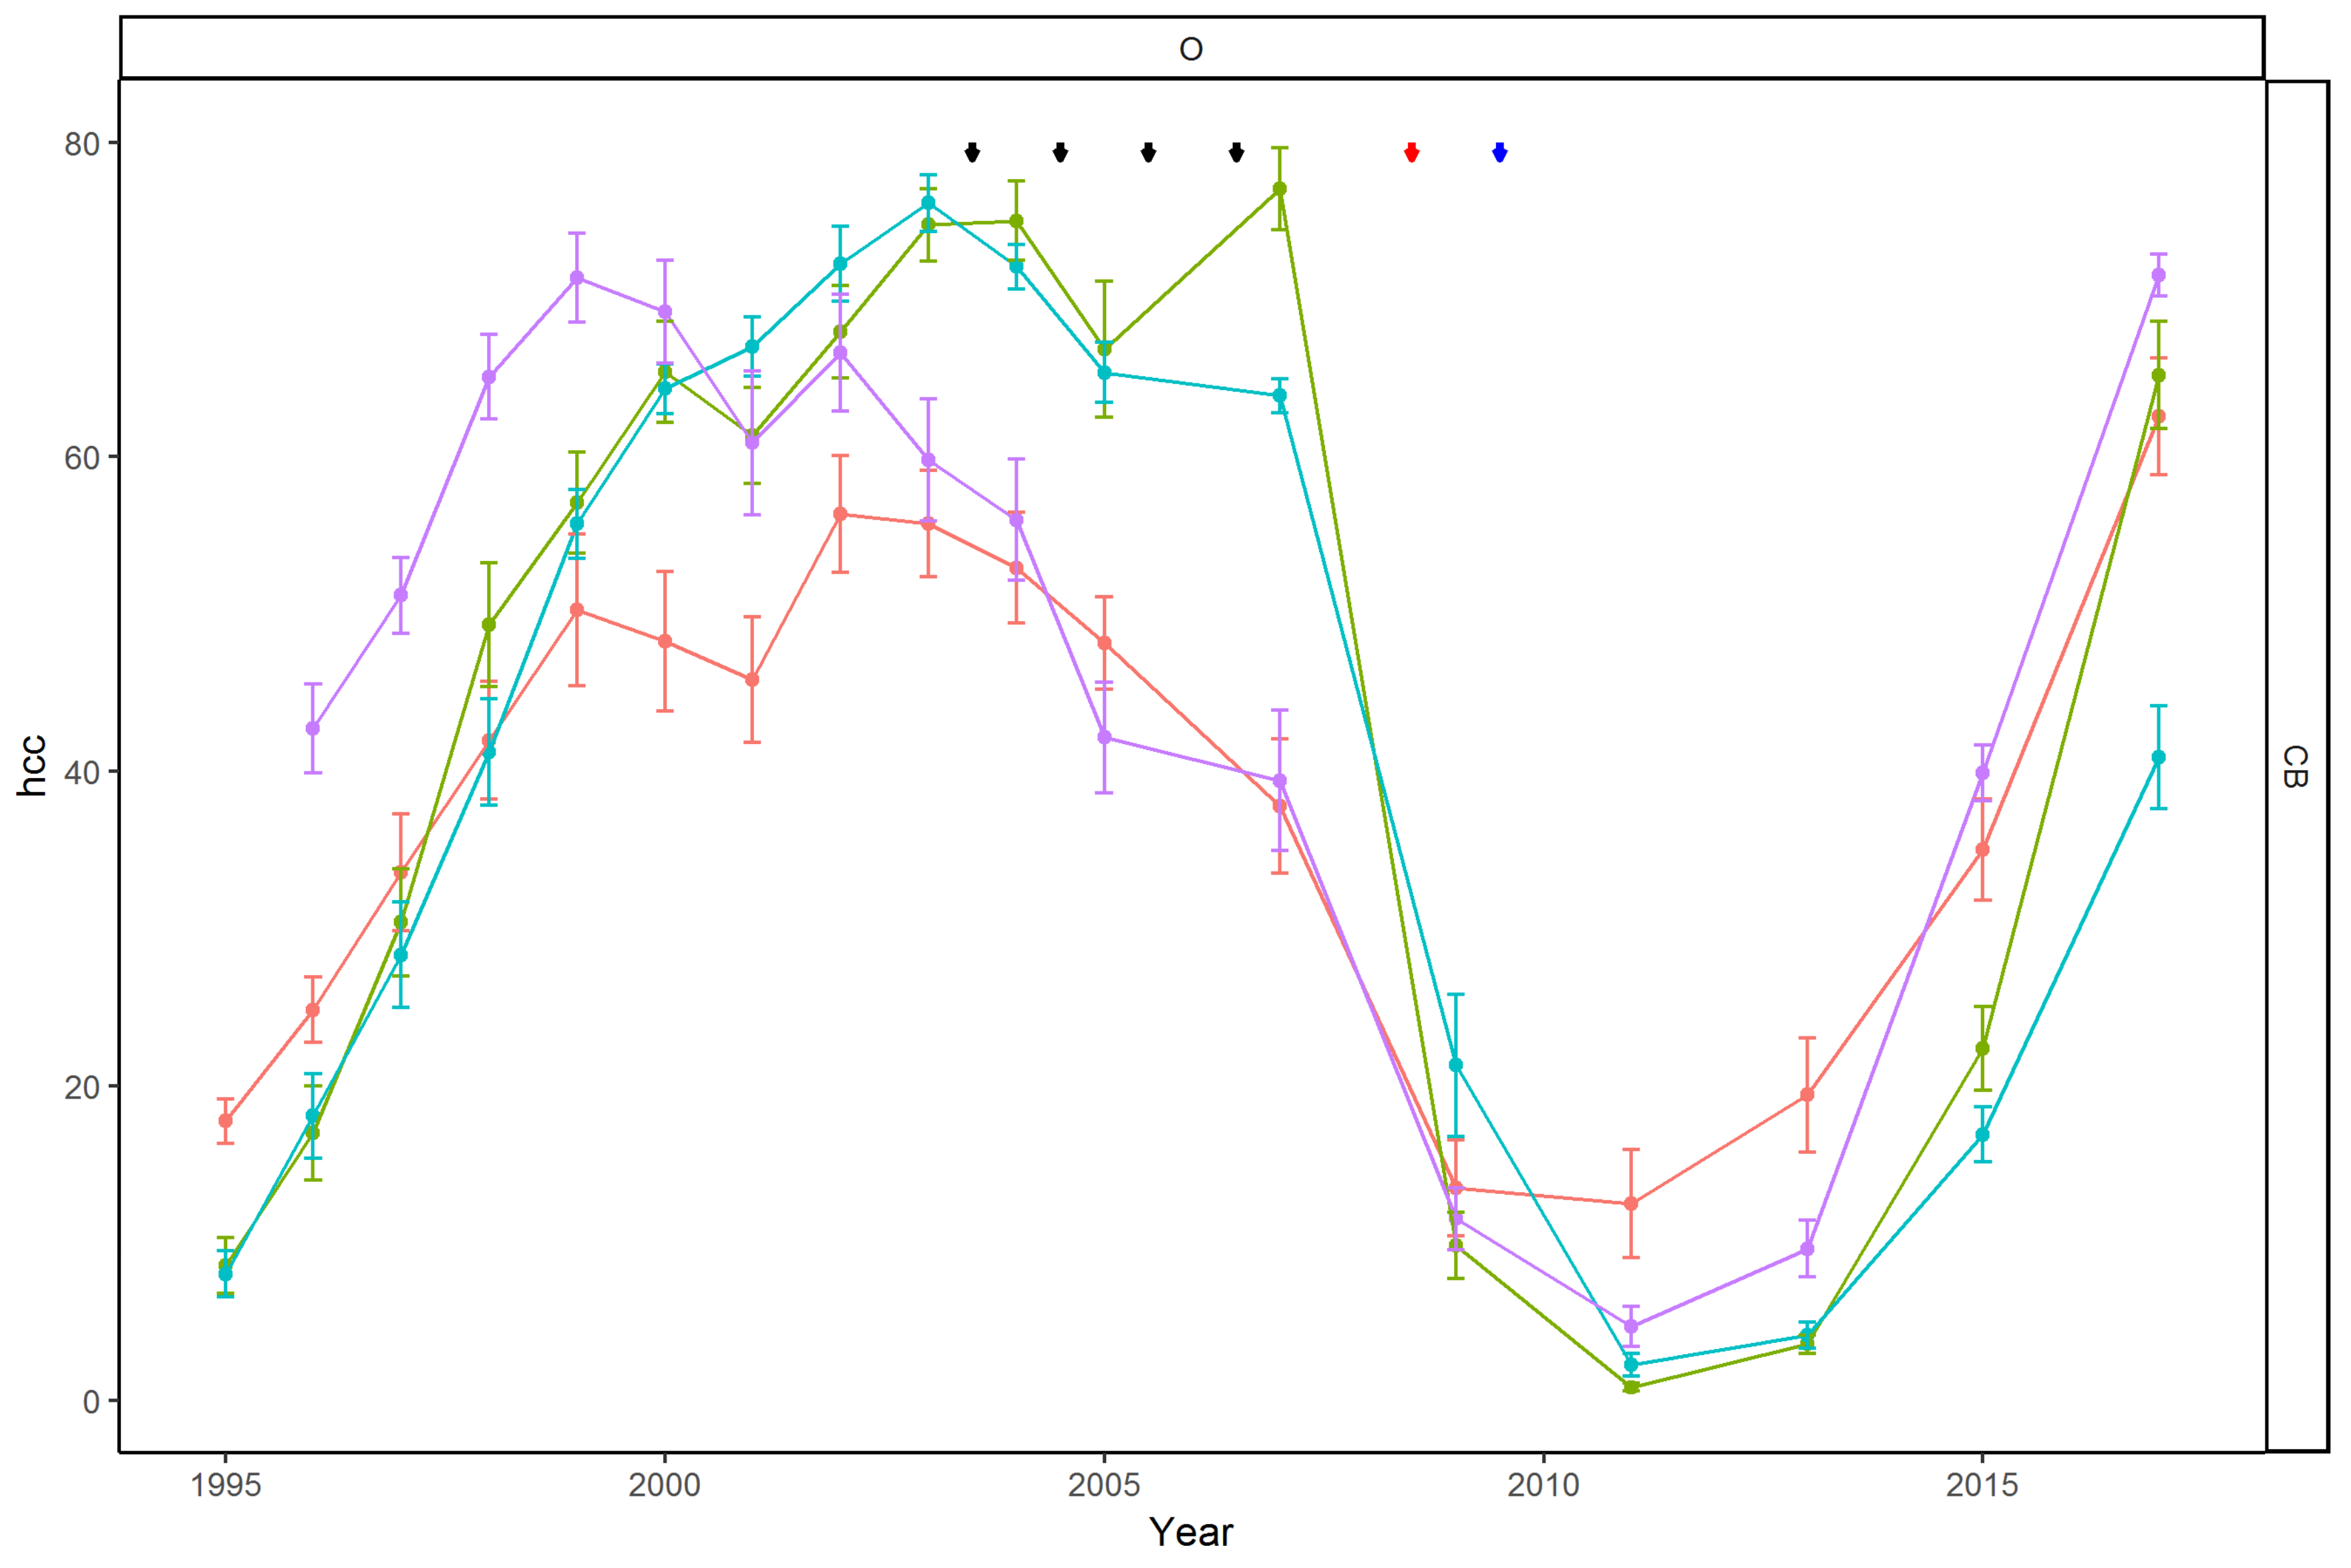
3.2.2. Temporal Patterns

Despite some annual variation, there were relatively few instances of significant temporal change in the abundance or species richness of planktivores and benthic planktivores (Figure 4). In general, benthic planktivores underwent much less temporal variability than the planktivores (Figure 4). Notable examples of change include decreases in the abundance of both functional groups on inner- and mid-shelf Cooktown-Lizard Island sector after 2010 associated with declines in hard coral cover following a sequence of disturbances including cyclones, outbreaks of the corallivorous crown-of-thorns starfish and coral bleaching (Figure 4, Figure A1 and Figure A2). In another example, planktivore abundance and species richness closely tracked increases and decreases in hard coral cover in the Capricorn-Bunker sector (Figure 4). Interestingly, benthic planktivores were largely unaffected by the same changes in the benthos in this sector (Figure 4).

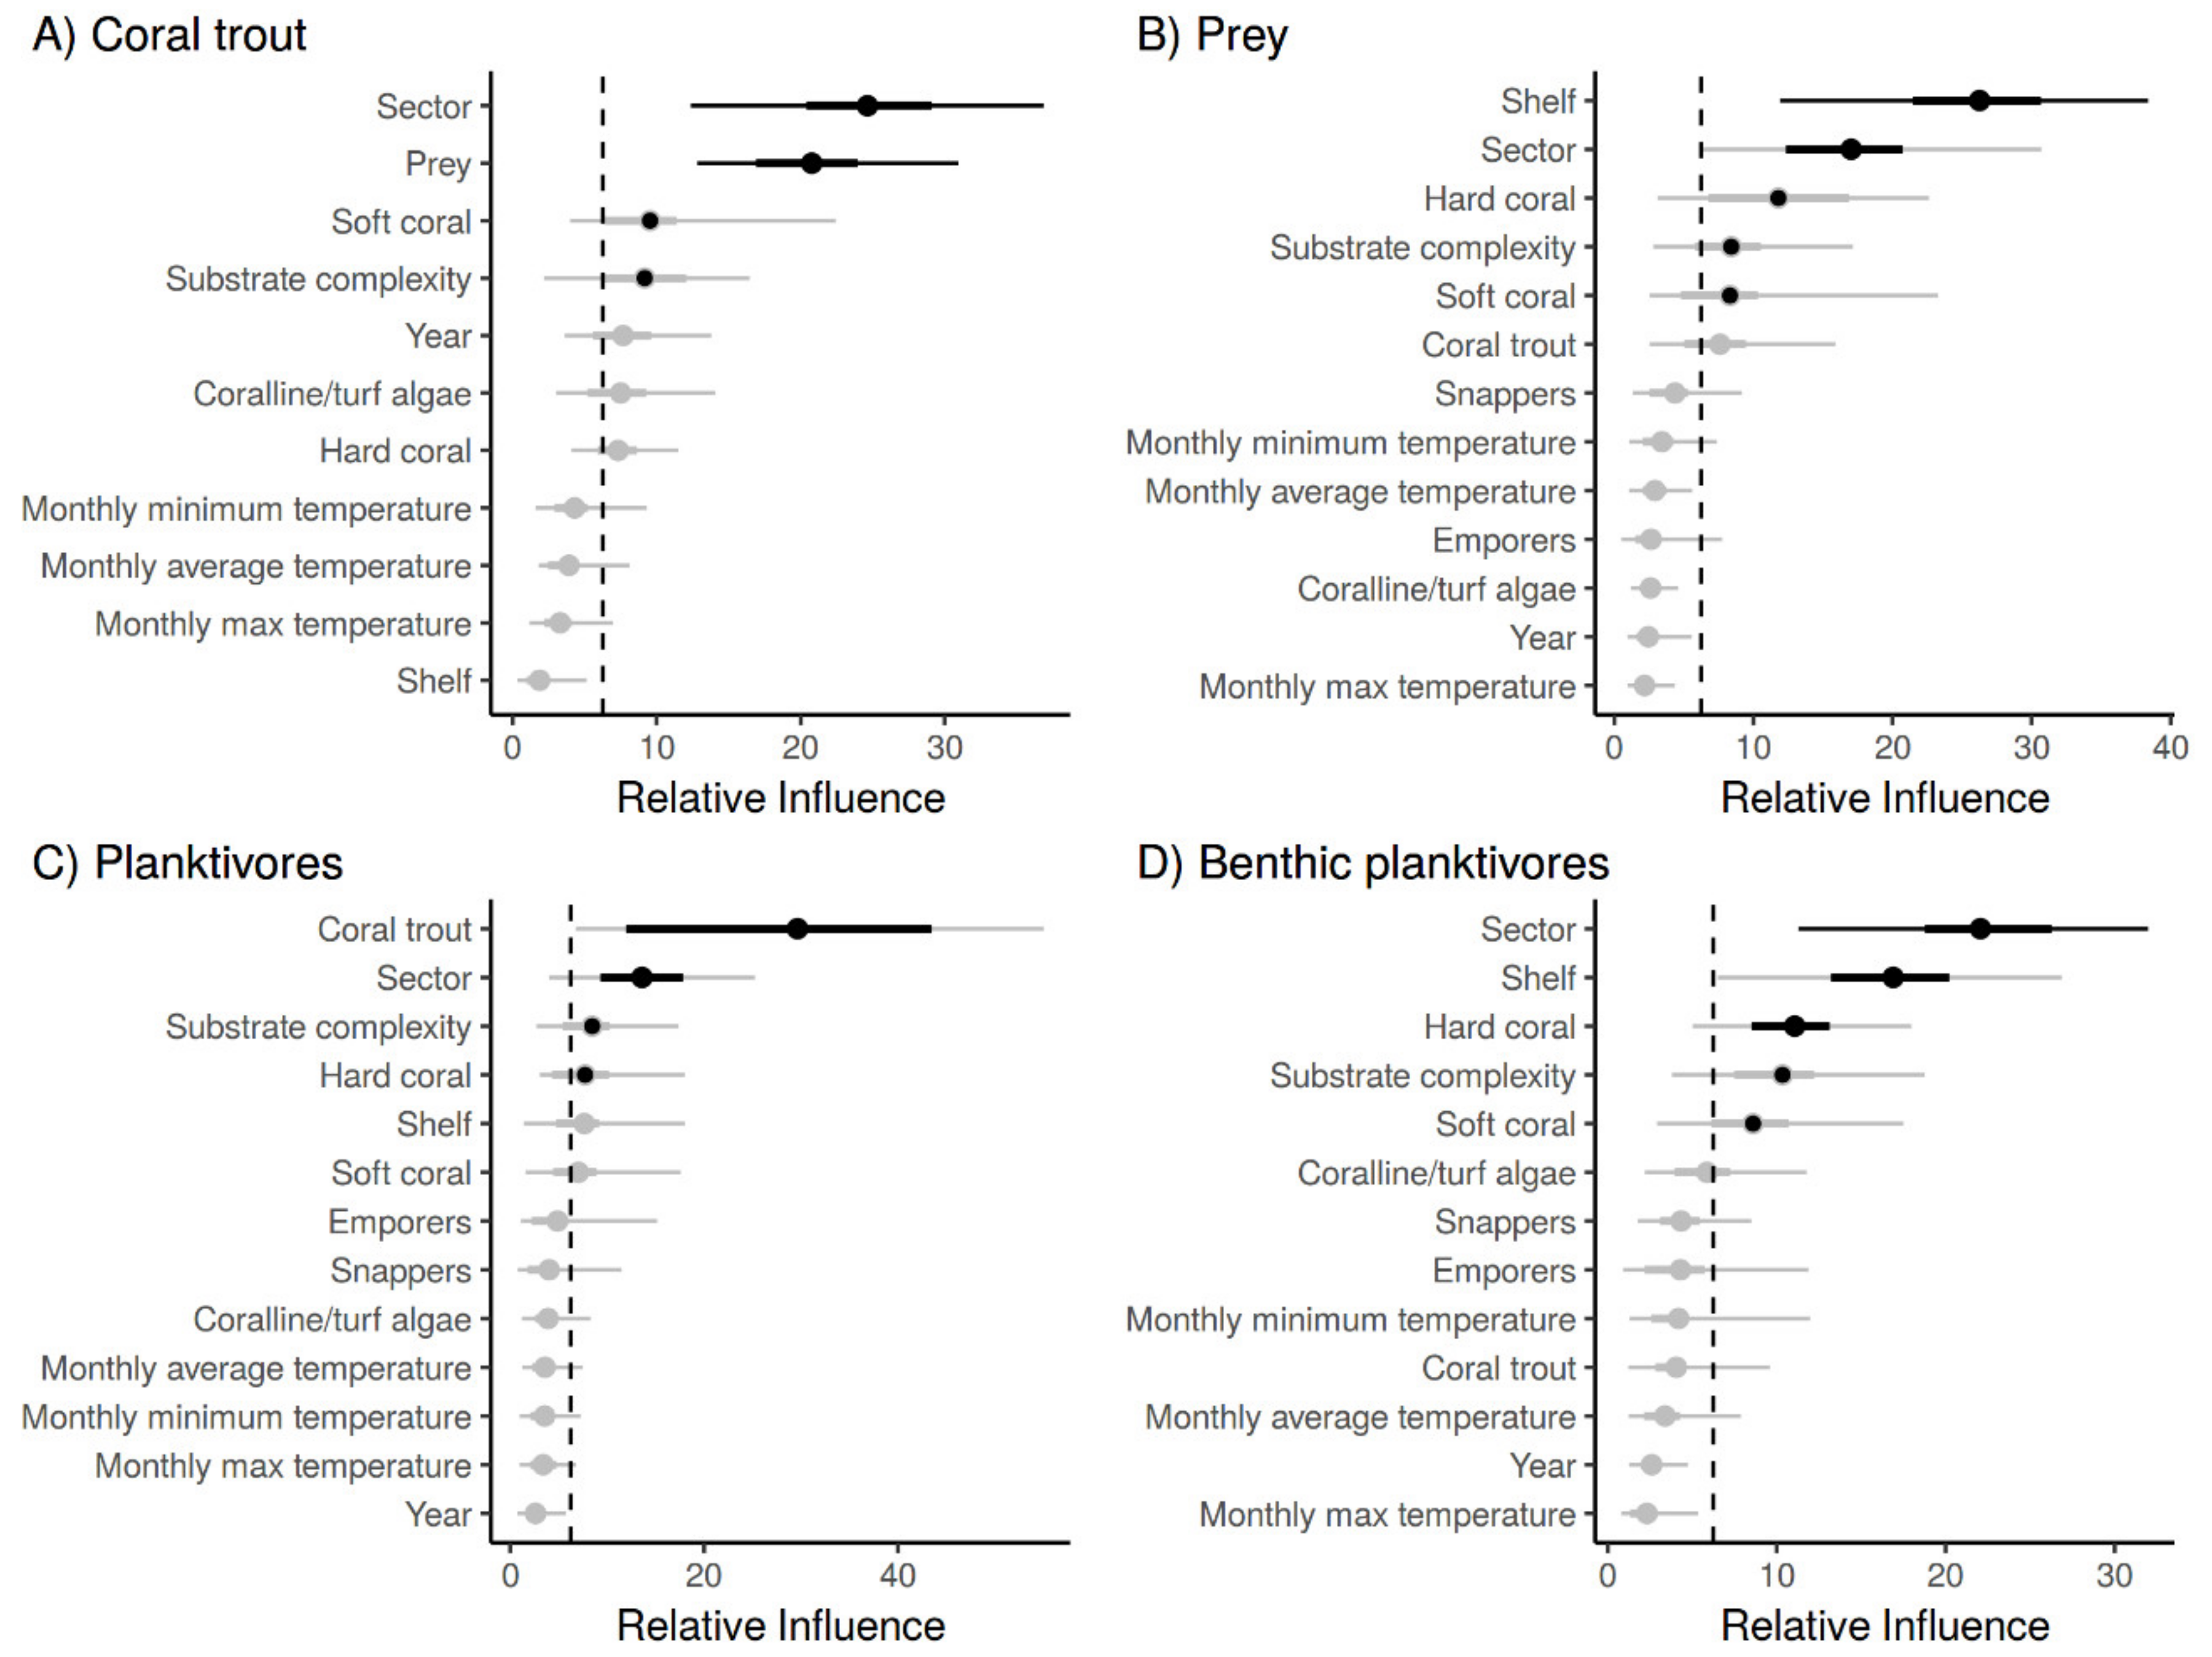
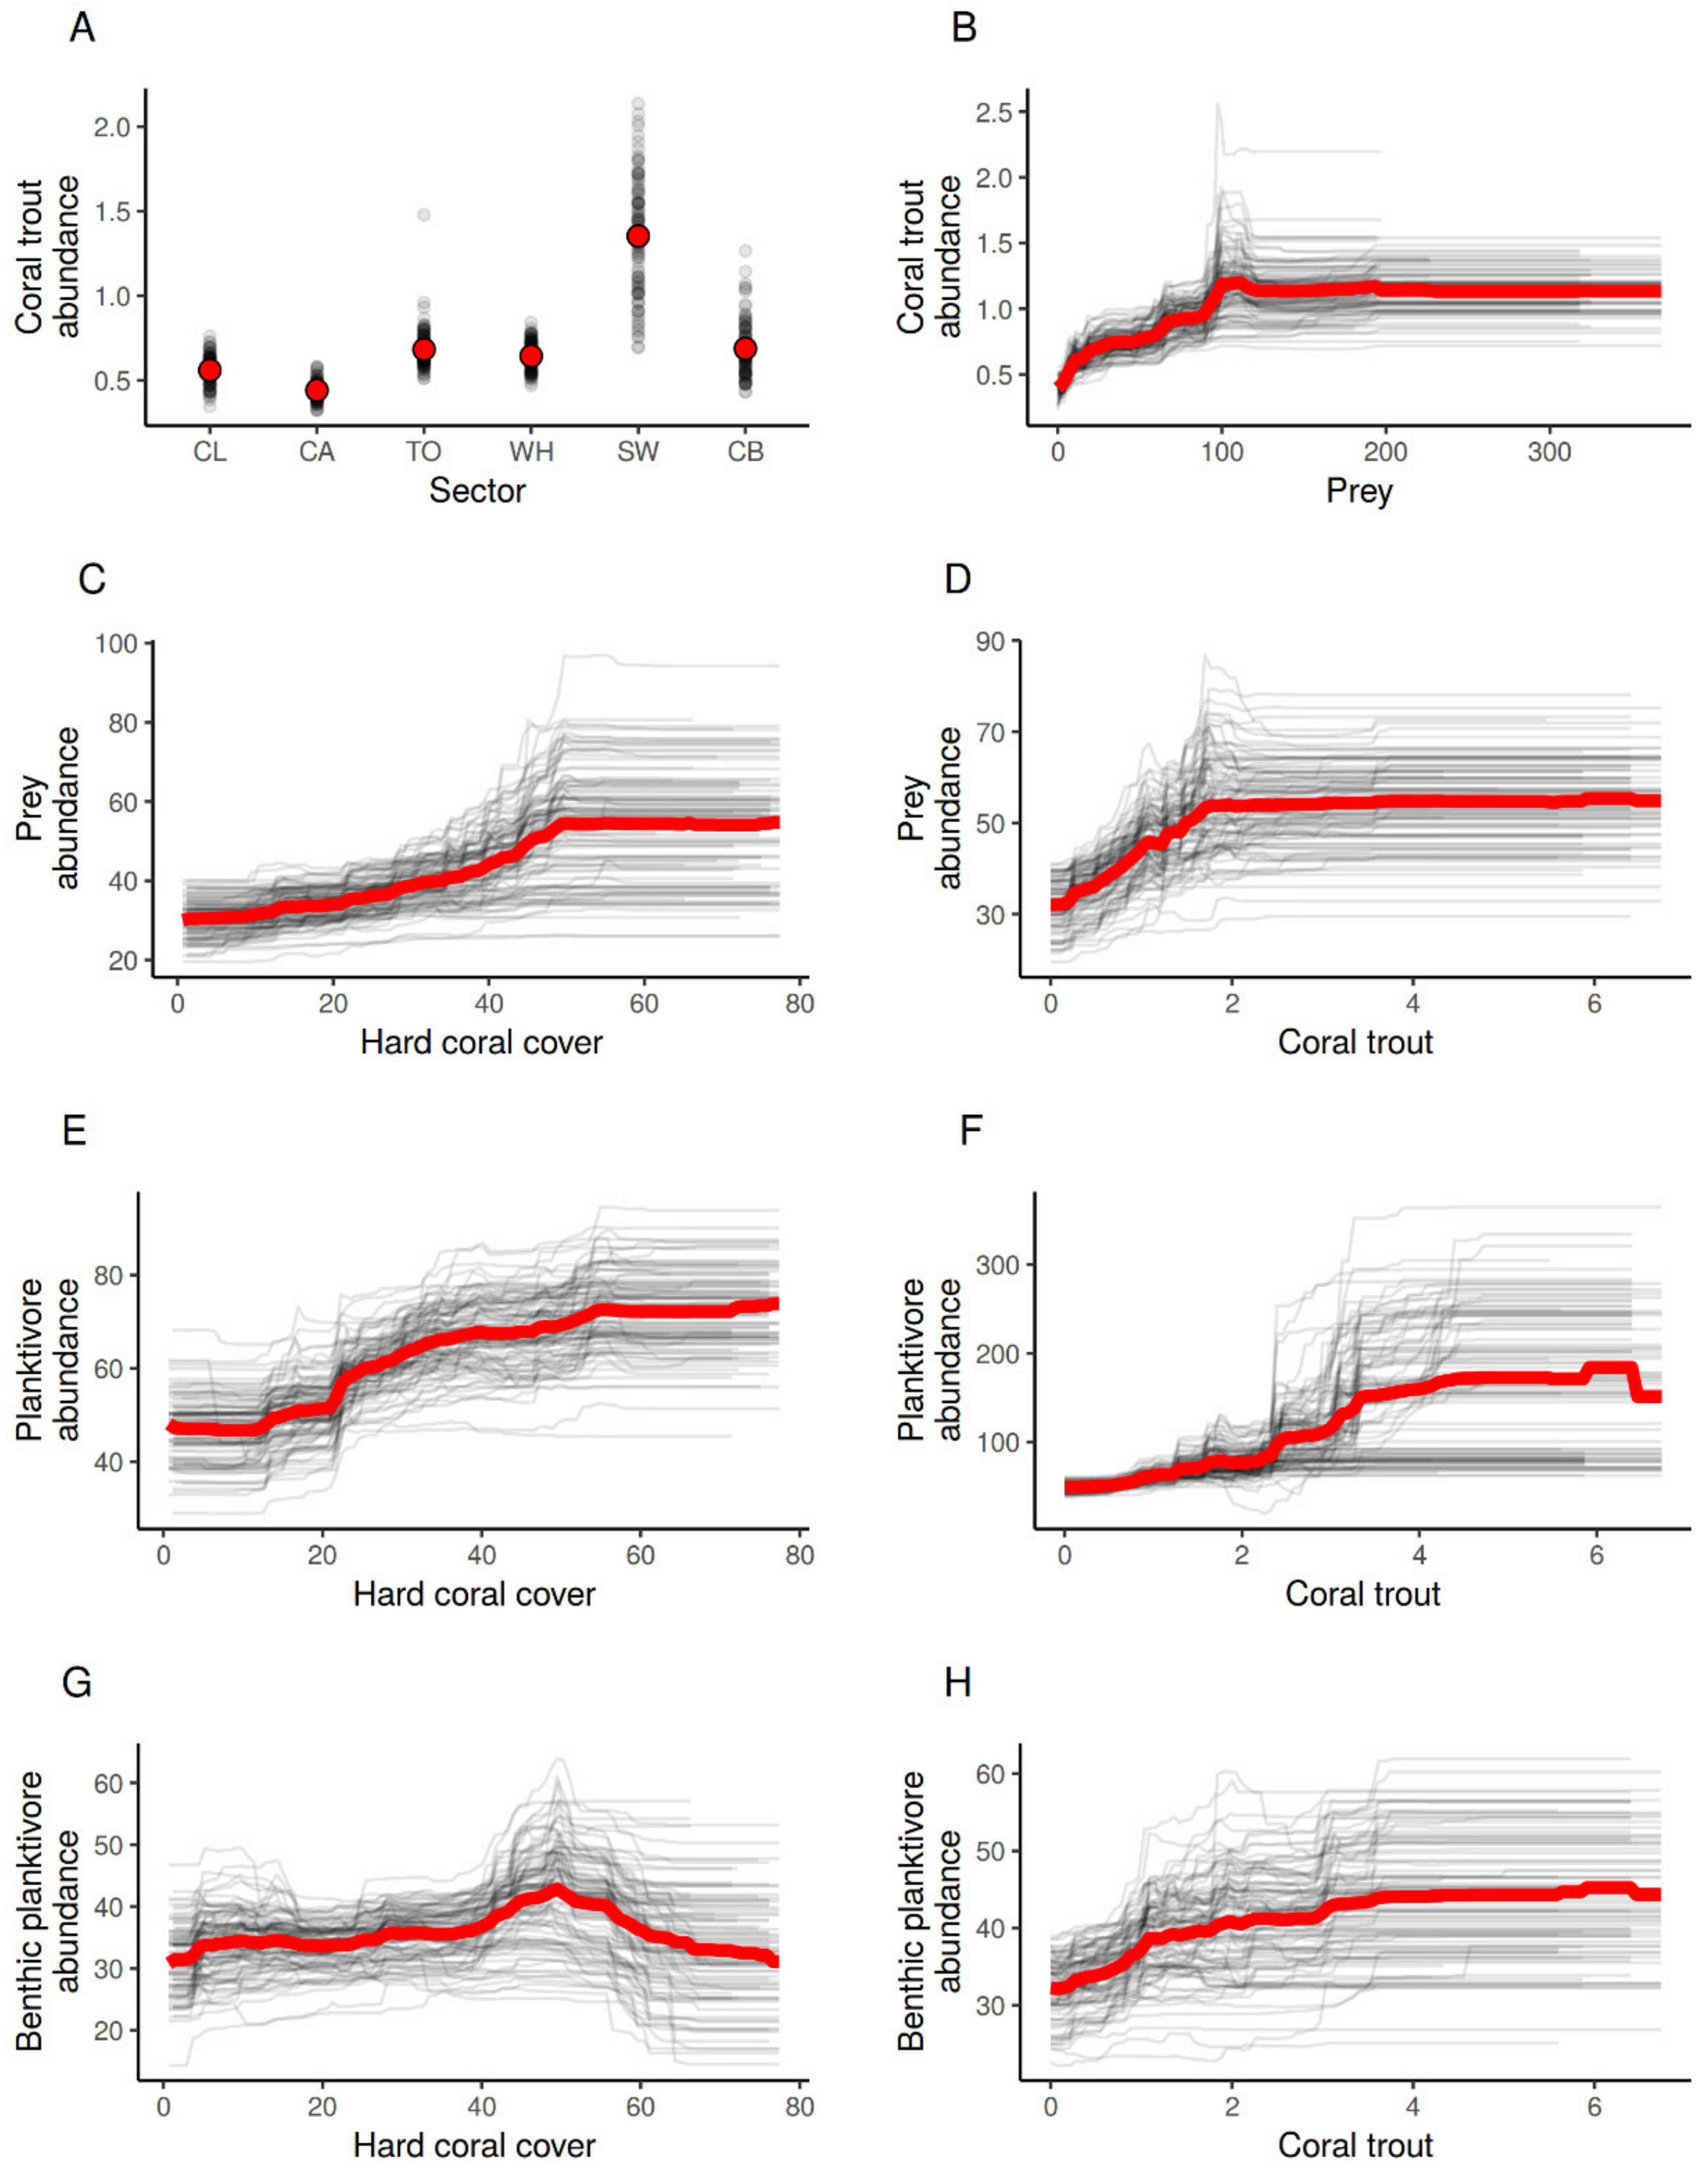
3.3. The Effects of Habitat and Predation on the Abundance of Planktivorous Damselfishes

There was evidence of an effect of coral habitat on the abundance of coral trout prey (χ2 = 23.817, p < 0.001), planktivores (χ2 = 22.029, p < 0.001) and benthic planktivores (χ2 = 19.182, p < 0.001). Positive associations (increases in hard coral cover and increases in abundance) were two to three times more likely to occur than by chance alone (Table 3: positive/positive (PP) chi-square residuals). Interestingly, there was also evidence for an effect of habitat on coral trout abundance (χ2 = 63.166, p < 0.001), with positive associations almost seven times more likely to occur than by chance alone (Table 3: PP chi-square residuals). In addition, we found no evidence for top down control of prey abundances by coral trout. Top-down effects should manifest in increases or decreases in trout abundance producing the opposite response in prey numbers. In fact, we found that decreases in trout abundances were four times less likely to be associated with increases in prey abundance than by chance alone, and similarly, increases in trout abundance were almost three times less likely to produce decreases in prey abundance than chance alone (Table 3: NP and PN chi-square residuals). Surprisingly, positive associations between trout and prey abundances were almost seven times more likely to occur (Table 3: PP chi-square residuals). Similar results were obtained for the comparisons of coral trout and both planktivores and benthic planktivores (Table 3).
Bootstrapped gradient boosted regression trees supported the spatio-temporal modelling showing that the spatial factors of latitudinal sector and position across the continental shelf consistently had a strong influence on the abundance of planktivores and benthic planktivores as well as the abundance of coral trout and their prey (Figure 5).
Coral trout abundance generally increased with latitudinal sector, and the highest abundances were recorded in the southern sectors (Figure 6A). Contrary to expectations under top-down control, there was a positive relationship between the abundance of coral trout and planktivorous damselfish prey (Figure 6B). While there was no distinct latitudinal pattern (Figure 6C), prey abundance was similar on inshore and mid-shelf reefs, but lowest on outer-shelf reefs (Figure 6D).
Benthic planktivore numbers were at their lowest levels in the central GBR while the highest abundances occurred in the southern Pompey and Capricorn-Bunker sectors (Figure 6E). There was a monotonic decline in benthic planktivore numbers across the continental shelf (Figure 6F). Coral trout abundance had a much weaker influence on benthic planktivores than the spatial factors (Figure 5), and contrary to predictions under top-down control had a positive relationship with benthic planktivores (Figure 6G). Coral trout abundance had the strongest influence on the numbers of planktivorous damselfishes (Figure 5), however the relationship was positive (Figure 6H).

4. Discussion

Our finding of strong cross-shelf differences in the composition of planktivorous damselfish assemblages adds to a long and diverse list of GBR organisms with similar cross-shelf patterns. These include zooplankton [43,46], algae [60,61], sponges [62], corals [63,64] and many other groups of fishes [27,64,65,66,67,68,69,70]. The fact that the composition of planktivorous damselfish communities were mostly retained over decades (the period of this study) in different settings throughout the GBR suggests that the factors driving these patterns are spatially strong and consistent. Cross-shelf changes in GBR reef communities from turbid coastal waters to clear oceanic waters at the continental shelf edge have been variously linked to environmental gradients in water quality, exposure to wave action and productivity [62,63]. Fundamental life-history factors of fishes such as larval availability, suitable settlement habitat and post-settlement survivorship can also vary broadly and persistently across the GBR shelf [3,43]. This combination of strong environmental gradients and spatially discrete life-history factors appears to have defined the niche for individual species on the GBR and helped shape and maintain cross-shelf patterns [23]. The structure of damselfish assemblages at smaller scales (e.g., within individual reefs), will depend on patterns established at broader spatial scales, but also will be defined by the partitioning of niche space among habitats. For example, recent work using stable isotopes has revealed that damselfish assemblages utilise fine-scale niche partitioning to ensure co-existence of many species with limited spatial overlap [23,24].
Cross shelf differences in community composition were not generally reflected in broad metrics of abundance and species richness, nor were there clear latitudinal patterns in these metrics. Few species had distributions that were truncated in the north and south, and similar results have been found for butterflyfishes and herbivorous fishes on the GBR [64,69] and for herbivorous fishes in other tropical parts of the globe [71]. The lack of strong latitudinal patterns within tropical environments in these previous studies was linked to the consistency of environmental conditions and climate in the tropics, which provided few drivers of change. It seems reasonable that the lack of latitudinal patterns in the present study similarly stems from weak latitudinal changes in these parameters and more from changes in habitat and food requirements, and their availability.
Overall, the spatial factors of shelf and sector, along with hard coral cover consistently ranked among the most influential factors on planktivorous damselfish abundances in the regression tree analyses, despite few consistent cross-shelf or latitudinal patterns. This highlights the strong influence of discrete sub-regional (i.e., sector-shelf position) and habitat combinations on the abundance of planktivorous damselfishes on the GBR irrespective of strong cross-shelf patterns in community composition. We found no other studies that have quantified the distribution and abundance of planktivorous damselfishes across the broad spatial scales examined here, either on the GBR or in other tropical regions. The present study represents a current state of knowledge about the distribution and abundance of planktivorous damselfishes across much of the GBR. The strong changes in community composition across the continental shelf could have resulted from individual species responding differentially to cross-shelf changes in many variables including habitat, top-down control by their predators, bottom-up control by their prey or a combination of all of these factors. It should be noted that cover of soft corals was not included as a co-variate in this study because there had previously been little support for their role as habitat or food for planktivorous damselfishes. However, certain planktivorous damselfishes were recently shown to be positively associated with soft corals [72], suggesting that future distributional studies on coral reef fishes should consider the influence of soft corals.
While spatial factors were consistently important in defining the distribution, abundance and assemblage structure of planktivorous damselfishes, significant reductions in abundance and diversity through time were uncommon and tended to be restricted to perturbations which reduced live hard coral cover and ultimately caused reductions in planktivorous damselfish abundance. Some disturbances such as coral bleaching and crown-of-thorns starfish predation kill coral tissue but still leave the habitat structure provided by the skeletons [25,73]. However this does not necessarily mean that fishes dependent on coral habitat are unaffected as shown by the response of Pomacentrus moluccensis, one of the planktivorous damselfishes in our study, which immediately vacated coral branches once the coral had died, despite ample remaining shelter space [74]. Some loss of live coral cover in our study was also due to cyclonic removal of entire coral structures with associated reductions in habitat complexity. In these cases the loss of coral-dependent planktivorous damselfishes was unsurprising as loss of key habitat and overall habitat complexity is considered a fundamental cause of species declines on coral reefs [28,75]. Negative changes to planktivorous damselfish assemblages were more pronounced in planktivores than in benthic planktivores, suggesting that the loss of structure is more detrimental to planktivores which utilise complex three dimensional structure afforded by coral skeletons than to benthic planktivores of which many have a more facultative relationship with corals.
In this study we surmised that if top-down control was operating on the GBR then higher abundances of predatory coral trout should be inversely related to numbers of planktivorous damselfishes, particularly of preferred prey species, and that this in turn could alter damselfish community compositions. While changes in prey communities following changes in predator numbers have been noted in a number of marine systems (e.g., fish-urchin relationships) [16,76], evidence of such top-down control in coral reef fishes is more equivocal. This is somewhat surprising given that piscivorous fishes are significant consumers of fish biomass on reefs [77]. Previous correlative studies suggested that the distribution and abundance of small bodied GBR damselfishes can be controlled via top-down processes such as variation in the numbers of the predatory coral trout [9,10], and ran contrary to the supposition that such effects would be weak in complex systems [78,79]. Here our results of a very strong positive relationship between predator and prey from multiple lines of evidence suggested that top-down control of planktivorous damselfishes by one group of common predators (coral trout) was not a strong determinant of their relative abundance. Given that coral trout are mobile and opportunistic predators, it is feasible that our results reflect trout aggregating where their prey are more numerous, particularly so given that prey abundance alone explained ~27% of the variation in abundance of coral trout. Indeed coral trout on the GBR readily aggregate among dense seasonal influxes of Apogonid fishes and will gorge on those fishes to the point of stomach distension (A.J.C. pers obs). However, the fact that more trout did not result in fewer planktivorous damselfishes, as would be expected from top-down control, could mean that planktivores were sufficiently numerous to buffer higher rates of consumption by trout and still retain relatively high numbers. It is also possible that the positive relationship between numbers of trout and planktivorous damselfishes could become negative at trout numbers higher than we recorded. In essence trout numbers on the GBR were never high enough for their feeding to impact numbers of damselfish beyond a threshold where they began to decline. Additionally, where damselfish numbers are high, the positive cues which drive such abundances may also act positively on other fishes upon which coral trout prey, meaning that the relative rate of consumption of those damselfishes remains similar to areas of lower abundance. Finally, the taxonomic resolution of our study may have resulted in negative relationships being missed. Recent studies have shown that the different species within the coral trout complex (e.g., Plectropomus leopardus and Plectropomus laevis) utilise different prey sources [42]. Analysing these relationships at finer taxonomic resolution may in fact reveal evidence of top-down control, and could be an area for future research.
One obvious cue for increased numbers of both planktivorous damselfishes and coral trout is preferred habitat. Indeed, both planktivorous damselfishes and coral trout individually showed strong positive relationships with hard coral cover, the key structural habitat on coral reefs, and the importance of corals for planktivorous damselfishes was reinforced by their most extreme sub-regional losses being associated with major coral losses. It is not likely that planktivorous damselfishes are drawn to reside where their predators are abundant so their positive association with both coral trout and hard coral cover almost certainly arises from the requirement for corals for habitat, food, and shelter, both as adults [21,31,80] and for recruitment and settlement [81], not from a fondness for trout. The positive relationship of trout with coral cover may be indirect; trout may aggregate where both damselfish prey and ambush shelter (the coral structures) are more abundant. But this relationship may also, irrespective of trophic relationships, reflect a direct preference by adult trout for coral cover and the structural relief it provides [82,83]; they too need shelter from even larger predators and as resting sites [84], and may prefer proximity to associated cleaning stations [85]. In addition, coral trout have relatively small conserved home ranges meaning that outside of spawning seasons, they tend to occupy the same patch of reef [86]. The collinearity of all three variables reveals the complexity of coral reef systems that belie simple models of top-down control. In essence, habitat appears to be directly driving damselfish abundances and indirectly and directly driving coral trout abundances.
A direct assessment of the bottom-up influences of GBR plankton distributions on the abundance of planktivorous damselfishes was beyond the scope of this study. However, we assessed the GBR plankton literature for any positive associations of plankton abundance with our most consistent spatial pattern of abundance: higher numbers of damselfish planktivores on mid-shelf reefs than on both outer and inshore reefs. There is limited information on the broad-scale distributional patterns of zooplankton on the GBR, but copepods, the preferred prey of many planktivorous fishes [87,88], have been recorded as more abundant on mid-shelf reefs, where our planktivores were most abundant, than on outer reefs [43]. Distinct inshore and offshore communities have also been identified across the central GBR shelf with inshore waters also supporting smaller copepods [44,45]. Whether these discrete inshore zooplankton communities are less preferred prey of damselfish planktivores, so influencing their relatively low abundance on inshore reefs compared to mid-shelf reefs is unknown. However, these associations suggest that bottom up processes (i.e., plankton availability) could be influencing the spatial structure of planktivorous damselfish communities on the GBR, warranting further research to support or dispel this notion.
The reasons for different spatial patterns in abundance and species richness between planktivores and benthic planktivores are not clear, but there are some possible explanations. Higher sub-regional values for benthic planktivore abundance on inshore and mid-shelf reefs, and lowest values on outer reefs appear to be partially related to exposure. The overwhelmingly dominant benthic planktivore on the GBR (44% of total abundance), Pomacentrus moluccensis, preferentially lives within relatively fragile branching corals that do not often persist on outer reefs due to destruction by oceanic waves, but can grow prolifically in the relatively calmer shelf waters [63]. In contrast the dominant GBR planktivore (32% of total abundance), Pomacentrus lepidogenys, while mostly associated with coral communities, is not restricted to one particular coral head like P. moluccensis and so can seek the best location to manage strong water movement, possibly helping to explain why planktivore abundances differed less among inshore and outer habitats. It is also noteworthy that numbers of benthic planktivores were not greatest on the mid-shelf as were those of planktivores, despite both groups having mostly comparable species richness. We speculated earlier that mid-shelf planktivores may have responded positively to higher abundances of zooplankton, but if so why would benthic planktivores not follow suit? It may be that having a dual feeding habitat makes it difficult to switch to just one prey source when abundant. It may also be that much of the mid-shelf plankton is high in the water column where many planktivores often feed, whereas most benthic planktivores do not rise so far off the bottom when plankton feeding (AJC pers obs). This possibly limits their access to plankton, leaving the available plankton supply to be mostly consumed by the full-time planktivores (see [1]). Another contributing factor is likely to be that the second and third most dominant planktivores (Neopomacentrus azysron and Chromis nitida), making up 36% of total planktivore abundance, have a tendency to form hyper-abundant schools compared to the more modest schooling behaviour of dominant benthic planktivores on the mid-shelf. N. azysron and C. nitida may have more of a capacity to recruit in large numbers and persist if conditions are favourable so radically boosting total numbers of planktivores. More research is clearly necessary to understand what is driving the different distributional patterns of the two groups of planktivorous damselfishes.

5. Conclusions

Planktivorous damselfishes of the GBR are abundant and diverse, and their assemblages are strongly structured across the continental shelf reflecting cross shelf gradients in environmental drivers such as habitat and zooplankton availability. They have weak latitudinal structure, no doubt a reflection of the consistency in tropical conditions and climate. Contrary to previous studies on the GBR, we found no evidence that planktivorous damselfish abundance was controlled via top down predation, but rather we found that both predators and prey were positively associated with each other, and with coral habitat, which suggests that numbers of these fishes are heavily determined by the availability of suitable habitat, and that coral trout tend to be found in high numbers where there are large aggregations of their prey. Our findings highlight the complexity of environmental factors and interactions among reef organisms that may contribute to observed distributions of planktivorous damselfishes. They also reinforce the fundamental importance of coral habitat to provide the foundation for diverse fish assemblages and for natural trophic interactions to play out.

Author Contributions

Conceptualisation, M.J.E., A.J.C. and M.L.; methodology, M.J.E., A.J.C. and M.L.; formal analysis, M.J.E. and M.L.; investigation, M.J.E. and A.J.C.; data curation, M.J.E., A.J.C. and M.L.; writing—original draft preparation, M.J.E. and A.J.C.; writing—review and editing, M.J.E., A.J.C. and M.L.; visualisation, M.J.E. and M.L.; supervision, M.J.E.; project administration, M.J.E. and A.J.C.

Funding

This research received no external funding.

Acknowledgments

We thank all past and present members of the Long Term Monitoring Team at the Australian Institute of Marine Science and the crews of the RV Cape Ferguson, RV Lady Basten, RV Harry Messel and RV Sirius. This manuscript was greatly improved by the comments and suggestions of two anonymous reviewers.

Conflicts of Interest

The authors declare no conflict of interest.

Appendix A

Bootstrapped Gradient Boosted Regression Trees

To examine the relative influence of a range of variables on the abundance of planktivores, benthic planktivores, coral trout and their planktivorous damselfish prey, we bootstrapped gradient boosted regression trees. Such an approach enabled us to examine the relative influence of each variable, the relationship between response and explanatory variables and as the models were run multiple times, and estimate of uncertainty in the relationships. Explanatory variables included hard coral cover, soft coral cover, Coralline/Turf algal cover, the abundance of snappers (Lutjanidae) and emperors (Lethrinidae), monthly minimum temperature, monthly average minimum temperature, monthly average maximum temperature and substrate complexity. Models were run separately for each of the abundance planktivores, benthic planktivores, coral trout and coral trout prey. When not being used as the response variable, these variables were also included an explanatory variable in the models. Boosted Regression Tree models were run using a Gaussian distribution, with an interaction depth of five and 10,000 trees.
Temperature was recorded in situ using Reefnet Sensus Ultra (www.reefnet.ca/products/sensus) and Vemco Minilog-II-T (www.vemco.com/products/minilog-ii-t/) temperature loggers. Most survey reefs had loggers installed at one of the sites, and for those that didn’t we used data from the nearest logger to the site. We then calculated the monthly average temperature as well as the monthly average minimum and maximum temperature. We used the average temperature for the month in which fish surveys were undertaken in each year as the input into the boosted regression tree model.
Substrate complexity was estimated on each transect using a categorical scale of zero (least complex—minimal vertical relief, few holes, crevices or hole) to five (most complex—high vertical relief, many hole crevices and overhangs). This scale correlates strongly with a range of rugosity metrics and has been found to be a good predictor of reef fish diversity and abundance (Wilson et al. 2007) [89].

Appendix B

Figure A1. Temporal trends in hard coral cover in the Cooktown/Lizard Island sector of the Great Barrier Reef. Data are mean percent hard coral cover ± 1 SE for reefs at each of three positions across the continental shelf: I = inshore, M = mid-shelf, O = outer-shelf. Colour arrows show the occurrence of disturbances: red = Cyclone Ita, blue = Cyclone Nathan, black = bleaching.
Diversity 11 00033 g0a1
Figure A2. Temporal trends in hard coral cover in the Capricorn-Bunker sector of the Great Barrier Reef. Data are mean percent hard coral cover ± 1 SE for reefs on the outer-shelf (O). Colour arrows show the occurrence of disturbances: black = coral disease, red = sub-cyclonic storm, blue = Cyclone Hamish.
Diversity 11 00033 g0a2

References

  1. Hamner, W.M.; Jones, M.S.; Carleton, J.H.; Hauri, I.R.; Williams, D.M.B. Zooplankton, planktivorous fish, and water currents on a windward reef face: Great Barrier Reef, Australia. Bull. Mar. Sci. 1988, 42, 459–479. [Google Scholar]
  2. Pinnegar, J.K.; Polunin, N.V.C. Planktivorous damselfish support nitrogen and phosphorous fluxes to Mediterranean reefs. Mar. Biol. 2006, 148, 1089–1099. [Google Scholar] [CrossRef]
  3. Williams, D.M.B.; Hatcher, A.I. Structure of fish communities on outer slopes of inshore, mid-shelf and outer shelf reefs of the Great Barrier Reef. Mar. Ecol. Prog. Ser. 1983, 10, 239–250. [Google Scholar] [CrossRef]
  4. Cowan, Z.; Dworjanyn, S.A.; Caballes, C.F.; Pratchett, M.S. Predation on crown-of-thorns starfish larvae by damselfishes. Coral Reefs 2016, 35, 1253–1262. [Google Scholar] [CrossRef]
  5. Chase, T.J.; Pratchett, M.S.; Frank, G.E.; Hoogenboom, M.O. Coral-dwelling fish moderate bleaching susceptibility of coral hosts. PLoS ONE 2018, 13, e0208545. [Google Scholar] [CrossRef] [PubMed]
  6. Erez, J. On the importance of food sources in coral reef ecosystems. In Coral Reefs; Dubinsky, Z., Ed.; Elsevier: New York, NY, USA, 1990; pp. 411–418. [Google Scholar]
  7. St John, J. Feeding Ecology of the Coral Trout, Plectropomus leopardus (Serranidae), on the Great Barrier Reef, Australia. Ph.D. Thesis, James Cook University, Townsville, Australia, 1995. [Google Scholar]
  8. Frisch, A.J.; Ireland, M.; Baker, R. Trophic ecology of large predatory reef fishes: Energy pathways, trophic level and implications for fisheries in a changing climate. Mar. Biol. 2014, 161, 61–73. [Google Scholar] [CrossRef]
  9. Graham, N.A.J.; Evans, R.D.; Russ, G.R. The effects of marine reserve protection on the trophic relationships of reef fishes on the Great Barrier Reef. Environ. Conserv. 2003, 30, 200–208. [Google Scholar] [CrossRef]
  10. Boaden, A.E.; Kingsford, M.J. Predators drive community structure in coral reef fish assemblages. Ecosphere 2015, 6, 1–33. [Google Scholar] [CrossRef]
  11. Gajdzik, L.; Parmentier, E.; Sturaro, N.; Frédérich, B. Trophic specializations of damselfishes are tightly associated with reef habitats and social behaviours. Mar. Biol. 2016, 163, 1–15. [Google Scholar] [CrossRef]
  12. Bellwood, D.R.; Hughes, T.P.; Folke, C.; Nyström, M. Confronting the coral reef crisis. Nature 2004, 429, 827–833. [Google Scholar] [CrossRef] [PubMed]
  13. Osborne, K.; Dolman, A.M.; Burgess, S.C.; Johns, K.A. Disturbance and the dynamics of coral cover on the Great Barrier Reef (1995–2009). PLoS ONE 2011, 6, e17516. [Google Scholar] [CrossRef] [PubMed]
  14. Hughes, T.P.; Kerry, J.T.; Alvarez-Noriega, M.; Alvarez-Romero, J.G.; Anderson, K.D.; Baird, A.H.; Babcock, R.C.; Berger, M.; Bellwood, D.R.; Berkelmans, R.; et al. Global warming and recurrent mass bleaching of corals. Nature 2017, 543, 373–377. [Google Scholar] [CrossRef] [PubMed]
  15. Pratchett, M.S.; Hoey, A.S.; Wilson, S.; Hobbs, J.P.; Allen, G. Habitat-use and specialisation among coral reef damselfishes. In Biology of Damselfishes; Frédérich, B., Paramentier, E., Eds.; CRC Press: Boca Raton, FL, USA, 2016; pp. 84–121. [Google Scholar]
  16. Hughes, T.P. Catastrophes, phase shifts and large-scale degradation of a Caribbean coral Reef. Science 1994, 265, 1547–1551. [Google Scholar] [CrossRef] [PubMed]
  17. Graham, N.A.J.; Wilson, S.K.; Jennings, S.; Polunin, N.V.C.; Bijoux, J.P.; Robinson, J. Dynamic fragility of oceanic coral reef ecosystems. Proc. Natl. Acad. Sci. USA 2006, 103, 8425–8429. [Google Scholar] [CrossRef] [PubMed]
  18. De’ath, G.; Fabricius, K.E.; Sweatman, H.; Puotinen, M. The 27-year decline of coral cover on the Great Barrier Reef and its causes. Proc. Natl. Acad. Sci. USA 2012, 109, 17995–17999. [Google Scholar] [CrossRef] [PubMed]
  19. Tribble, G.W.; Nishikawa, H. An analysis of the diets of four spatially overlapping damselfishes of the genus Chromis. Jpn. J. Ichthyol. 1982, 29, 267–271. [Google Scholar]
  20. Sweatman, H.P.A. The influence of adults of some coral reef fishes on larval recruitment. Ecol. Monogr. 1985, 55, 469–485. [Google Scholar] [CrossRef]
  21. Holbrook, S.J.; Forrester, G.E.; Schmitt, R.J. Spatial patterns in abundance of damselfish reflect availability of suitable habitat. Oecologia 2000, 122, 109–120. [Google Scholar] [CrossRef] [PubMed]
  22. Frederich, B.; Fabri, G.; Lepoint, G.; Vandewalle, P.; Parmentier, E. Trophic niches of thirteen damselfishes (Pomacentridae) at the Grand Recif of Toliara, Madagascar. Ichthyol. Res. 2009, 56, 10–17. [Google Scholar] [CrossRef]
  23. Gajdzik, L.; Parmentier, E.; Michel, L.N.; Sturaro, N.; Soong, K.; Lepoint, G.; Frédérich, B. Similar levels of trophic and functional diversity within damselfish assemblages across Indo-Pacific coral reefs. Func. Ecol. 2018, 32, 1358–1369. [Google Scholar] [CrossRef]
  24. Eurich, J.G.; Matley, J.K.; Baker, R.; McCormick, M.I.; Jones, G.P. Stable isotope analysis reveals trophic diversity and partitioning in territorial damselfishes on a low-latitude coral reef. Mar. Biol. 2019, 166, 17. [Google Scholar] [CrossRef]
  25. Wilson, S.K.; Graham, N.A.J.; Pratchett, M.S.; Jones, G.P.; Polunin, N.V.C. Multiple disturbances and the global degradation of coral reefs: Are reef fishes at risk or resilient? Glob. Chang. Biol. 2006, 12, 2220–2234. [Google Scholar] [CrossRef]
  26. Cheal, A.J.; Wilson, S.K.; Emslie, M.J.; Dolman, A.M.; Sweatman, H. Responses of reef fish communities to coral declines on the Great Barrier Reef. Mar. Ecol. Prog. Ser. 2008, 372, 211–223. [Google Scholar] [CrossRef]
  27. Emslie, M.J.; Logan, M.; Ceccarelli, D.M.; Cheal, A.J.; Hoey, A.S.; Miller, I.; Sweatman, H.P.A. Regional-scale variation in the distribution and abundance of farming damselfishes on Australia’s Great Barrier Reef. Mar. Biol. 2012, 159, 1293–1304. [Google Scholar] [CrossRef]
  28. Emslie, M.J.; Cheal, A.J.; Johns, K.A. Retention of habitat complexity minimizes disassembly of reef fish communities following disturbance: A large-scale natural experiment. PLoS ONE 2014, 9, e105384. [Google Scholar] [CrossRef] [PubMed]
  29. Ceccarelli, D.M.; Emslie, M.J.; Richards, Z.T. Post-disturbance stability of fish assemblages measured at coarse taxonomic resolution masks changes at finer scales. PLoS ONE 2014, 11, e0156232. [Google Scholar] [CrossRef] [PubMed]
  30. Doherty, P.; Fowler, T. An empirical test of recruitment limitation in a coral reef fish. Science 1994, 263, 935–939. [Google Scholar] [CrossRef] [PubMed]
  31. Booth, D.J.; Wellington, G. Settlement preferences in coral-reef fishes: Effects on patterns of adult and juvenile distributions, individual fitness and population structure. Aust. J. Ecol. 1998, 23, 274–279. [Google Scholar] [CrossRef]
  32. Lynam, C.P.; Liope, M.; Möllman, C.; Helaouët, P.; Bayliss-Brown, G.A.; Stenseth, N.C. Interactions between top-down and bottom-up control in marine food webs. Proc. Natl. Acad. Sci. USA 2017, 114, 1952–1957. [Google Scholar] [CrossRef] [PubMed]
  33. Russ, G.R.; Questel, S.A.; Rizzari, J.R.; Alcala, A.C. The parrotfish-coral relationship: Refuting the ubiquity of a prevailing paradigm. Mar. Biol. 2015, 162, 2029–2045. [Google Scholar] [CrossRef]
  34. Carpenter, S.R.; Kitchem, J.E.; Hoixson, J.R. Cascading trophic interactions and lake productivity. Bioscience 1985, 35, 634–639. [Google Scholar] [CrossRef]
  35. Lapointe, B.E.; Littler, M.M.; Littler, D.S. Macroalgal overgrowth of fringing reefs ar Discovery Bay, Jamaica: Bottom-up versus top-down control. In Proceedings of the 8th International Coral Reef Symposium, Balboa, Panama, 24–29 June 1997; pp. 927–932. [Google Scholar]
  36. Hughes, T.P.; Smantz, A.M.; Steneck, R.; Carpenter, R.; Miller, S. Algal blooms on coral reefs: What are the causes? Limnol. Oceanogr. 1999, 44, 1583–1586. [Google Scholar] [CrossRef]
  37. Burkepile, D.E.; Hay, M.E. Nutrient versus herbivore control of macroalgal community development and coral growth on a Caribbean reef. Mar. Ecol. Prog. Ser. 2009, 389, 71–84. [Google Scholar] [CrossRef]
  38. Hixon, M.A.; Beets, J.P. Predation, prey refuges and the structure of coral-reef fish assemblages. Ecol. Monogr. 1993, 63, 77–101. [Google Scholar] [CrossRef]
  39. Carr, M.H.; Hixon, M.A. Predation effects on early postsettlement survivorship of coral-reef fishes. Mar. Ecol. Prog. Ser. 1995, 124, 31–42. [Google Scholar] [CrossRef]
  40. St., John, J.; Russ, G.R.; Brown, I.W.; Squire, L.C. The diet of the large coral reef serranid Plectropomus leopardus in two fishing zones on the Great Barrier Reef, Australia. Fish. Bull. 2001, 99, 180–192. [Google Scholar]
  41. Kingsford, M.J. Spatial and temporal variation in predation on reef fishes by coral trout (Plectropomus leopardus, Serranidae). Coral Reefs 1992, 11, 193–198. [Google Scholar] [CrossRef]
  42. Matley, J.K.; Tobin, A.J.; Simpfendorfer, C.A.; Fisk, A.T.; Heupel, M.R. Trophic niche and spatio-temporal changes in the feeding ecology of two sympatric species of coral trout (Plectropomus leopardus and P. laevis). Mar. Ecol. Prog. Ser. 2017, 563, 197–210. [Google Scholar] [CrossRef]
  43. Williams, D.M.B.; Dixon, P.; English, S. Cross-shelf distribution of copepods and fish larvae across the central Great Barrier Reef. Mar. Biol. 1988, 99, 577–589. [Google Scholar] [CrossRef]
  44. McKinnon, D.; Richardson, A.J.; Burford, M.A.; Furnas, M.J. Vulnerability of Great Barrier Reef plankton to climate change. In Climate Change and the Great Barrier Reef: A Vulnerability Assessment; Johnson, J.E., Marshall, P.A., Eds.; Great Barrier Reef Marine Park Authority and the Australian Greenhouse Office, Department of the Environment and Water Resources: Canberra, Australia, 2007; pp. 121–152. [Google Scholar]
  45. Sammarco, P.W.; Crenshaw, H. Plankton community dynamics of the central Great Barrier Reef lagoon: Analysis of data from Ikeda et al. Mar. Biol. 1984, 82, 167–180. [Google Scholar] [CrossRef]
  46. McKinnon, A.D.; Thorrold, S.R. Zooplankton community structure and copepod egg production in coastal waters of the central Great Barrier Reef lagoon. J. Plankton Res. 1993, 15, 1387–1411. [Google Scholar] [CrossRef]
  47. Emslie, M.J.; Cheal, A.J. Visual Census of Reef Fish: Standard Operational Procedure Number 3; Australian Institute of Marine Science: Townsville, Australia, 2018. [Google Scholar]
  48. Parmentier, E.; Gajdzik, L.; Olivier, D.; Frédérich, B. Trophic ecology of damselfishes. In Biology of Damselfishes; Frédérich, B., Paramentier, E., Eds.; CRC Press: Boca Raton, FL, USA, 2016; pp. 153–167. [Google Scholar]
  49. Jonker, M.; Johns, K.; Osborne, K. Surveys of Benthic Reef Communities Using Underwater Digital Photography and Counts of Juvenile Corals: Standard Operational Procedure Number 10; Australian Institute of Marine Science: Townsville, Australia, 2008. [Google Scholar]
  50. R Core Team. R: A Language and Environment for Statistical Computing; Foundation for Statistical Computing: Vienna, Austria, 2018. [Google Scholar]
  51. Wickham, H. ggplot 2: Elegant Graphics for Data Analysis; Springer: New York, NY, USA, 2009. [Google Scholar]
  52. Legendre, P.; Gallagher, E.D. Ecologically meaningful transformations for ordination of species data. Oecologia 2001, 129, 271–280. [Google Scholar] [CrossRef] [PubMed]
  53. Rue, H.; Martino, S.; Chopin, N. Approximate bayesian inference for latent Gaussian models by using integrated nested Laplace approximations. J. R. Stat. Soc. Ser. B. Stat. Method 2009, 71, 319–392. [Google Scholar] [CrossRef]
  54. De’ath, G. Boosted trees for ecological modelling and prediction. Ecology 2007, 88, 243–251. [Google Scholar] [CrossRef]
  55. Elith, J.; Leathwick, J.R.; Hastie, T. A working guide to boosted regression trees. J. Anim. Ecol. 2008, 77, 802–813. [Google Scholar] [CrossRef] [PubMed]
  56. Williamson, D.H.; Russ, G.R.; Ayling, A.M. No-take marine reserves increase abundance and biomass of reef fish on inshore fringing reefs of the Great Barrier Reef. Environ. Conserv. 2004, 31, 149–159. [Google Scholar] [CrossRef]
  57. Russ, G.R.; Cheal, A.J.; Dolman, A.M.; Emslie, M.J.; Evans, R.D.; Miller, I.; Sweatman, H.; Williamson, D.H. Rapid increase in fish numbers follows creation of world’s largest marine reserve network. Curr. Biol. 2008, 18, R514–R515. [Google Scholar] [CrossRef] [PubMed]
  58. Emslie, M.J.; Logan, M.; Williamson, D.H.; Ayling, A.M.; MacNeil, M.A.; Ceccarelli, D.; Cheal, A.J.; Evans, R.D.; Johns, K.A.; Jonker, M.J.; et al. Expectations and outcomes of reserve network performance following re-zoning of the Great Barrier Reef Marine Park. Curr. Biol. 2015, 25, 983–992. [Google Scholar] [CrossRef] [PubMed]
  59. Ridgeway, G. gbm: Generalized Boosted Regression Models, R package version 1:3; Foundation for Statistical Computing: Vienna, Austria, 2006. [Google Scholar]
  60. Drew, E.A. Halimeda biomass, growth rates and sediment generation on reefs in the central Great Barrier Reef province. Coral Reefs 1983, 2, 101–110. [Google Scholar] [CrossRef]
  61. Wismer, S.; Hoey, A.S.; Bellwood, D.R. Cross-shelf benthic community structure on the Great Barrier Reef: Relationships between macroalagal cover and herbivore biomass. Mar. Ecol. Prog. Ser. 2009, 376, 45–54. [Google Scholar] [CrossRef]
  62. Wilkinson, C.R.; Cheshire, A.C. Patterns in the distribution of sponge populations across the central Great Barrier Reef. Coral Reefs 1989, 8, 127–134. [Google Scholar] [CrossRef]
  63. Done, T.J. Patterns in the distribution of coral communities across the central Great Barrier Reef. Coral Reefs 1982, 1, 95–107. [Google Scholar] [CrossRef]
  64. Emslie, M.J.; Pratchett, M.S.; Cheal, A.J.; Osborne, K. Great Barrier Reef butterflyfish community structure: The role of shelf position and benthic community type. Coral Reefs 2010, 29, 705–715. [Google Scholar] [CrossRef]
  65. Williams, D.M.B. Patterns in the distribution of fish communities across the central Great Barrier Reef. Coral Reefs 1982, 1, 35–43. [Google Scholar] [CrossRef]
  66. Russ, G. Distribution and abundance of herbivorous grazing fishes in the central Great Barrier Reef. 1. Levels of variability across the entire continental shelf. Mar. Ecol. Prog. Ser. 1984, 20, 23–34. [Google Scholar] [CrossRef]
  67. Hoey, A.S.; Bellwood, D.R. Cross-shelf variation in the role of parrotfishes on the Great Barrier Reef. Coral Reefs 2008, 27, 37–47. [Google Scholar] [CrossRef]
  68. Emslie, M.J.; Cheal, A.J.; Logan, M. The distribution and abundance or reef-associated predatory fishes on the Great Barrier Reef. Coral Reefs 2017, 36, 829–846. [Google Scholar] [CrossRef]
  69. Cheal, A.; Emslie, M.; Miller, I.; Sweatman, H. The distribution of herbivorous fishes on the Great Barrier Reef. Mar. Biol. 2012, 159, 1143–1154. [Google Scholar] [CrossRef]
  70. Cheal, A.J.; Emslie, M.; MacNeil, M.A.; Miller, I.; Sweatman, H. Spatial variation in the functional characteristics of herbivorous fish communities and the resilience of coral reefs. Ecol. Appl. 2013, 23, 174–188. [Google Scholar] [CrossRef] [PubMed]
  71. Floeter, S.R.; Behrens, M.D.; Ferreira, C.E.L.; Paddack, N.J.; Horn, M.H. Geographical gradients of marine herbivorous fishes: Patterns and processes. Mar. Biol. 2005, 147, 1435–1447. [Google Scholar] [CrossRef]
  72. Epstein, H.E.; Kingsford, M.J. Are soft coral habitats unfavourable? A closer look at the association between reef fishes and their habitat. Environ. Biol. Fish. 2019. [Google Scholar] [CrossRef]
  73. Sano, M. Short-term effects of a mass coral bleaching event on a reef fish assemblage at Iriomote Island, Japan. Fish. Sci. 2004, 70, 41–46. [Google Scholar] [CrossRef]
  74. Bostrom-Einarsson, L.; Bonin, M.C.; Munday, P.L.; Jones, G.P. Loss of live coral compromises predator-avoidance behaviour in coral reef damselfish. Sci. Rep. 2018, 8, 7795. [Google Scholar] [CrossRef] [PubMed]
  75. Graham, N.A.J.; Nash, K.L. The importance of structural complexity in coral reef ecosystems. Coral Reefs 2013, 32, 315–326. [Google Scholar] [CrossRef]
  76. McClanahan, T.R.; Shafir, S.H. Causes and consequences of sea urchin abundance and diversity in Kenyan coral reef lagoons. Oecologia 1990, 83, 362–370. [Google Scholar] [CrossRef] [PubMed]
  77. Grigg, R.W.; Polovina, J.J.; Atkinson, M.J. Model of a coral reef ecosystem III. Resource limitation, community regulation, fisheries yield and resource management. Coral Reefs 1984, 1, 23–27. [Google Scholar] [CrossRef]
  78. Polis, G.A.; Strong, D.R. Food web complexity and community dynamics. Am. Nat. 1996, 147, 813–846. [Google Scholar] [CrossRef]
  79. Shurin, J.B.; Borer, E.T.; Seabloom, E.W.; Anderson, K.; Blanchette, C.A.; Broitman, B.; Cooper, S.D.; Halpern, B.S. A cross-ecosystem comparison of the strength of trophic cascades. Ecol. Lett. 2002, 5, 785–791. [Google Scholar] [CrossRef]
  80. Pratchett, M.S.; Coker, D.J.; Jones, G.P.; Munday, P.L. Specialization in habitat use by coral reef damselfishes and their susceptibility to habitat loss. Ecol. Evol. 2012, 2, 2168–2180. [Google Scholar] [CrossRef] [PubMed]
  81. Srinivasan, M. Depth distributions of coral reef fishes: The influence of microhabitat structure, settlement, and post-settlement processes. Oecologia 2003, 137, 76–84. [Google Scholar] [CrossRef] [PubMed]
  82. Light, P.R.; Jones, G.P. Habitat preference in newly settled coral trout (Plectropomus leopardus, Serranidae). Coral Reefs 1997, 16, 117–126. [Google Scholar] [CrossRef]
  83. Kingsford, M.J. Contrasting patterns of reef utilization and recruitment of coral trout (Plectropomus leopardus) and snapper (Lutjanus carponotatus) at One Tree Island, southern Great Barrier Reef. Coral Reefs 2009, 28, 251–264. [Google Scholar] [CrossRef]
  84. Kerry, J.T.; Bellwood, D.R. The effect of coral morphology on shelter selection by coral reef fishes. Coral Reefs 2012, 31, 415–424. [Google Scholar] [CrossRef]
  85. Samoilys, M.A. Movement in a large predatory fish: Coral trout, Plectropomus leopardus (Pisces: Serranidae), on Heron Reef, Australia. Coral Reefs 1997, 16, 151–158. [Google Scholar] [CrossRef]
  86. Matley, J.K.; Tobin, A.J.; Lédée, E.J.I.; Heupel, M.R.; Simpfendorfer, C.A. Contrasting patterns of vertical and horizontal space use of two sympatric coral reef fish. Mar. Biol. 2016, 163, 253. [Google Scholar] [CrossRef]
  87. Hobson, E.S.; Chess, J.R. Trophic relationships among fishes and plankton in the lagoon at Enewetak Atoll, Marshall Islands. Fish. Bull. 1978, 76, 133–153. [Google Scholar]
  88. Sano, M.; Shimizu, M.; Nose, Y. Food Habits of Teleostean Reef Fishes in Okinawa Island, Southern Japan; University of Tokyo Bulletin, No. 25; University of Tokyo Press: Tokyo, Japan, 1984. [Google Scholar]
  89. Wilson, S.K.; Graham, N.A.J.; Polunin, N.V.C. Appraisal of visual assessments of habitat complexity and benthic composition on coral reefs. Mar. Biol. 2007, 151, 1069–1076. [Google Scholar] [CrossRef]
Figure 1. Location of the survey reefs on the Great Barrier Reef spread across six latitudinal sectors and three shelf positions.
Diversity 11 00033 g001
Figure 2. An ordination of a Principle Components Analysis showing the variation in planktivorous damselfish assemblages among sectors, shelf and year. Each data point is the average community composition at a given reef in a given year. Circles are inshore reefs, triangles are mid-shelf and squares are outer-shelf reefs, and grey convex hulls encapsulate all reefs among shelf positions. Data are coloured by latitudinal sector: CL = blue; CA = green; TO = red; WH = yellow; SW = orange; CB = purple. Individual reefs are bounded by coloured lines.
Diversity 11 00033 g002
Figure 3. Time averaged spatial patterns in the (A) density and (B) species richness of planktivorous damselfishes on the Great Barrier Reef. Data are modelled higher posterior distribution means and associated 95% uncertainty intervals (UIs) from Bayesian hierarchical linear mixed models. Statistical differences among sub-regions can be inferred where 95% UIs do not overlap. Latitudinal sectors are CL Cooktown-Lizard Island, CA Cairns, TO Townsville, WH Whitsunday, SW Swain, CB Capricorn–Bunker.
Diversity 11 00033 g003
Figure 4. Temporal patterns in the (A) density and (B) species richness of planktivorous damselfishes on the Great Barrier Reef. Data are modelled higher posterior distribution means and associated 95% uncertainty intervals (UIs) from Bayesian hierarchical linear mixed models. Statistical differences among sub-regions can be inferred where 95% UIs do not overlap. Latitudinal sectors are CL Cooktown-Lizard Island, CA Cairns, TO Townsville, WH Whitsunday, SW Swain, CB Capricorn–Bunker.
Diversity 11 00033 g004
Figure 5. Relative influence (%) of predictor variables from boosted regression tree models for Great Barrier Reef planktivorous damselfishes, coral trout and their prey. Data are mean response and 95% confidence intervals from 100 iterations of the model for (A) coral trout, (B) planktivorous damselfishes identified as coral trout prey, (C) planktivores and, (D) benthic planktivores. The vertical dashed line represents equal contribution from each predictor variable, i.e., no variable has greater influence than any other.
Diversity 11 00033 g005
Figure 6. The relationship between the most influential predictor variables and (A,B) coral trout, (C,D) coral trout prey, (E,F) planktivore abundance and, (G,H) benthic planktivore abundance. Grey lines are individual runs of the model (n = 100) while the red line shows the mean response.
Diversity 11 00033 g006
Table 1. GBR planktivorous damselfish species abundance by latitudinal sector and position across the continental shelf. For the sector symbols, CL Cooktown/Lizard Island, CA Cairns, TO Townsville, WH Whitsunday, SW Swain, CB Capricorn-Bunker. Column headings AB = total abundance of species counted throughout surveys; % = distribution of each species as a percentage of total abundance in each sector and shelf; x ¯ = average abundance/1000 m2 for each sector and shelf.
CLCATOWHSWCBInshoreMid-ShelfOuter-Shelf
AB% Reefs (n = 47)% x ¯ % x ¯ % x ¯ % x ¯ % x ¯ % x ¯ % x ¯ % x ¯ % x ¯
Planktivores711,50010014.0149.0513.5138.2421.3376.0523.7774.8824.2997.703.1021.9515.9545.7656.7589.2027.3042.54
Pomacentrus lepidogenys229,5551005.576.2916.4415.0120.6723.7821.5321.8931.4940.864.319.841.861.7265.1933.0632.9516.56
Neopomacentrus azysron150,0689814.2710.5414.008.3622.0616.6042.8928.515.594.751.181.7617.2610.4570.6623.4212.083.97
Chromis nitida106,722410.000.000.000.000.000.0018.088.5578.0547.093.864.1013.505.8181.2119.145.301.24
Neopomacentrus bankieri51,853240.670.174.841.0071.9518.7022.545.180.000.000.000.0010020.920.000.000.000.00
Chromis margaritifer32,8276754.338.7822.322.9120.393.351.250.180.200.041.510.490.01<0.018.780.6491.216.56
Pomacentrus philippinus22,4188325.692.8321.721.9432.303.6313.161.316.950.880.180.040.080.0137.461.8562.463.07
Chrysiptera rollandi22,1587425.842.8219.691.748.290.9235.853.5210.261.290.060.0147.094.2150.342.462.570.12
Chromis ternatensis20,9699362.756.4823.631.974.830.515.650.522.850.340.300.062.730.2331.991.4865.273.00
Chromis weberi10,4307248.052.4724.411.0117.960.948.210.380.01<0.011.360.141.480.0636.920.8561.601.41
Chromis atripectoralis46639312.812.2918.432.6722.624.1321.983.549.982.0514.185.159.511.4051.764.1638.733.09
Dascyllus reticulatus46007844.651.0134.670.6310.350.245.800.120.260.014.260.2011.510.2255.980.5732.170.32
Chrysiptera talboti43628346.030.995.230.0922.950.5023.770.461.970.050.050.007.040.1282.990.809.970.10
Chromis lepidolepis33446729.930.4931.550.4230.590.517.570.110.060.000.300.011.110.0131.850.2467.050.49
Chromis xanthura31015483.101.279.770.125.510.091.190.020.320.010.100.000.03<0.018.130.0691.840.62
Chromis chrysura2454305.130.061.510.0187.451.084.320.050.040.001.550.040.000.000.73<0.0199.270.53
Chromis vanderbilti21473560.740.647.590.0628.600.310.090.000.050.002.930.060.000.000.28<0.0199.720.47
Pomachromis richardsoni10316728.230.147.950.0315.320.0814.260.0733.850.200.390.0025.220.1061.200.1413.580.03
Chromis viridis8004359.000.2322.000.077.380.0311.380.040.25<0.010.000.0058.880.1930.630.0510.500.02
Chromis iomelas6272827.910.093.670.0163.160.205.260.010.000.000.000.000.000.000.64<0.0199.360.14
Neopomacentrus cyanomos6223019.610.064.020.011.290.0075.080.210.000.000.000.0089.070.2210.770.010.16<0.01
Chrysiptera flavipinnis5983737.120.110.000.000.17<0.0126.760.0730.770.105.180.033.510.0165.050.0931.440.04
Chromis lineata3052862.380.0929.510.047.210.010.000.000.000.000.000.000.000.0014.750.0185.250.06
Dascyllus aruanus2802489.640.126.790.012.50<0.010.71<0.010.36<0.010.000.0011.430.0187.860.050.71<0.01
Dascyllus trimaculatus2056114.630.0124.390.0229.270.0310.240.0111.710.019.760.022.93<0.0167.320.0329.760.01
Chromis retrofasciata1282415.630.0160.160.030.000.0017.970.016.25<0.010.000.0076.560.0422.660.010.78<0.01
Neoglyphidodon polyacanthus55201.82<0.010.000.005.45<0.0118.18<0.0174.550.020.000.000.000.0070.910.0129.09<0.01
Chromis amboinensis412853.660.010.000.004.88<0.0126.83<0.0114.63<0.010.000.0024.39<0.0126.83<0.0148.78<0.01
Amblyglyphidodon aureus171776.470.015.880.0111.760.015.880.010.000.010.000.015.88<0.0182.35<0.0111.76<0.01
Chromis agilis12763.160.010.000.0036.84<0.010.000.000.000.000.000.000.000.000.000.00100.0<0.01
Benthic planktivores390,03610026.9151.6711.2917.519.0517.6822.9239.5915.4434.0414.3955.8436.4457.3242.4836.6021.0818.01
Pomacentrus moluccensis173,2468926.9122.9413.479.2810.589.1825.5919.6422.2721.811.182.0343.8130.6252.4720.083.721.41
Pomacentrus coelestis62,661872.240.691.160.292.750.863.290.917.042.4983.5352.081.530.3911.241.5687.2311.97
Pomacentrus brachialis54,7027446.5412.539.592.091.860.5138.239.263.781.170.01<0.0150.6011.1648.785.890.620.07
Acanthochromis polyacanthus35,18610038.056.5913.736.5921.556.5922.196.593.486.591.006.5945.336.4329.272.2825.401.96
Amblyglyphidodon curacao31,0969622.433.4312.311.5212.361.9318.072.4934.506.060.320.1027.803.4957.333.9414.871.01
Pomacentrus amboinensis12,9117249.993.1811.720.605.620.3620.571.1812.080.880.02<0.0142.582.2254.511.552.900.08
Pomacentrus nagaskiensis62066122.860.7018.920.470.260.0156.741.561.110.040.110.0188.582.2211.040.150.390.01
Chrysiptera rex49766717.260.4236.090.7115.030.3717.200.382.930.0811.480.570.16<0.0113.790.1586.050.94
Amblyglyphidodon leucogaster43957448.031.0423.460.4111.240.2516.040.311.210.030.020.0033.380.5960.730.595.890.06
Neoglyphidodon melas23271004.170.0514.480.138.940.1030.300.3139.790.522.320.0519.250.1829.180.1551.570.26
Amphiprion akindynos9098513.420.0610.670.0432.890.159.240.0430.910.162.860.031.760.0161.170.1237.070.07
Pomacentrus australis710200.000.000.000.000.000.0012.110.042.250.0185.630.600.28<0.0114.080.0285.630.13
Amphiprion melanopus447480.45<0.0112.980.0252.350.122.680.0131.540.080.000.000.45<0.0182.100.0817.450.02
Amphiprion perideraion1763727.840.0210.800.0134.660.0318.750.016.250.011.700.002.84<0.0169.320.0327.840.01
Premnas biaculeatus611762.300.0237.700.010.000.000.000.000.000.000.000.0045.900.0154.100.010.000.00
Table 2. Results of a permutational multivariate analysis of variance (ADONIS) testing for differences in the structure of planktivorous damselfish assemblages on the Great Barrier Reef.
FactorDegrees of FreedomSums of SquaresMean SquareF ModelR2Pr (>F)
Sector5114.6022.920139.130.1610.001
Shelf2130.8665.428397.180.1830.001
Year12.862.85917.360.0040.001
Sector*Shelf779.8611.40969.260.1120.001
Sector*Year54.280.8555.190.0060.001
Shelf*Year21.520.7594.610.0020.001
Sector*Shelf*Year73.590.5133.110.0050.001
Residuals2286376.570.165 0.527
Total2315714.13 1.000
Table 3. The relative influences of top-down control by coral trout and availability of coral habitat (using hard coral cover (HC) as a proxy) on planktivorous damselfish of the Great Barrier Reef. Data are Chi-squared test statistics (χ2), degrees of freedom (d.f.) and residuals associated with each comparison of temporal trajectories in abundance and hard coral cover: NN negative/negative; NP negative/positive; PN positive/negative; PP positive/positive. No pattern is indicated where residuals = 1. Negative residuals indicate that there were fewer responses than expected while positive residuals indicate there were more responses than expected.
Chi-Square Test StatisticsChi-Square Residuals
Comparisonχ2d.f.pNNNPPNPP
HC versus prey23.8173<0.001−1.356−3.0641.0213.398
HC versus planktivores22.0293<0.001−1.504−2.5440.4273.621
HC versus benthic planktivores19.1823<0.001−1.0591.764−3.0642.358
HC versus Trout 63.1663<0.001−3.138−0.613−2.9156.667
Trout versus prey75.5133<0.0010.427−4.401−2.9166.889
Trout versus planktivores77.9743<0.001−0.167−3.733−3.3617.261
Trout versus benthic planktivores58.9613<0.0010.427−2.173−4.2525.998

