Article

Micro-Food Web Structure Shapes Rhizosphere Microbial Communities and Growth in Oak

Institute of Biology, Ecology Group, Humboldt-Universität zu Berlin, Philippstraße 13, 10115 Berlin, Germany
*
Author to whom correspondence should be addressed.
Diversity 2018, 10(1), 15; https://doi.org/10.3390/d10010015
Submission received: 1 January 2018 / Revised: 10 March 2018 / Accepted: 11 March 2018 / Published: 13 March 2018
(This article belongs to the Special Issue Food Webs, Ecosystem Functioning and Environmental Quality)

Abstract

:
The multitrophic interactions in the rhizosphere impose significant impacts on microbial community structure and function, affecting nutrient mineralisation and consequently plant performance. However, particularly for long-lived plants such as forest trees, the mechanisms by which trophic structure of the micro-food web governs rhizosphere microorganisms are still poorly understood. This study addresses the role of nematodes, as a major component of the soil micro-food web, in influencing the microbial abundance and community structure as well as tree growth. In a greenhouse experiment with Pedunculate Oak seedlings were grown in soil, where the nematode trophic structure was manipulated by altering the proportion of functional groups (i.e., bacterial, fungal, and plant feeders) in a full factorial design. The influence on the rhizosphere microbial community, the ectomycorrhizal symbiont Piloderma croceum, and oak growth, was assessed. Soil phospholipid fatty acids were employed to determine changes in the microbial communities. Increased density of singular nematode functional groups showed minor impact by increasing the biomass of single microbial groups (e.g., plant feeders that of Gram-negative bacteria), except fungal feeders, which resulted in a decline of all microorganisms in the soil. In contrast, inoculation of two or three nematode groups promoted microbial biomass and altered the community structure in favour of bacteria, thereby counteracting negative impact of single groups. These findings highlight that the collective action of trophic groups in the soil micro-food web can result in microbial community changes promoting the fitness of the tree, thereby alleviating the negative effects of individual functional groups.

1. Introduction

Forest soils are teeming with diverse microorganisms, interacting with tree roots and soil fauna as well as with each other, forming dynamic multitrophic interactions. These intertwined communities make the rhizosphere a complex environment, where the tree provides microbial resources in the form of rhizodeposits, and up to 50% of plant photoassimilates can be allocated belowground [1,2]. In return, the microorganisms contribute significantly towards the plant’s health [3,4] with both bacteria and fungi playing a vital role in the soil cycling of essential elements as well as mobilization, acquisition and translocation of nutrients [5,6]. However, the ability of the rhizosphere microbial community to perform these ecosystem functions is strongly governed by microfaunal grazers, such as nematodes, that affect the flow of energy and nutrients through the rhizosphere [7,8]. Ultimately, the multiple direct and indirect interactions of primary and secondary consumers shape the microbial community in the rhizosphere and in turn plant performance.
Among the soil fauna, nematodes have established functional groups at each trophic level, feeding on bacteria, fungi and roots as well as on other microfauna [9]. Due to their high trophic diversity nematodes hold a central position in the micro-food web [10,11] and participate in both bottom-up and top-down controlled webs [12]. Their multitrophic interactions in the soil micro-food web can impose various impacts on plant fitness. In resource regulated food webs nematode grazing maintains bacterial and fungal populations in a youthful state, regulates microbial composition, and enhances decomposition activity [13,14]. Moreover, the “leakage” of root cell content induced by plant feeders can increase carbon translocation into the rhizosphere, thereby indirectly stimulating microbial biomass [15,16,17]. Furthermore, nematodes recycle nutrients by excretion (e.g., ammonium) otherwise locked up in microbial biomass, making them accessible for plant up-take [18,19]. On the other side, feeding activity of fungal grazers and plant feeders can negatively affect mycorrhiza fungi, and hence hamper nutrient acquisition by trees [20,21].
Insight into these relationships of trees and rhizosphere organisms is necessary for sustainable forest management [22,23]. In temperate forests, Pedunculate Oak (Quercus robur L.) is an economically important species [24], which was recently used as model to investigate rhizosphere interactions by employing nematodes as plant feeders and Collembola as fungal grazers [25,26]. However, due to the complexness of rhizosphere processes, and the technical challenges to manipulate this habitat, existing knowledge is still largely fragmentary. Earlier studies raised evidence that increased decomposer food web complexity leads to improved plant growth [27,28,29]. Setälä [30] reported that such positive impact could override the negative effect from, e.g., reduced ectomycorrhizal colonization by grazing, if the food web is complex enough to ensure efficient nutrient mobilisation in the mycorrhizosphere. Consequently, Gebremikael and co-workers [31] called for a holistic approach, which incorporates the entire soil nematode community to elucidate the structure-function relationships with microorganisms and the underlying mechanisms controlling belowground processes.
This study investigates the effect of nematode trophic structure on rhizosphere interactions of Q. robur seedlings pre-inoculated with the ectomycorrhiza symbiont Piloderma croceum. To obtain insight in these interactions we assessed the collective contribution of nematodes belonging to different functional groups. The trophic structure of the soil micro-food web, herein defined as the relative proportions of trophic groups within the nematode community, was manipulated. The density of nematode taxa at two trophic levels, i.e., plant feeders (primary consumers), bacterial and fungal feeders (secondary decomposers), was increased under semi-natural conditions in a greenhouse experiment. The impact on oak performance, and on biomass and structure of rhizosphere microbial communities, was determined. Model nematodes were the plant-feeding Pratylenchus penetrans, the bacterial-feeding Acrobeloides buetschlii, and the fungal-feeding Aphelenchoides saprophilus, applied in a full factorial design taking into account all possible trophic combinations. The aim was to manipulate the trophic structure within an endogenous soil nematode community. We expected the rhizosphere environment to be affected by the altered community composition with increased abundance of: (i) plant feeders stimulating microbial biomass; (ii) bacterial feeders changing bacterial biomass and community structure; and (iii) fungal feeders hampering mycorrhiza fungi. We further hypothesised that multitrophic interactions, i.e., inoculation of two or three trophic groups, results in a positive impact on plant fitness.

2. Materials and Methods

2.1. Soil Substrate

The soil substrate was derived from a tree biodiversity experimental site at Kreinitz (latitude 51°23′10′′ N, longitude 13°15′43′′ E), Saxonia, Germany. The humic cambisol (sand) was composed of 94% sand, 5% silt and 1% clay, with a pH of 5.75. The soil was air dried and sieved (1 mm) for homogenization as well as to remove debris and meso-/macrofauna. The soil nematode population was reduced by a modified freeze-thaw method as described in Poll et al. [17]. First step was freezing at −20 °C for 48 h, followed by thawing and 7 days storage at room temperature (18 °C). This was followed by a second freezing step at −20 °C for 48 h. Thereafter, the soil was used for potting (see Section 2.3). This freeze-thaw method was shown as efficient in short-term reduction of the nematode density in the soil with populations gradually re-establishing over time [17], while the microbial activity as reflected by the dehydrogenase activity was hardly affected [32]. This moderate procedure was used to retain a background native nematode community while giving the nematode treatments a chance to establish in the soil with initially lowered population densities.

2.2. Ectomycorrhizal Inoculum

The basidiomycete, Piloderma croceum (Eriksson and Hjortstam 1981) was used as ectomycorrhizal fungus. Its symbiotic partnership with Q. robur was thoroughly investigated [33,34,35]. According to the protocol of Tarkka et al. [34] an inoculum of P. croceum (strain F1598), obtained from the UFZ Halle (Helmholtz Centre of Environmental Research), was produced. P. croceum was cultured on modified Melin-Norkrans agar medium [36] supplemented with 0.1% (w/v) casein hydrolysate incubated at 20 °C in darkness. The derived solid inoculum facilitated an even dispersal of the fungal symbiont in the experimental soil.

2.3. Oak Seedlings

Quercus robur (Linné 1753), a native tree of European forests, was used as model for hardwood tree species. Acorns purchased from Staatsklenge Nagold (Baden-Württemberg, Germany) were germinated on autoclaved sand. Climate chamber conditions were 16 h light (180 µmol m−2s−1 photosynthetic photon flux density) and 8 h darkness, 65% humidity, 23 °C temperature and ambient CO2 (400 ppm). Ten weeks after germination, pots (1 L) containing 1 kg of soil mixed with the P. croceum inoculum were planted with 1 oak seedling each. Oaks were grown in a greenhouse with a light/dark regime of 16/8 h at ambient environmental conditions.

2.4. Nematode Inoculum

Stock cultures of Acrobeloides buetschlii De Man 1884, a bacterial-feeding nematode, were maintained on potato dextrose agar (Carl Roth, Karlsruhe, Germany) together with the fungus Chaetomium globosum (Kunze 1817) at 15 °C in darkness. A. buetschlii feeds on agar and compounds introduced by the fungus into the agar, resulting in stable monoxenic mass cultures [37]. Cultures of Aphelenchoides saprophilus Franklin 1957, a fungal-feeding nematode, were grown on Laccaria laccata (Scopoli 1772; Cooke 1884) as food source, maintained on Pachlewska agar at 15 °C in darkness. Pratylenchus penetrans (Cobb 1917) a cosmopolitan plant parasitic nematode with a wide host range was used as model for the functional group of plant feeders. P. penetrans was cultured on sterile carrots after the protocol described in O’Bannon and Taylor [38].
Extraction of nematodes from their respective cultures was performed for 48 h at room temperature (20 °C) using a wet funnel technique [39]. Prior to use as experimental treatment, the nematodes were surface sterilized. Worms were exposed to a solution of 0.01% Mercuric chloride for 1 min, and thereafter rinsed with autoclaved water three times.

2.5. Experimental Setup and Harvest

Ninety-six oak plants were selected based on uniform growth and used as experimental units 4 weeks after planting of seedlings in the pots. Eight treatments were established, each with 12 replicates, in a complete factorial design: (1) Control—no nematodes inoculated; (2) Bacterial feeders (BF)—inoculated with A. buetschlii; (3) Fungal feeders (FF)—inoculated with A. saprophilus (FF); (4) Plant feeders (PF)—inoculated with P. penetrans (PF). Further all trophic group combinations were inoculated: (5) BF + FF; (6) BF + PF; (7) FF + PF; and (8) BF + FF + PF. Each pot received a 1 mL suspension containing individuals of either 600 A. buetschlii, 1500 A. saprophilus or 1000 P. penetrans or their different combinations.
The experiment was carried in a greenhouse with conditions as described above. At 4 and 8 weeks after nematode inoculation, i.e., 8 and 12 weeks after establishing oak seedlings in the pots, 6 replicates of each treatment were destructively harvested. Above and belowground plant biomass, root length, nematode abundance and trophic structure as well as microbial biomass and community composition were assessed. Oak plants were divided into shoot and root. Root morphology was analysed using WinRhizo Pro (Regent Instruments Inc., Quebec, Canada). Afterwards a subsample (0.5 g) was stained with acid fuchsin to check for infection by plant feeders following a method by Byrd et al. [40]. The shoot and the remaining root tissue were oven dried (60 °C, 48 h) and dry weights recorded. The total soil weight of each pot was assessed, and the soil divided into subsamples for analyses of nematode fauna (50 g) and soil moisture content (20 g). For soil phospholipid fatty acids (PLFAs) samples of 8 g were taken close to the root system and stored at −20 °C. A modified Baermann method, as described by Ruess [39], was used to extract nematodes from soil. Animals were stored in 4% formaldehyde solution as preservation liquid. Microscopic counting assessed the density per sample and nematode identification to genus level, and trophic groups were assigned based on Yeates et al. [9].

2.6. Soil Phospholipid Fatty Acid Analysis

PLFAs were extracted from soil after Frostegård et al. [41], with Bligh & Dyer (chloroform:methanol:citrate buffer as 1:2:0.8, pH 4) solvent from 4 g (wet weight) soil. Using a silica acid column, lipid fractionation into neutral-, glyco- and phospholipids was performed by elution with chloroform, acetone and methanol, respectively. The phospholipid fraction was transformed into fatty acid methyl esters (FAMEs) by mild alkaline methanolysis, and extracted with hexane-chloroform. Isooctane was used as solvent, and FAMEs stored at −20 °C.
FAMEs were quantified by gas chromatography with flame ionization detection (GC-FID) using the Sherlock Microbial Identification System based on retention times, and methyl-nonadecanoate (19:0) as internal standard. An Agilent 7890 GC (Agilent Technology, Santa Clara, CA, USA) equipped with an HP Ultra 2 capillary column (25 m × 0.2 mm i.d., film thickness 0.33 µm) was operated in split mode (1:40) with hydrogen as carrier gas. The oven program was: 170 °C (hold time 1 min), increase by 28 °C min–1 to 288 °C, then 60 °C min–1 to 310 °C (hold time 1.3 min).
A qualitative analysis of FAMEs was performed by mass spectrometry (MS). The system consists of a GC (7890 Series, Agilent Technology, USA) coupled with a Mass Selective Detector (7000 QQQ, Agilent Technology, USA) and equipped with a HP 5 MS capillary column (30 m × 0.25 mm i.d., film thickness 0.25 µm). The system was operated in splitless mode with helium as carrier gas. Oven program was: 40 °C (hold 1 min), increase by 46 °C min–1 to 200 °C, followed by 5 °C min–1 to 238 °C, 120 °C min–1 to 300 °C (hold time 2 min). A mass range of 40–400 m/z was monitored in scan mode.
The microbial community was assigned based on the PLFA biomarkers according to Ruess and Chamberlain [42]. The markers used were: Gram-positive bacteria-iso/anteiso, Gram-negative bacteria—cyclo, actinobacteria—10-methyl. The PLFAs 16:1 ω5, 16:1 ω7 and 18:1 ω9t are considered as nonspecific general markers for bacteria. The PLFAs 18:1 ω9c and 18:2 ω6,9 were assigned as fungal biomarkers [43]. In agreement with this, the PLFA analysis of axenic cultures of P. croceum indicated the fungal lipid pattern to be dominated by 18:1 ω9 (43%), followed by 18:2 ω6,9 (17%).

2.7. Statistical Analysis

Univariate analysis of variance (ANOVA) was performed with nematode trophic groups (n = 8) as fixed factor. The normality and homogeneity of variance of the data for all parameters was checked using Shapiro-Wilk-W-test and Levene’s test. Tukey HSD calculated at p < 0.05 was used to analyze mean differences in nematode trophic group abundances, microbial biomass and dominant groups as well as plant growth parameters.
Multivariate analysis of variance (MANOVA) was performed with dominant soil PLFAs as response design variables to analyze the effects of the nematode inoculation treatments (n = 8) as categorical predictor in the model. Data were visualized by Discriminant function analysis (DFA) with nematode treatments used as groups (n = 8) and PLFAs (n = 18) as dependent variables. The Pearson correlation coefficients of PLFAs with the first and second root are given. For all statistical analyses the STATISTICA package 9.0 for Windows (StatSoft, Hamburg, Germany) was used.

3. Results

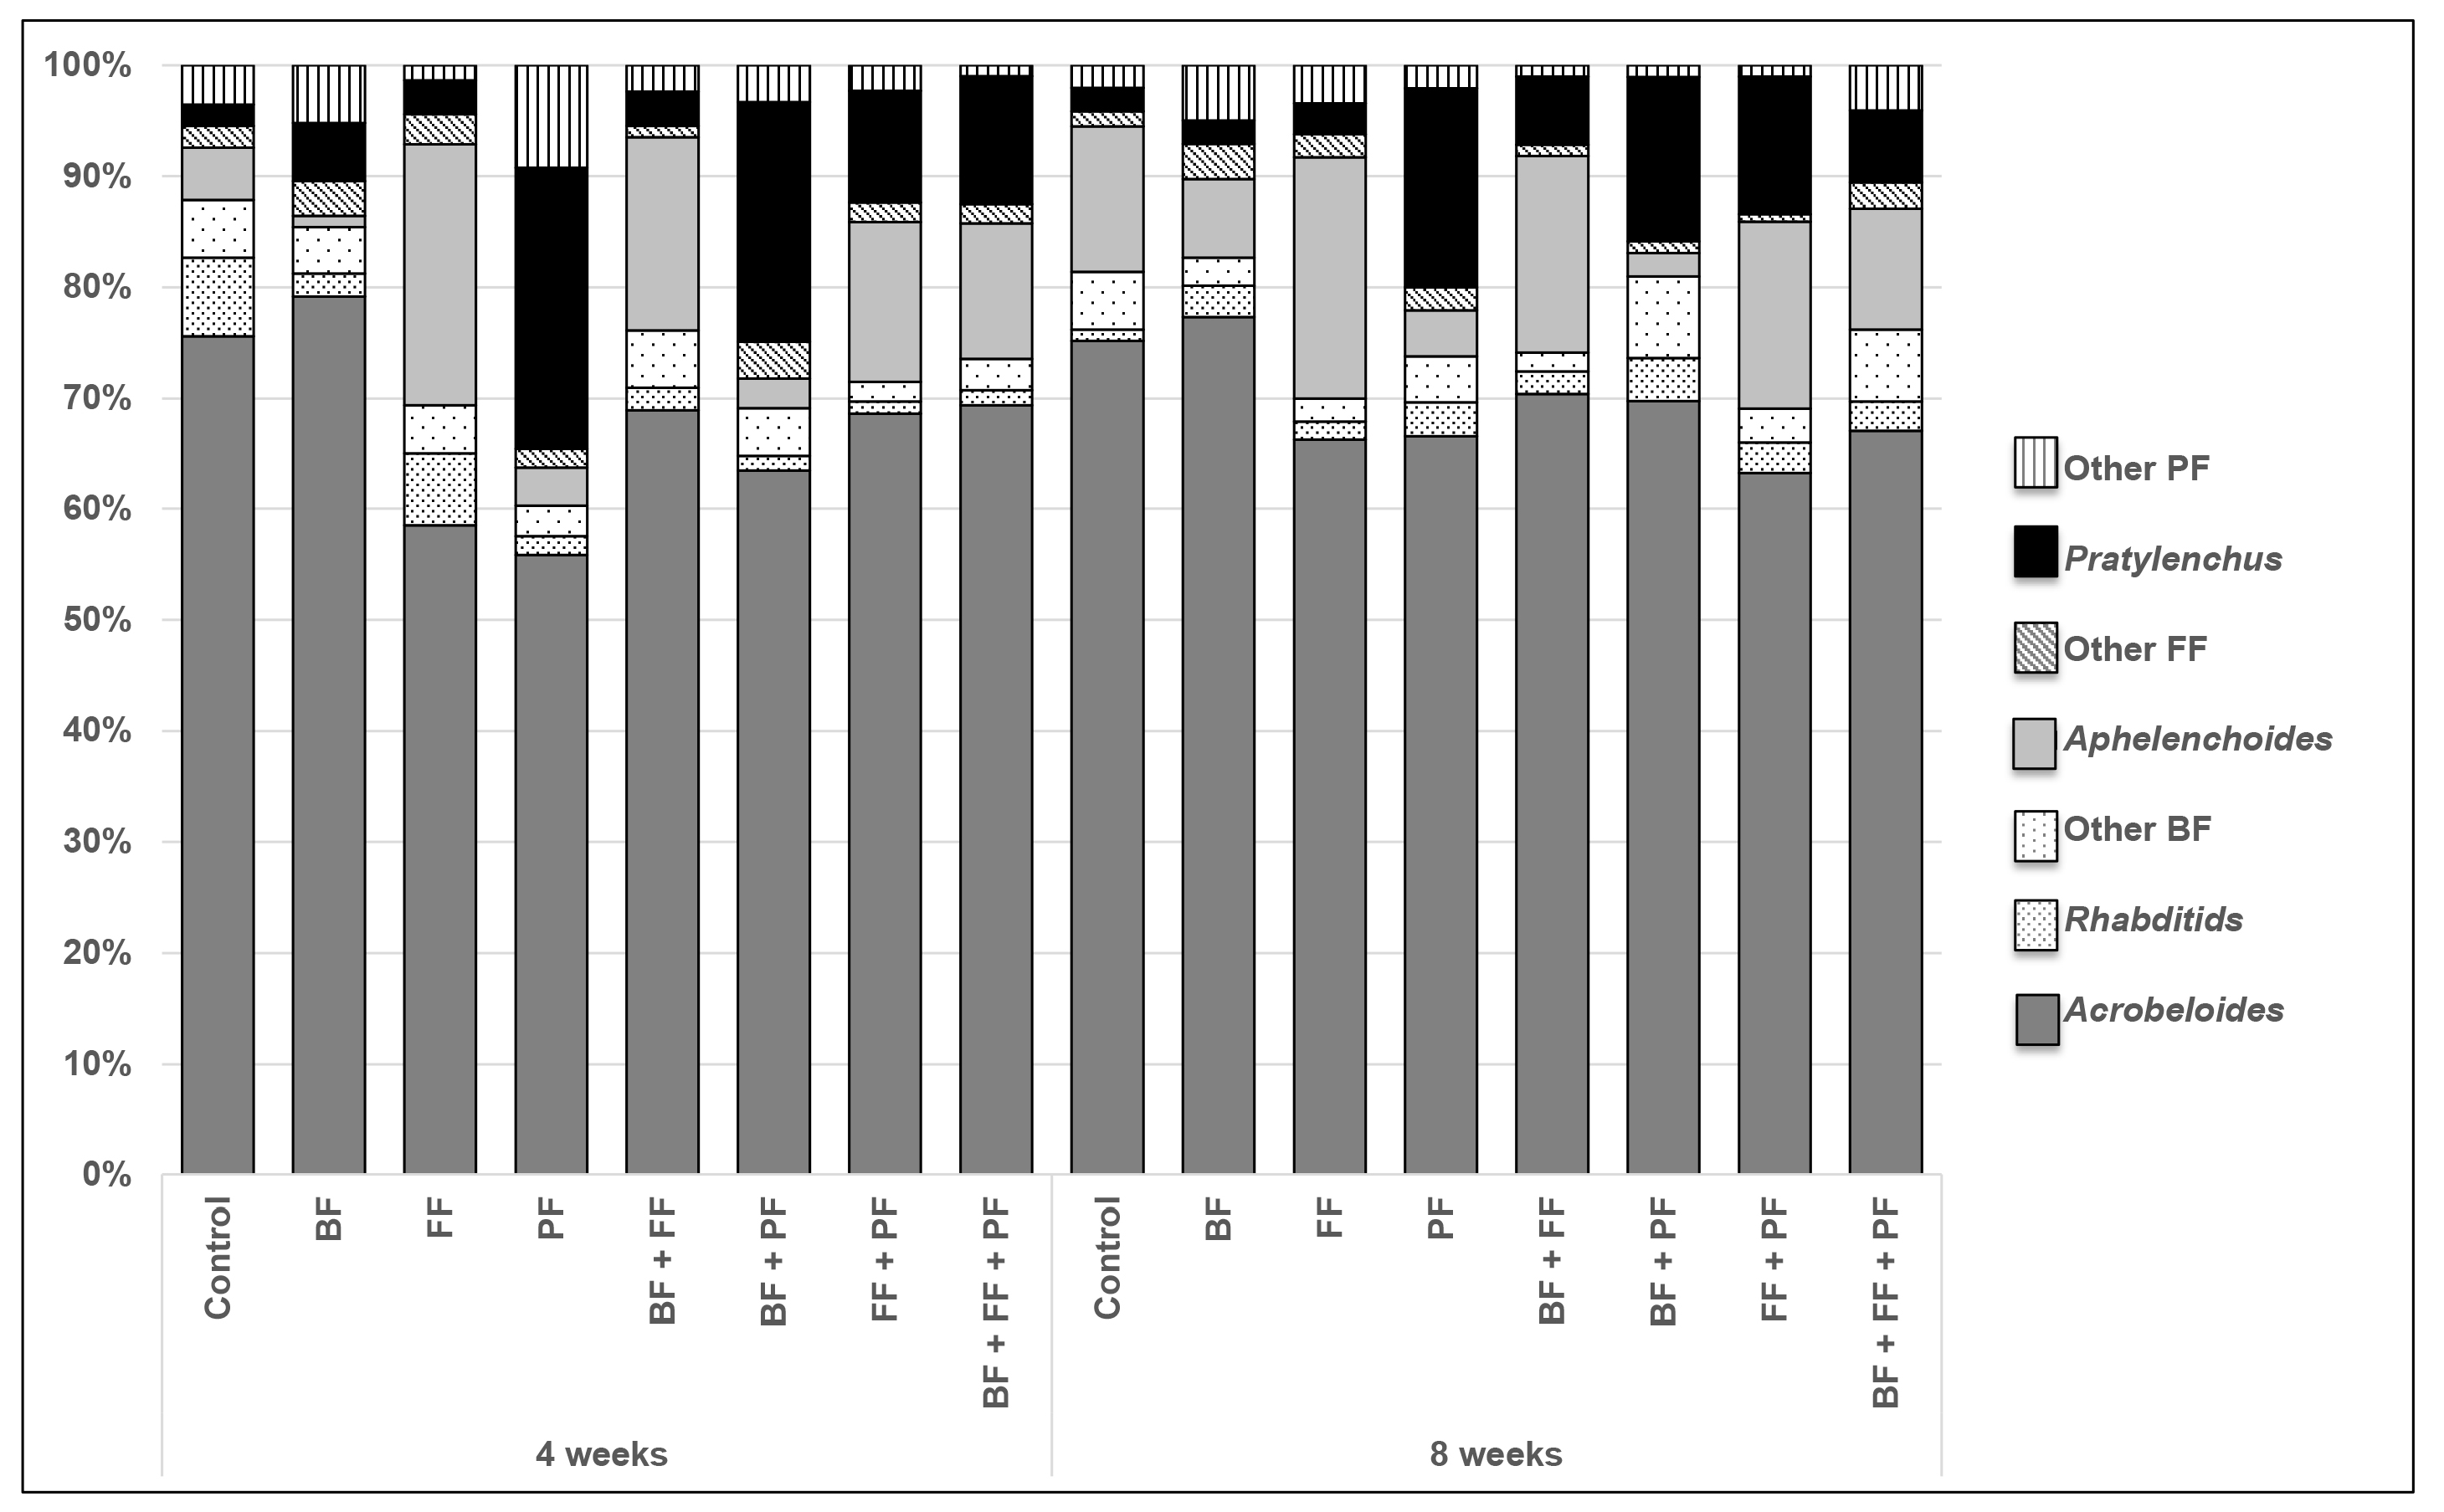
3.1. Nematode Community Structure

The population densities ranged between 8–18 and 7–20 Ind. g−1 DW at 4 and 8 weeks after nematode inoculation, respectively, and were comparable to those in natural soil at the field site with 5–34 Ind. g−1 DW soil (mean 12 Ind. g−1 DW soil, n = 28; unpublished data) indicating a re-establishment of the nematode population after soil freezing and incubation. Moreover, the population density across the treatments did not differ significantly from the control soil. A density effect of the nematode inoculation was apparent only at 8 weeks after nematode inoculation, with the BF + PF showing higher overall nematode numbers compared to FF (ANOVA: F7, 40 = 3.57, p = 0.004, Table S1).
At both sampling times, the nematode fauna in soils from all treatments was dominated by bacterial feeders (60–87%), followed by fungal (3–26%) and plant feeders (7–35%) (Figure 1). ANOVA revealed that the application of different functional groups significantly altered the relative abundance of bacterial (4 weeks: F7, 16 = 247.7, p < 0.001; 8 weeks: F7, 16 = 147.2, p < 0.001), fungal (4 weeks: F7, 16 = 406.5, p < 0.001; 8 weeks: F7, 16 = 142.1, p < 0.001) and plant (4 weeks: F7, 16 = 372.7, p < 0.001; 8 weeks: F7, 16 = 136.7, p < 0.001) in the soil.
Comparison of the relative abundance of nematode trophic groups revealed that the trophic structure in all treatments was altered at 4 and 8 weeks after nematode inoculation (Tukey, p < 0.05; Table S2). Compared to the control soil, inoculation of either FF or PF or their combinations had significantly higher proportions of fungal and plant feeders, regardless of sampling time (Figure 1). In contrast, inoculation of BF did not increase this target group compared to the control, yet altered taxon structure within, e.g., lower proportion of Rhaditis 4 weeks after inoculation of A. buetschlii. Moreover, the proportions of plant and fungal feeders differed significantly (Table S2), with the latter resulting in a lower fungal to bacterial feeder ratio.

3.2. Impact of the Nematode Trophic Structure on the Microbial Community

3.2.1. Biomass of Microorganisms

The total amount of soil PLFAs, a measure of microbial biomass, ranged from 31 to 39 nmol g−1 DW across treatments (Table 1). A treatment effect was significant at both sampling times (4 weeks: F7, 37 = 16.21, p < 0.001, 8 weeks: F7, 39 = 83.9, p < 0.001); soils amended with two or three nematode functional groups generally had higher microbial biomass compared to the control (Table 1).
Additionally, changes in nematode community structure altered the occurrence of dominant microbial groups in the soil. At 4 weeks after nematode inoculation, Gram-positive (F7, 37 = 39.5, p < 0.001) and Gram-negative (F7, 37 = 52.2, p < 0.001) bacteria increased with combined inoculation of BF + FF and FF + PF as well as with inoculation of all three functional groups (BF + FF + PF) as compared to the control. In contrast, with BF + PF the Gram-positive bacteria declined compared to all other treatments and the control (Table 1). Moreover, soils treated with FF + PF and BF + FF + PF comprised higher amounts of actinobacteria (F7, 37 = 6.1, p < 0.001) and general bacterial fatty acids (F7, 37 = 6.4, p < 0.001) compared to singular inoculations of the trophic groups (Table 1).
At 8 weeks after nematode inoculation, treatments combining two or all three trophic groups generally increased the biomass of Gram-positive (F7, 39 = 83.0, p < 0.001), Gram-negative (F7, 39 = 178.9, p < 0.001), and actinobacteria (F7, 39 = 132.2, p < 0.001) as well as fungi (F7, 39 = 227.7, p < 0.001) in comparison to the control (Table 1). Singular PF treatment enhanced the growth of Gram-negative bacteria and fungi relative to the control. On the other hand, with sole inoculation of BF or FF the occurrence of Gram-positive and bacteria in general declined, with FF further lowering the presence of Gram-negative and actinobacteria, and fungi, compared to the control (Table 1).

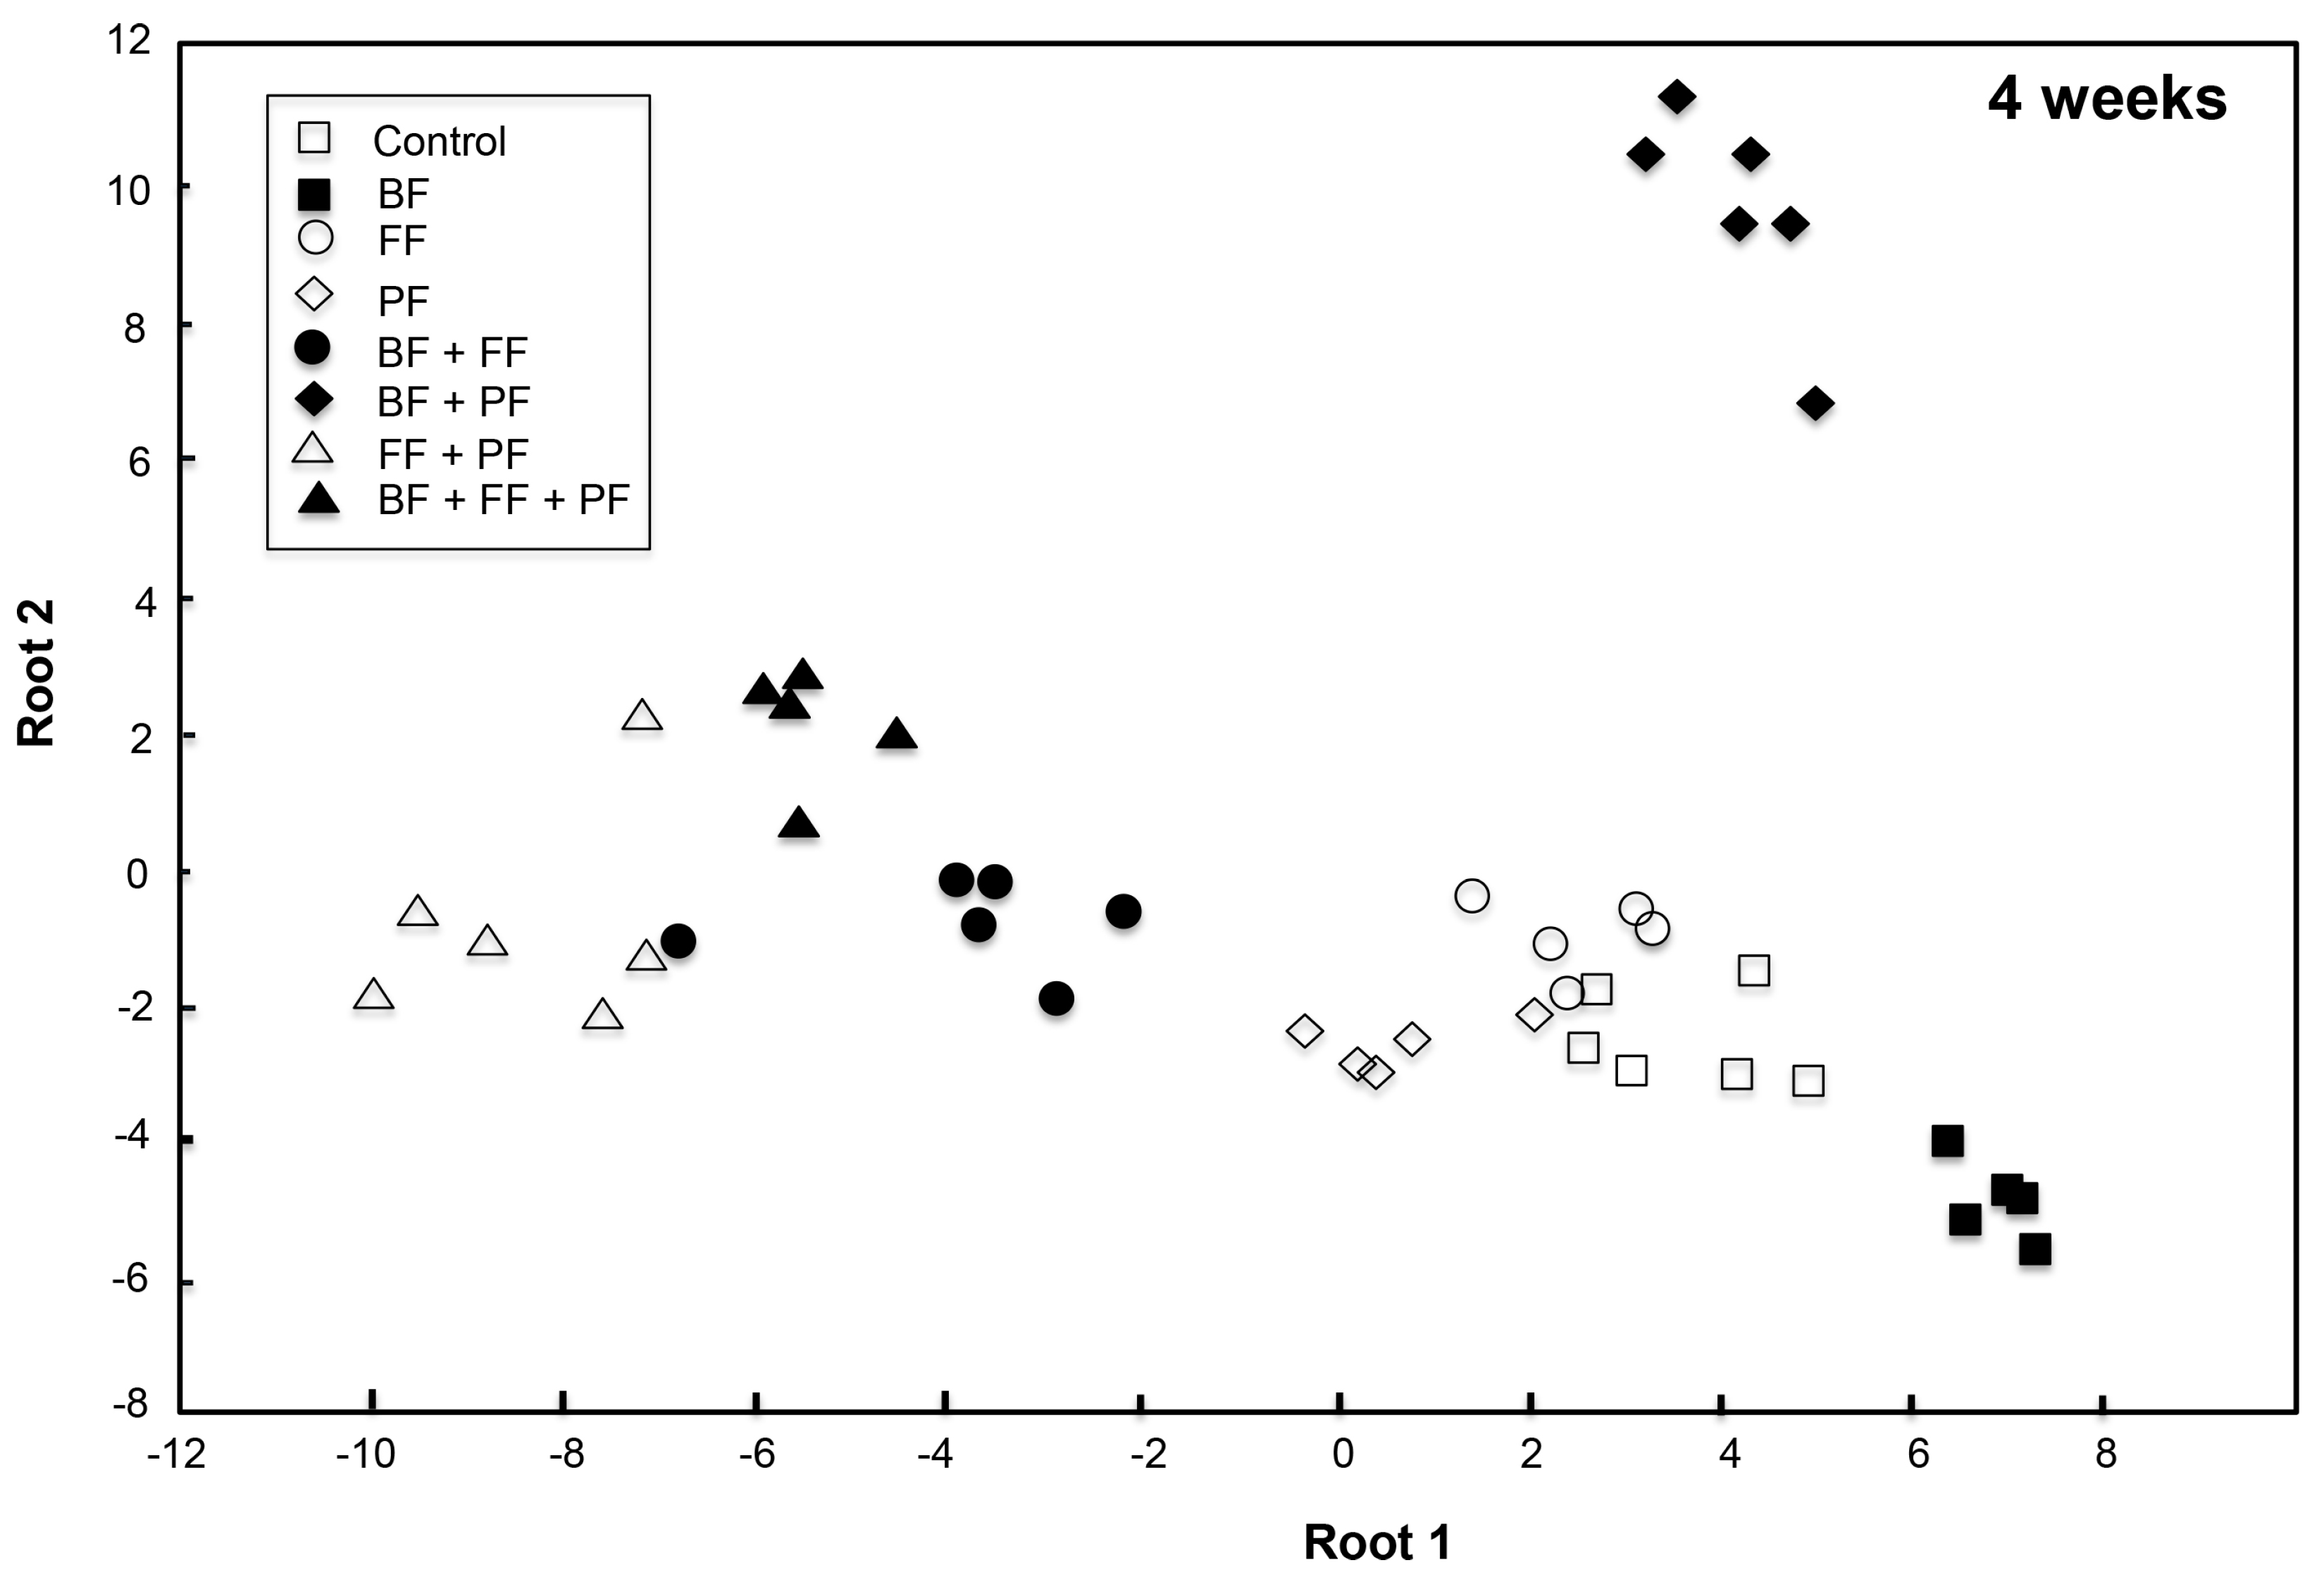
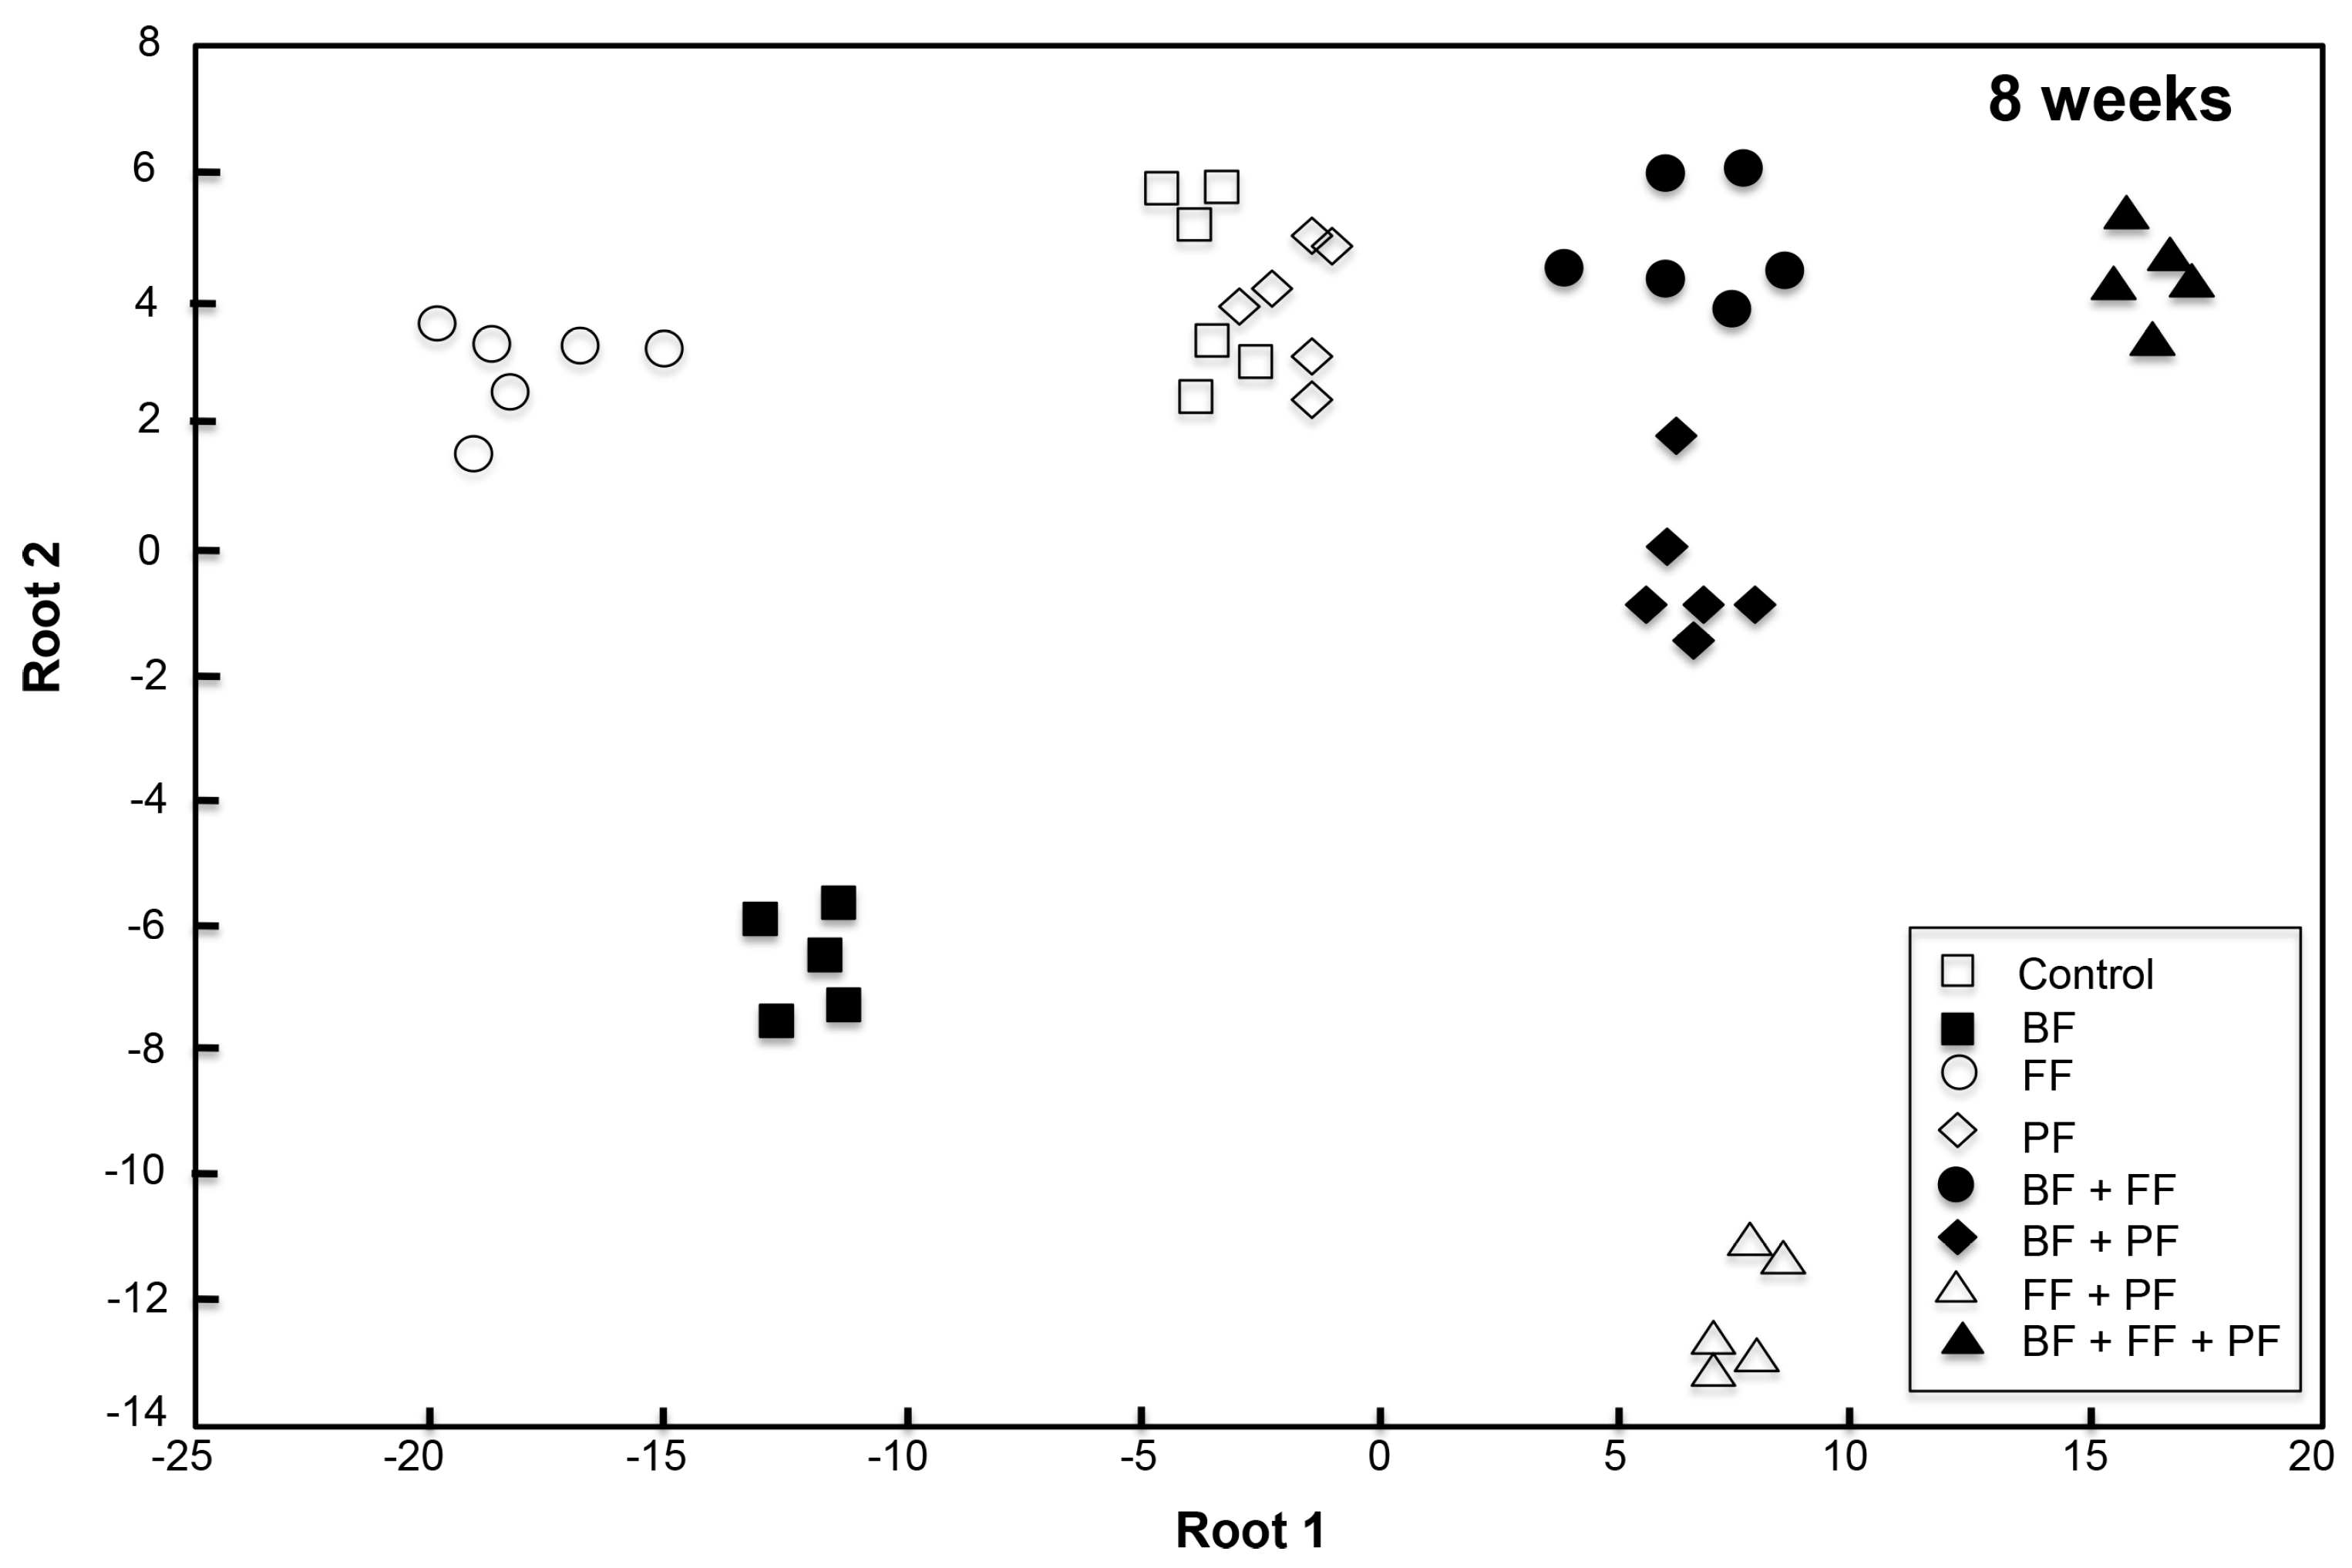
3.2.2. Community Structure of Microorganisms

MANOVA of soil PLFA pattern showed that altering the density of nematode trophic groups distinctly changed the fatty acid composition at both samplings (4 weeks: F126, 142 = 4.85, p < 0.001; 8 weeks: F126, 155 = 23.89, p < 0.001).
At 4 weeks after nematode inoculation, the DFA of the PLFA patterns separated the microbial communities (whole model: F112, 151 = 5.70, p < 0.001), with the first two discriminant functions significant (p < 0.001), explaining 85% of the variance within data. The first root with an eigenvalue of 30 discriminated the microbial communities in soils receiving two (BF + FF, FF + PF) or three functional groups (BF + FF+ PF) from those in soils treated with a single functional group (BF, FF, PF) (Figure 2). Individual PLFAs were correlated with the axes extracted by DFA. PLFAs of Gram-positive bacteria (i15:0, a15:0, i16:0, i17:0, a17:0), Gram-negative bacteria (cy17:0, cy19:0), acidobacteria (16:0 10-meth, 18:0 10-meth) and a general bacterial marker (16:1 ω7) as well as the fungal PLFA 18:1 ω9 were responsible for the separation (Table 2). This corresponds to a high amount of these PLFAs in the treatments BF + FF, FF + PF, BF + FF+ PF (Table S3). Discrimination by root 2, with an eigenvalue of 21, clearly separated the treatment BF + PF from all others (Figure 2). Pearson correlation revealed that this was mainly based on the occurrence of the bacterial PLFAs i15:0, a15:0 and i17:0 (Gram-positive) and 16:0 10-meth (actinobacteria). These PLFAs showed the least amount in soils inoculated with BF + PF (Table S3).
Eight weeks after nematode inoculation, the discriminant function analysis of soil PLFA pattern separated the microbial communities amended with two or three functional groups from singular treatments and the control (whole model: F112, 164 = 27.95, p < 0.001). The first two roots were significant (p < 0.001) and accounted for 77.2% of the variation. Along root 1, with an eigenvalue of 131, the singular BF and FF treatments were distinctly separated from combined treatments, whereas PF was entangled with the control soil (Figure 3). All bacterial and fungal marker PLFAs were significantly positively correlated with root 1 (Table 2), which corresponds to the higher amounts of these markers in all soils with inoculation of more than one nematode functional group (Table S4). Root 2, with an eigenvalue of 42, separated the BF and FF + PF treatments from all others (Figure 3). Here predominantly fungi were responsible for the discrimination of microbial communities, as indicated by the correlation of 18:1 ω9 and 18:2 ω6,9 with root 2 (Table 2). This corresponds to the significantly highest amount of these fungal PLFAs in the FF + PF treatment (Table S4).

3.3. Impact of the Nematode Trophic Structure on Oak Growth

No changes in oak performance, i.e., the assessed parameters shoot and root weight, and root/shoot ratio, among treatments were detected at 4 weeks after nematode inoculation (Table 3). However, with time the effect of functional groups became evident and at 8 weeks after nematode inoculation the root/shoot ratio of oak seedlings increased in BF + FF + PF, and decreased in PF and FF + PF amended soil (F7, 40 = 25.14, p < 0.001).

4. Discussion

4.1. Experimental Manipulation of Trophic Structure in the Oak Rhizosphere

A major premise for this study was to investigate rhizosphere processes under realistic semi-natural conditions, where native microbes, nematodes and plants interact. The indigenous soil nematode fauna was therefore moderately reduced using a freeze-thaw method. The reason for not eliminating the nematodes completely prior to the start of the experiment was to avoid obtaining inaccurate results due to underrepresentation of parts of the biotic interactions occurring in the soil as attained by overly reductionist approaches such as sterilizing soil and re-inoculating only single or few model taxa [44]. Other procedures, e.g., microwaving, chemical disinfection or gamma irradiation have also been shown to cause undesirable side effects on nematodes, microorganisms and nitrogen dynamics [45,46]. In contrast, the freeze-thaw method has minute effects on soil nutrient status as well as microbial communities [47,48]. In the present study, the amount of PLFAs indicative for dominant microbial groups was comparable to field soil for fungi, whereas for bacteria the amounts were doubled (field soil: 4.3, 2.0, 1.6, and 2.2 nmol g−1 DW for fungi, Gram+. Gram−, and Actinobacteria, respectively; Gutknecht pers. com.). Thus, 8 and 12 weeks after freezing, the soil comprised a vital microbial community, yet with a greater bacterial dominance. The latter likely is attributed to a stimulatory effect of bacterial-feeding nematodes, which generally increased in relative abundance in the soil following freezing.
As expected and reported by other studies, for example [49,50], the data obtained from all treatments indicate that the autochthonous nematode community had re-established itself during the course of the experiment (8 and 12 weeks after freezing). This resembled the natural density at the field site with an average of 12 Ind. g−1 DW soil (data not published). To corroborate this data, Poll and co-workers [17] showed that the freeze-thaw method had a short-term effect with no nematode specimens detected during the first two weeks following the freezing treatment and a gradual build-up of over the course of the experiment. However, soil freezing altered the native background nematode community structure as indicated by the control (bacterial feeders 84.5%, fungal feeders 10.7%, plant feeders 4.9%) relative to the natural soil (bacterial feeders 54.6%, fungal feeders 9.8%, plant feeders 35.6%). Regardless of the treatment applied bacterial feeders dominated, particularly Acrobeloides, an opportunistic taxon resilient to disturbance such as freezing, and moreover, frequent rhizosphere inhabitant [51]. The taxa Pratylenchus and Aphelenchoides had low densities in the control soil due to slow re-establishment of populations after freezing, indicated by the increase in relative abundance of fungal feeders that have a longer generation time than bacterial feeders from 6.8% at 4 weeks to 15% at 8 weeks.
The nematode treatments successfully manipulated the relative abundances of respective functional groups in fungal (+20%) and plant (+30%) feeders, where singular inoculations of P. penetrans and A. saprophilus enriched their relative abundance. On the other hand, at first glance it would appear that the BF treatment did not work, as the overall proportion of bacterial feeders did not differ from the control at both sampling times. However, the taxon composition showed a general shift, as abundance of Rhabditis (strong r-strategist) declined compared to the inoculated opportunist A. buetschlii after 4 weeks. Moreover, the trophic structure was not identical, with higher proportions of plant feeders in the BF treatment compared to the control. Also, the proportions of fungal feeders differed significantly, resulting in a lower fungal to bacterial feeder ratio, likely with consequences on the rate of nutrient cycling. Overall, giving different inocula to the soil resulted in altered nematode trophic structure, which allowed assessing their function in the rhizosphere micro-food web.

4.2. Effects of Multitrophic Interactions on Rhizosphere Microorganisms and Oak Performance

4.2.1. Plant Feeders

Corresponding to our first hypothesis, an increased proportion of only plant feeders enhanced the biomass of fungi and of Gram-negative bacteria in comparison to control soil. In contrast, the occurrence of Gram-positive bacteria was less, possibly due to enhanced rhizodeposition. The latter can give a competitive advantage to Gram-negative bacteria, as they multiply rapidly on these labile carbon resources [52]. Such nematode induced “leakage” in the rhizosphere is well known for annual and crop plants, e.g., clover, barley or maize [16,17,53]. For perennial woody plants, P. penetrans was reported to stimulate microbial growth in the rhizosphere of oak [25], predominantly due to a promotion of plant carbon flow belowground [26]. On the other hand, transcriptome analyses revealed P. penetrans to act as a strong root carbon sink leading to resource competition with the oak’s ectomycorrhizal symbiont P. croceum [54]. Taking into account the worldwide occurrence of this taxon, and its broad host range, underpins its importance in regulating microbial communities, and moreover plant symbiotic relationships, not only in the rhizosphere of crop plants but also in forest trees [35].

4.2.2. Bacterial Feeders

Generally, the impact of the inoculation of the bacterial-feeding A. buetschlii was minor, likely attributed to the background of other native Acrobeloides in the pot soil, which was dominated by this opportunistic genus. Despite that, at 8 weeks after nematode inoculation the abundance of bacteria, mostly that of Gram-positive taxa, was reduced in soils amended with A. buetschlii. Generally, the impact of bacterial feeders on their prey varies according to nematode species [55], incubation time [56], and bacterial taxon [57,58,59]. Bacterial feeders alter the composition of bacterial populations [13], often increasing the occurrence of grazing-protected taxa, either by cell wall properties (e.g., Gram-positive bacteria), filamentous growth (e.g., actinobacteria) or diverse chemical compounds [60,61].
Besides its effects on bacteria, A. buetschlii increased fungal biomass and subsequently the F/B ratio compared to the control at 8 weeks after nematode inoculation. While this did not result in a general promotion of plant growth, the oak root/shoot ratio declined. This lower investment in roots could be an indirect effect mediated by the facilitation of root mycorrhization as previously reported [5].

4.2.3. Fungal Feeders

Singular inoculation of A. saprophilus resulted in an increased proportion of fungal feeders in the soil. Subsequently, the biomass of all microbial groups, including fungi, was reduced, indicating a strong top-down control by fungal feeders. Further, the F/B ratio declined significantly, confirming this grazing pressure. A. saprophilus was shown to reduce mycelial weight and fungal growth rate, with a preference for ectomycorrhizal fungi [37,62], which consequently can lead to a decline in plant fitness and growth [63]. However, no negative effects on oak growth were observed in singular treatments of A. saprophilus. Generally, the impact of fungal grazing on plants depends on the soil nutrient availability [28,30,63,64]. In the present experiment, the oaks were supplemented with nitrogen fertilizer, which likely buffered potential negative impact of fungal-feeding on oak performance.

4.2.4. Multitrophic Interactions

Generally, altering trophic interactions by combinations of two or three nematode functional groups stimulated microorganisms as compared to singular inoculations and the control at both 4 and 8 weeks after nematode inoculation. Moreover, the community composition varied and treatments were distinctly separated by their PLFA pattern. The fact that the experimental functional group treatments did not significantly increase the nematode population density in any of the treatments validates that the assigned changes in microbial biomass and community structure are based on the differences in trophic structure and related interspecific interactions.
Predominantly, the interaction of fungal and plant feeders affected rhizosphere microorganisms, as their joint inoculation increased microbial biomass and altered community structure as compared to their singular inoculation. This effect was more evident at 8 weeks after nematode inoculation, and correlated to the occurrence of the fungal PLFAs, which significantly increased. The degradation of cellulose in plant cell walls, by enzymes released from plant feeders, is reported to indirectly foster biomass of soil fungi [65,66]. Moreover, a negative effect of fungal grazers, as detected in the singular treatments, likely was balanced by better resource availability via plant feeder induced “leakage” into the rhizosphere environment. This is consistent with findings by Maboreke et al. [26], who reported comparable synergistic interactions between fungal-feeding Collembola and plant-feeding nematodes. Overall, considering nematode fungal feeders as functional component of forest soils, their impact on ectomycorrhiza fungi plays a key role for tree fitness [35].
Another dual interaction, that of bacterial and plant feeders, similarly fostered microbial biomass as compared to inoculations of single functional groups. Moreover, the microbial communities were distinguishable from another, with Gram-negative and acidobacteria responsible for discrimination at 4 weeks and fungi at 8 weeks after nematode inoculation. With the co-inoculation with bacterial feeders the root/shoot ratio of oaks was higher as compared to singular inoculation of plant feeders, indicating an offset of the damage caused by the latter. Previous studies demonstrated that this positive impact was related to an increased microbial turnover and soil nutrient availability [31]. This suggests that the interaction of bacteria and plant feeders, both primary modulators of microbial biomass and activity in the rhizosphere, can have a positive impact on plant fitness.
The combined inoculation of bacterial and fungal feeders, and the related interactions, altered the structure of the rhizosphere microbial community at both 4 and 8 weeks after nematode inoculation. Compared to the sole functional group treatments and the control, the biomass of bacteria and fungi increased. Fungal grazing by nematodes likely has released nutrients immobilized in fungal biomass as resources for bacteria, which corresponds to findings of Maboreke et al. [26], who reported that grazing by Collembola promoted bacterial growth. Additionally, the presence of bacterial feeders likely regulated the bacterial biomass [67], thereby reducing competition for root carbon, and in turn indirectly facilitating fungal growth.
Lastly, inoculation with all functional groups, i.e., the combination of primary consumers (PF) and secondary decomposers (BF, FF), significantly enhanced the microbial biomass compared to singular and dual treatments. In particular, at 8 weeks after nematode inoculation this most complex treatment was distinctly separated from the treatments of bacterial feeders combined with either fungal or plant feeders. These changes were related to a higher biomass of Gram-negative and actinobacteria, and a biomass decline in fungi as well as the F/B ratio, indicating a facilitation of the bacterial decomposition pathway. Generally, complex fauna communities are considered as more effective in promoting plant production than simple ones [27,28,29,30,68]. However, plant growth responses due to variation in trophic structure may be non-linear and depending on the density and taxon of nematodes used [69]. In the three trophic group treatment oak biomass did not change, yet the root/shoot ratio was significantly higher as compared to singular or dual trophic group inoculations, pointing towards an altered plant carbon allocation strategy in a rhizosphere environment with multitrophic interactions.
In conclusion, this study used a semi-natural experimental set-up that incorporated the endogenous nematode soil fauna, and manipulated the relative abundance of trophic groups at field population density. This realistic approach revealed distinct effects of nematode trophic structure on the soil microbial community and on plant fitness. Although the artefact of background nematode communities presented a challenge in interpretation of data, the findings are more reflective of what transpires in nature compared to simplified experiments that overlook the biotic complexity in the rhizosphere. These simultaneous multitrophic interactions and their cumulative feedback cannot be pictured in model systems comprising few taxa only. By avoiding such simple presence/absence scenarios, this study could show that inoculation of the rhizosphere environment with two or three nematode trophic groups can alleviate the negative effects of single groups on oak performance. For example, plant feeders play a dual role as they act as nutrient sink, facilitating the fungal symbiont, and induce leakage of plant metabolites, fostering bacterial biomass and activity. Most importantly in forest trees, such interspecific interactions can counter-balance negative impact on ectomycorrhiza imposed by fungal grazers. Overall, a trophic complex micro-food web, with its multitude of direct and indirect interactions, is a pre-requisite for a plant growth-promoting rhizosphere environment.

Supplementary Materials

The following are available online at https://www.mdpi.com/1424-2818/10/1/15/s1; Table S1: Effects of inoculation of nematode trophic groups on the overall population density in the rhizosphere of Quercus robur. Table S2: Effects of inoculation of nematode trophic groups on the relative abundance of the groups and dominant taxa in soil. Table S3: Effects of nematode trophic structure on soil phospholipid fatty acids at 4 weeks after nematode inoculation. Table S4: Effects of nematode trophic structure on soil phospholipid fatty acids at 8 weeks after nematode inoculation.

Acknowledgments

This work was funded by the Deutsche Forschungsgemeinschaft (DFG) with the grant RU 780/5-1 supporting H.M.

Author Contributions

H.R.M. and L.R. conceived and designed the experiments; V.B. and H.R.M. performed the experiments; V.B. and H.R.M. analyzed the data; R.S.-B. contributed by determining nematode taxa; H.R.M. in addition, L.R. wrote the paper.

Conflicts of Interest

The authors declare no conflict of interest. The funding sponsors had no tole in the design of the study, in the collection, analyses, or interpretation of data, in the writing of the manuscript, or in the decision to publish the results.

References

  1. Högberg, P.; Nordgren, A.; Buchmann, N.; Taylor, A.F.S.; Ekblad, A.; Högberg, M.N.; Nyberg, G.; Ottosson-Löfvenius, M.; Read, D.J. Large-scale forest girdling shows that current photosynthesis drives soil respiration. Nature 2001, 411, 789–792. [Google Scholar] [CrossRef] [PubMed]
  2. Prescott, C.E.; Grayston, S.J. Tree species influence on microbial communities in litter and soil: Current knowledge and research needs. For. Ecol. Manag. 2013, 309, 19–27. [Google Scholar] [CrossRef]
  3. Berendsen, R.L.; Pieterse, C.M.J.; Bakker, P.A.H.M. The rhizosphere microbiome and plant health. Trends Plant Sci. 2012, 17, 478–486. [Google Scholar] [CrossRef] [PubMed]
  4. Courty, P.E.; Buée, M.; Diedhiou, A.G.; Frey-Klett, P.; Le Tacon, F.; Rineau, F.; Uroz, S.; Garbaye, J. The role of ectomycorrhizal communities in forest ecosystem processes: New perspectives and emerging concepts. Soil Biol. Biochem. 2010, 42, 679–698. [Google Scholar] [CrossRef]
  5. Smith, S.E.; Read, D.J. Mycorrhizal Symbiosis, 3rd ed.; Academic Press: London, UK, 2008. [Google Scholar]
  6. Smith, S.E.; Smith, F.A. Structure and function of the interfaces in biotrophic symbioses as they relate to nutrient transport. New Phytol. 1990, 114, 1–38. [Google Scholar] [CrossRef]
  7. Bardgett, R. The Biology of Soil: A Community and Ecosystem Approach; Oxford University Press: Oxford, UK, 2005. [Google Scholar]
  8. Cole, L.; Staddon, P.L.; Sleep, D.; Bardgett, R.D. Soil animals influence microbial abundance, but not plant-microbial competition for soil organic nitrogen. Funct. Ecol. 2004, 18, 631–640. [Google Scholar] [CrossRef]
  9. Yeates, G.W.; Bongers, T.; de Goede, R.G.M.; Freckman, D.W.; Georgieva, S.S. Feeding habits in soil nematode families and genera—An outline for soil ecologists. J. Nematol. 1993, 25, 315–331. [Google Scholar] [PubMed]
  10. Scharroba, A.; Dibbern, D.; Hünninghaus, M.; Kramer, S.; Moll, S.; Butenschoen, O.; Bonkowski, M.; Buscot, F.; Kandeler, E.; Koller, R.; et al. Effects of resource availability and quality on the structure of the micro-food web of an arable soil across depth. Soil Biol. Biochem. 2012, 50, 111–119. [Google Scholar] [CrossRef]
  11. Scharroba, A.; Kramer, S.; Kandeler, E.; Ruess, L. Spatial and temporal variation of resource allocation in an arable soil drives community structure and biomass of nematodes and their role in the micro-food web. Pedobiologia 2016, 59, 111–120. [Google Scholar] [CrossRef]
  12. Yeates, G.W. Nematodes in ecological webs. In Encyclopedia of Life Science; Wiley & Sons: Chichester, UK, 2010; pp. 1–10. [Google Scholar]
  13. Djigal, D.; Brauman, A.; Diop, T.A.; Chotte, J.L.; Villenave, C. Influence of bacterial-feeding nematodes (Cephalobidae) on soil microbial communities during maize growth. Soil Biol. Biochem. 2004, 36, 323–331. [Google Scholar] [CrossRef]
  14. Neher, D.A. Ecology of plant and free-living nematodes in natural and agricultural soil. Ann. Rev. Phytopathol. 2010, 48, 371–394. [Google Scholar] [CrossRef] [PubMed]
  15. Yeates, G.W.; Saggar, S.; Denton, C.S.; Mercer, C.F. Impact of clover cyst nematode (Heterodera trifolii) infection on soil microbial activity in the rhizosphere of white clover (Trifolium repens)—A pulse-labelling experiment. Nematologica 1998, 44, 81–90. [Google Scholar] [CrossRef]
  16. Yeates, G.W.; Saggar, S.; Hedley, C.B.; Mercer, C.F. Increase in 14C-carbon translocation to soil microbial biomass when five species of plant-parasitic nematodes infect roots of white clover. Nematology 1999, 1, 295–300. [Google Scholar] [CrossRef]
  17. Poll, J.; Marhan, S.; Haase, S.; Hallmann, J.; Kandeler, E.; Ruess, L. Low amounts of herbivory by root-knot nematodes affect microbial community dynamics and carbon allocation in the rhizosphere. FEMS Microbiol. Ecol. 2007, 62, 268–279. [Google Scholar] [CrossRef] [PubMed]
  18. Chen, J.; Ferris, H. The effects of nematode grazing on nitrogen mineralization during fungal decomposition of organic matter. Soil Biol. Biochem. 1999, 31, 1265–1279. [Google Scholar] [CrossRef]
  19. Ferris, H.; Venette, R.C.; Scow, K.M. Soil management to enhance bacterivore and fungivore nematode populations and their nitrogen mineralisation function. Appl. Soil Ecol. 2004, 25, 19–35. [Google Scholar] [CrossRef]
  20. Sutherland, J.R.; Webster, J.M. Nematode pests of forest trees. In Plant Parasitic Nematodes in Temperate Agriculture; Evans, K., Trudgill, D.L., Webster, J.M., Eds.; CAB International: Tuscon, AZ, USA, 1993; pp. 351–380. [Google Scholar]
  21. Francl, L.J. Interactions of nematodes with mycorrhizae and mycorrhizal fungi. In Nematode Interactions; Kahn, M.W., Ed.; Chapman & Hall: New York, NY, USA, 1993; pp. 203–216. [Google Scholar]
  22. Gilbert, G.S. Evolutionary ecology of plant diseases in natural ecosystems. Ann. Rev. Phytopathol. 2002, 40, 13–43. [Google Scholar] [CrossRef] [PubMed]
  23. Wisz, M.S.; Pottier, J.; Kissling, W.D.; Pellissier, L.; Lenoir, J.; Damgaard, C.F.; Dormann, C.F.; Forchhammer, M.C.; Grytnes, J.A.; Guisan, A.; et al. The role of biotic interactions in shaping distributions and realised assemblages of species: Implications for species distribution modelling. Biol. Rev. 2013, 88, 15–30. [Google Scholar] [CrossRef] [PubMed] [Green Version]
  24. Praciak, A.; Pasiecznik, N.M.; Sheil, D.; van Heist, M.; Sassen, M.; Correia, C.S.; Dixon, C.; Fyson, G.E.; Rushforth, K.; Teeling, C. The CABI Encyclopedia of Forest Trees; CABI: Wallingford, UK, 2013. [Google Scholar]
  25. Caravaca, F.; Maboreke, H.; Kurth, F.; Hermann, S.; Tarkka, T.M.; Ruess, L. Synergists and antagonists in the rhizosphere modulate microbial communities and growth of Quercus robur L. Soil Biol. Biochem. 2015, 82, 65–73. [Google Scholar] [CrossRef]
  26. Maboreke, H.R.; Graf, M.; Grams, T.E.E.; Herrmann, S.; Scheu, S.; Ruess, L. Multitrophic interactions in the rhizosphere of a temperate forest tree affect plant carbon flow into the belowground food web. Soil Biol. Biochem. 2017, 115, 526–536. [Google Scholar] [CrossRef]
  27. Coûteaux, M.M.; Mousseau, M.; Celerier, M.L.; Bottner, P. Increased atmospheric CO2 and litter quality: Decomposition of sweet chestnut leaf litter with animal food webs of different complexities. Oikos 1991, 61, 54–64. [Google Scholar] [CrossRef]
  28. Setälä, H.; Laakso, J.; Mikola, J.; Huhta, V. Functional diversity of decomposer organisms in relation to primary production. Appl. Soil Ecol. 1998, 9, 25–31. [Google Scholar] [CrossRef]
  29. Laakso, J.; Setälä, H. Sensitivity of primary production to changes in the architecture of belowground food webs. Oikos 1999, 87, 57–64. [Google Scholar] [CrossRef]
  30. Setälä, H. Growth of birch and pine seedlings in relation to grazing by soil fauna on ectomycorrhizal fungi. Ecology 1995, 76, 1844–1851. [Google Scholar] [CrossRef]
  31. Gebremikael, M.T.; Steel, H.; Buchan, D.; Bert, W.; de Neve, S. Nematodes enhance plant growth and nutrient uptake under C and N-rich conditions. Nat. Sci. Rep. 2016, 6, 32862. [Google Scholar] [CrossRef] [PubMed]
  32. Van Gestel, C.A.M.; Kruidenier, M.; Berg, M.P. Suitability of wheat straw decomposition, cotton strip degradation and bait-lamina feeding tests to determine soil invertebrate activity. Biol. Fertil. Soils 2003, 37, 115–123. [Google Scholar]
  33. Herrmann, S.; Buscot, F. Cross talks at the morphogenetic, physiological and gene regulation levels between the mycobiont Piloderma croceum and oak microcuttings (Quercus robur) during formation of ectomycorrhizas. Phytochemistry 2007, 68, 52–67. [Google Scholar] [CrossRef] [PubMed]
  34. Tarkka, M.T.; Herrmann, S.; Wubet, T.; Feldhahn, L.; Recht, S.; Kurth, F.; Mailander, S.; Bonn, M.; Neef, M.; Angay, O.; et al. OakContigDF159.1, a reference library for studying differential gene expression in Quercus robur during controlled biotic interactions: Use for quantitative transcriptomic profiling of oak roots in ectomycorrhizal symbiosis. New Phytol. 2013, 199, 529–540. [Google Scholar] [CrossRef] [PubMed]
  35. Maboreke, H. Effect of Plant-Parasitic Nematodes on Rhizosphere Interactions in Oaks. Ph.D. Thesis, Humboldt-Universität zu Berlin, Berlin, Germany, 2016. [Google Scholar]
  36. Marx, D.H. Influence of ectotrophic mycorrhizal fungi on resistance of pine roots to pathogenic infections. I. Antagonsim of mycorrhizal fungi to pathogenic fungi and soil bacteria. Phytopathology 1969, 59, 153–163. [Google Scholar]
  37. Ruess, L.; Dighton, J. Cultural studies on soil nematodes and their fungal hosts. Nematologica 1996, 42, 330–346. [Google Scholar] [CrossRef]
  38. O’Bannon, J.H.; Taylor, A.L. Migratory endoparasitic nematodes reared on carrot discs. Phytopathology 1968, 58, 385. [Google Scholar]
  39. Ruess, L. Studies on the nematode fauna of an acid forest soil: Spatial distribution and extraction. Nematologica 1995, 41, 229–239. [Google Scholar] [CrossRef]
  40. Byrd, D.W.; Kirkpatrick, T.; Barker, K.R. An improved technique for clearing and staining plant tissues for detection of nematodes. J. Nematol. 1983, 15, 42–143. [Google Scholar]
  41. Frostegård, A.; Tunlid, A.; Bååth, E. Phospholipids fatty acid composition, biomass and activity of microbial communities from two soil types experimentally exposed to different heavy metals. Appl. Environ. Microbiol. 1993, 59, 3605–3617. [Google Scholar] [PubMed]
  42. Ruess, L.; Chamberlain, P.M. The fat that matters: Soil food web analysis using fatty acids and their carbon stable isotope signature. Soil Biol. Biochem. 2010, 42, 1898–1910. [Google Scholar] [CrossRef]
  43. Frostegård, A.; Bååth, E. The use of phospholipid fatty acid analysis to estimate bacterial and fungal biomass in soil. Biol. Fertil. Soils 1996, 22, 59–65. [Google Scholar] [CrossRef]
  44. Gebremikael, M.T.; Buchan, D.; de Neve, S. Quantifying the influence of free-living nematodes on soil nitrogen and microbial biomass dynamics in bare and planted microcosms. Soil Biol. Biochem. 2014, 70, 131–141. [Google Scholar] [CrossRef]
  45. Huhta, V.; Wright, D.H.; Coleman, D.C. Characteristics of defaunated soil. I. A comparison of three techniques applied to two different forest soils. Pedobiologia 1989, 33, 415–424. [Google Scholar]
  46. Buchan, D.; Moeskops, B.; Ameloot, N.; de Neve, S.; Sleutel, S. Selective sterilisation of undisturbed soil cores by gamma irradiation: Effects on free-living nematodes, microbial community and nitrogen dynamics. Soil Biol. Biochem. 2012, 47, 10–13. [Google Scholar] [CrossRef]
  47. Stenberg, B.; Johansson, M.; Pell, M.; Sjodahl-Svensson, K.; Stenstrom, J.; Torstensson, L. Microbial biomass and activities in soil as affected by frozen and cold storage. Soil Biol. Biochem. 1998, 30, 393–402. [Google Scholar] [CrossRef]
  48. Kampichler, C.; Bruckner, A.; Baumgarten, A.; Berthold, A.; Zechmeister-Boltenstern, S. Field mesocosms for assessing biotic processes in soils: How to avoid side effects. Eur. J. Soil Biol. 1999, 35, 135–143. [Google Scholar] [CrossRef]
  49. Griffiths, B.S.; Bengough, A.G.; Neilson, R.; Trudgill, D.L. The extent to which nematode communities are affected by soil factors—A pot experiment. Nematology 2002, 4, 943–952. [Google Scholar] [CrossRef]
  50. Griffiths, B.S.; Neilson, R.; Bengough, A.G. Soil factors determined nematode community composition in a two years pot experiment. Nematology 2003, 5, 889–897. [Google Scholar] [CrossRef]
  51. Griffiths, B.S.; Young, I.M.; Boag, B. Nematodes associated with the rhizosphere of barley (Hordeum vulgare). Pedobiologia 1991, 35, 265–272. [Google Scholar]
  52. Waldrop, M.P.; Balser, T.C.; Firestone, M.K. Linking microbial community composition to function in a tropical soil. Soil Biol. Biochem. 2000, 32, 1837–1846. [Google Scholar] [CrossRef]
  53. Pausch, J.; Hofmann, S.; Scharroba, A.; Kuzyakov, Y.; Ruess, L. Fluxes of root-derived carbon into nematode micro-food web of an arable soil. Food Webs 2016, 9, 39–45. [Google Scholar] [CrossRef]
  54. Maboreke, H.R.; Feldhahn, L.; Bonn, M.; Tarkka, M.T.; Buscot, F.; Herrmann, S.; Menzel, R.; Ruess, L. Transcriptome analysis in oak uncovers a strong impact of endogenous rhythmic growth on interaction with plant-parasitic nematodes. BMC Genom. 2016, 17, 627. [Google Scholar] [CrossRef] [PubMed]
  55. Postma-Blaauw, M.B.; de Vries, F.T.; de Goede, R.G.M.; Bloem, J.; Faber, J.H.; Brussaard, L. Within-trophic group interactions of bacterivorous nematode species and their effects on the bacterial community and nitrogen mineralization. Oecologia 2005, 142, 428–439. [Google Scholar] [CrossRef] [PubMed]
  56. Elliott, E.T.; Anderson, R.V.; Coleman, D.C.; Cole, C.V. Habitable pore space and microbial trophic interactions. Oikos 1980, 35, 327–335. [Google Scholar] [CrossRef]
  57. Salinas, K.A.; Edenborn, S.L.; Sexstone, A.J.; Kotcon, J.B. Bacterial preferences of the bacterivorous soil nematode Cephalobus brevicauda (Cephalobidae): Effect of bacterial type and size. Pedobiologia 2007, 51, 55–64. [Google Scholar] [CrossRef]
  58. Abada, E.A.; Sung, H.; Dwivedi, M.; Park, B.J.; Lee, S.K.; Ahnn, J. C. elegans behaviour of preference choice on bacterial food. Mol. Cells 2009, 28, 209–213. [Google Scholar] [CrossRef] [PubMed]
  59. Xiao, H.F.; Griffiths, B.; Chen, X.; Liu, M.; Jiao, J.; Hu, F.; Li, H. Influence of bacterial-feeding nematodes on nitrification and the ammonia-oxidizing bacteria (AOB) community composition. Appl. Soil Ecol. 2010, 45, 131–137. [Google Scholar] [CrossRef]
  60. Griffiths, B.S.; Bonkowski, M.; Dobson, G.; Caul, S. Changes in soil microbial community structure in the presence of microbial-feeding nematodes and protozoa. Pedobiologia 1999, 43, 297–304. [Google Scholar]
  61. Mazzola, M. Manipulation of rhizosphere bacterial communities to induce suppressive soils. J. Nematol. 2007, 39, 213–220. [Google Scholar] [PubMed]
  62. Ruess, L.; Häggblom, M.M.; Garzía Zapata, E.J.; Dighton, J. Fatty acids of fungi and nematodes—Possible biomarkers in the soil food chain? Soil Biol. Biochem. 2002, 34, 745–756. [Google Scholar] [CrossRef]
  63. Setälä, H.; Rissanen, J.; Markkola, A.M. Conditional outcomes in the relationship between pine and ectomycorrhizal fungi in relation to biotic and abiotic environment. Oikos 1997, 80, 112–122. [Google Scholar] [CrossRef]
  64. Mamilov, A.Sh.; Byzov, B.A.; Zvyagintsev, D. G.; Dilly, O.M. Predation on fungal and bacterial biomass in a soddy-podzolic soil amended with starch, wheat straw and alfalfa meal. Appl. Soil Ecol. 2001, 16, 131–139. [Google Scholar] [CrossRef]
  65. Denton, C.S.; Bardgett, R.D.; Cook, R.; Hobbs, P.J. Low amounts of root herbivory positively influence the rhizosphere microbial community in a temperate grassland soil. Soil Biol. Biochem. 1999, 31, 155–165. [Google Scholar] [CrossRef]
  66. Tu, C.; Koenning, S.R.; Hu, S. Root-parasitic nematodes enhance soil microbial activities and nitrogen mineralization. Microb. Ecol. 2003, 46, 134–144. [Google Scholar] [CrossRef] [PubMed]
  67. Wardle, D.A.; Yeates, G.W. The dual importance of competition and predation as regulatory forces in terrestrial ecosystems-evidence from decomposer food webs. Oecologia 1993, 93, 303–306. [Google Scholar] [CrossRef] [PubMed]
  68. Setälä, H.; Huhta, V. Evaluation of the soil fauna impact on decomposition in a simulated coniferous forest soil. Biol. Fertil. Soils 1990, 10, 163–169. [Google Scholar]
  69. Bakhtiar, Y.; Miller, D.; Cavagnaro, T.; Smith, S. Interactions between two arbuscular mycorrhizal fungi and fungivorous nematodes and control of nematodes with fenamifos. Appl. Soil Ecol. 2001, 17, 107–117. [Google Scholar] [CrossRef]
Figure 1. Nematode trophic structure (proportion in %) and dominant taxa at 4 and 8 weeks after nematode inoculation. Control—no nematodes inoculated, bacterial feeders—BF (Acrobeloides buetschlii), fungal feeders—FF (Aphelenchoides saprophilus), plant feeders—PF (Pratylenchus penetrans).
Diversity 10 00015 g001
Figure 2. Discriminant function analysis of soil phospholipid fatty acid pattern at 4 weeks after nematode inoculation. The model used trophic groups of nematodes as groups (n = 8) and PLFAs (n = 13) as dependent variables. Control—no nematodes inoculated, bacterial feeders—BF (Acrobeloides buetschlii), fungal feeders—FF (Aphelenchoides saprophilus), plant feeders—PF (Pratylenchus penetrans).
Diversity 10 00015 g002
Figure 3. Discriminant function analysis of the soil phospholipid fatty acid pattern at 8 weeks after nematode inoculation. The model used trophic groups of nematodes as groups (n = 8) and PLFAs (n = 13) as dependent variables. Control—none, bacterial feeders—BF (Acrobeloides buetschlii), fungal feeders—FF (Aphelenchoides saprophilus), plant feeders—PF (Pratylenchus penetrans).
Diversity 10 00015 g003
Table 1. Effects of inoculation of nematode trophic groups on the total amount of phospholipid fatty acids (PLFAs in nmol g−1 DW soil ± s.d.) and on PLFAs indicative for Gram-positive (Gram+), Gram-negative (Gram−), bacteria in general (bacteria), actinobacteria, and fungi, and fungal/bacterial (F/B) PLFA ratio in the rhizosphere soil of Quercus robur. Presented are data at 4 and 8 weeks after nematode inoculation. Control—no nematodes inoculated, bacterial feeders—BF (Acrobeloides buetschlii), fungal feeders—FF (Aphelenchoides saprophilus), plant feeders—PF (Pratylenchus penetrans). Values within a row with at least one letter in common are not significantly different (Tukey HSD, p < 0.05). (Table from Maboreke [35], modified).
ControlBFFFPFBF+FFBF+PFFF+PFBF+FF+PFANOVA
4 weeksF7,37P
Total amount36.1 ± 2.0cd35.7 ± 0.5cd34.9 ± 0.7de36.5 ± 1.5bcd37.7 ± 1.3abc32.7 ± 1.5de39.0 ± 0.6a38.9 ± 0.6ab16.21<0.001
Gram+8.6 ± 0.2cd8.7 ± 0.1bcd8.5 ± 0.4d8.7 ± 0.2bcd9.1 ± 0.4ab7.1 ± 0.2e9.3 ± 0.4a9.0 ± 0.0abc39.53<0.001
Gram−3.4 ± 0.1cd3.3 ± 0.0cd3.3 ± 0.0d3.5 ± 0.1c3.7 ± 0.1b3.3 ± 0.0d4.0 ± 0.1a3.8 ± 0.0ab52.17<0.001
Bacteria6.8 ± 0.6ab6.7 ± 0.1ab6.3 ± 0.0bc6.5 ± 0.5abc6.7 ± 0.1ab6.06 ± 0.32bc7.1 ± 0.1a7.0 ± 0.0a6.40<0.001
Actinobacteria4.4 ± 0.3abc4.3 ± 0.1bc4.3 ± 0.1bc4.4 ± 0.4abc4.7 ± 0.1ab4.2 ± 0.4c4.8 ± 0.2a4.8 ± 0.1a6.11<0.001
Fungi3.9 ± 0.63.7 ± 0.53.7 ± 0.43.9 ± 0.64.1 ± 0.23.9± 0.54.2 ± 0.14.3 ± 0.1n.sn.s
F/B ratio0.2 ± 0.000.16 ± 0.020.17 ± 0.010.17 ± 0.020.17 ± 0.010.19 ± 0.020.17 ± 0.010.18 ± 0.00n.sn.s
8 weeksF7, 39P
Total amount33.4 ± 0.8d33.7 ± 0.8d30.6 ± 0.5e34.0 ± 0.3d35.4 ± 0.8c36.3 ± 0.7bc36.8 ± 0.4b38.1 ± 0.4a83.90<0.001
Gram+7.9 ± 0.1c7.6 ± 0.22d7.2 ± 0.2e8.2 ± 0.2bc8.3 ± 0.2b8.8 ± 0.1a8.3 ± 0.1b8.7 ± 0.0a83.00<0.001
Gram−3.3 ± 0.1d3.3 ± 0.0d3.1 ± 0.0e3.5 ± 0.0c3.70 ± 0.1b3.7 ± 0.1b3.6 ± 0.0c4.0 ± 0.1a178.90<0.001
Bacteria5.9 ± 0.1c5.5 ± 0.1d5.1 ± 0.1e5.6 ± 0.1d6.3 ± 0.1b6.0 ± 0.1c6.3 ± 0.1 b6.9 ± 0.1a190.20<0.001
Actinobacteria4.2 ± 0.1e4.3 ± 0.1de3.8 ± 0.1f4.3 ± 0.1e4.5 ± 0.0b4.5 ± 0.1bc4.4 ± 0.1 cd4.8 ± 0.1a132.20<0.001
Fungi3.6 ± 0.1d3.8 ± 0.1c3.1 ± 0.1e3.8 ± 0.1c4.02 ± 0.1b4.1 ± 0.1b5.0 ± 0.1a4.2 ± 0.1b227.66<0.001
F/B ratio0.17 ± 0.01e0.18 ± 0.00b0.16 ± 0.00e0.18 ± 0.00cd0.18 ± 0.00bcd0.18 ± 0.00bc0.22 ± 0.01a0.17 ± 0.00de120.83<0.001
Table 2. Pearson correlation coefficients for phospholipid fatty acids with the first and second root in the discriminant function analyses at 4 and 8 weeks after nematode inoculation. Control—no nematodes inoculated, bacterial feeders—BF (Acrobeloides buetschlii), fungal feeders—FF (Aphelenchoides saprophilus), plant feeders—PF (Pratylenchus penetrans). *, **, and *** with p < 0.05, 0.01, and 0.001. (Table from Maboreke [35], modified).
4 weeks8 weeks
Root 1Root 2Root 1Root 2
i15:0 (G+)−0.540 ***−0.806 ***0.865 ***0.014
a15:0 (G+)−0.519 ***−0.804 ***0.779 ***0.189
i16:0 (G+)−0.607 ***−0.2750.756 ***−0.120
i17:0 (G+)−0.407 **−0.343 *0.643 ***−0.165
a17:0 (G+)−0.462 **−0.2820.902 ***0.187
cy17:0 (G−)−0.935 ***−0.1760.902 ***0.163
cy19:0 (G−)−0.736 ***−0.0920.806 ***−0.066
16:1 ω7c (B)−0.430 **−0.4420.914 ***0.237
16:1 ω5c (B)−0.238−0.5310.871 ***−0.141
18:1 ω9t (B)−0.454 **−0.1550.793 ***−0.271
16:0 10-meth (A)−0.589 ***−0.308 *0.874 ***−0.042
18:0 10-meth (A)−0.590 ***0.0970.805 ***0.033
18:2 ω6,9c (F)−0.2240.1830.486 **−0.822 ***
18:1 ω9c (F)−0.4186 **0.0720.864 ***−0.371 *
14:0−0.225−0.408 **0.3890.240
15:00.145−0.561 ***0.3490.355*
16:0−0.645 ***−0.416 **0.364−0.457 **
18:0−0.496 **0.1170.000−0.334 *
G+—Gram-positive bacteria, G−—Gram-negative bacteria, A—actinobacteria, B—bacteria in general, F—fungi.
Table 3. Effects of inoculation of nematode trophic groups on root length (cm ± s.d.) root and shoot weight (g DW ± s.d.), and root/shoot ratio (±s.d.) of Quercus robur at 4 and 8 weeks after nematode inoculation. Control—no nematodes inoculated, bacterial feeders—BF (Acrobeloides buetschlii), fungal feeders—FF (Aphelenchoides saprophilus), plant feeders—PF (Pratylenchus penetrans). Values within a row with at least one letter in common are not significantly different (Tukey HSD, p < 0.05). (Table from Maboreke [35], modified).
ControlBFFFPFBF + FFBF + PFFF + PFBF + FF + PF
4 weeks
Root length (cm)38.8 ± 8.142.8 ± 21.537.5 ± 13.837.5 ± 10.137.2 ± 15.038.3 ± 13.735.7 ± 11.645.7 ± 10.6
Root biomass (g)3.8 ± 0.73.1 ± 1.43.2 ± 0.73.2 ± 0.73.2 ± 0.73.2 ± 0.93.8 ± 1.13.9 ± 0.9
Shoot biomass (g)2.6 ± 0.62.4 ± 0.52.7 ± 0.32.6 ± 0.32.9 ± 0.72.5 ± 0.82.6 ± 0.32.7 ± 0.6
root/shoot ratio1.5 ± 0.41.3 ± 0.61.2 ± 0.31.3 ± 0.41.2 ± 0.41.3 ± 0.21.5 ± 0.41.5 ± 0.5
8 weeks
Root length (cm)39.0 ± 10.230.3 ± 10.035.3 ± 13.741.7 ± 9.446.5 ± 5.835.5 ± 12.935.0 ± 11.543.8 ± 9.4
Root biomass (g)6.7 ± 0.75.8 ± 1.35.5 ± 0.94.7 ± 1.16.3 ± 2.15.8 ± 0.74.8 ± 0.66.8 ± 2.7
Shoot biomass (g)3.0 ± 0.83.2 ± 0.63.2 ± 0.43.0 ± 0.53.1 ± 0.73.0 ± 0.63.2 ± 0.52.9 ± 0.5
root/shoot ratio2.4 ± 0.2ab1.9 ± 0.1c1.8 ± 0.3cd1.5 ± 0.1d2.1 ± 0.1bc2.0 ± 0.2c1.5 ± 0.1d2.4 ± 0.1a

