Biochemical Characterization of the Tetrachlorobenzoquinone Reductase Involved in the Biodegradation of Pentachlorophenol

Abstract
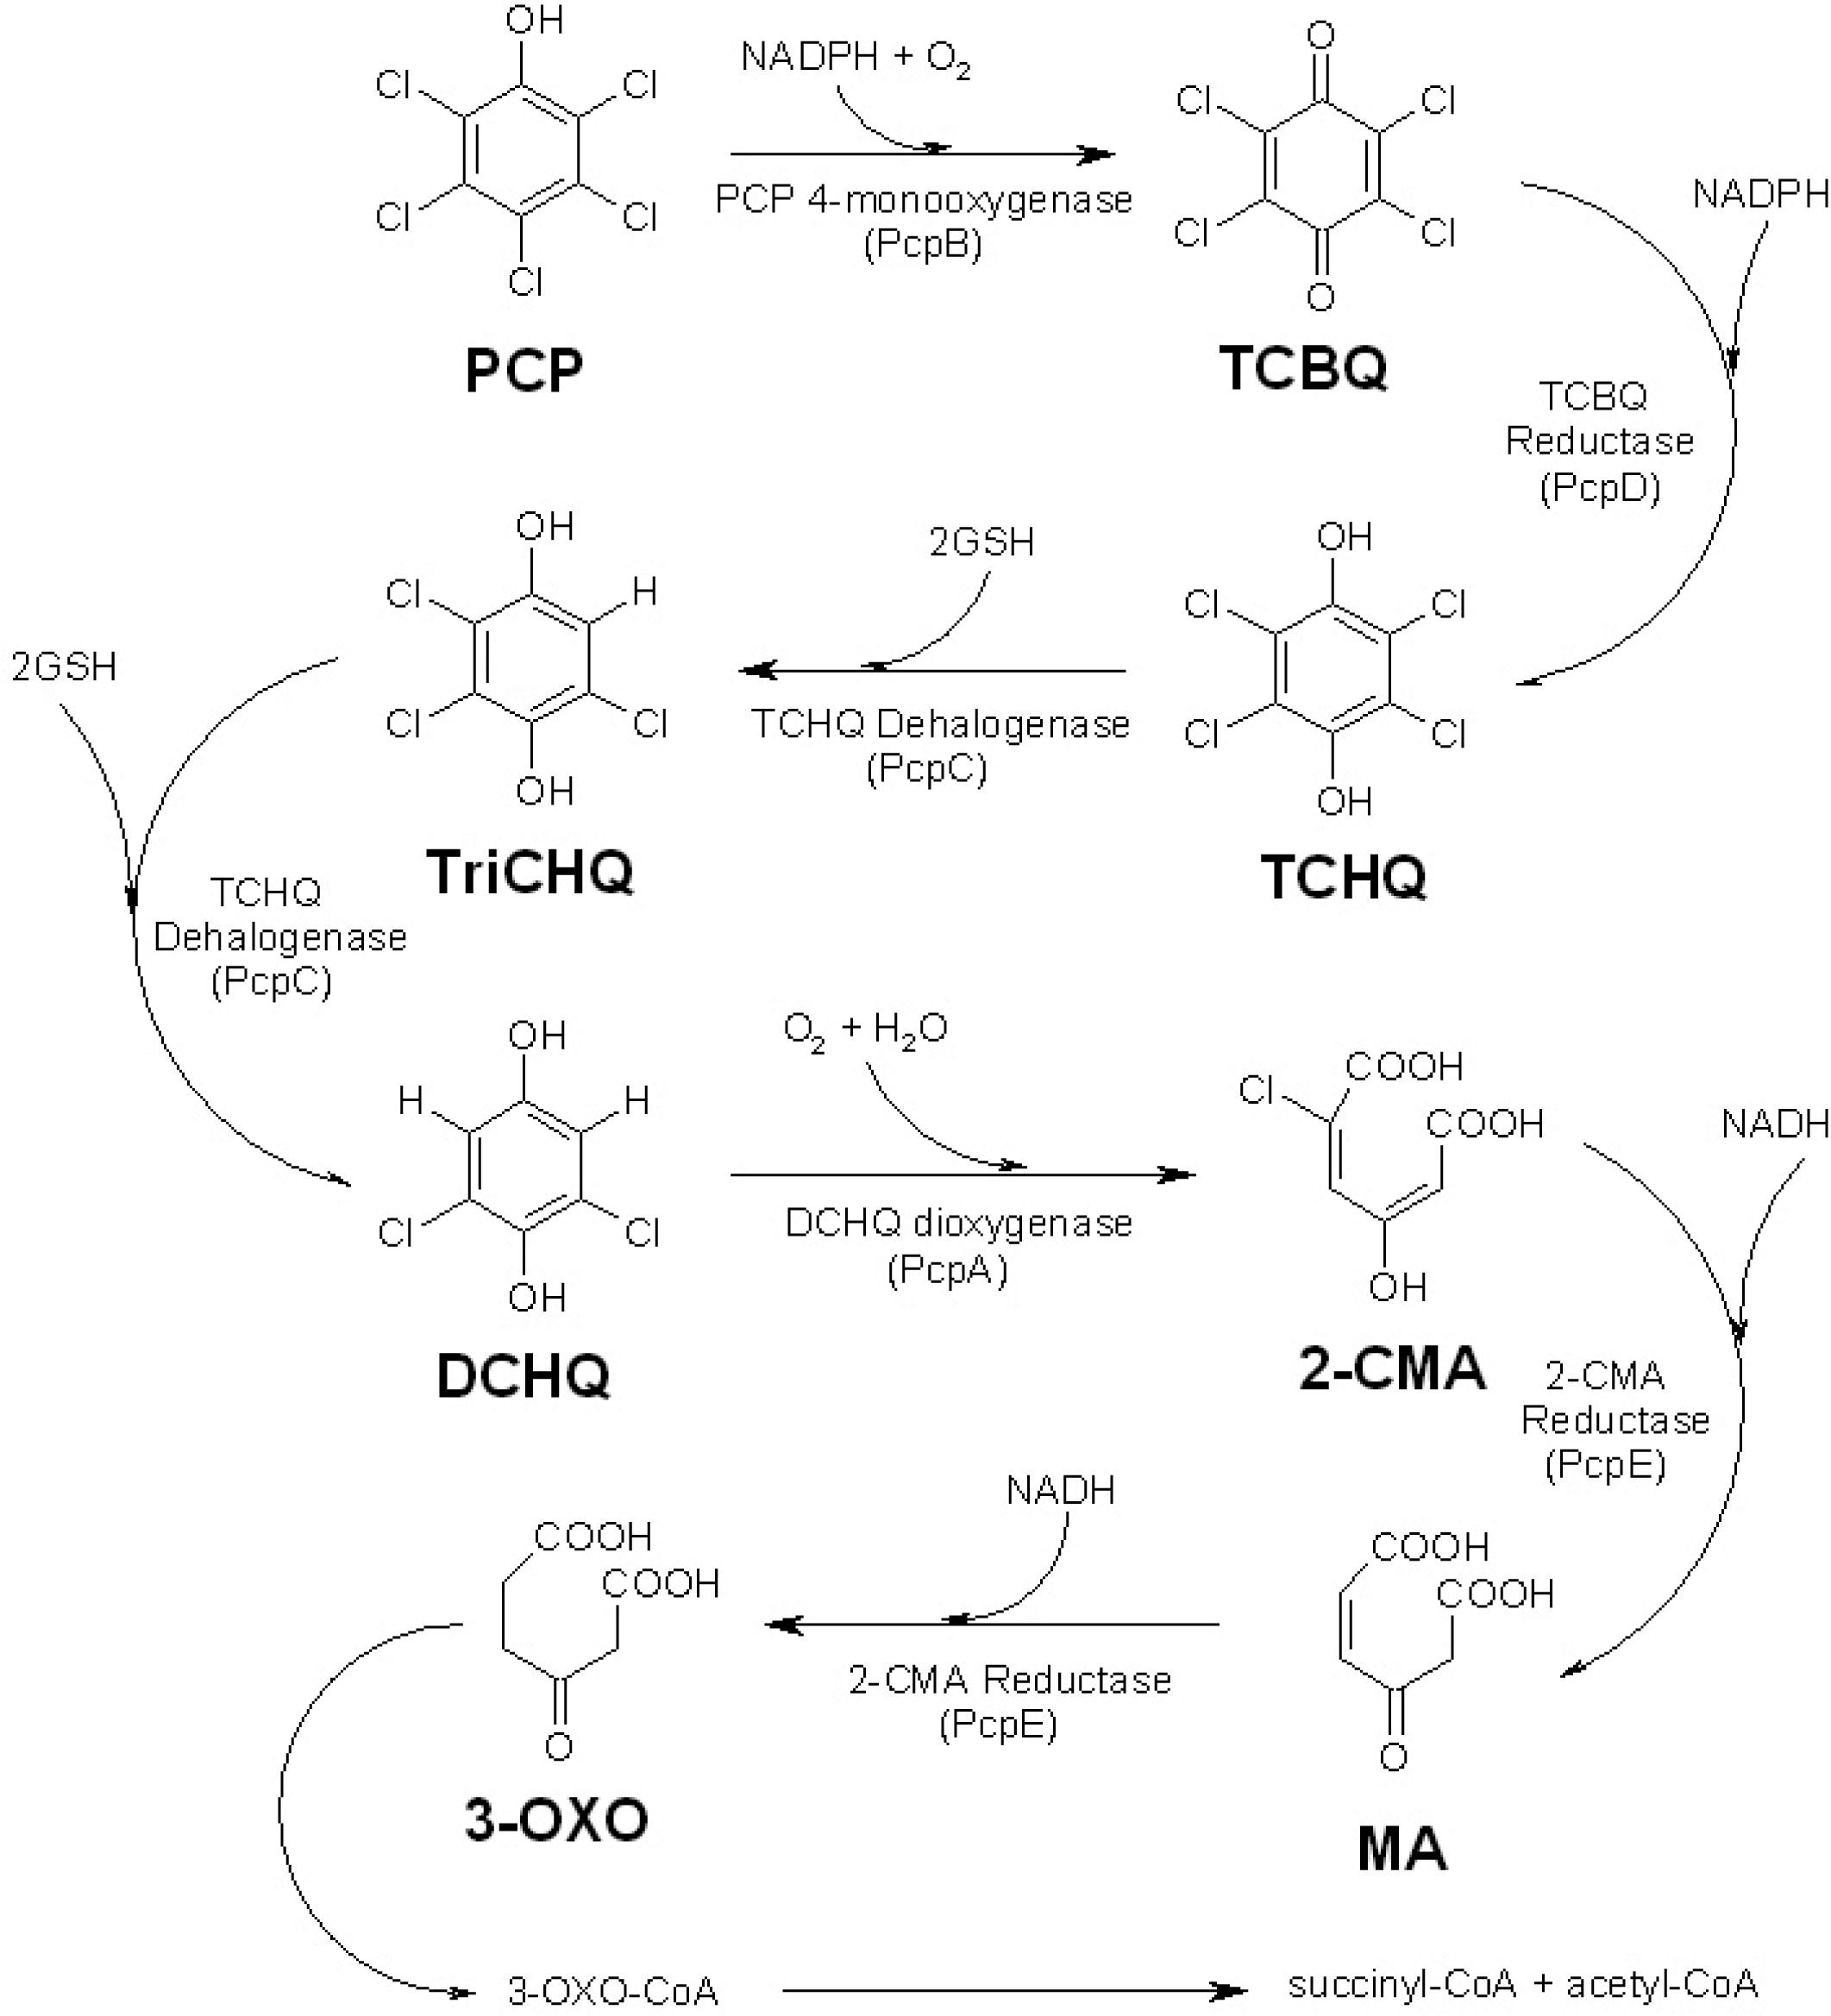
:1. Introduction
2. Results and Discussion
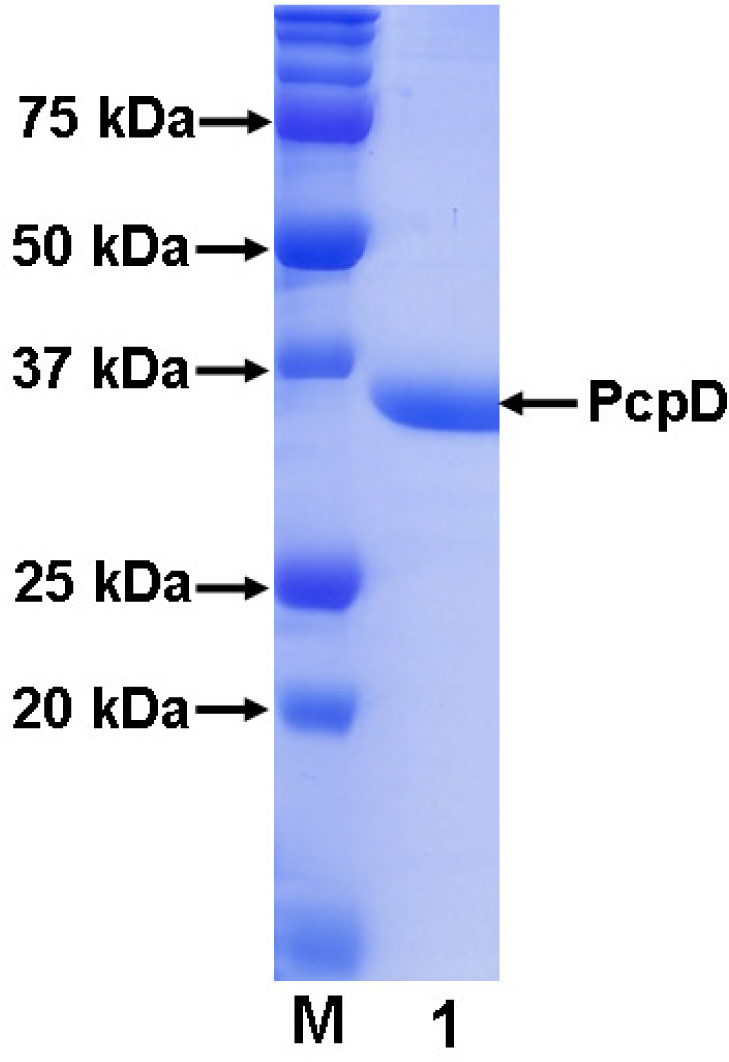
2.1 Cloning, expression and purification
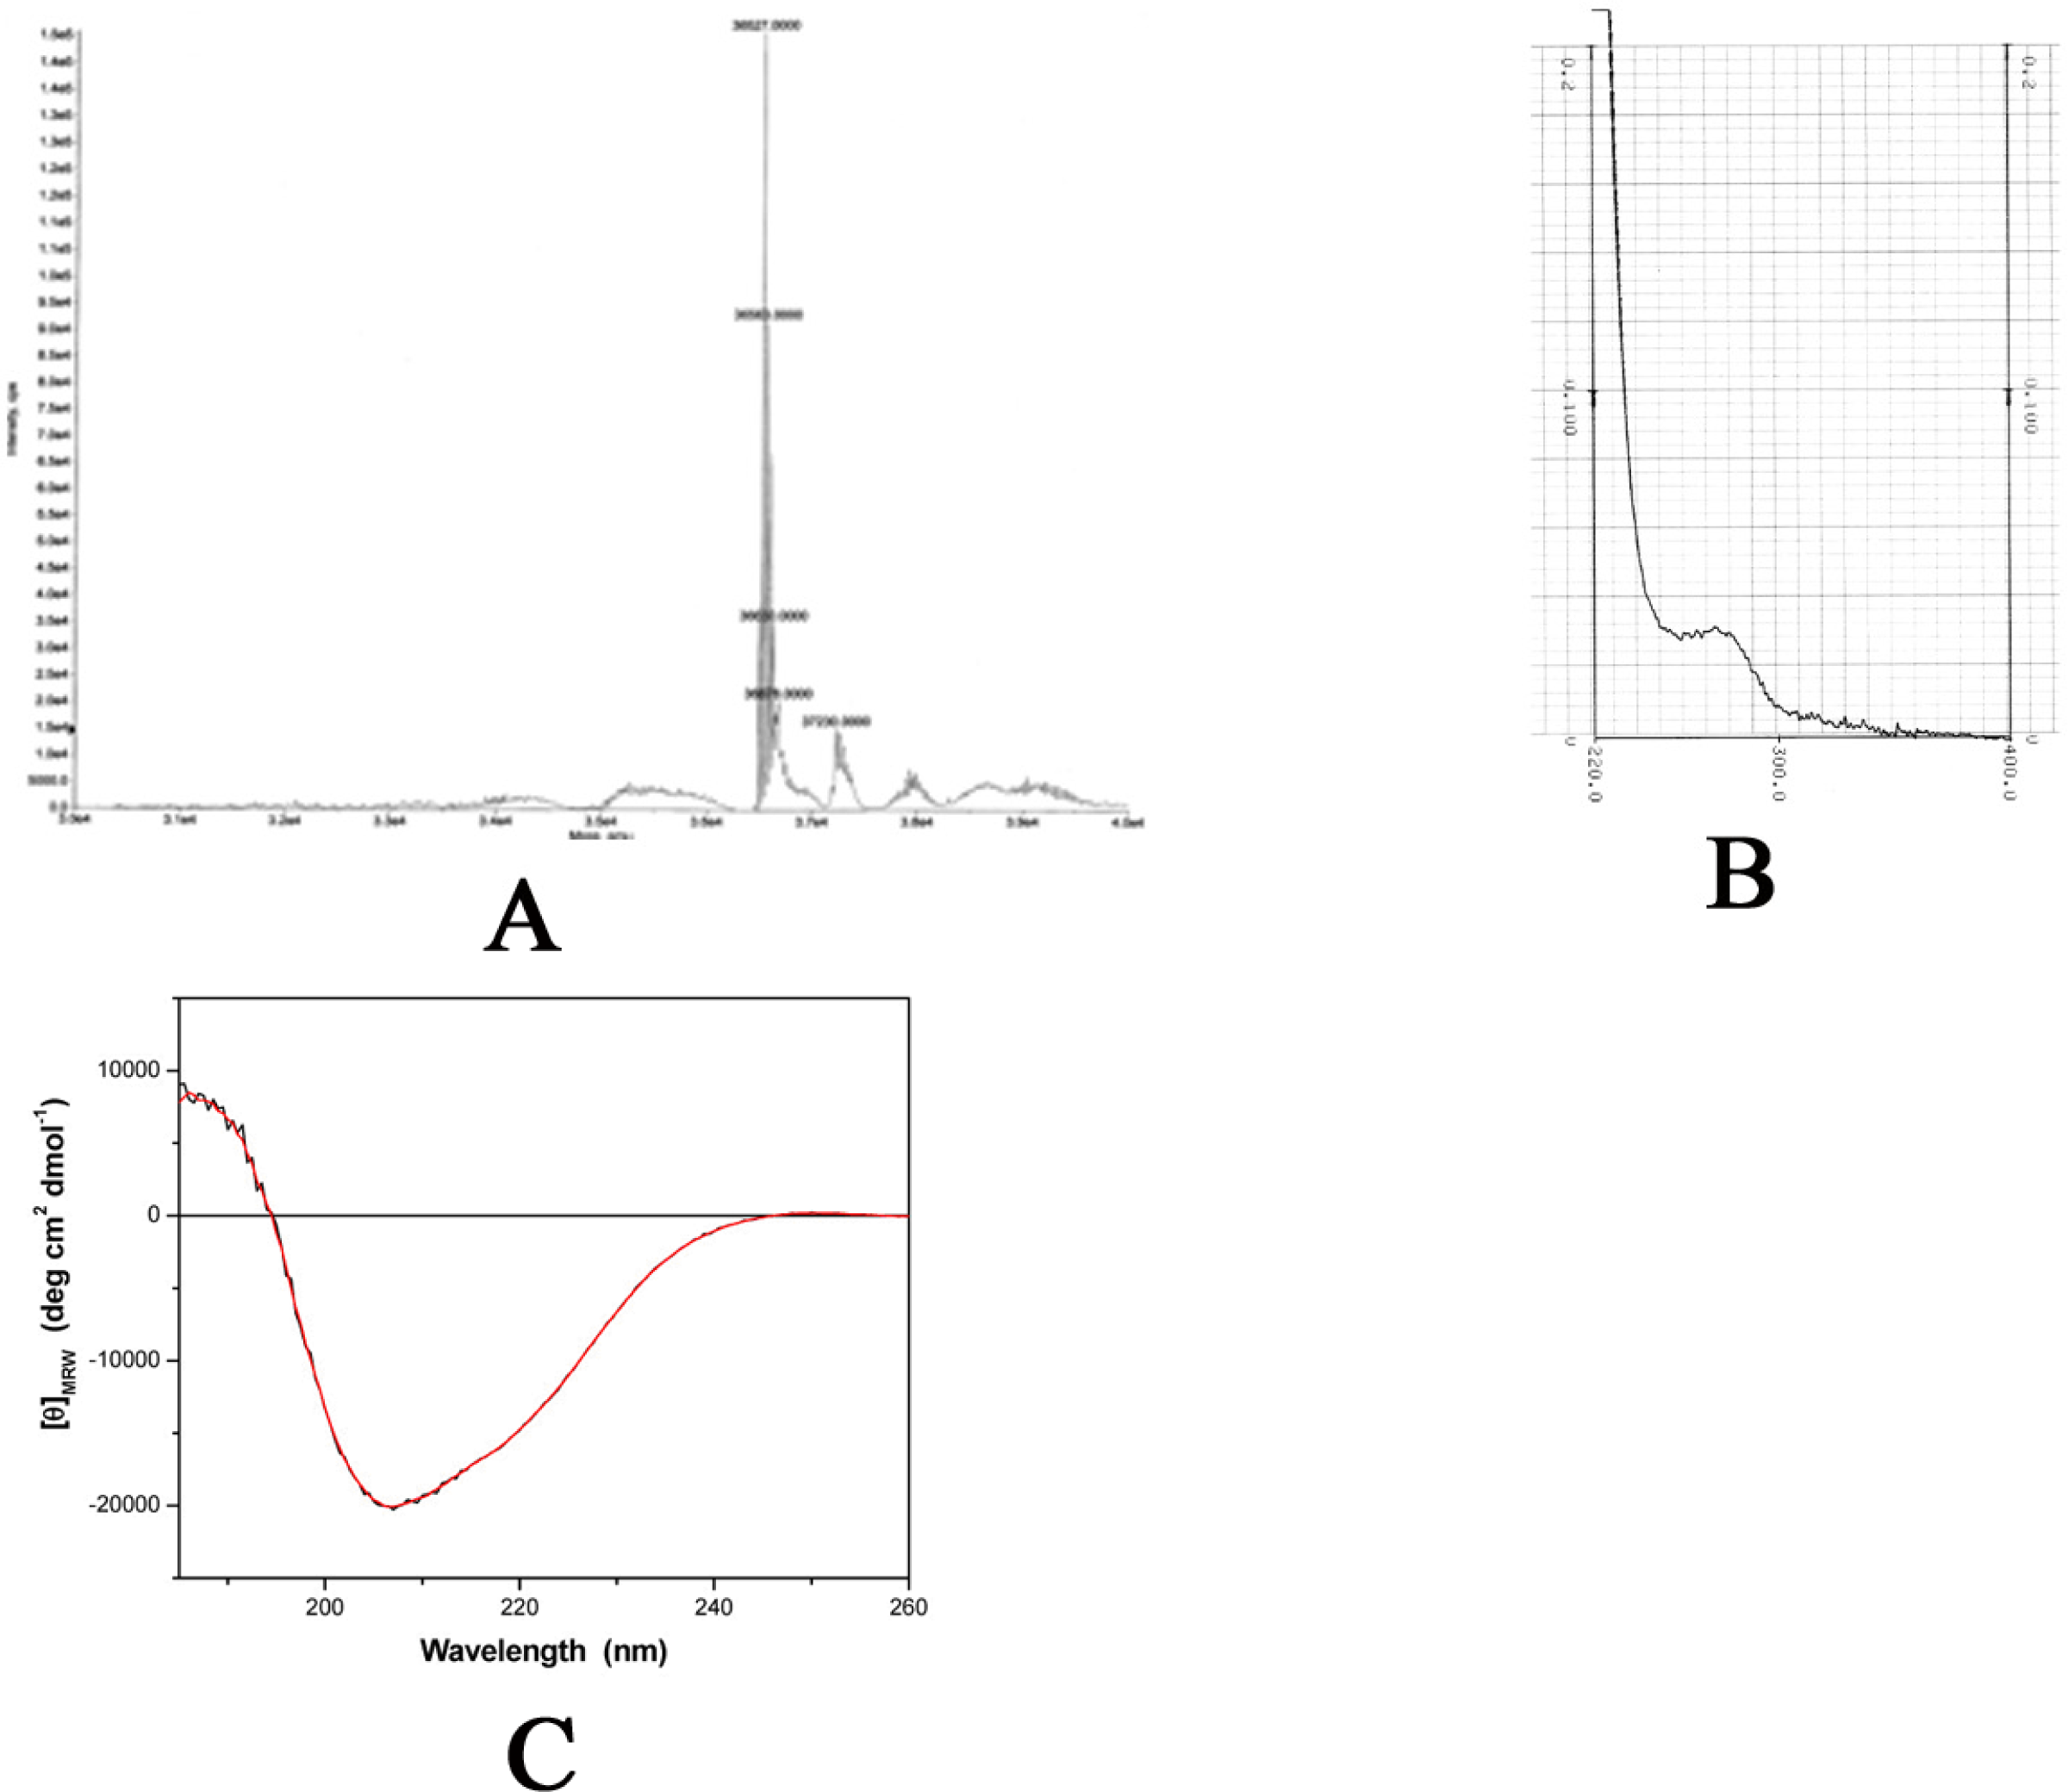
2.2 Physical properties
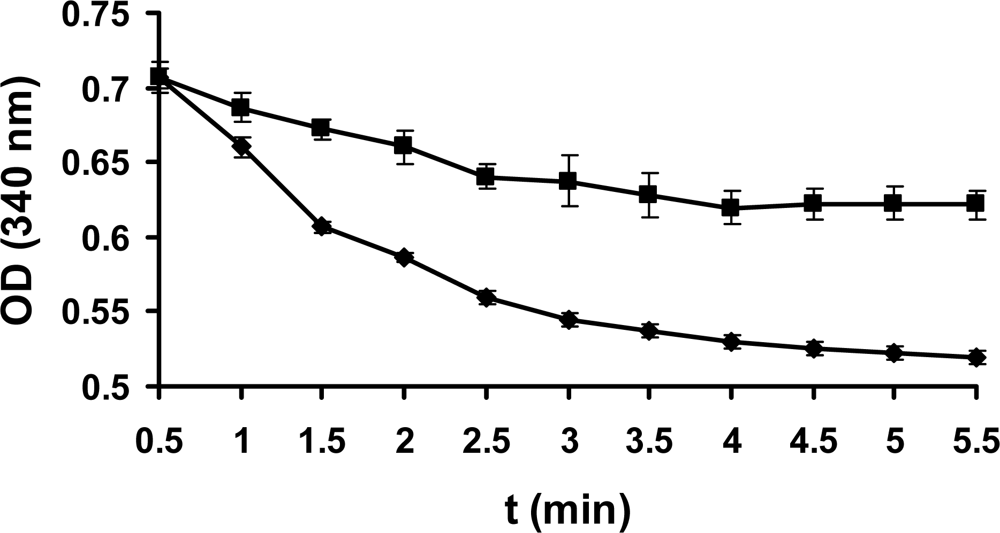
2.3 Enzyme assay
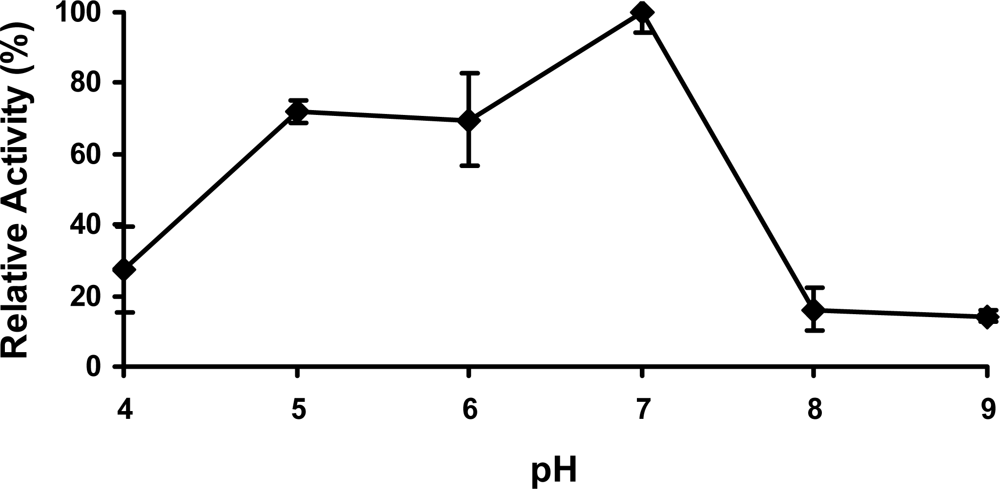
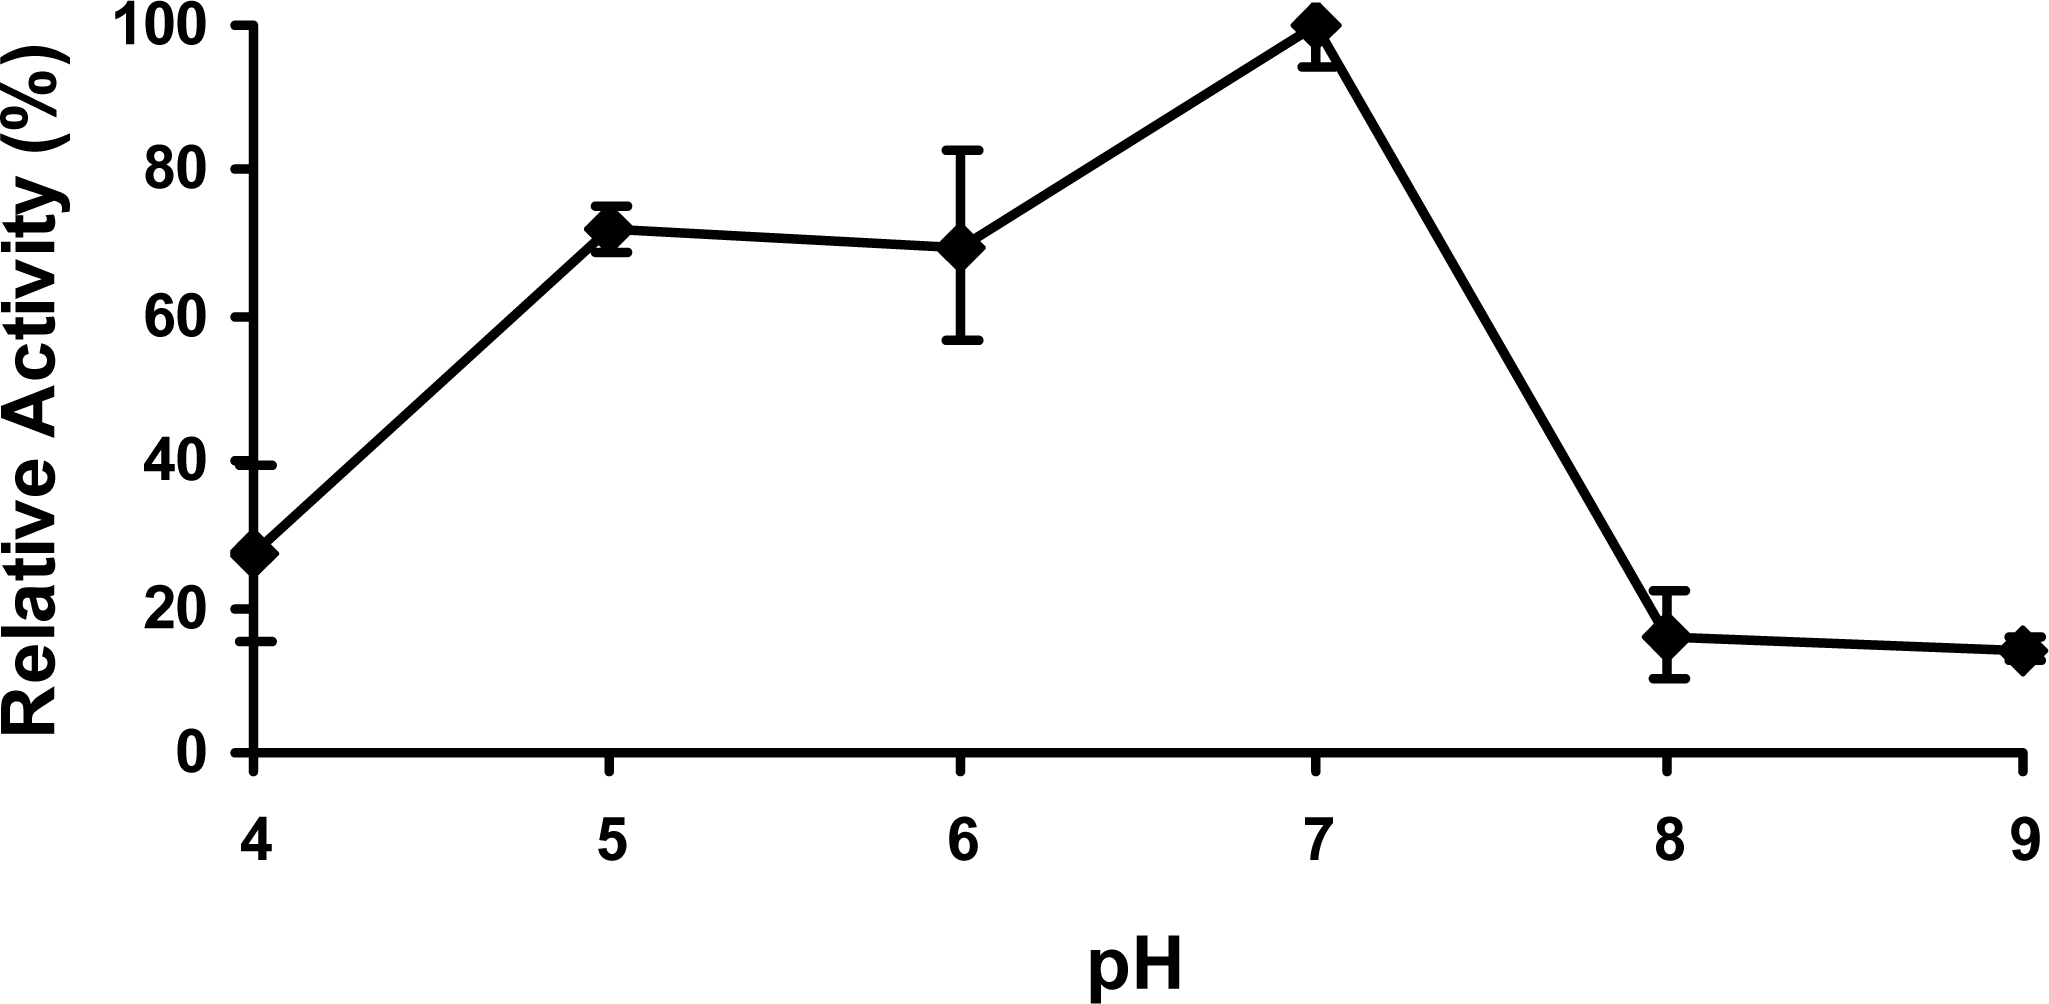
2.4 Effect of pH
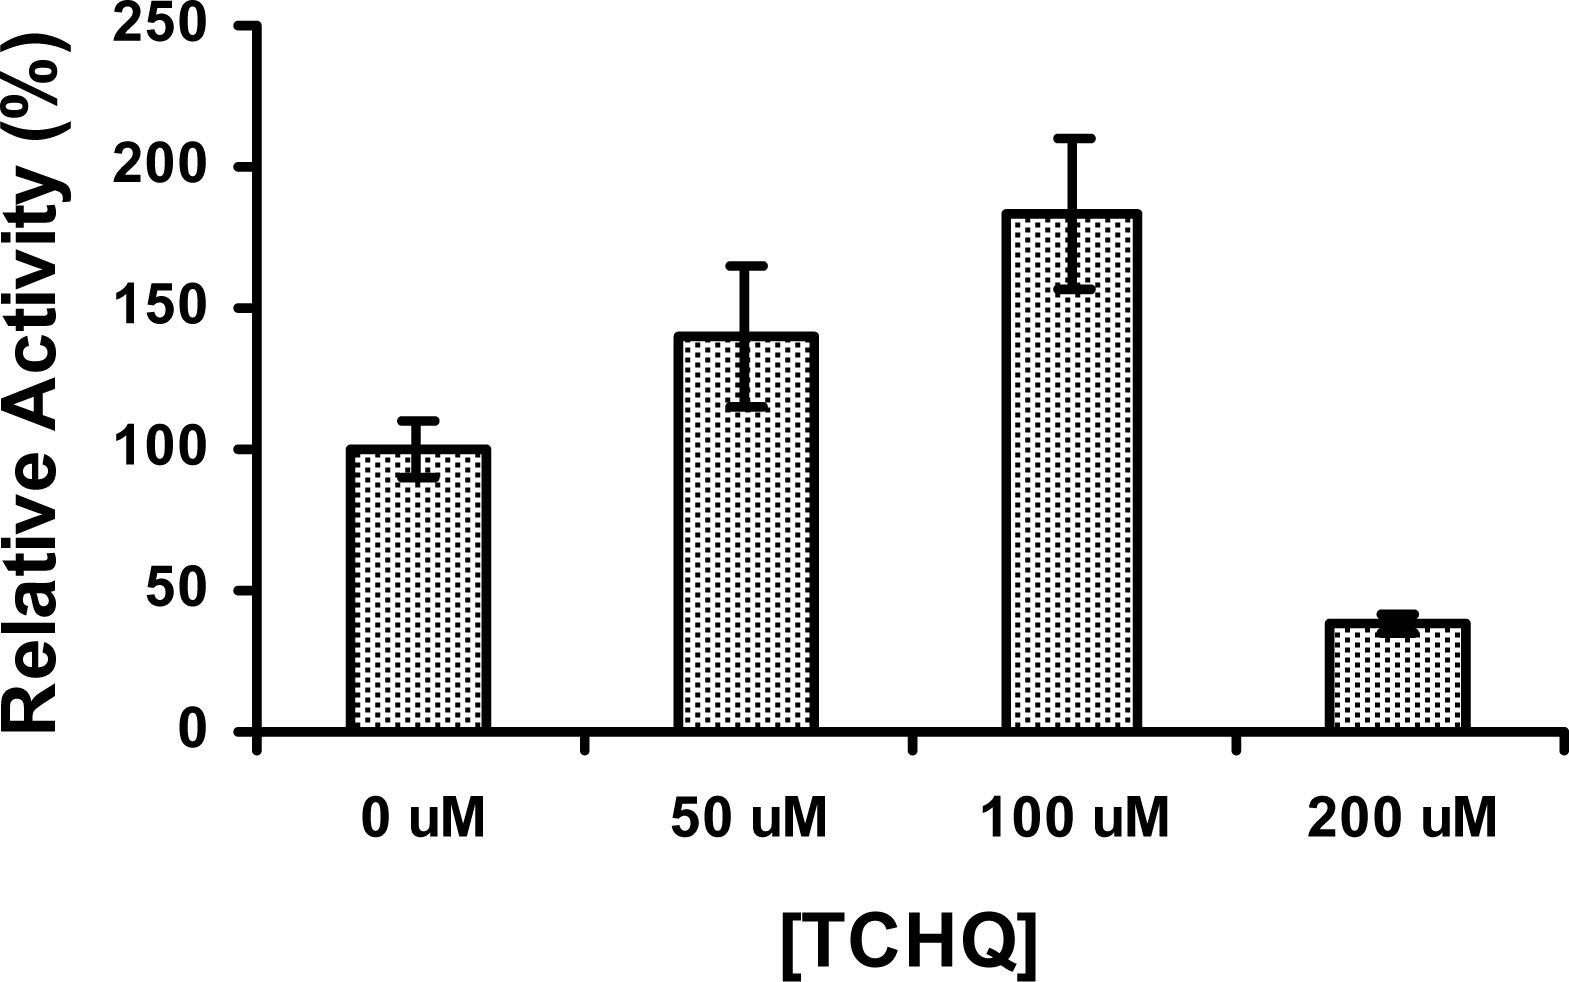
2.5 The activity of PcpD was stimulated by TCHQ at low concentrations
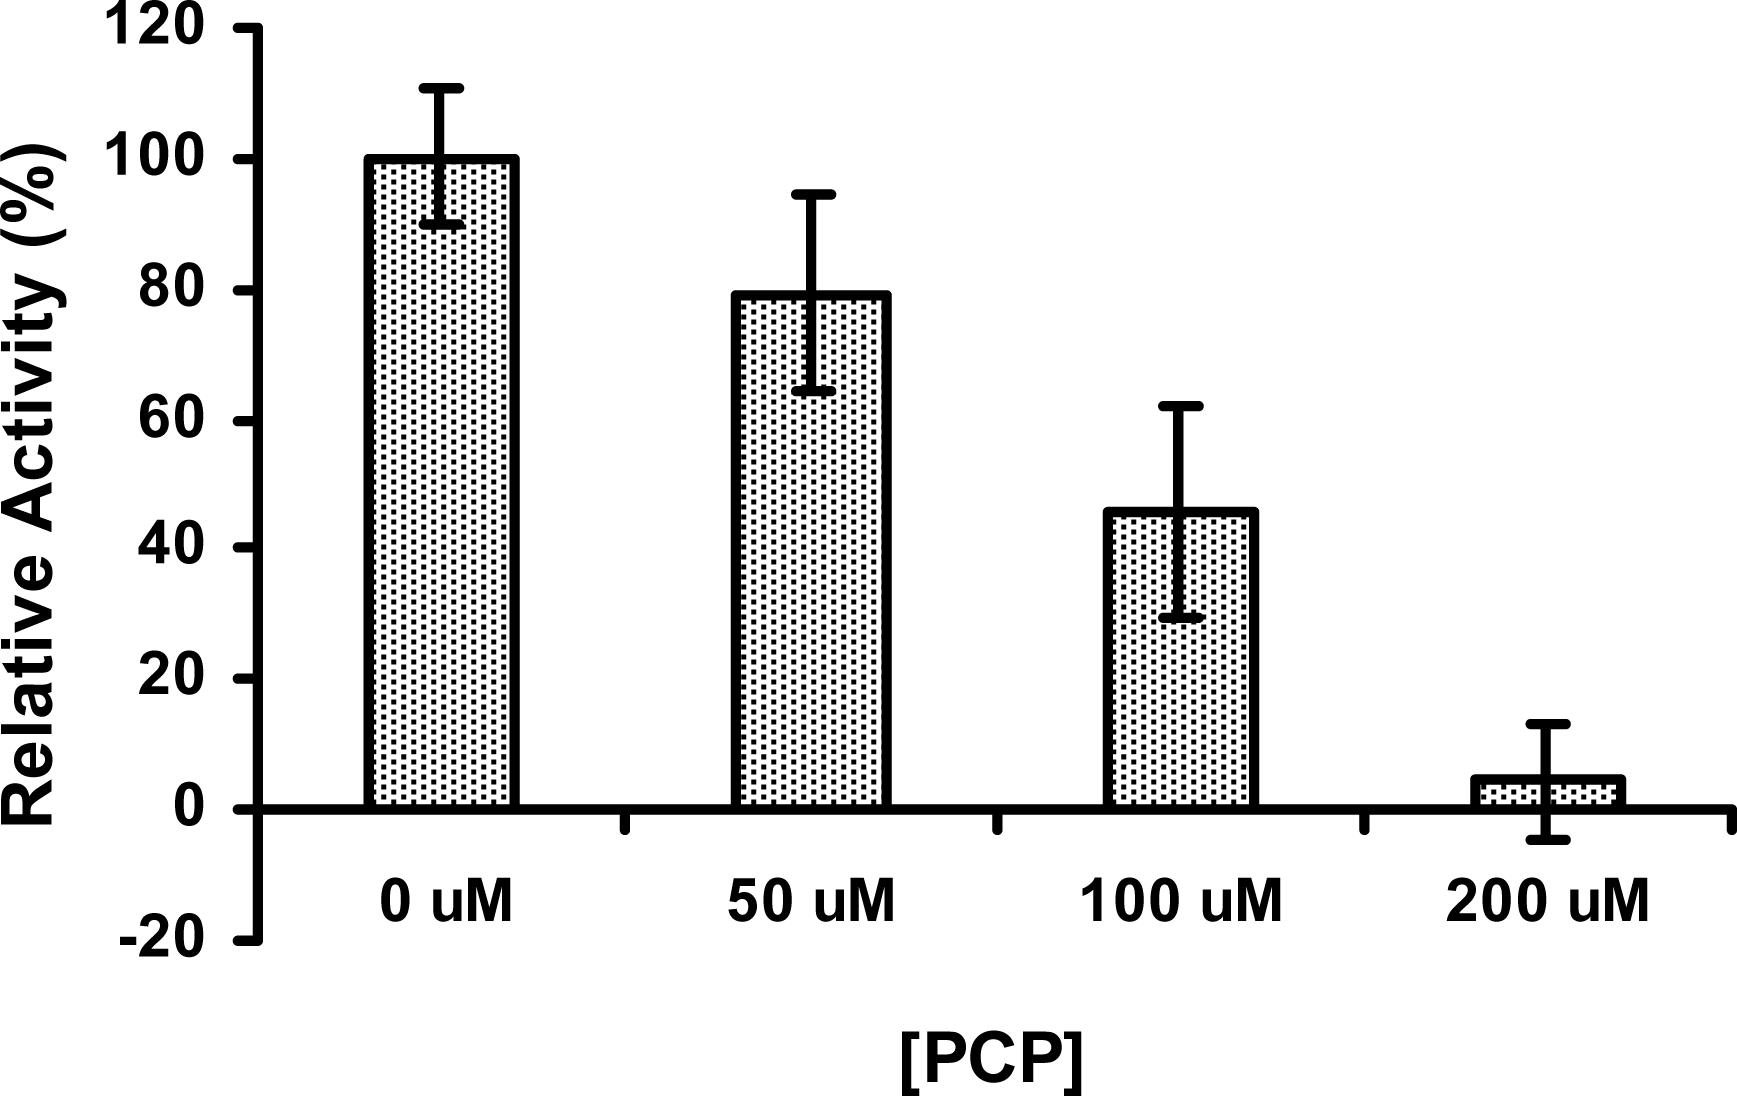
2.6 The activity of PcpD was inhibited by PCP
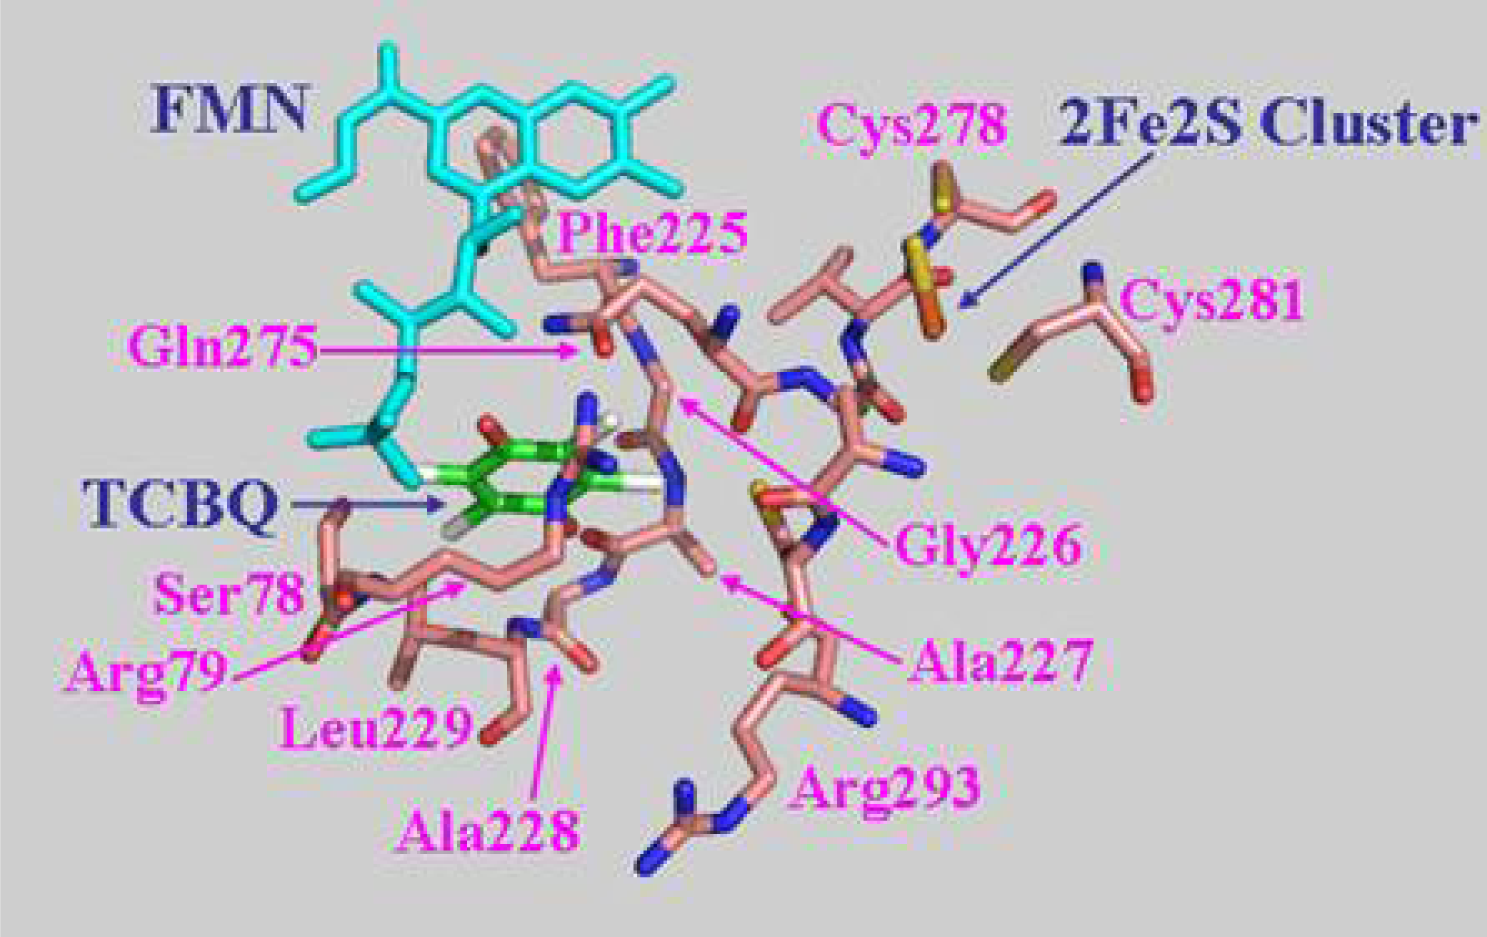
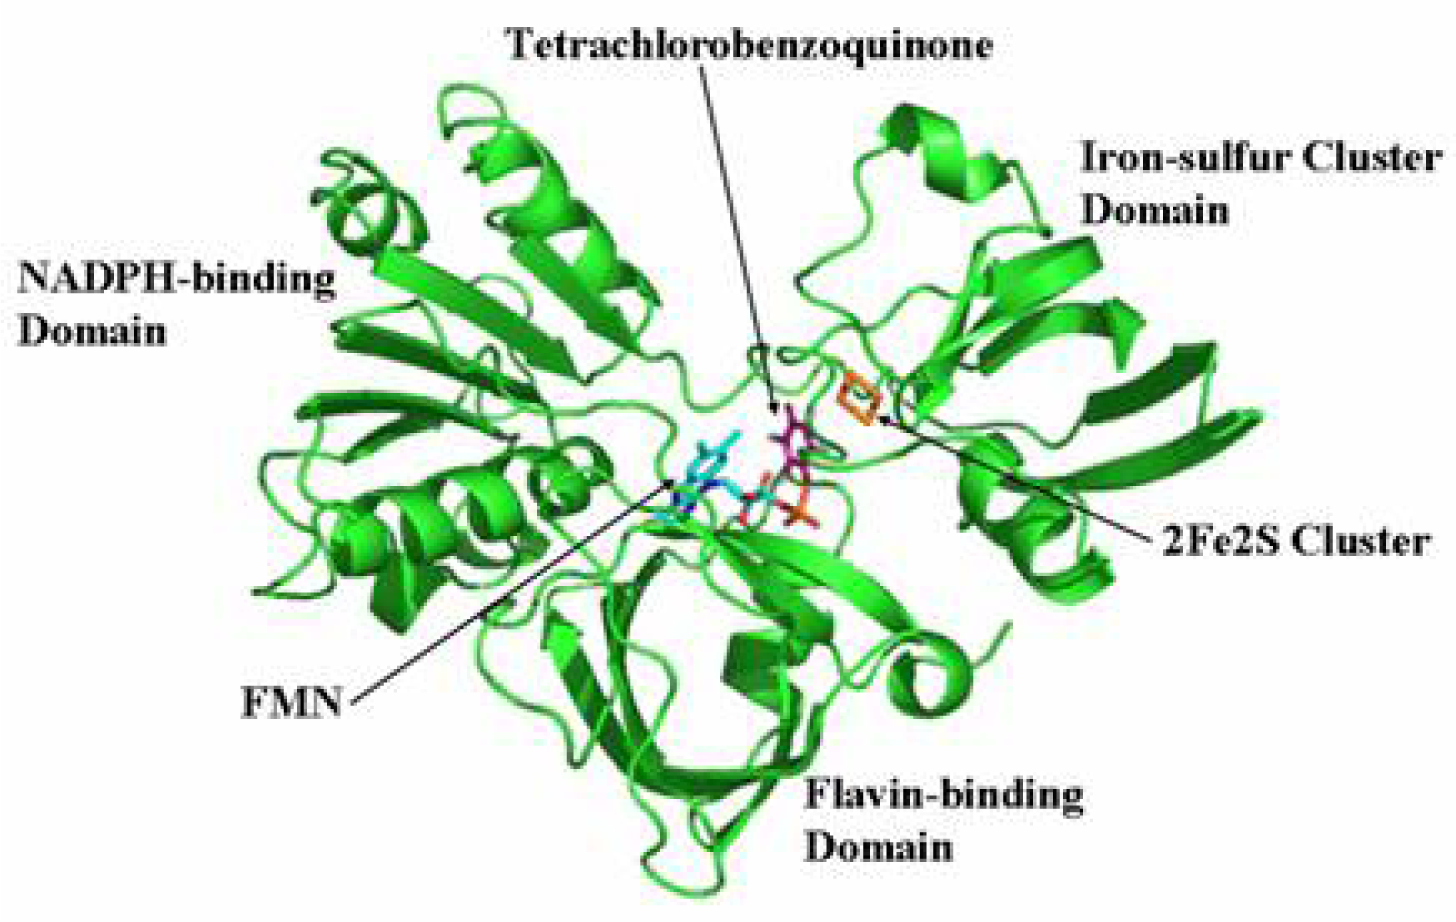
2.7 Structural model of PcpD and putative TCBQ binding pocket
3. Experimental Section
3.1 Bacterial strains, expression vector and culture conditions
3.2 Cloning and expression of gene pcpD
3.3 Purification of His-tagged recombinant PcpD
3.4 Mass spectrometry
3.5 Dynamic light scattering (DLS)
3.6 UV absorption
3.7 Circular dichroism (CD)
3.8 Enzyme assay
3.9 Effect of pH
3.10 Effects of TCHQ and PCP
3.11 Structural model of PcpD and docking of TCBQ
4. Conclusion
Acknowledgments
References
- Frank, R; Braun, HE; Ripley, BD; Clegg, BS. Contamination of rural ponds with pesticides, 1971–85, Ontario, Canada. Bull. Environ. Contam. Toxicol. 1990, 44, 401–409. [Google Scholar]
- McAllister, KA; Lee, H; Trevors, JT. Microbial degradation of pentachlorophenol. Biodegradation 1996, 7, 1–40. [Google Scholar]
- Ingram, LL; Tarlton, K. Effect of physical properties of pentachlorophenol and creosote components on vaporization from treated wood: Review of prior data. Forest Prod. J. 2005, 55, 86–89. [Google Scholar]
- Thompson, TS; Treble, RG; Mariasegaram, M. Determination of atmospheric contamination by pentachlorophenol using pine needles located near treated utility pole storage sites. Bull. Environ. Contam. Toxicol. 1997, 59, 548–555. [Google Scholar]
- Sai, K; Kang, KS; Hirose, A; Hasegawa, R; Trosko, JE; Inoue, T. Inhibition of apoptosis by pentachlorophenol in v-myc-transfected rat liver epithelial cells: relation to down-regulation of gap junctional intercellular communication. Cancer Lett. 2001, 173, 163–174. [Google Scholar]
- Khurana, V; Barkin, JS. Pancreatitis induced by environmental toxins. Pancreas 2001, 22, 102–105. [Google Scholar]
- Daniel, V; Huber, W; Bauer, K; Suesal, C; Mytilineos, J; Melk, A; Conradt, C; Opelz, G. Association of elevated blood levels of pentachlorophenol (PCP) with cellular and humoral immunodeficiencies. Arch. Environ. Health 2001, 56, 77–83. [Google Scholar]
- Peper, M; Ertl, M; Gerhard, I. Long-term exposure to wood-preserving chemicals containing pentachlorophenol and lindane is related to neurobehavioral performance in women. Am. J. Ind. Med. 1999, 35, 632–641. [Google Scholar]
- D'Angelo, EM; Reddy, KR. Aerobic and anaerobic transformations of pentachlorophenol in wetland soils. Soil Sci. Soc. Am. J. 2000, 64, 933–943. [Google Scholar]
- Seidler, JR; Landau, M; Dierberg, FE; Pierce, RH. Persistence of pentachlorophenol in a wastewater-estuarine aquaculture system. Bull. Environ. Contam. Toxicol. 1986, 36, 101–108. [Google Scholar]
- Tisch, M; Faulde, MK; Maier, H. Genotoxic effects of pentachlorophenol, lindane, transfluthrin, cyfluthrin, and natural pyrethrum on human mucosal cells of the inferior and middle nasal conchae. Am. J. Rhinol. 2005, 19, 141–151. [Google Scholar]
- Villela, IV; de Oliveira, IM; da Silva, J; Henriques, JA. DNA damage and repair in haemolymph cells of golden mussel (Limnoperna fortunei) exposed to environmental contaminants. Mutat. Res. 2006, 605, 78–86. [Google Scholar]
- Xun, L; Topp, E; Orser, CS. Diverse substrate range of a Flavobacterium pentachlorophenol hydroxylase and reaction stoichiometries. J. Bacteriol. 1992, 174, 2898–2902. [Google Scholar]
- Xun, L; Orser, CS. Purification and properties of pentachlorophenol hydroxylase, a flavoprotein from Flavobacterium sp. strain ATCC 39723. J. Bacteriol. 1991, 173, 4447–4453. [Google Scholar]
- Xun, L; Topp, E; Orser, CS. Purification and characterization of a tetrachloro-p-hydroquinone reductive dehalogenase from a Flavobacterium sp. J. Bacteriol. 1992, 174, 8003–8007. [Google Scholar]
- Miyauchi, K; Adachi, Y; Nagata, Y; Takagi, M. Cloning and sequencing of a novel meta-cleavage dioxygenase gene whose product is involved in degradation of γ-hexachlorocyclohexane in Sphingomonas paucimobilis. J. Bacteriol. 1999, 181, 6712–6719. [Google Scholar]
- McCarthy, DL; Claude, AA; Copley, SD. In vivo levels of chlorinated hydroquinones in a pentachlorophenol-degrading bacterium. Appl. Environ. Microbiol. 1997, 63, 1883–1888. [Google Scholar]
- Copley, SD. Evolution of a metabolic pathway for degradation of a toxic xenobiotic: the patchwork approach. Trends Biochem. Sci. 2000, 25, 261–265. [Google Scholar]
- Dai, M; Rogers, JB; Warner, JR; Copley, SD. A previously unrecognized step in pentachlorophenol degradation in Sphingobium chlorophenolicum is catalyzed by tetrachlorobenzoquinone reductase (PcpD). J. Bacteriol. 2003, 185, 302–310. [Google Scholar]
- Cai, M; Xun, L. Organization and regulation of pentachlorophenol-degrading genes in Sphingobium chlorophenolicum ATCC 39723. J. Bacteriol. 2002, 184, 4672:4680. [Google Scholar]
- Maupin-Furlow, J; Ferry, JG. Characterization of the cdhD and cdhE genes encoding subunits of the corrinoid/iron-sulfur enzyme of the CO dehydrogenase complex from Methanosarcina thermophila. J. Bacteriol. 1996, 178, 340–346. [Google Scholar]
- Ventura, S; Villaverde, A. Protein quality in bacterial inclusion bodies. Trends Biotechnol. 2006, 24, 179–185. [Google Scholar]
- Crawford, RL. Biodegradation of pentachlorophenol. U.S. Patent No. 4713340. 1987. [Google Scholar]
- Hatakeyama, K; Harada, T; Suzuki, S; Watanabe, Y; Kagamiyama, H. Purification and characterization of rat liver GTP cyclohydrolase I. Cooperative binding of GTP to the enzyme. J. Biol. Chem. 1989, 264, 21660–21664. [Google Scholar]
- Kiefer, PM, Jr; Copley, SD. Characterization of the initial steps in the reductive dehalogenation catalyzed by tetrachlorohydroquinone dehalogenase. Biochemistry 2002, 41, 1315–1322. [Google Scholar]
- Kiefer, PM, Jr; McCarthy, DL; Copley, SD. The reaction catalyzed by tetrachlorohydroquinone dehalogenase does not involve nucleophilic aromatic substitution. Biochemistry 2002, 41, 1308–1314. [Google Scholar]
- Warner, JR; Lawson, SL; Copley, SD. A mechanistic investigation of the thiol-disulfide exchange step in the reductive dehalogenation catalyzed by tetrachlorohydroquinone dehalogenase. Biochemistry 2005, 44, 10360–10368. [Google Scholar]
- Xun, L; Topp, E; Orser, CS. Confirmation of oxidative dehalogenation of pentachlorophenol by a Flavobacterium pentachlorophenol hydroxylase. J. Bacteriol. 1992, 174, 5745–5747. [Google Scholar]
- Topp, E; Xun, L; Orser, CS. Biodegradation of the herbicide bromoxynil (3,5-dibromo-4-hydroxybenzonitrile) by purified pentachlorophenol hydroxylase and whole cells of Flavobacterium sp. strain ATCC 39723 is accompanied by cyanogenesis. Appl. Environ. Microbiol. 1992, 58, 502–506. [Google Scholar]
- Correll, CC; Batie, CJ; Ballou, DP; Ludwig, ML. Phthalate dioxygenase reductase: a modular structure for electron transfer from pyridine nucleotides to [2Fe-2S]. Science 1992, 258, 1604–1610. [Google Scholar]
- Morris, GM; Goodsell, DS; Halliday, RS; Huey, R; Hart, WE; Belew, RK; Olson, AJ. Automated docking using a lamarckian genetic algorithm and empirical binding free energy function. J. Computational Chemistry 1998, 19, 1639–1662. [Google Scholar]
- Böhm, G; Muhr, R; Jaenicke, R. Quantitative analysis of protein far UV circular dichroism spectra by neural networks. Protein Eng. 1992, 5, 191–195. [Google Scholar]
- Thompson, JD; Higgins, DG; Gibson, TJ. CLUSTAL W: improving the sensitivity of progressive multiple sequence alignment through sequence weighting, position-specific gap penalties and weight matrix choice. Nucleic Acids Res. 1994, 22, 4673–4680. [Google Scholar]
- Marti-Renom, MA; Stuart, A; Fiser, A; Sánchez, R; Melo, F; Sali, A. Comparative protein structure modeling of genes and genomes. Annu. Rev. Biophys. Biomol. Struct. 2000, 29, 291–325. [Google Scholar]
- Laskowski, RA; McArthur, MW; Moss, DS; Thornton, JM. PROCHECK: A program to check the stereochemical quality of protein structures. J. Appl. Cryst. 1993, 26, 283–291. [Google Scholar]
- Sippl, MJ. Recognition of errors in three-dimensional structures of proteins. Proteins 1993, 17, 355–362. [Google Scholar]
- Luthy, R; Bowie, JU; Eisenberg, D. Assessment of protein models with three-dimensional profiles. Nature 1992, 356, 83–85. [Google Scholar]


Share and Cite
Chen, L.; Yang, J. Biochemical Characterization of the Tetrachlorobenzoquinone Reductase Involved in the Biodegradation of Pentachlorophenol. Int. J. Mol. Sci. 2008, 9, 198-212. https://doi.org/10.3390/ijms9030198
Chen L, Yang J. Biochemical Characterization of the Tetrachlorobenzoquinone Reductase Involved in the Biodegradation of Pentachlorophenol. International Journal of Molecular Sciences. 2008; 9(3):198-212. https://doi.org/10.3390/ijms9030198
Chicago/Turabian StyleChen, Lifeng, and Jian Yang. 2008. "Biochemical Characterization of the Tetrachlorobenzoquinone Reductase Involved in the Biodegradation of Pentachlorophenol" International Journal of Molecular Sciences 9, no. 3: 198-212. https://doi.org/10.3390/ijms9030198