Article

Electron Charge Density Distribution from X-ray Diffraction Study of the M-Nitrophenol Compound in the Monoclinic Form

by
Fodil Hamzaoui
1,*,
Mokhtaria Drissi
1,
Abdelkader Chouaih
1,
Philippe Lagant
2 and
Gérard Vergoten
2
1
Laboratoire SEA2M, Département de Chimie, Université de Mostaganem, 27000 Mostaganem, Algeria.
2
UMR CNRS 8576 Glycobiologie Structurale et Fonctionnelle, Université des Sciences et Technologies, 59655 Villeneuve d’Ascq, France.
*
Author to whom correspondence should be addressed.
Int. J. Mol. Sci. 2007, 8(2), 103-115; https://doi.org/10.3390/i8020103
Submission received: 30 October 2006 / Accepted: 17 January 2007 / Published: 16 February 2007
(This article belongs to the Section Physical Chemistry, Theoretical and Computational Chemistry)

Abstract

:
At room temperature, the m-Nitrophenol (m-NPH) appears in two polymorphic structures: orthorhombic and monoclinic forms. In the present work, we shall focus on the monoclinic form of this compound which has a centrosymmetric structure with the space group P21/n. The molecular dipole moment has been estimated experimentally. High resolution single crystal diffraction experiment was performed at low temperature with MoKα radiation. The crystal structure was refined using the multipolar model of Hansen and Coppens (1978). The molecular electron charge density distribution is described accurately. The study reveals the nature of inter-molecular interactions including charge transfer and hydrogen bonds. In this crystal, hydrogen bonds of moderate strength occur between the hydroxyl group and the O atom in the nitro one.

1. Introduction

It is known that m-Nitrophenol crystallizes into two polymorphic forms (monoclinic P21/n and orthorhombic P212121), with four molecules in the unit cell [13]. The present work focuses on the structural and electronic charge density study of the molecule of the title compound in the monoclinic phase with the space group P21/n. The structure was first described by Panadares et al. (1975) [4].
To achieve our work we have used the XD package software [5], for a non-spherical atom multipole refinement which has been developed by Hansen and Coppens (1978) [6]. One major component of this package is the program for the least square fitting of multipole model to the experimental data [78].
The thermal motion and the structure analysis of the molecule have been performed. The electron density maps have been provided at different sections of the molecule. We also have made available the electron charge distribution around the hydrogen bond and calculated the molecular dipole moment.
Accurate results on the structure and electron charge density distribution of the m-nitrophenol have been exposed in details along this article which highlights the adequacy of the multipolar model and theoretical calculations.

2. Methods

2.1. Spherical X-ray refinement[high order (HO)]

In the atomic center regions where the electron density is less affected by the bonding, the isolated atom model is expected to be a fairly good approximation. The sharp core density has appreciable contribution to reflections at high Bragg angle where the scattering by the more diffuse valence or bond density is negligible. For this latter set of reflections, the X-ray scattering is mainly given by the core electrons contribution. For this reason, a refinement emphasizing the high-order data is expected to yield to atomic parameters less biased by the inadequacy of the spherical-atom model [9]. In order to refine the obtained atomic positions and to determine anisotropic displacement parameters, we have used only high-order reflections with (sinθ/λ)≥ 0.75Å−1 and I / σ (I) ≥ 3. This refinement was carried on F2 with weights calculated as w= 1/ σ 2(I). The H atoms were found by difference Fourier synthesis and their coordinates were adjusted by extending along the C-H and O-H bond directions to bond lengths of 1.105 Å and 1.029Å respectively.
The X-ray scattering factors for C, N and O atoms comes from the international tables for X–ray crystallography [10] while for H atom the bonded H–atom scattering curve of Stewart, Davidson & Simpson (1965) was used [11].

2.2. Charge Density Multipole Model

The Hansen-Coppens multipole formalism [6], as implemented in the XDLSM least squares program for multipole refinement, was used for both observed and theoretical structure factor fitting. It describes the crystal electron density as a superposition of aspherical pseudo-atoms each modelled on a multipole expansion:
ρ k ( r ) = P k , c ρ k , c ( r ) + P k , v κ 3 ρ k , v ( κ , r ) + l = 0 4 κ 3 R k , l ( κ , r ) × m = - + P k , l m ± Y l m ± ( r | r | )
Here ρc and ρv are spherically averaged Hartree-Fock core and valence densities, with ρv normalized to one electron. The Slater type radial functions Rl (r) = Nrn exp(−κξr) modulate the spherical harmonic angular functions Ylm± and N1 is a normalization factor. The values for parameters n = n1 and ς were chosen according to rules provided by Hansen & Coppens (1978) n = 2,2,3,4 and ξ = 2.8,4.0,5.06 (Å−1) for C, O, N were used respectively for l = 1,2,3,4. For the H atoms n = 2 and ξ = 2(Å−1) for 1=1, 2.
The sum over m in Equation (1) includes ± l, so that for each one, 2l +1 functions are included. The adjustable variables are the valence shell contraction-expansion parameters (κ, κ′) and the population parameters (Pv, Plm±.). The aspheric charge density was described at the octupole (l =3) level for all non-hydrogen atoms and at the dipole levels (l = 1 or 2) for hydrogen atoms not involved and involved in strong H-bonds, respectively. The core and valence scattering factors came from International Tables for X-ray Crystallography (1999) [13]. Charge densities of all hydrogen were considered to have cylindrical symmetry along the corresponding hydrogen-heavy atom bond. A molecular electroneutrality constraint was applied in all refinements.
To reduce the number of variables, chemical constraints were imposed on the multipole parameters: atoms of similar environment were assumed to have the same deformation electron density. The different local pseudo-atom coordinate systems of the molecule are defined in Figure 1. The multipole and radial (k) parameters of non-H atoms were refined using 1412 reflections with I ≥ 3σ(I). The reliability factor obtained is about 0.022.

3. Results and Discussion

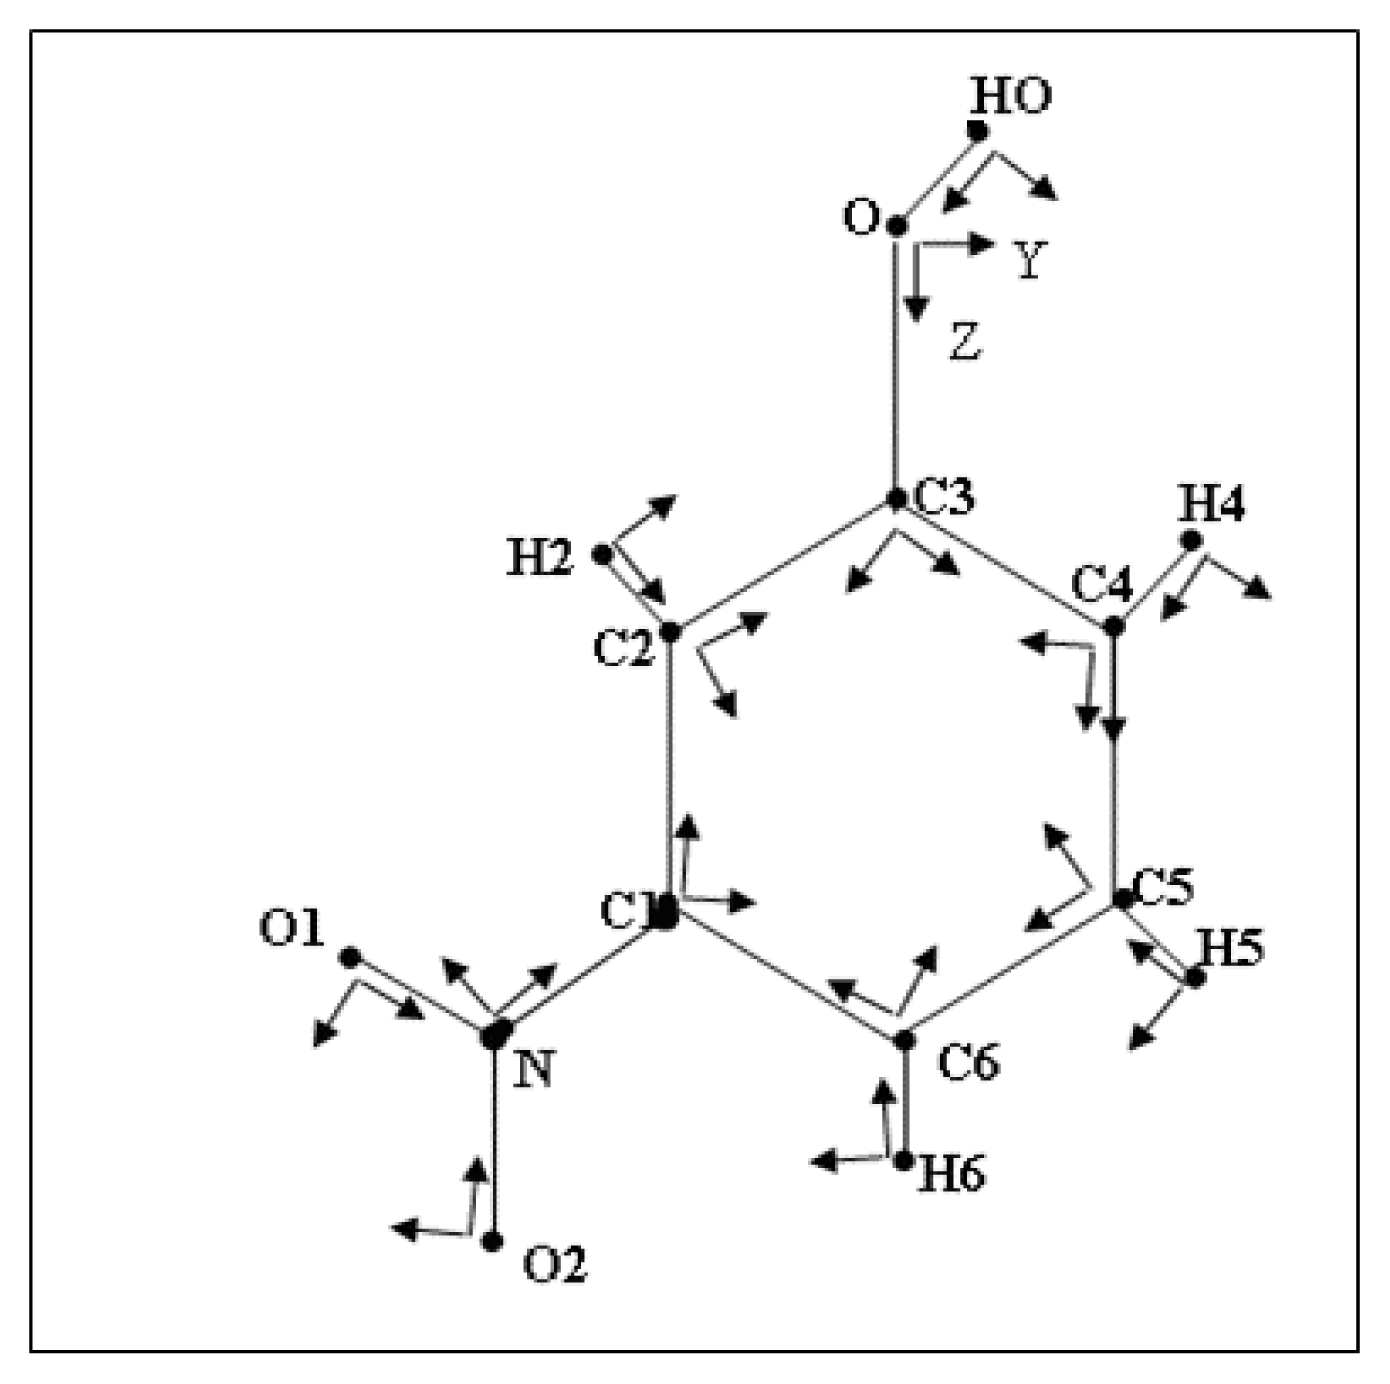
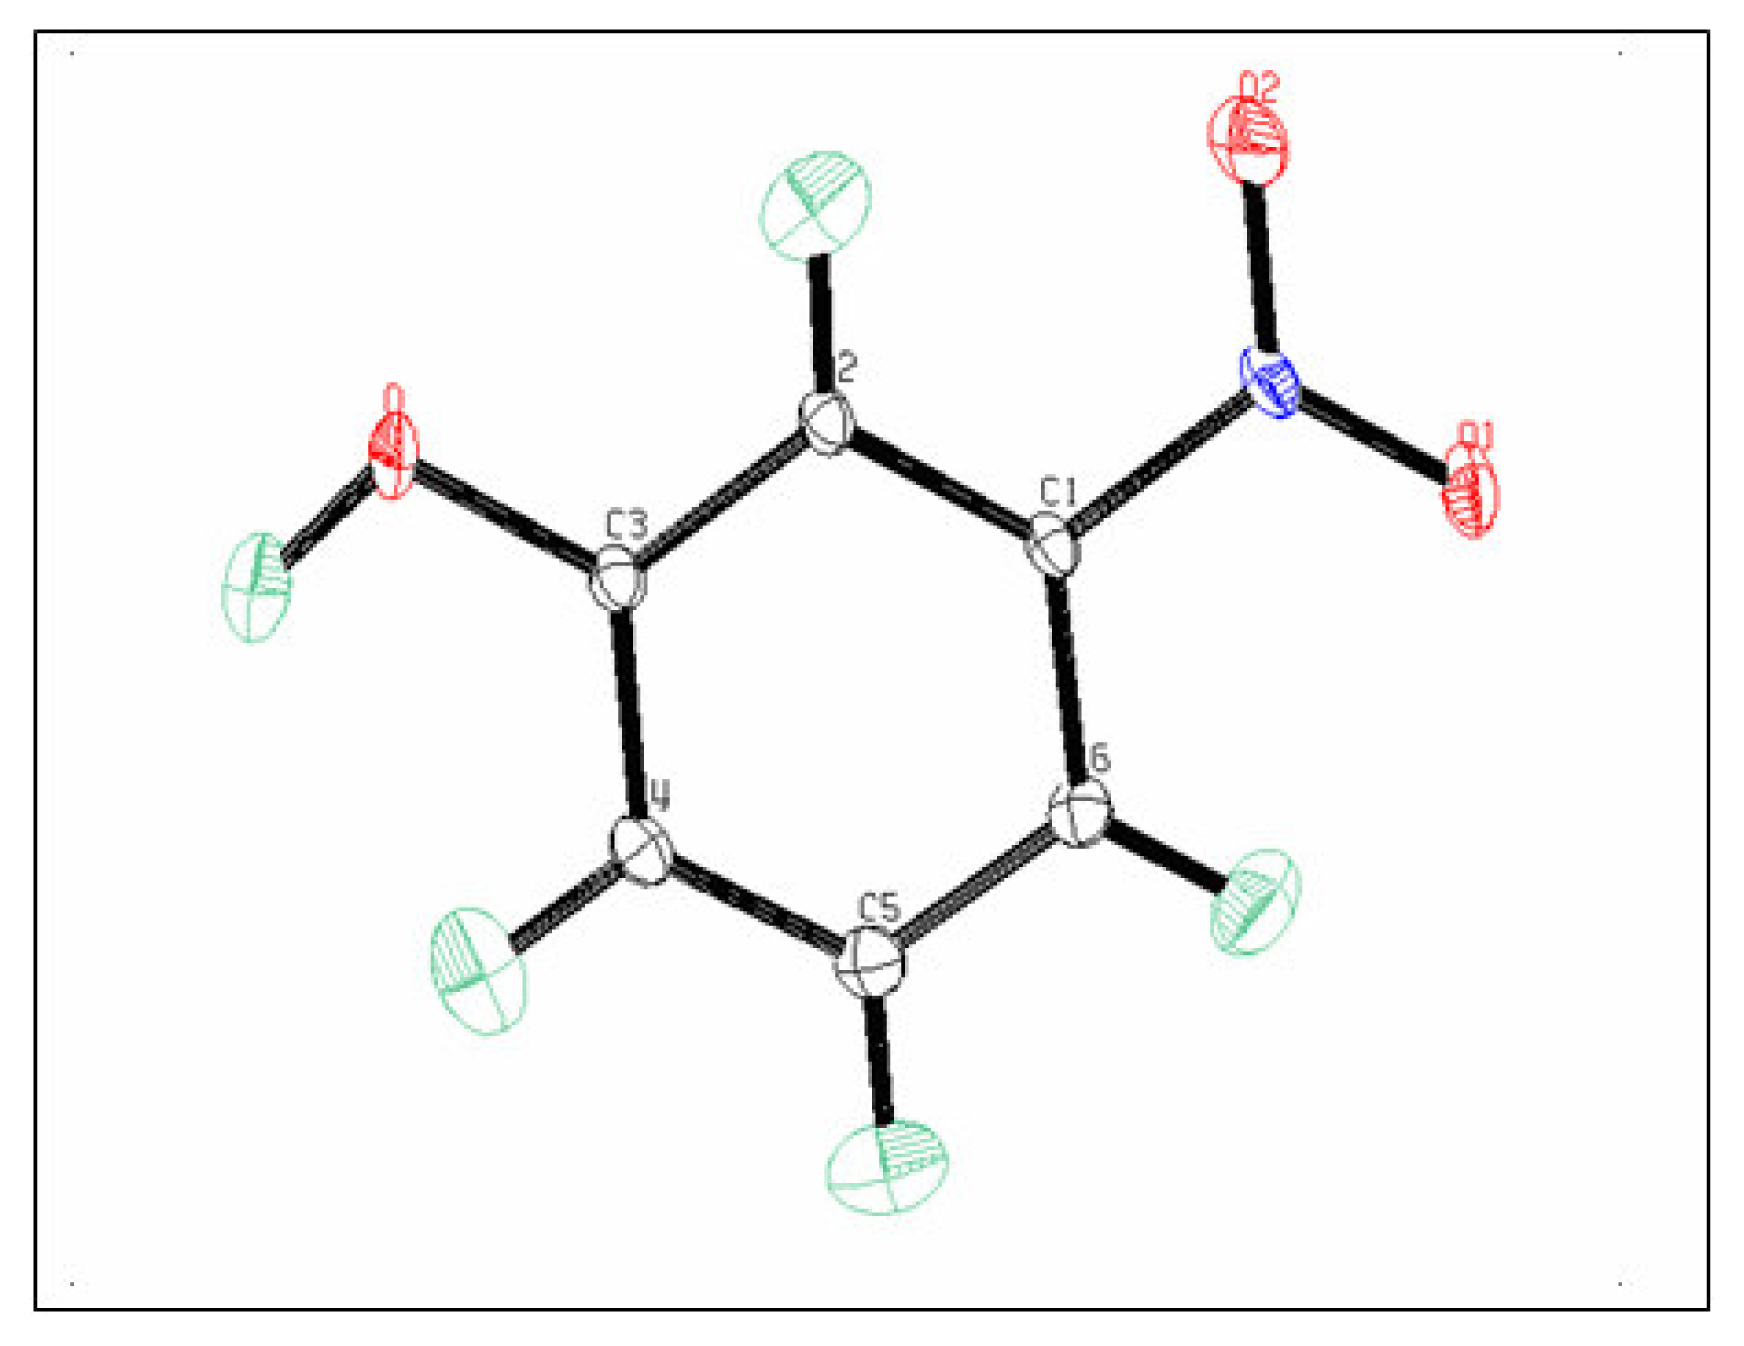
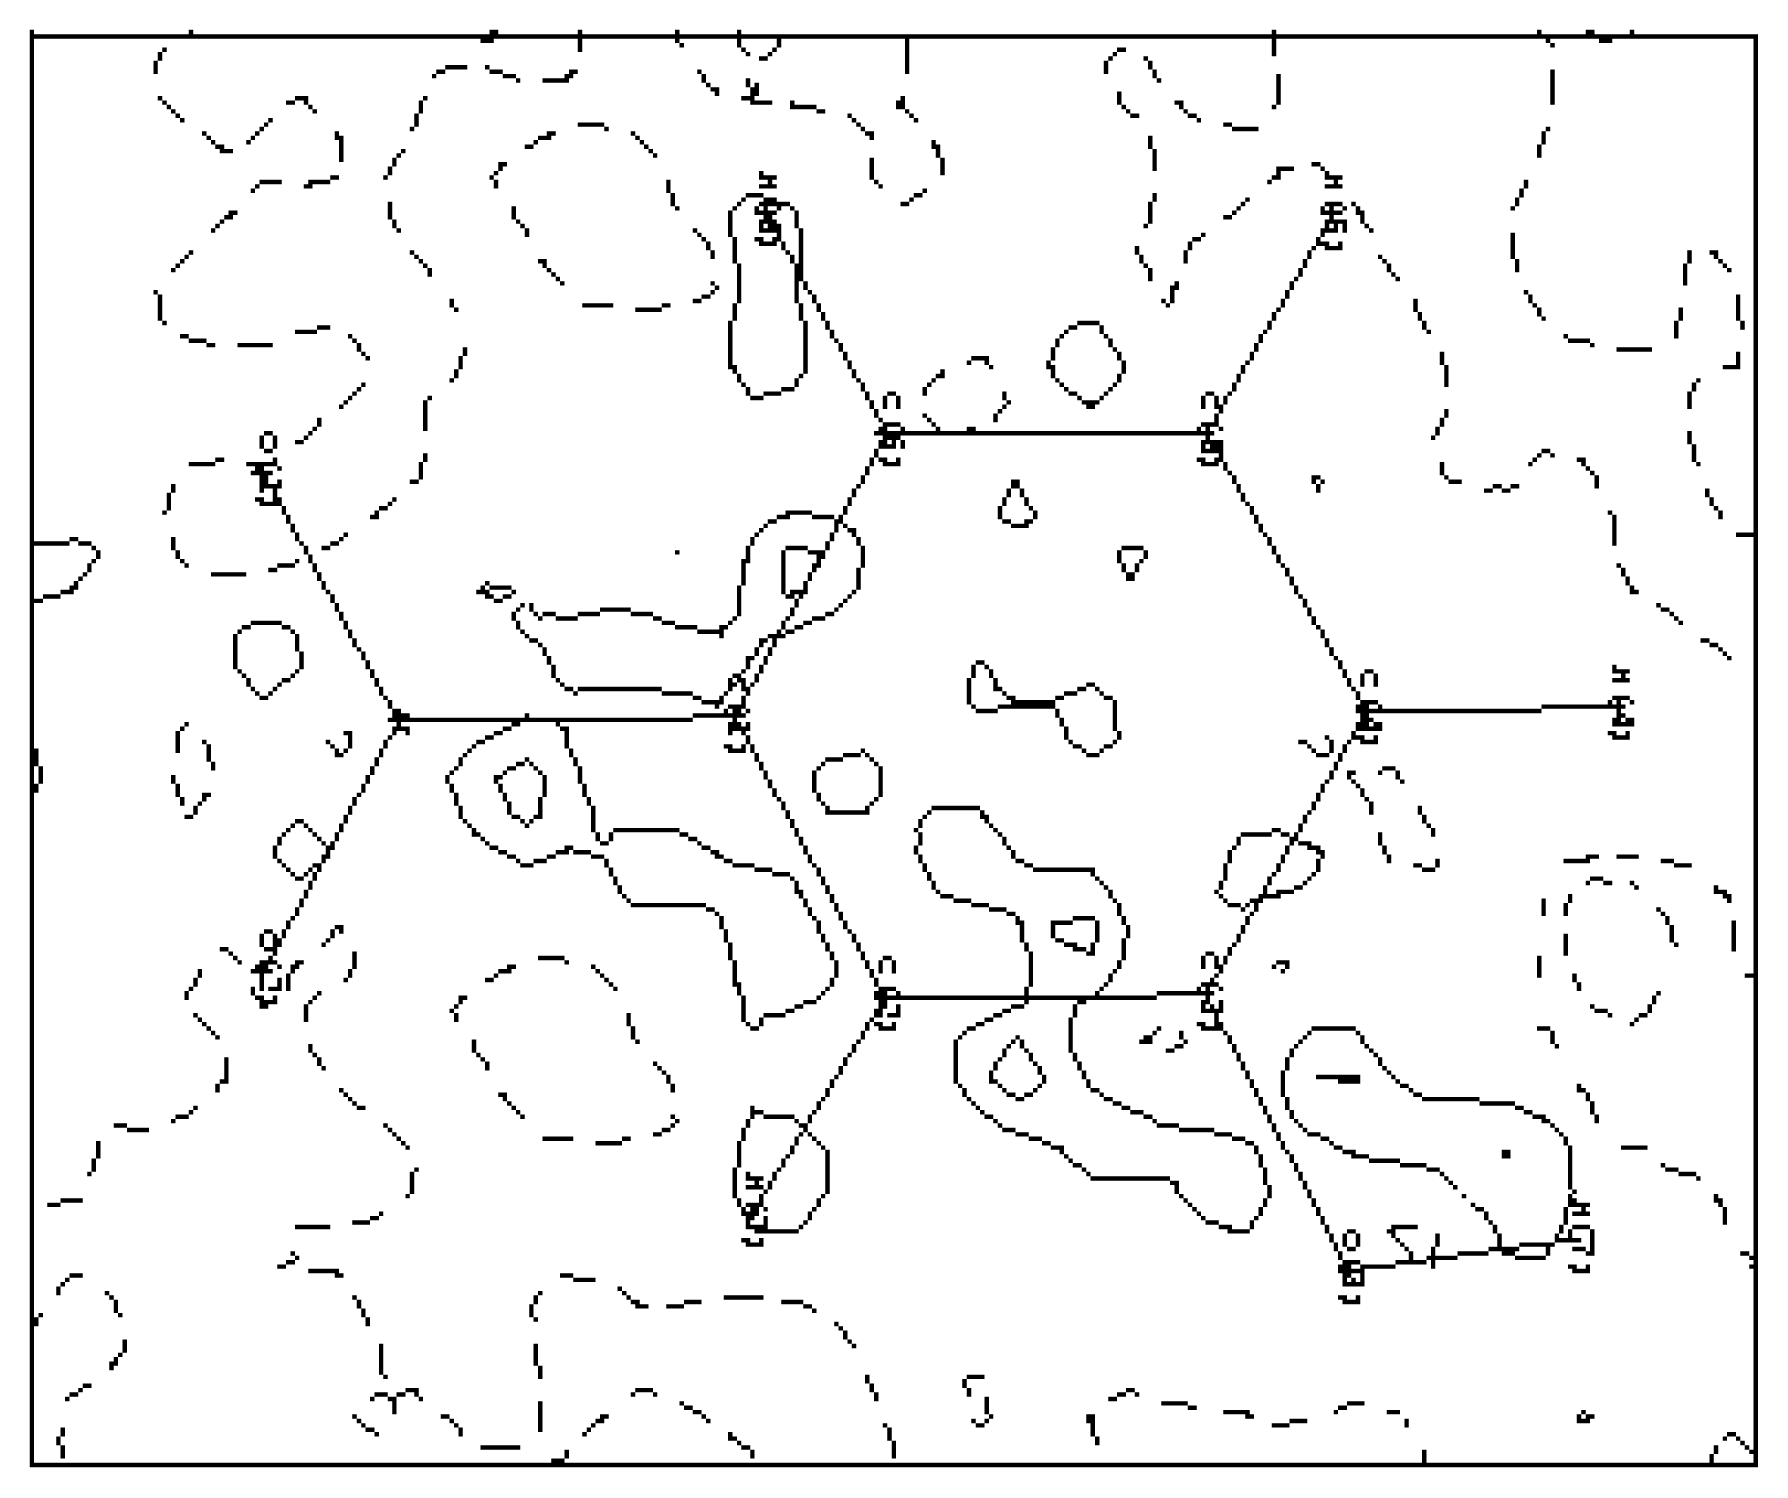
3.1. Structural and Thermal vibration analysis

The general features of the structure have been described previously [3]. The main characteristic of this structure is that the four molecules in the unit cell are engaged in four chains formed by infinite chains of hydrogen-bonded coplanar molecules. The H atoms were placed by setting the bond distances C—H and O—H at 1.105 Å and 1.029 Å respectively. Any position error of the hydrogen atom will bring about errors strongly correlated with the dipolar population of hydrogens.
The thermal motion analysis of m-NPH has been performed using the THMA11 program [14]. The rigid-body motion is described by three tensors T, L and S taking into account for translation, libration and the correlation between translation and libration, of the rigid group respectively. These tensors are obtained by a least-squares fit refinement using the observed atomic thermal motion parameters obtained by the refinement. This test indicated that the differences between the mean square displacements of atoms (MSDAs) along interatomic directions have magnitudes Δ ≤ 10.10−4Å2 for the bonded pairs of the non-H atoms [15]. The MSDAs ΔAB in the AB direction for all pairs of atoms in the molecule have been calculated and reported in Table 1.
In the general treatment of the molecular thermal motion in terms of rigid-body TLS, the calculated anisotropic thermal parameters are given in the Trueblood notation [14] as such:
U i j = T i j + G i j k l L k l + H i j k l S k l + D 2 Ω 2 n i n j
Where G and H are geometrical parameters and S is an asymmetric tensor needed to account for the average quadratic correlation of T and L. The last term corresponds to any additional intra-libration (Ω) around a chosen axis. The rigid-body fit suggests an independent liberation axis around the C1—N bond. The thermal motion of the H atoms is considered to consist of two contributions. The first is due to rigid molecular motion and the second is from the C—H vibrations [1618].
The ellipsoids of the different atoms representing their thermal motion described above are shown with an ORTEPIII diagram [19] in Figure 2.

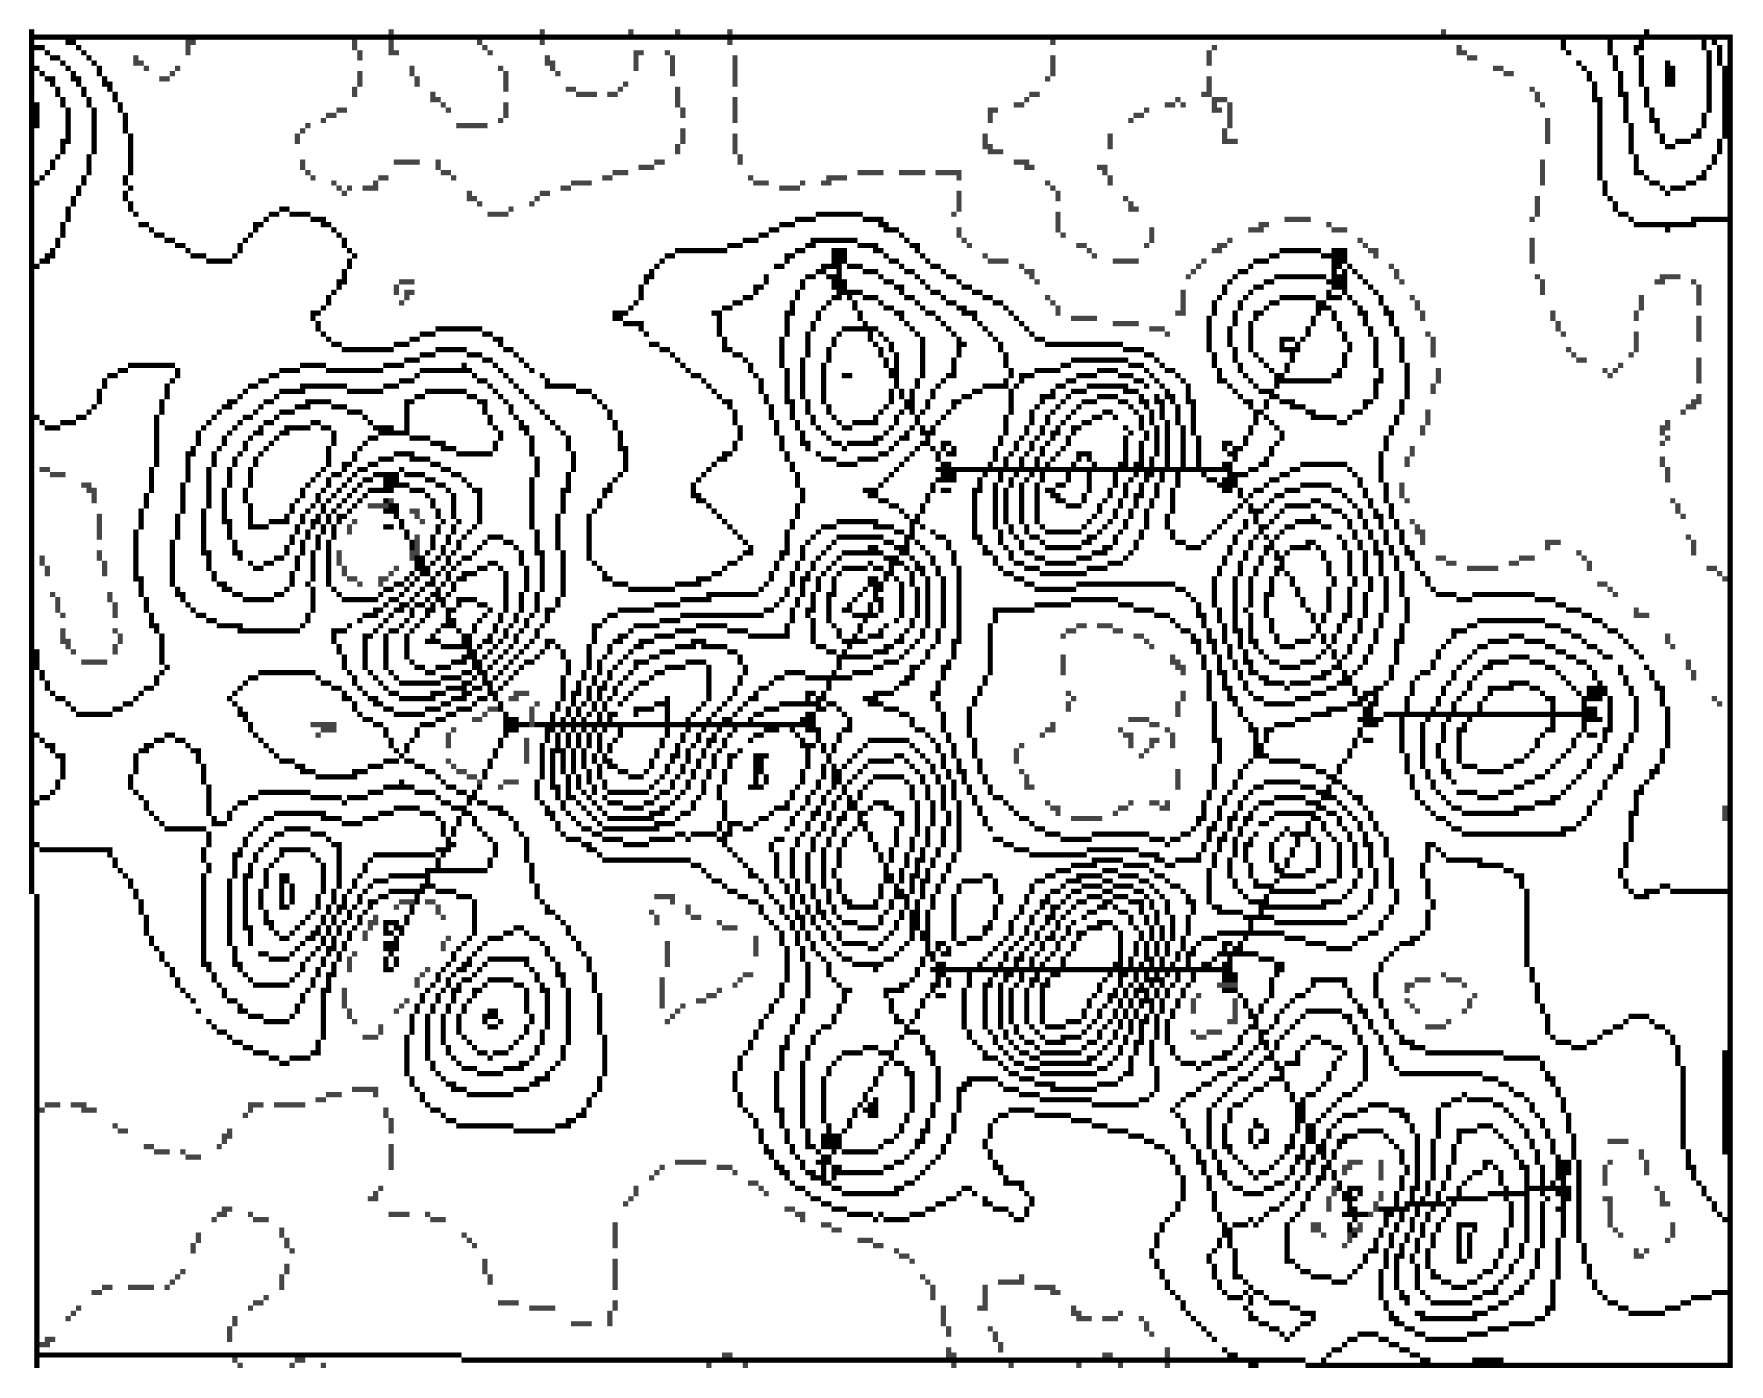
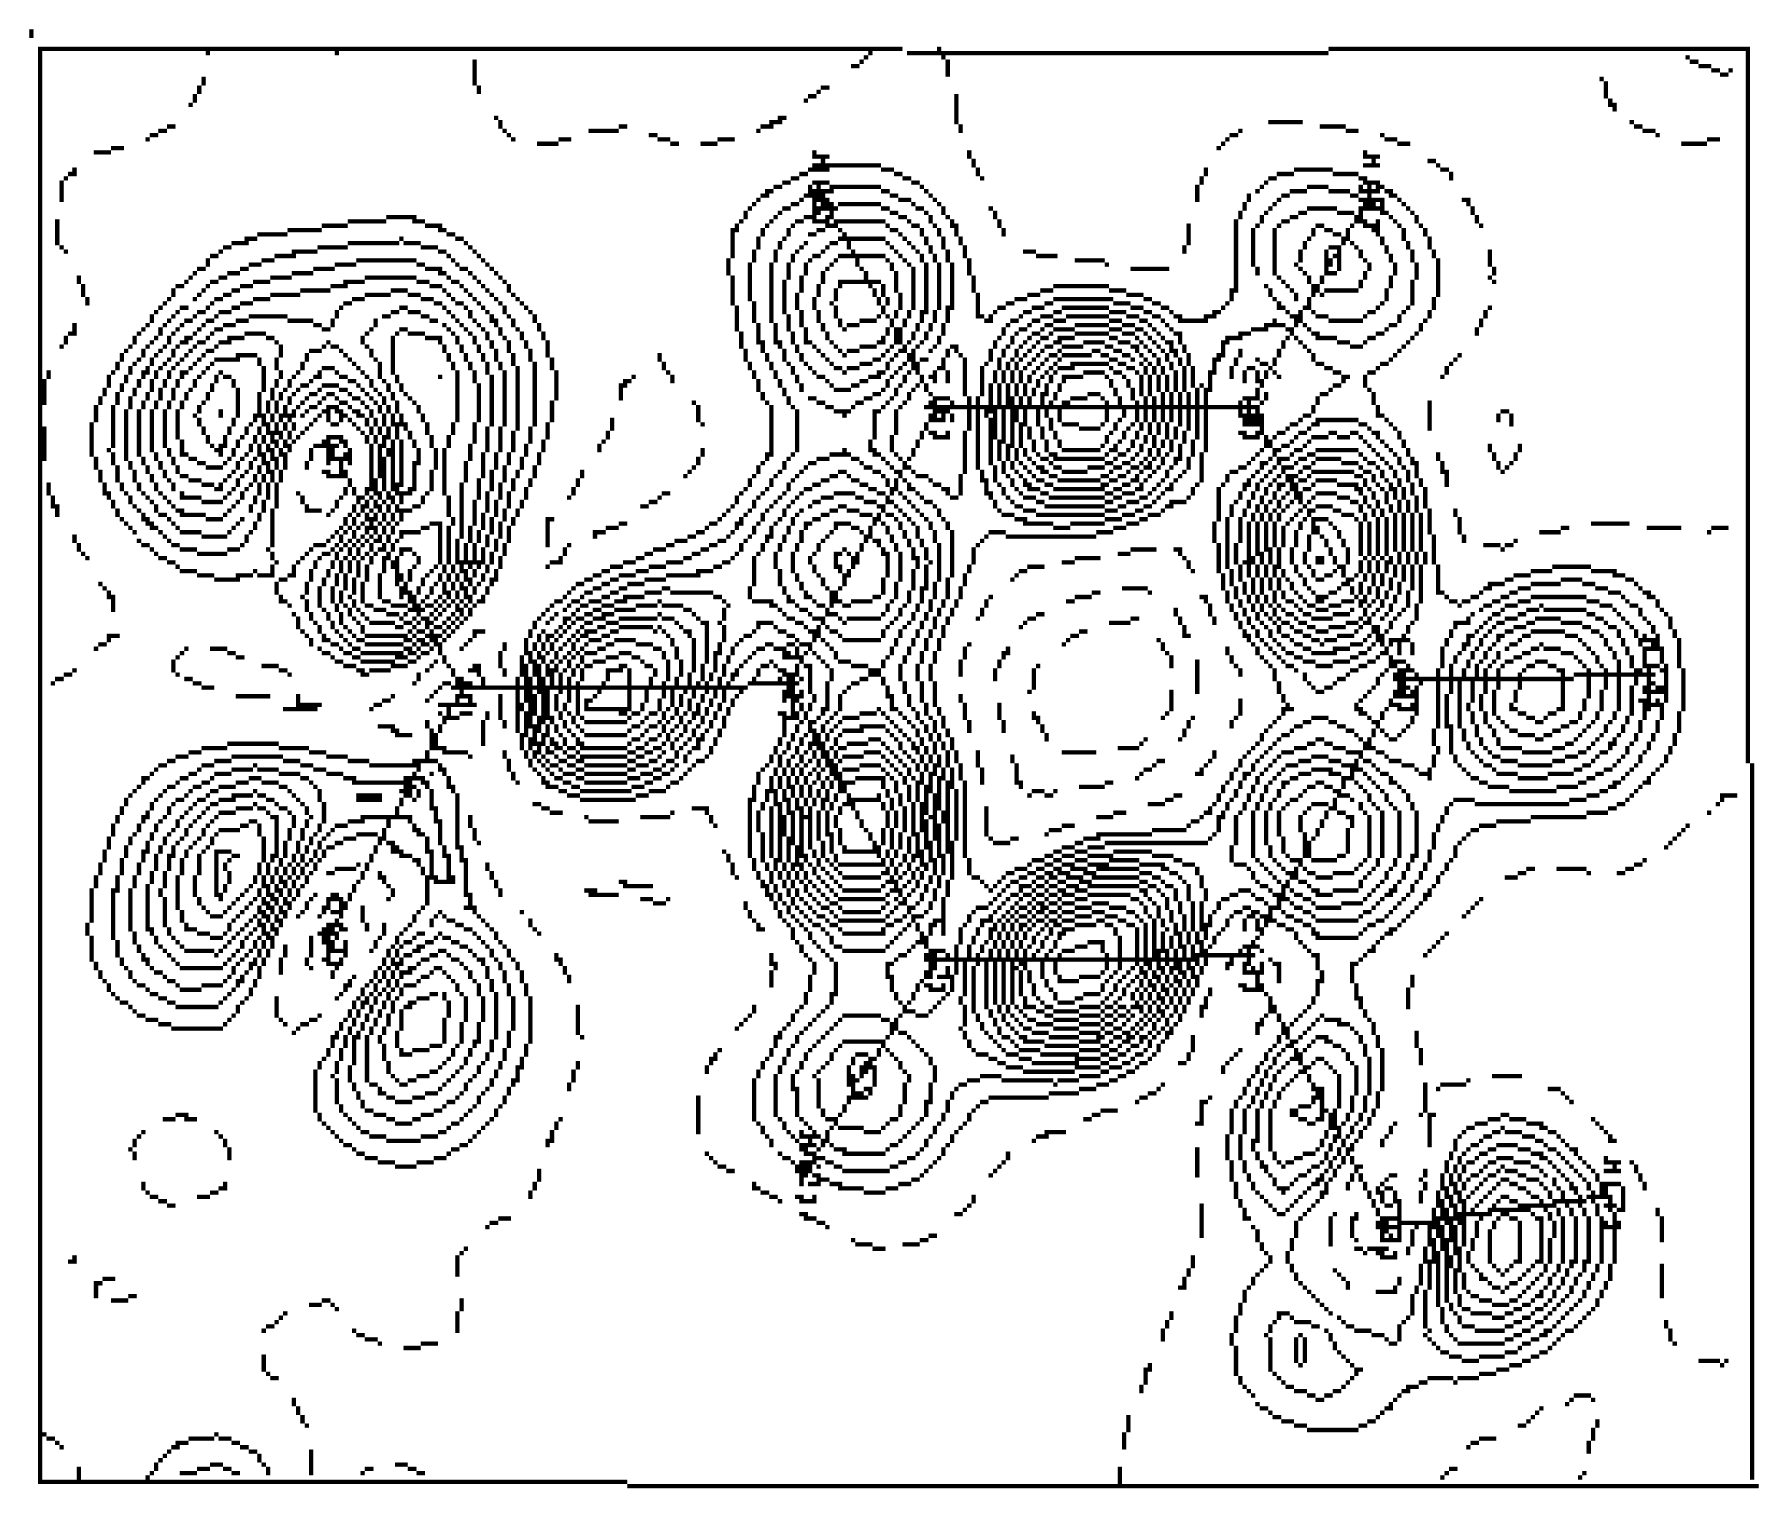
3.2. Electron-density maps

The aspherical atom model used in multipole refinement gives structure factor phases closer to the true phases for crystals than the spherical or independent atom model does. This enables the mapping of the electron density by Fourier synthesis in various ways using the program XDGRAPH implemented in the XD program package [5].
The experimental density deformation map is shown in Figure 3, from which we can notice the absence of the density on the atomic sites and the appearance of all the bond density peaks and also the localization of the oxygen lone pairs of the nitro group. This map confirms the high quality of the data sets and the efficiency of the formalism used for the data processing as proposed by Blessing [20]. This visualization is obtained using the calculated multipole phases with the observed structure factors Fobs(h):
δ ρ exp ( r ) = 1 V h [ | F O b s ( h ) | · e i φ m u l - | F s p h ( h ) | · e i φ s p h ] · e - 2 π i h . r
Fsph (h) is computed with atomic positions and thermal parameters obtained from the multipole refinement. The electron density deformation obtained from the last refinement is the dynamic model map. This map is obtained from the calculated multipole structure factors, i.e. the Fourier coefficients are the difference of two values of Fc:
δ ρ d y n ( r ) = 1 V h [ | F m u l ( h ) | · e i φ m u l - | F s p h ( h ) | · e i φ s p h ] · e - 2 π i h . r
Temperature factors are included in Fmul and Fsph. This density distribution is free of experimental noise. Figure 4 shows this electron density deformation, where one can easily observe the obvious increase of the density peaks and the good localization of the oxygen atoms lone pairs O1 and O2. The presented maps are given in the benzene ring section and the contour map is 0.05 eÅ−3.
A residual density map in the molecular plane obtained in the final cycle of refinement (see Figure 5) shows the adequacy of the multipolar model to describe the electron experimental density of the molecule. The absence of the quasi-totality of the density peak again confirms the high quality of the recorded data and the precision of the used equipment. On the other hand, the multipole expansion model appears to be very efficient for describing the electron density distribution in structure [2122].

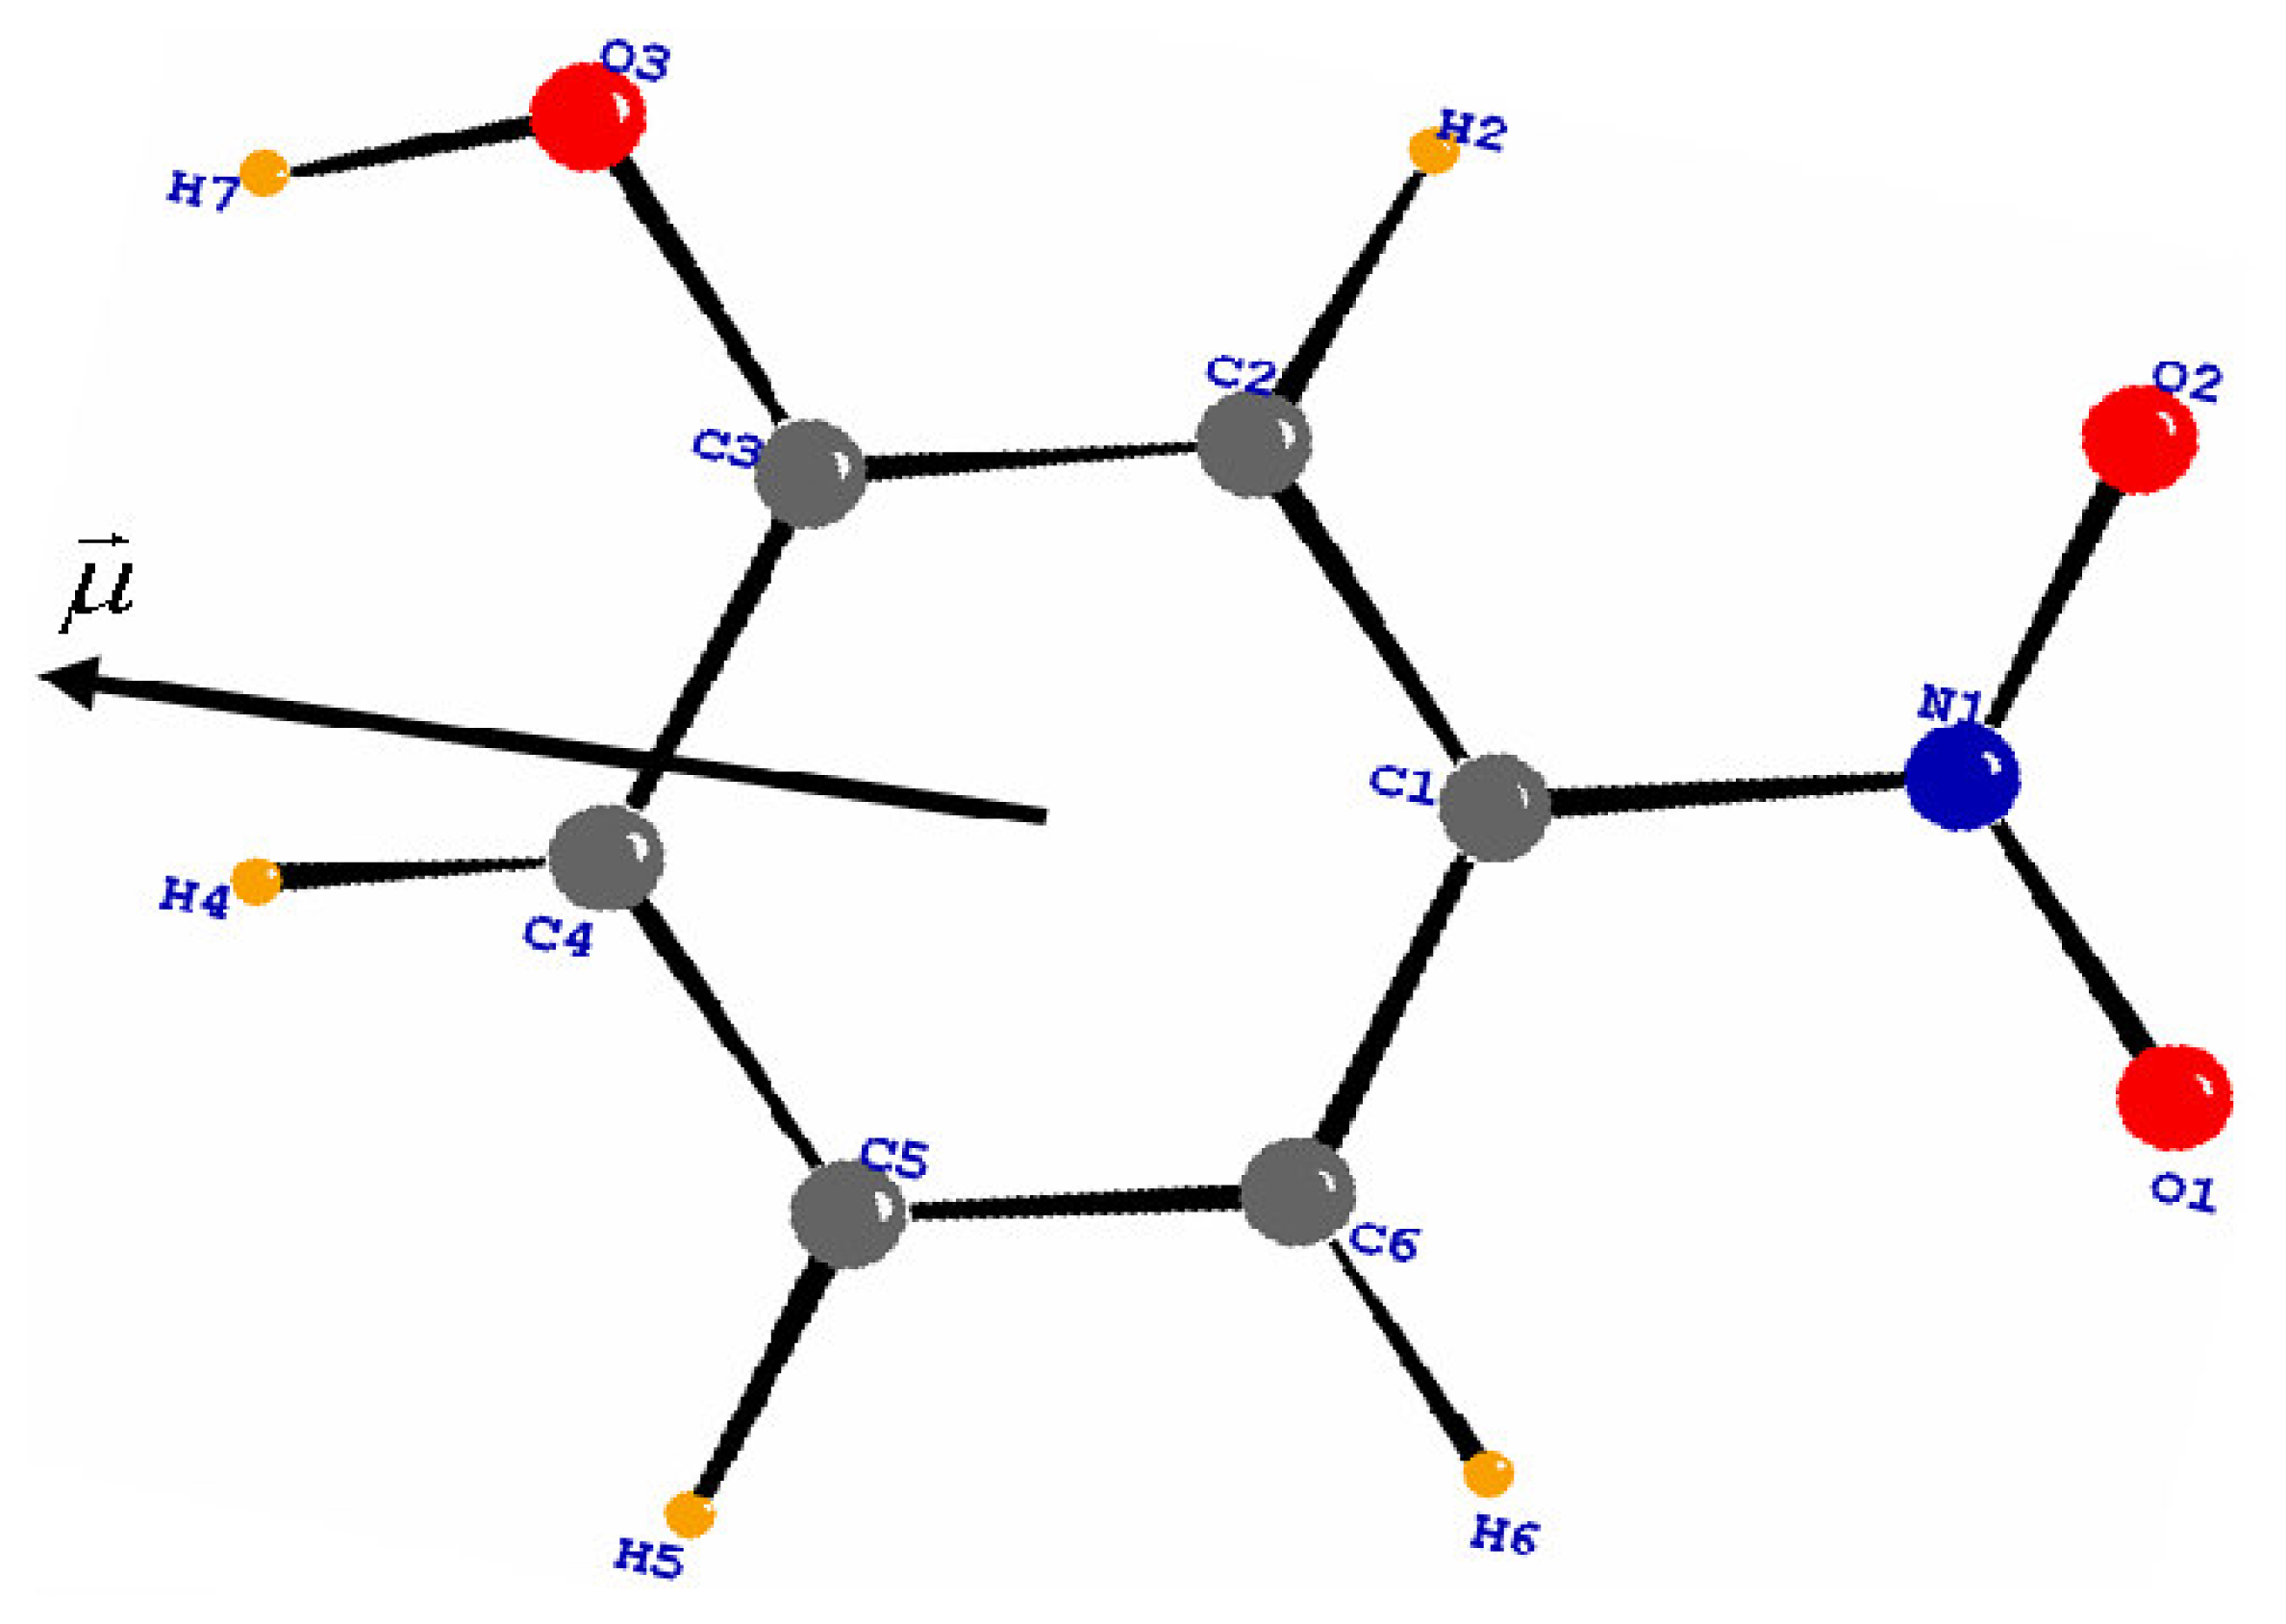
3.3. Molecular dipole moment
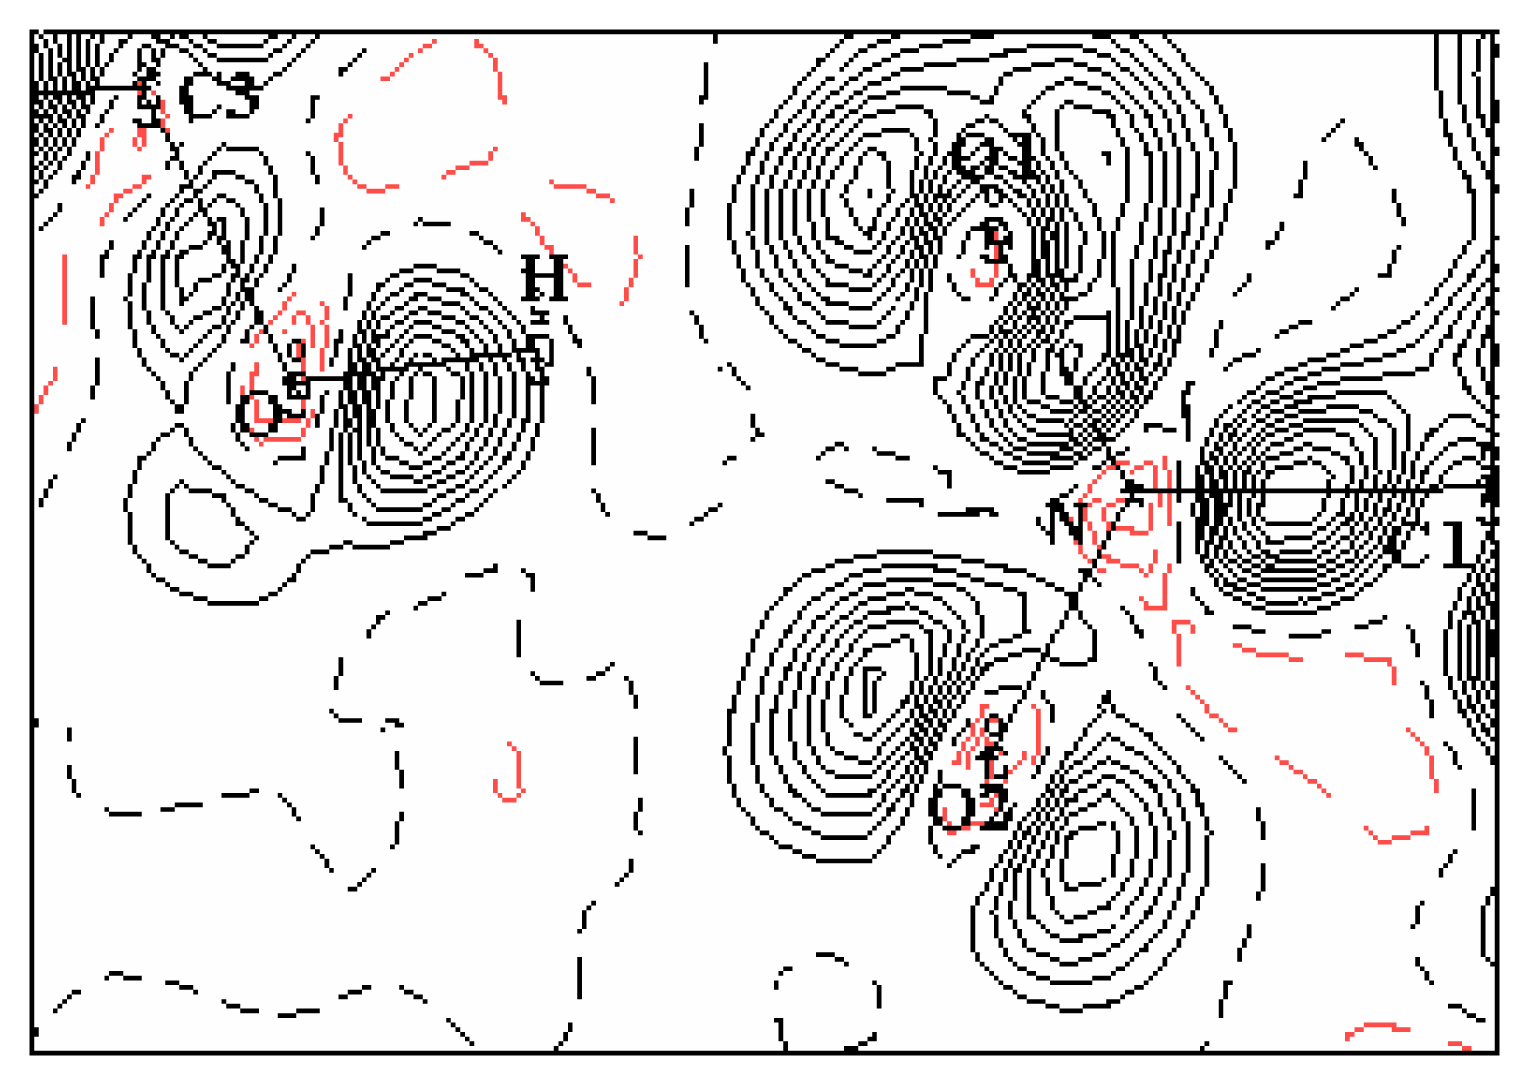
The molecular dipole moment was calculated from the multipolar population parameters (Table 2), following the procedure described by Hansen and Coppens (1978) [6]. Values of the multipole parameters are summarized in Table 3. The value of the dipolar moment reaches 5.81 Debye, see Table 4. Its orientation in the molecule is shown in Figure 6. The method is in accordance with the evaluation of the positive sign of the net charges on the H atoms and the negative sign of the net charges on the O atoms.

3.4. Hydrogen bonds

The crystal structure of the mNPH rests on chains of molecule joined by hydrogen bonds, the almost linear hydrogen bonding links by translation of equivalent molecules along the c crystallographic axis through the OH and NO2 groups (see Figure 7). Hydrogen atoms are positioned to give 1.105 and 1.029 Å C—H and O—H bonds lengths, respectively. The O—H----O distance is a little shorter in the orthorhombic crystal (2.88Å), than in the monoclinic structure (2.94Å). On the other hand the O—H--- -O angles differ slightly: 168° and 178° in both polymorphic structures respectively. There are nine intermolecular interactions which are possible in the hydrogen bond network as shown in table 5.

4 . Experimental Section

The crystallographic data were obtained at 122K on a CAD4 diffractometer using the graphite– monochromated MoKα radiation. The crystal of high quality was cooled by using a modified Enraf Nonius nitrogen gas-flow system. The cell parameters were determined from refinement by using centered angular positions of 25 reflections with 11 ≤ θ≤ 25°. The profiles of the different reflections were measured using θ −2θ step scan method. A total of 3148 intensities were recorded up to two theta of 116°. Only selected reflections with significant intensity were collected for reflections in the [0°–58.85°] theta range. A number of 1736 independent reflections of which 1412 were used in the refinement procedures.
The H atoms were located by difference Fourier synthesis as described in section 2.1. The data reduction and error analysis were carried out by using the programs of Blessing (1989) [21]. The experimental details and crystal data are displayed in Table 6. The crystal structure has been deposited at the Cambridge Crystallographic Data Centre with the deposition number CCDC 275138. These data can be obtained free of charge from The Cambridge Crystallographic Data Centre via www.ccdc.cam.ac.uk/data_request/cif.

5. Conclusion

This study has obtained good accurate results on the structure and electron charge density which gives high quality descriptive model for the electron charge density distribution from X-ray diffraction experiment. It also revealed that electron density can yield to electronic proprieties such as dipole moment.
According to the orientation of the molecular dipole moment, the region of the nitro and hydroxyl groups is electronegative, whereas the region of the C-H groups is electropositive.
The coplanarity of the hydrogen bonded molecules together with the donor-acceptor interactions across the molecules probably enhance the nonlinear response of the orthorhombic mNPH, as it was discussed recently in case of the other nitrobenzene derivative [23]. In the monoclinic mNPH, the centrosymmetry of the crystal cancels the nonlinear response.
Finally, our results could be analyzed in more detail, if they were completed by quantum chemistry calculations. Especially, for the explanations about the existence of the polymorphism in m– Nitrophenol compounds.

References

  1. Hamzaoui, F.; Baert, F.; Wojcik, G. Electron-density study of m-nitrophenol in the orthorhombic structure. Acta Cryst. B 1996, 52, 159–164. [Google Scholar]
  2. Wojcik, G.; Marqueton, Y. The phase transition of m-nitrophenol. Mol. Cryst. Liq. Cryst 1989, 168, 247–254. [Google Scholar]
  3. Wojcik, G.; Toupet, L. The inter-and intramolecular charge transfer along the polymeric chain of hydrogen-bonded molecules in two crystal forms of m-nitrophenol. Mol. Cryst. Liq. Cryst 1993, 229, 153–159. [Google Scholar]
  4. Panadares, F.; Ungaretti, L.; Coda, A. The crystal structure of a monoclinic phase of m-nitrophenol. Acta Cryst. B 1975, 31, 2671–2675. [Google Scholar]
  5. Koritsanszky, T.; Howard, S.; Richter, T.; Su, Z.; Mallinson, P.R.; Hansen, N.K. XD a Computer Program Package for Multipole Refinement and Analysis of Electron Densities from Diffraction Data; Free University of Berlin: Berlin, Germany, 2003. [Google Scholar]
  6. Hansen, N.K.; Coppens, P. Testing aspherical atom refinements on small-molecule data sets. Acta Cryst A 1978, 34, 909–921. [Google Scholar]
  7. Volkov, A.; Abramov, Y.; Coppens, P.; Gatti, C. On the origin of topological differences between experimental and theoretical crystal charge densities. Acta Cryst. A 2000, 56, 332–339. [Google Scholar]
  8. Volkov, A.; Gatti, C.; Abramov, Y.; Coppens, P. Evaluation of net atomic charges and atomic and molecular electrostatic moments through topological analysis of the experimental charge density. Acta Cryst. A 2000, 56, 252–258. [Google Scholar]
  9. Jeffrey, G.A.; Cruickshank, D.W.J. Molecular structure determination by X-ray crystal analysis: modern methods and their accuracy. Quart. Rev. Chem.Soc 1953, 7, 335–376. [Google Scholar]
  10. International Tables for X-ray Crystallography; Kynoch Press: Birmingham, 1962; Volume III.
  11. Stewart, R.F.; Davidson, E.R.; Simpson, W.T. coherent X-Ray Scattering for the Hydrogen Atom in the Hydrogen Molecule. J. Chem, Phys 1965, 42, 3175–3187. [Google Scholar]
  12. Coppens, P. X-ray Charge Densities and Chemical Bonding; New York; Oxford, 1997. [Google Scholar]
  13. International Tables for X-ray Crystallography; Kluwer Academic Publishers, 1999; Volume C.
  14. Trueblood, K.N. Program THMAI1, Department of chemistry and biochemistry; University of California: Los Angeles, 1990. [Google Scholar]
  15. Hirshfeld, F.L. Can X-ray data distinguish bonding effects from vibrational smearing? Acta Cryst. A 1976, 32, 239–244. [Google Scholar]
  16. Hirshfeld, F.L. Difference densities by least-squares refinement: fumaramic acid. Acta Cryst B 1971, 27, 769. [Google Scholar]
  17. Hirshfeld, F.L. Bonded-atom fragments for describing molecular charge densities. Theor Chim Acta 1977, 44, 129. [Google Scholar]
  18. Hirshfeld, F.L.; Hope, H. An x-ray determination of the charge deformation density in 2- cyanoguanidine. Acta Cryst. B 1980, 36, 406. [Google Scholar]
  19. Johnoson, C.K. ORTEP program; Report ORNL-3794; Oak Ridge National Laboratory: Tennessee, 1965. [Google Scholar]
  20. Blessing, R.H. DREAD - data reduction and error analysis for single-crystal diffractometer data. J. Appl. Cryst 1989, 22, 396–397. [Google Scholar]
  21. Souhassou, M.; Blessing, R.H. Topological analysis of experimental electron densities. J. Appl. Cryst 1999, 32, 210–217. [Google Scholar]
  22. Souhassou, M.; Lecomte, C.; Blessing, R.H; Aubry, A.; Rohmer, M.M.; Wiest, R.; Benard, M.; Marraud, M. Electron distributions in peptides and related molecules.1. An experimental and theoretical study of N-acetyl-L-tryptophan methylamide. Acta Cryst. B 1991, 47, 253–266. [Google Scholar]
  23. Wojcik, G.; Holband, J.; Szymczak, J.J.; Roszak, S.; Leszczynski, J. Interactions in Polymorphic Crystals of m-Nitrophenol as Studied by Variable-Temperature X-ray Diffraction and Quantum Chemical Calculations. Crystal Growth & Design 2006, 6, 274–282. [Google Scholar]
Figure 1. Labeling of the atoms and definition of local orthogonal reference axes for the atom-centered multipolar functions
Ijms 08 00103f1
Figure 2. ORTEPIII (Johnson, 1996) diagram of the m.Nitrophenol molecule
Ijms 08 00103f2
Figure 3. Experimental density map from high-order refinement: ρexp = ρoρsph · ρo is the observed electron density and ρsph is the calculated electron density using the atomic parameters obtained from the high-order refinement. Contour map is 0.05 eÅ−3
Ijms 08 00103f3
Figure 4. Dynamic density map: ρdyn = ρmultρsph, ρmult is the calculated electron density using the multipolar model and ρsph is the calculated electron density using the atomic parameters obtained from the high-order refinement. Contour map is 0.05 eÅ−3
Ijms 08 00103f4
Figure 5. Residual density map: ρres = ρoρmult. Contour map is 0.05 eÅ−3
Ijms 08 00103f5
Figure 6. Molecular dipole moment calculated by multipolar model. The origin is at the center of mass of the molecule
Ijms 08 00103f6
Figure 7. Deformation density map in the plan of the hydrogen bond; Contour map is 0.05 eÅ−3
Ijms 08 00103f7
Table 1. Matrix for differences in MSDA’s ( mean square displacements of atoms) [Values listed are104 MSDA's for column atom minus that for row atom, underlined values correspond to chemical bonds].
OO2O1NC6C5C4C3C2
C1−5521451716104
C2−527−9−177811
C31016−10−7851
C4−195−1−244
C5−19−130−74
C6−18−175−3
N−4157
O125
O2−40
Table 2. Net atomic charge in m-Nitrophenol
ATOMPvq
C14.153−0.153
C24.270−0.270
C33.9710.028
C44.395−0.395
C54.462−0.462
C64.268−0.268
N4.3530.646
O16.233−0.233
O26.218−0.218
O6.290−0.290
H20.6810.318
H40.7830.216
H50.7490.250
H60.7110.288
HO0.6710.328
Table 3. The multipolar coefficients as described in the model of Hansen & Coppens. Pv correspond to l=0. d2 and d3 correspond to l =1(d1=0) and q1, q3 and q4 are the quadrupolar coefficients corresponding to l=2 (q2=q5=0). o1, o3, o4 and o7 are the octapolar coefficients corresponding to l=3 in the multipolar development (o2=o5=o6=0). Some coefficients are set equal to zero because of atomic sites symmetries.
AtomsPmld2d3q1q3q4o1o3o4o7
C14.1536−0.0030.0820.185−0.001−0.0560.212−0.0820.175−0.135
C24.27030.1310.3540.032−0.027−0.1540.265−0.1240.192−0.054
C33.97100.0180.1970.2240.044−0.1190.181−0.0190.153−0.091
C44.3953−0.1050.1140.2870.118−0.1260.1300.0400.1120.004
C54.4621−0.0370.0620.1410.025−0.2460.1650.0960.140−0.009
C64.2681−0.0330.008−0.039−0.2790.1620.2240.0590.186−0.031
N4.3534−0.0150.0120.050−0.081−0.1760.177−0.0060.1340.033
O16.2335−0.128−0.055−0.0010.003−0.2070.0560.0480.046−0.103
O26.21790.078−0.073−0.0920.111−0.2510.0680.0210.0400.098
O6.2901−0.036−0.0330.0680.004−0.0520.092−0.0180.1000.011
H20.68130.227
H40.78350.281
H50.74920.234
H60.71150.196
HO0.67110.126
Table 4. Magnitude of the molecular dipole moment
μxμyμzμ (Debye)
−0.032−0.032−0.6365.81 (20)
Table 5. Various possible hydrogen bonds
DH ...ADH...A (°)DH (Å)D…A (Å)H….A (Å)
C2—H2…..O2 (a)95.26 (8)1.105 (2)2.717 (3)2.382 (3)
C6—H6..…O1 (a)91.79 (9)1.093 (2)2.727 (3)2.464 (2)
C4—H4…..O1 (b)129.70 (9)1.094 (2)3.386 (4)2.581 (3)
O —HO…..N (b)155.47 (8)1.029 (1)3.495 (4)2.532 (3)
O —HO…..O1 (b)178.03 (8)1.029 (1)2.908 (3)1.880 (2)
O —HO......O2 (b)127.49 (8)1.029 (1)3.315 (4)2.586 (3)
C5—H5…..O1 (c)124.62 (9)1.109 (2)3.693 (5)2.949 (4)
C5—H5…..O2 (d)140.67 (9)1.109 (9)3.338 (3)2.405 (2)
C5—H5…..O (e)131.87 (9)1.109 (2)3.471 (3)2.631 (2)
Symmetry operations :
(a)x, y, z
(b)x, +y, +z−1
(c)-x+2, -y+1, -z+1
(d)x+1/2, -y+1/2, +z−1/2
(e)x+1/2, -y+1/2, +z+1/2
Table 6. Experimental details
Crystal data

Chemical formulaC6H5NO3
Chemical formula weight139.11
Cell settingMonoclinic
Space groupP21/n
a (Å)11.026(4)
b (Å)6.736(1)
c (Å)8.119(21)
β (°)97.73 (2)
V3)597.50
Z4
Dx(mg m−3)1.54
Radiation typeMo
Wavelength (Å)0.71073
No. of reflections for cell parameters25
θ range (°)11 – 25
μ (mm−1)0.127
Temperature (K)122 (1)
Crystal formPrism
Crystal size0.10 × 0.27 × 0.32
Crystal colorColorless

Data collection

DiffractometerNonius CAD-4
Data collection methodθ − 2θ
max117.71
No. of measured reflections3148
No. of independent reflections1736
No. of observed reflections1412
Criterion for observed reflectionsI ≥ 3σ (I )
Rint0.021
Range of h, k, l−25 → h → 23
0 → k → 15
0 → l → 18
No. of standard reflections3
Frequency of standard reflectionsEvery 120 min

Refinement

NRwRS

Spherical refinement920.0380.0401.02
Multipole refinement2210.0220.0351.12

N is the number of refined parameters and M is the number of observations. R = | F o | - | F c | / | F o |             ;             w R = [ w ( | F o | - | F c | ) 2 / w | F o | 2 ] 1 / 2             ;             S = [ w ( | F o | - | F c | ) 2 / ( M - N ) ] 1 / 2

Source of atomic scattering factorsInternational Tables for X-ray Crystallography (1999, Vol. C)

