3.1. Partial charges and force constant for fidarestat atoms
The calculated partial charges for the fidarestat atoms are shown in
Table 2. Mulliken charges are given for comparison. These partial charges reproduce the electrostatic potential with a high level of accuracy, as measured by the χ
2 value of 2.85×10
-3 (A.U.), or by the χ
2/
NG of 1.60×10
-6 (A.U), where
NG is the number of grid points to which the potential was fitted. The computed charges led to a dipole vector (0.43825, 1.21534, -2.31056×10
-6) (A.U.) in excellent agreement with the QM dipole (0.43925, 1.26534, -2.36220×10
-6). The correlation between the Mulliken charges and the electrostatic potential fitted (EPF) charges is excellent, with a correlation coefficient of 0.94 and a slope of 0.90.
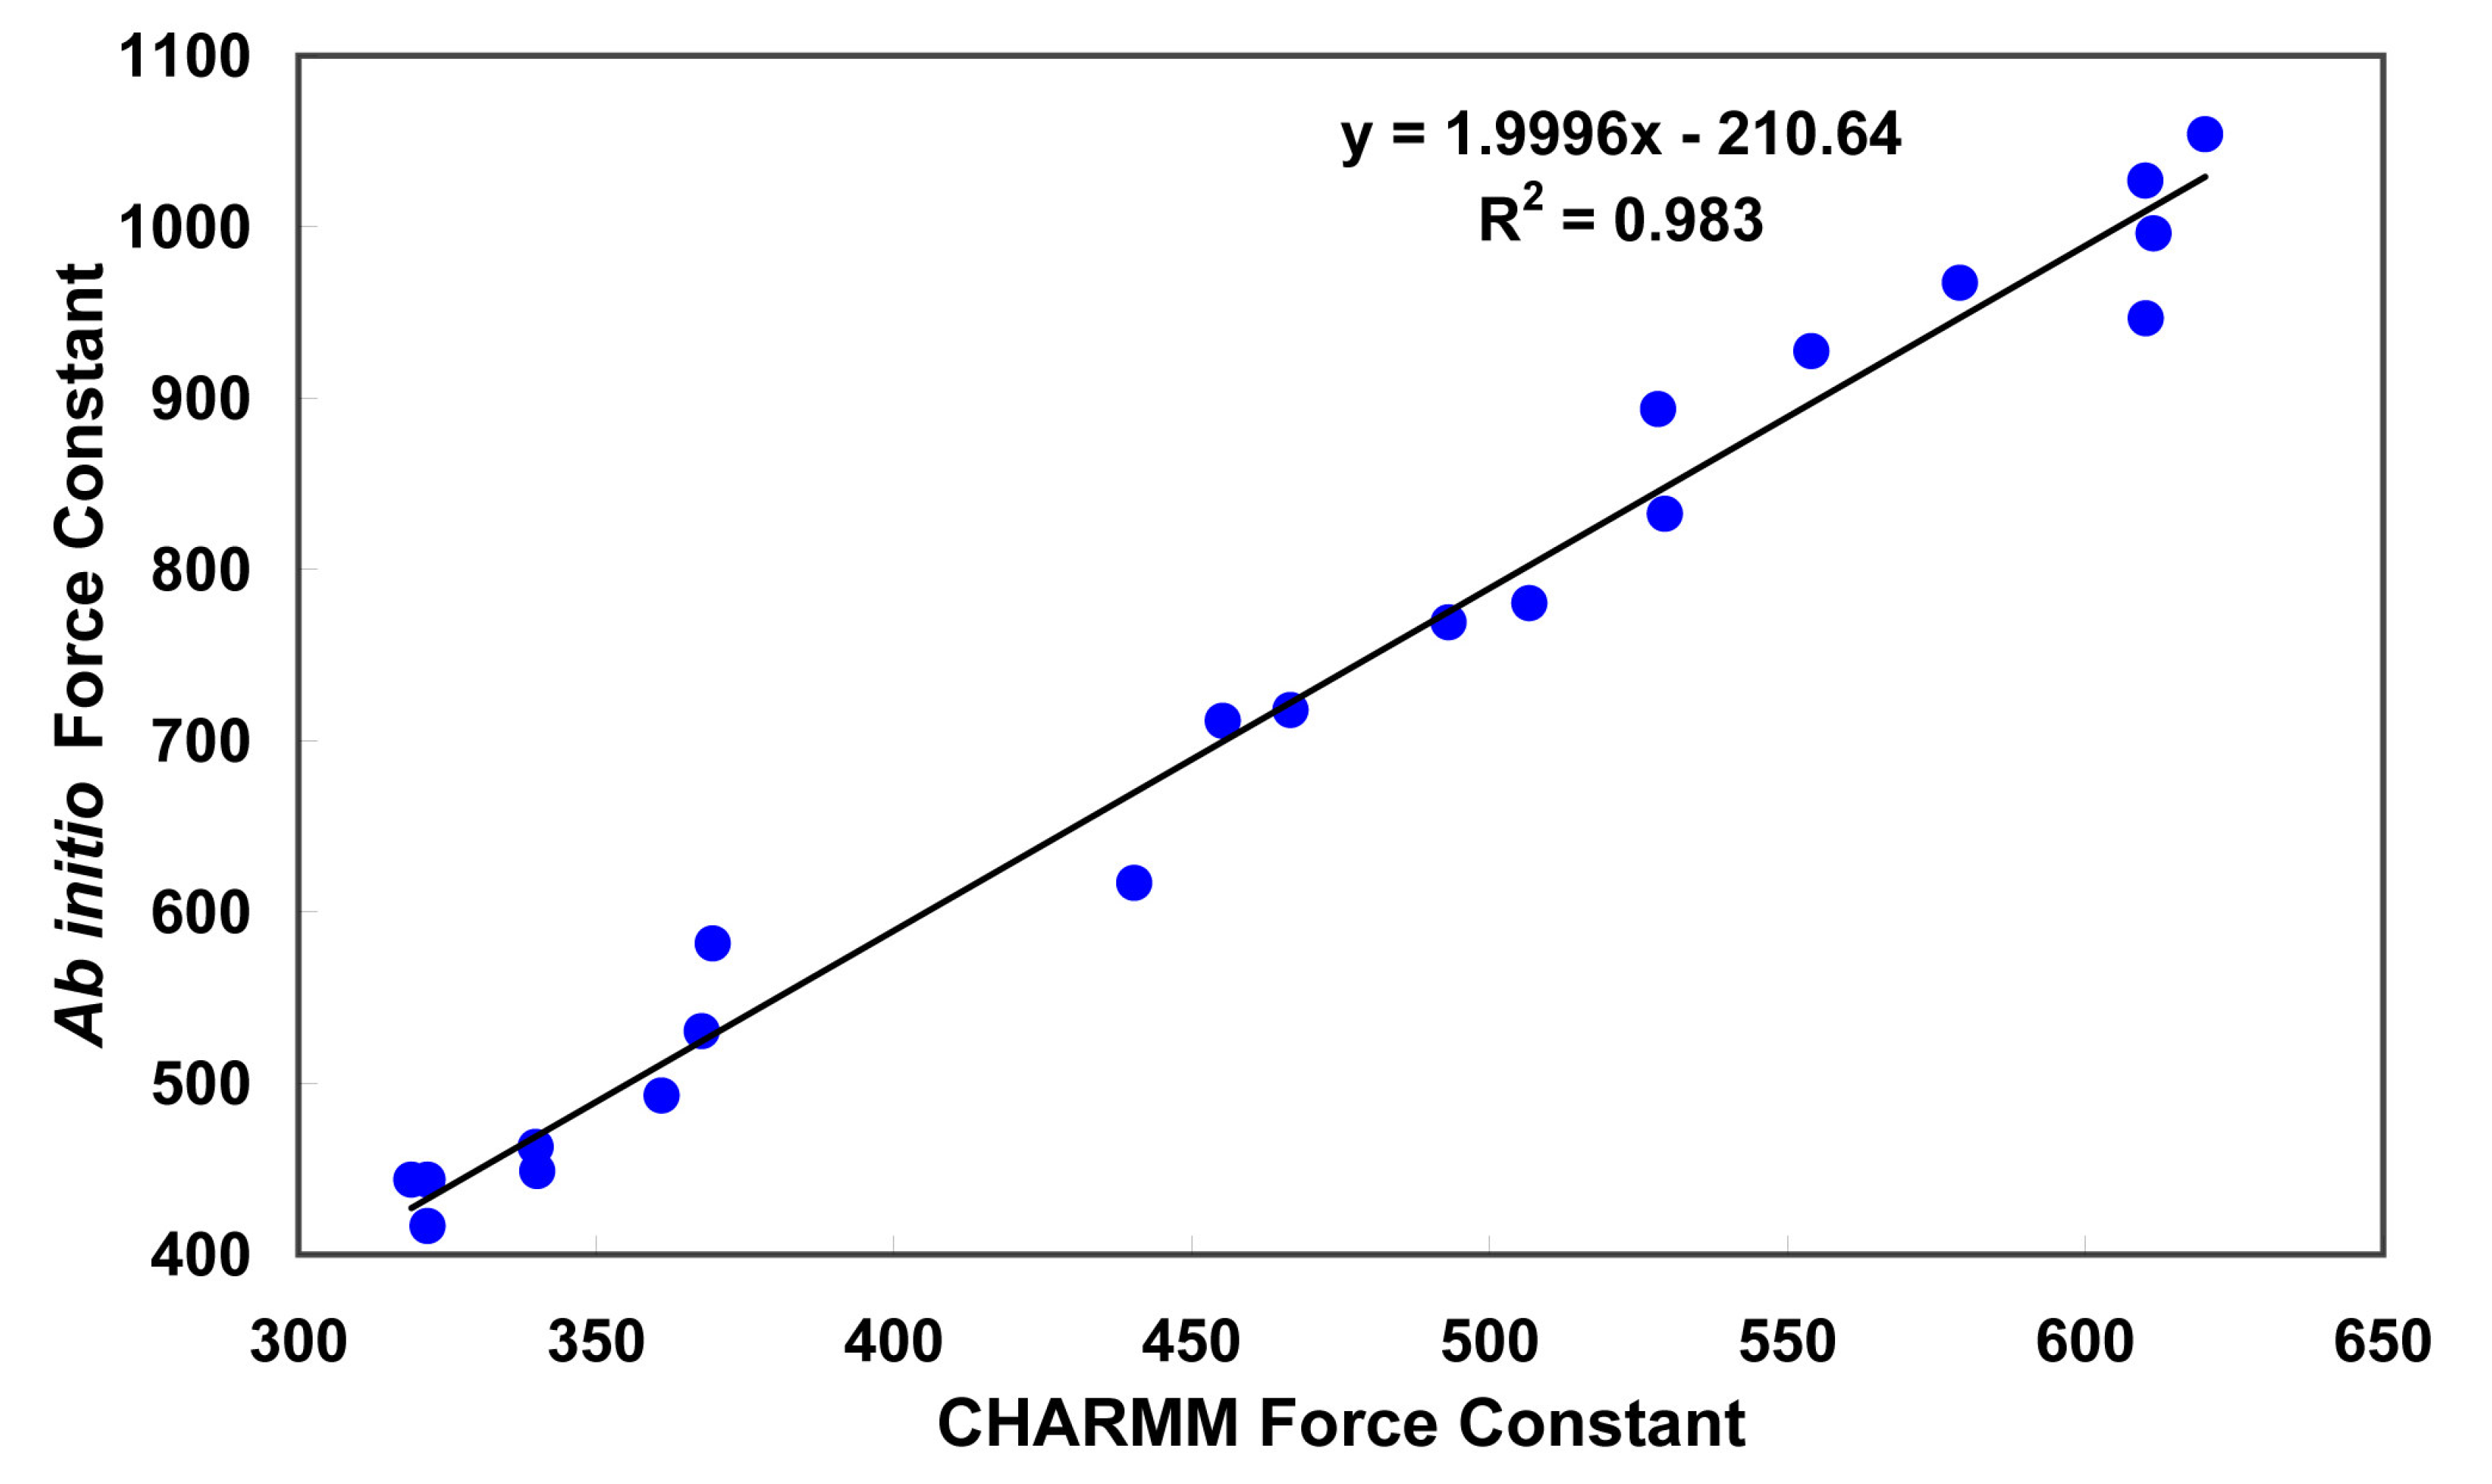
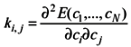
Figure 3.
Correlation between CHARMM versus
Ab Initio force constant (
ki,j). Thus,
![Ijms 07 00519 i002]() i, j = 1,…, N,
i, j = 1,…, N, where
E(
c1,…,
cN) is the Hartree-Fock energy and
c1,…,
cN are the N = 3M - 6 independent internal coordinates, M being the number of atoms of the QM system. In the present case, M = 30. The terms used in the CHARMM force field correspond to the diagonal elements,
ki,j divided by 2 (the factor 0.5 of the Taylor expansion for the energy is included in the force constant).
Table 2.
Mulliken versus electrostatic potential fitted (EPF)a charges for fidarestat atoms
Table 2.
Mulliken versus electrostatic potential fitted (EPF)a charges for fidarestat atoms
| Atom | Mulliken charges | EPF charges |
| N1 | -0.492316 | -0.135382 |
| H1 | 0.800010 | 0.219992 |
| H2 | 0.800010 | 0.219992 |
| C1 | 0.307696 | 0.084615 |
| O1 | -1.784636 | -0.490770 |
| C2 | 0.861549 | 0.236923 |
| H3 | 0.430774 | 0.118462 |
| O2 | -1.600019 | -0.439999 |
| C3 | 0.061540 | 0.016923 |
| H4 | 0.184618 | 0.050769 |
| H5 | 0.184618 | 0.050769 |
| C4 | 0.800010 | 0.219992 |
| N2 | -0.307696 | -0.084622 |
| H6 | 0.800010 | 0.219992 |
| C12 | 0.030770 | 0.008462 |
| O3 | -1.784637 | -0.490769 |
| N3 | 0.492314 | 0.135385 |
| H7 | 0.861549 | 0.236923 |
| C11 | 0.615392 | 0.169231 |
| O4 | -1.723098 | -0.473846 |
| C5 | 0.061540 | 0.016923 |
| H8 | 0.430774 | 0.118462 |
| C6 | 0.061540 | 0.016923 |
| F | -1.046166 | -0.287692 |
| C7 | 0.030770 | 0.008462 |
| H9 | 0.430774 | 0.118462 |
| C8 | -0.061540 | -0.016923 |
| H10 | 0.430774 | 0.118462 |
| C9 | 0.061540 | 0.016923 |
| C10 | 0.061540 | 0.016923 |
For molecular dynamics simulation and energy minimization, the accuracy of the electrostatic potential at some distance from the molecule is more important than the actual values of the partial charges. Thus, the EPF charges were used instead of the Mulliken charges. Another reason for using EPF charges was that they are more consistent with the CHARMM charges [
41].
Force constants were determined from the Hessian matrix. The correlation of the ab initio values with the corresponding CHARMM values is shown in
Figure 3. The slope of the linear regression curve is approximately 2 and because of the form of the harmonic energy function [
39], the force constants were divided by two before implementation in the CHARMM force field. It might be noted that off-diagonal terms can be of the same order of magnitude as the diagonal terms. Those terms are not accounted for by the present functional form of the potential energy function.
3.2. Molecular dynamics and Free Energy calculation
The values of ΔGALR2 from 16 simulations extending over 8 ns in total are shown in
Table 3 and
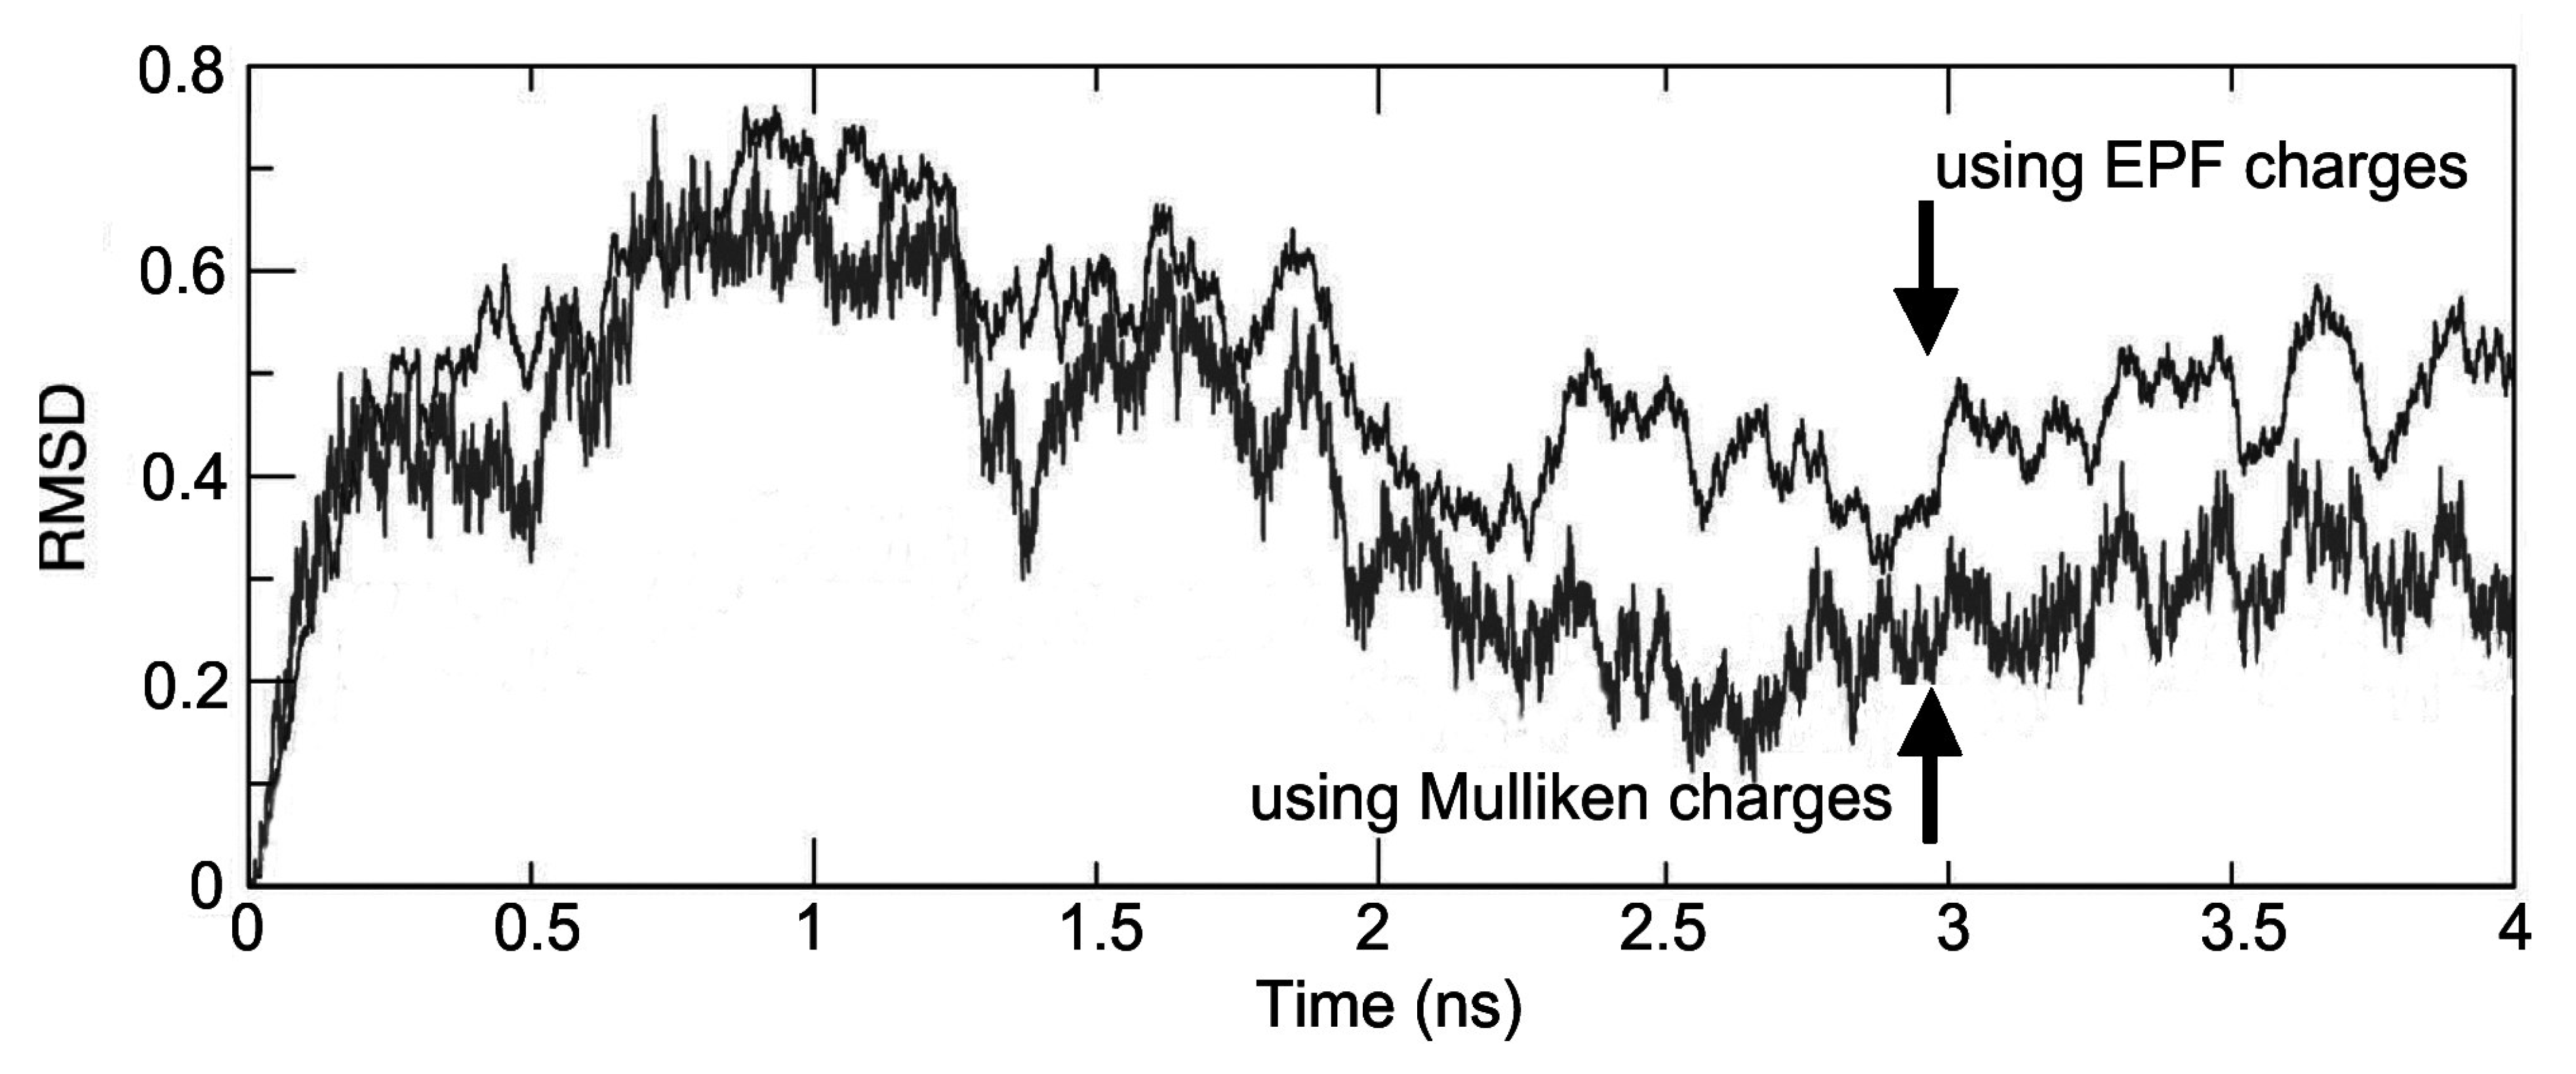
Figure 4. In
Figure 4, the atom-positional RMSD of the fidarestat atoms in the trajectory structures from the initial structure is shown for the ALR2-(2R,4S)-Fidarestat and ALR2-(2S,4S)-Fidarestat complexes.
Figure 4.
Atom-positional RMSD of the fidarestat in the trajectory structures from the initial structure under EPF and Mulliken charges, for the simulated ALR2-Fidarestat complex.
Figure 4.
Atom-positional RMSD of the fidarestat in the trajectory structures from the initial structure under EPF and Mulliken charges, for the simulated ALR2-Fidarestat complex.
Table 3.
Free energy differences from the simulation.
Table 3.
Free energy differences from the simulation.
| Time(ns) | EPF charges | Mulliken charges |
| | Final Conformation | <Δ ΔG> (kJ/mol) | Final Conformation | <Δ ΔG> (kJ/mol) |
| 0.5 | S1(2R,4S)→(2S,4S) | +6.19 | S*1(2R,4S)→(2S,4S) | -1.20 |
| 1.0 | S2(2S,4S) →(2R,4S) | +6.10 | S*2(2S,4S)→(2R,4S) | +8.12 |
| 1.5 | S3(2R,4S)→(2S,4S) | -3.26 | S*3(2R,4S)→(2S,4S) | -4.05 |
| 2.0 | S4(2S,4S) →(2R,4S) | +2,77 | S*4(2S,4S)→(2R,4S) | +9.19 |
| 2.5 | S5(2R,4S)→(2S,4S) | +4.89 | S*5(2R,4S)→(2S,4S) | -7.40 |
| 3.0 | S6(2S,4S) →(2R,4S) | +0.50 | S*6(2S,4S)→(2R,4S) | +7.61 |
| 3.5 | S7(2R,4S)→(2S,4S) | -1.40 | S*7(2R,4S)→(2S,4S) | -3.49 |
| 4.0 | S8(2S,4S) →(2R,4S) | +7.40 | S*8(2S,4S)→(2R,4S) | +7.61 |
| | Average of all |
| | (2R,4S) → (2S,4S) | +0.9 ± 4.1 | (2R,4S) → (2S,4S) | -4.0 ± 2.2 |
| | (2S,4S) → (2R,4S) | +4.9 ± 2.7 | (2S,4S) → (2R,4S) | +8.1 ± 0.7 |
| | Final average |
| | (2R,4S) → (2S,4S) | -2.0 ± 1.7 | (2R,4S) → (2S,4S) | -6.0 ± 0.8 |
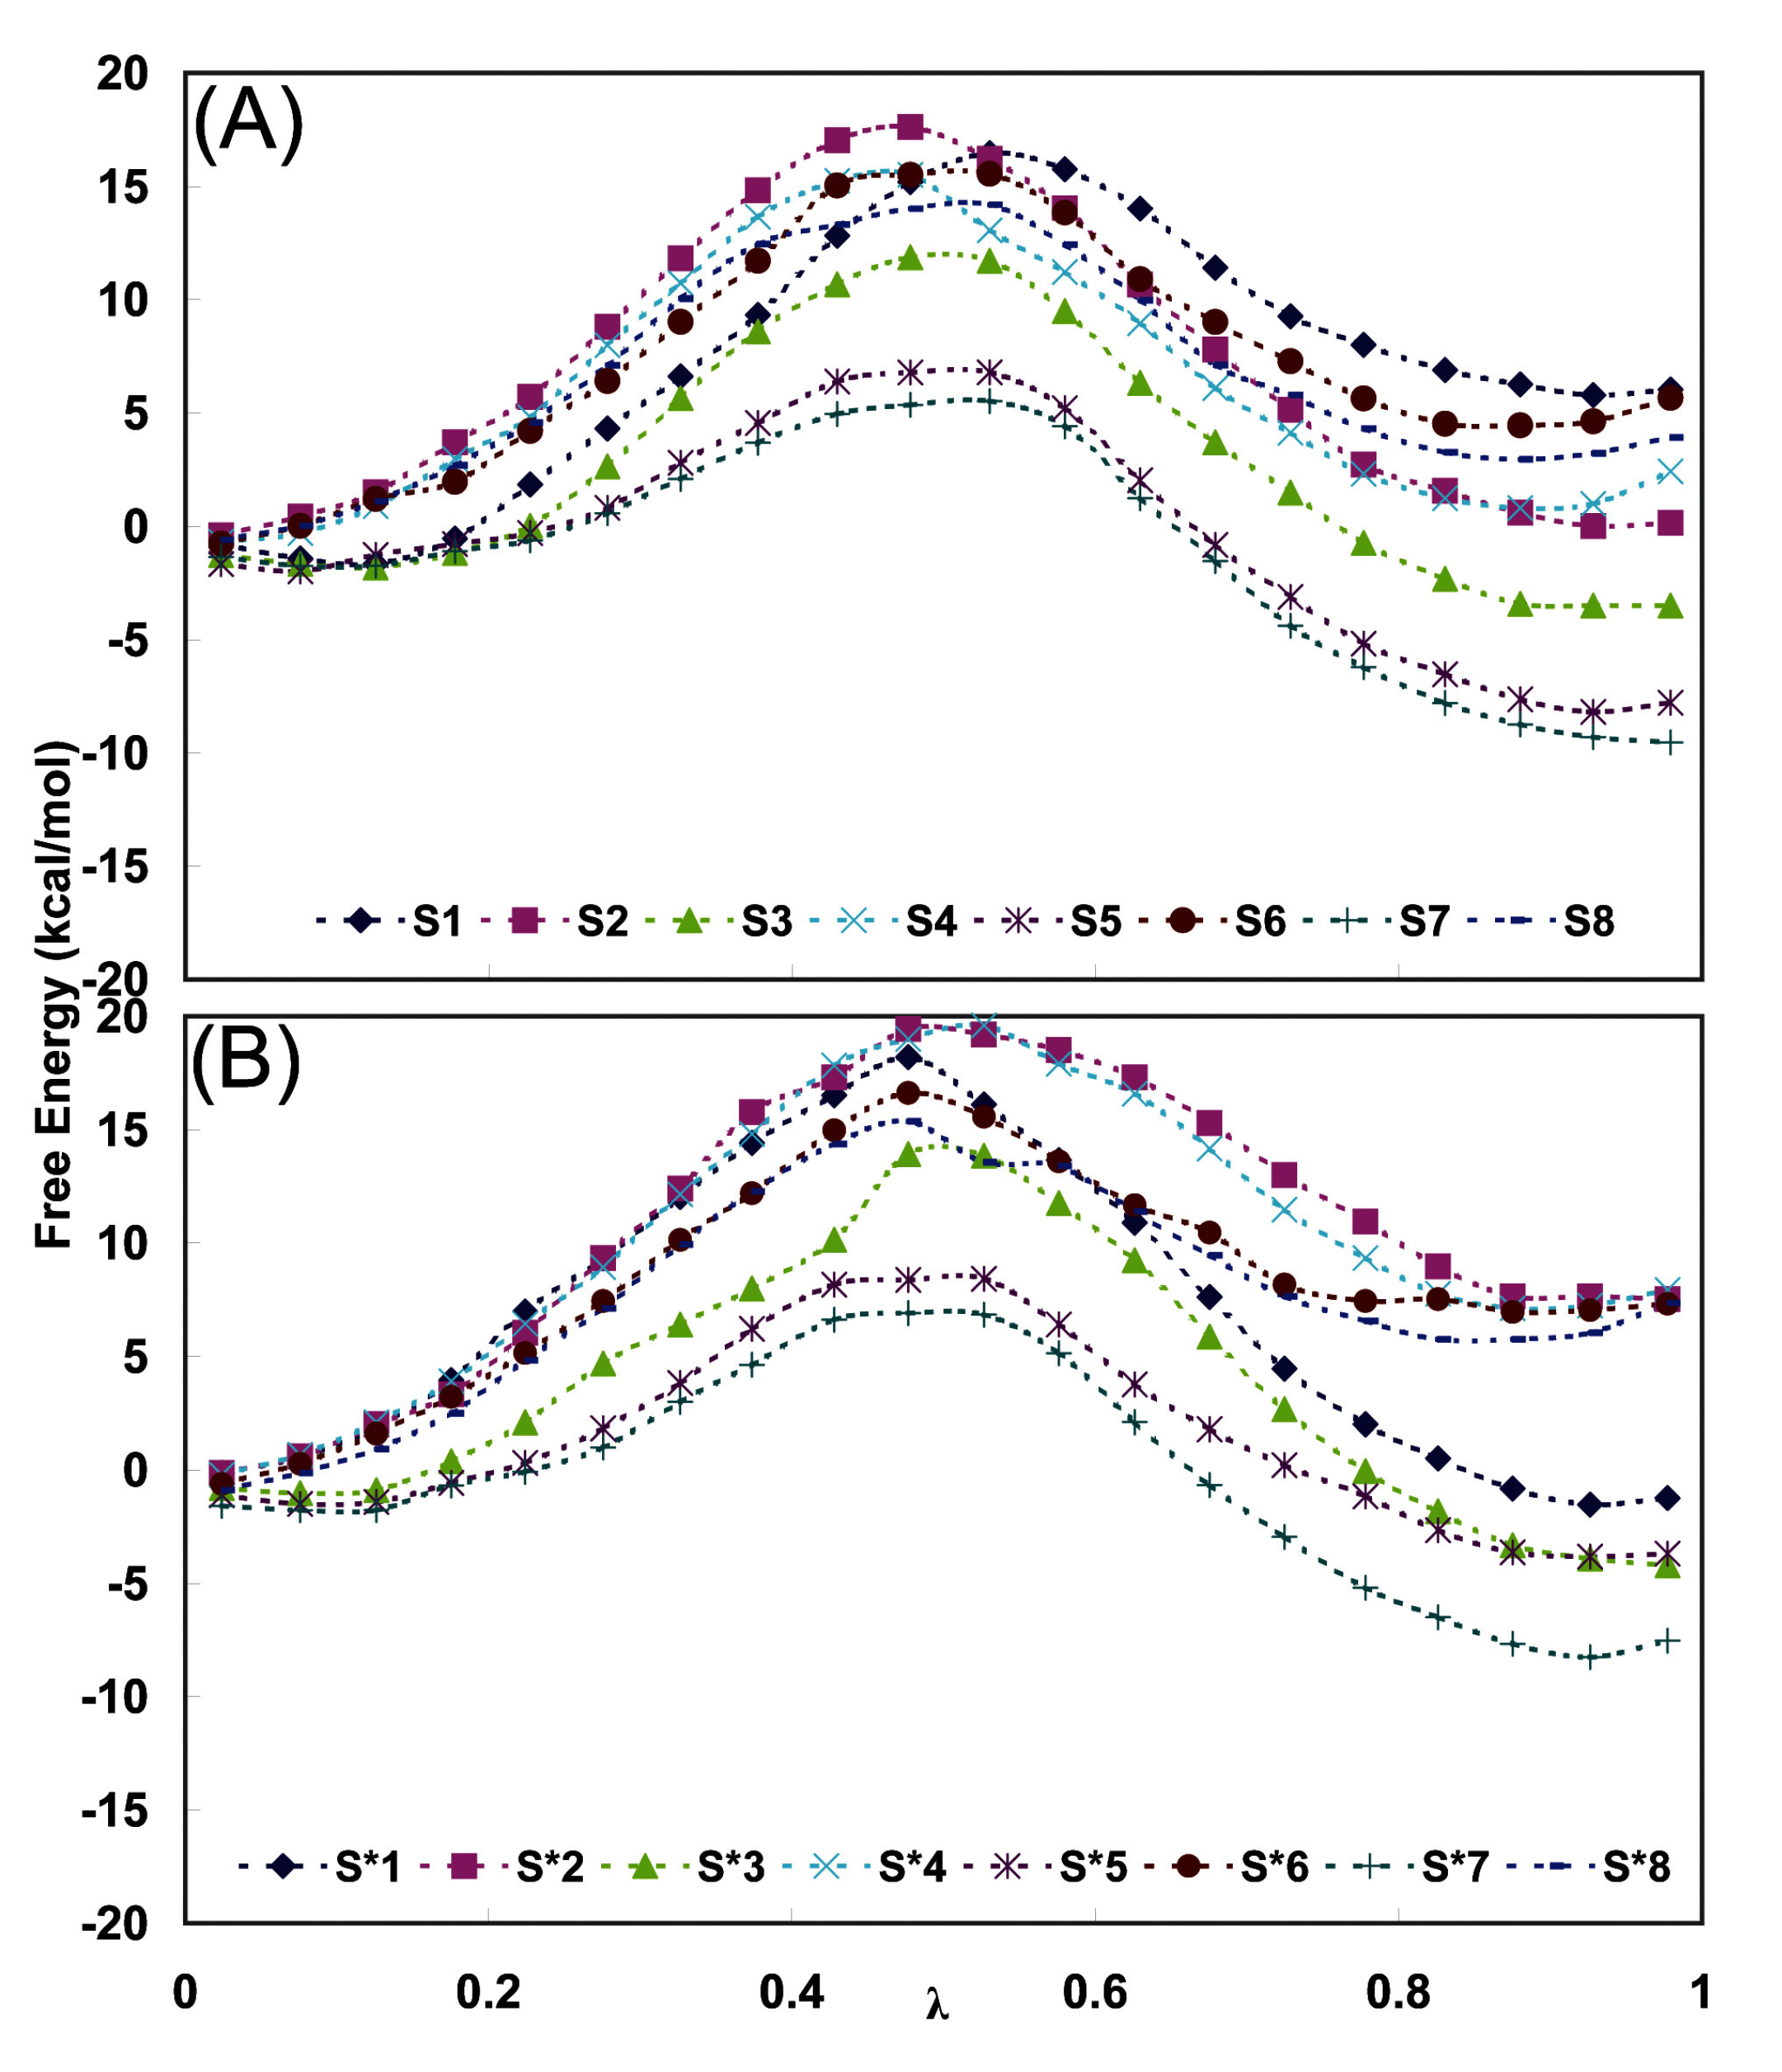
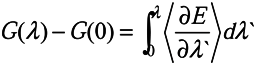
Figure 5.
Average free energy variation with λ during the thermodynamic integration of 500 ps run in the case of (A) EPF charges and (B) Mulliken charges during (2
R,4
S)F ↔ (2
S,4
S)F conversions
i. e. S and
S* series simulations described in
Table 3, respectively.
Figure 5.
Average free energy variation with λ during the thermodynamic integration of 500 ps run in the case of (A) EPF charges and (B) Mulliken charges during (2
R,4
S)F ↔ (2
S,4
S)F conversions
i. e. S and
S* series simulations described in
Table 3, respectively.
Figure 5 shows the free energy averaged over successive nanoseconds as a function of the integration parameter λ during various 500 ps runs. It can be seen that there is a systematic difference between the runs in the two directions and this hysteresis is a measure of the accuracy of the method. Additional errors in free energy integrations are discussed in [
44,
45,
46]. Consequently, the (2R,4S)F → (2S,4S)F and (2S,4S)F → (2R,4S)F integrations are averaged separately. The error in the final estimate is found by dividing the standard deviation between the four runs in each direction with the square root of the number of independent runs.
As a final estimate we take the averages over the (2R,4S)F ↔ (2S,4S)F runs with their appropriate signs. We then get a ΔG ALR2 value of - 2.0 kJ/mol for the S series using EPF charges and - 6.0 kJ/mol for the S* series using Mulliken charges with the signs for the (2R,4S)F to (2S,4S)F transition. The non-systematic errors in these numbers are estimated to ± 1.7 kJ/mol and ± 0.8 kJ/mol. In addition there is a systematic (hysteresis) difference between the (2R,4S)F → (2S,4S)F and (2S,4S)F → (2R,4S)F conversions of 2.9 and 2.0 kJ/mol, respectively.
The previous calculated free energy value [
34] falls within the error limits of the final estimate for the S series, while it is clearly different from the result of the S* series simulations. The simulations (S* series) with the Mulliken charges show relatively small fluctuations between different runs while those with EPF charges (S series) differ more. This suggests that the EPF charges (S series) give a better description of this system. When the Mulliken charges are increased, we get a more precise binding with less fluctuations, but this occurs at the cost of more free energy to accommodate the (2R,4S)-form compared to the (2S,4S)-form of fidarestat.
We now turn to a description of the structural changes that occur during the molecular dynamics. To describe these, we use distances between some important residues in ALR2 and the atoms of fidarestat, as shown in
Table 4. The orientation of the carbamoyl and the cyclic imide moiety, and the N1-C1-C2-O2 dihedral angle θ are also important quantities which are discussed below.
Table 4.
Average distances between the atoms of the fidarestat and the ALR2 active site
Table 4.
Average distances between the atoms of the fidarestat and the ALR2 active site
| Fidarestat | Classa | Residue | Atom | Classa | S series (Distb) | S* series (Distb) |
| | Hydrophilic Network |
| N3 | II | Tyr20 | OH | I | 3.7 ± 1.3 | 3.3 ± 0.3 |
| O3 | II | Tyr48 | OH | I | 2.8 ± 1.6 | 2.7 ± 0.5 |
| N3 or O3 | I or II | NADP+ | NO7 or NN1 | II or I | 3.3 ± 1.2 | 3.1 ± 0.6 |
| N3 or O4 | I or II | His110 | NE2 | I | 2.6 ± 0.9 | 2.5 ± 0.4 |
| O4 | II | Trp111 | NE1 | III | 2.8 ± 1.7 | 2.7 ± 0.2 |
| | Hydrophobic Network |
| N1 | I | Phe122 | N | III | 3.5 ± 1.5 | 3.3 ± 0.3 |
| O1 | I | Ser298 | N | III | 4.7 ± 1.1 | 4.6 ± 0.4 |
| N1 | I | Ala299 | N | III | 4.9 ± 1.4 | 3.7 ± 0.7 |
| N1 or O1 | I or II | Leu300 | N | III | 3.1 ± 0.5 | 3.0 ± 0.6 |
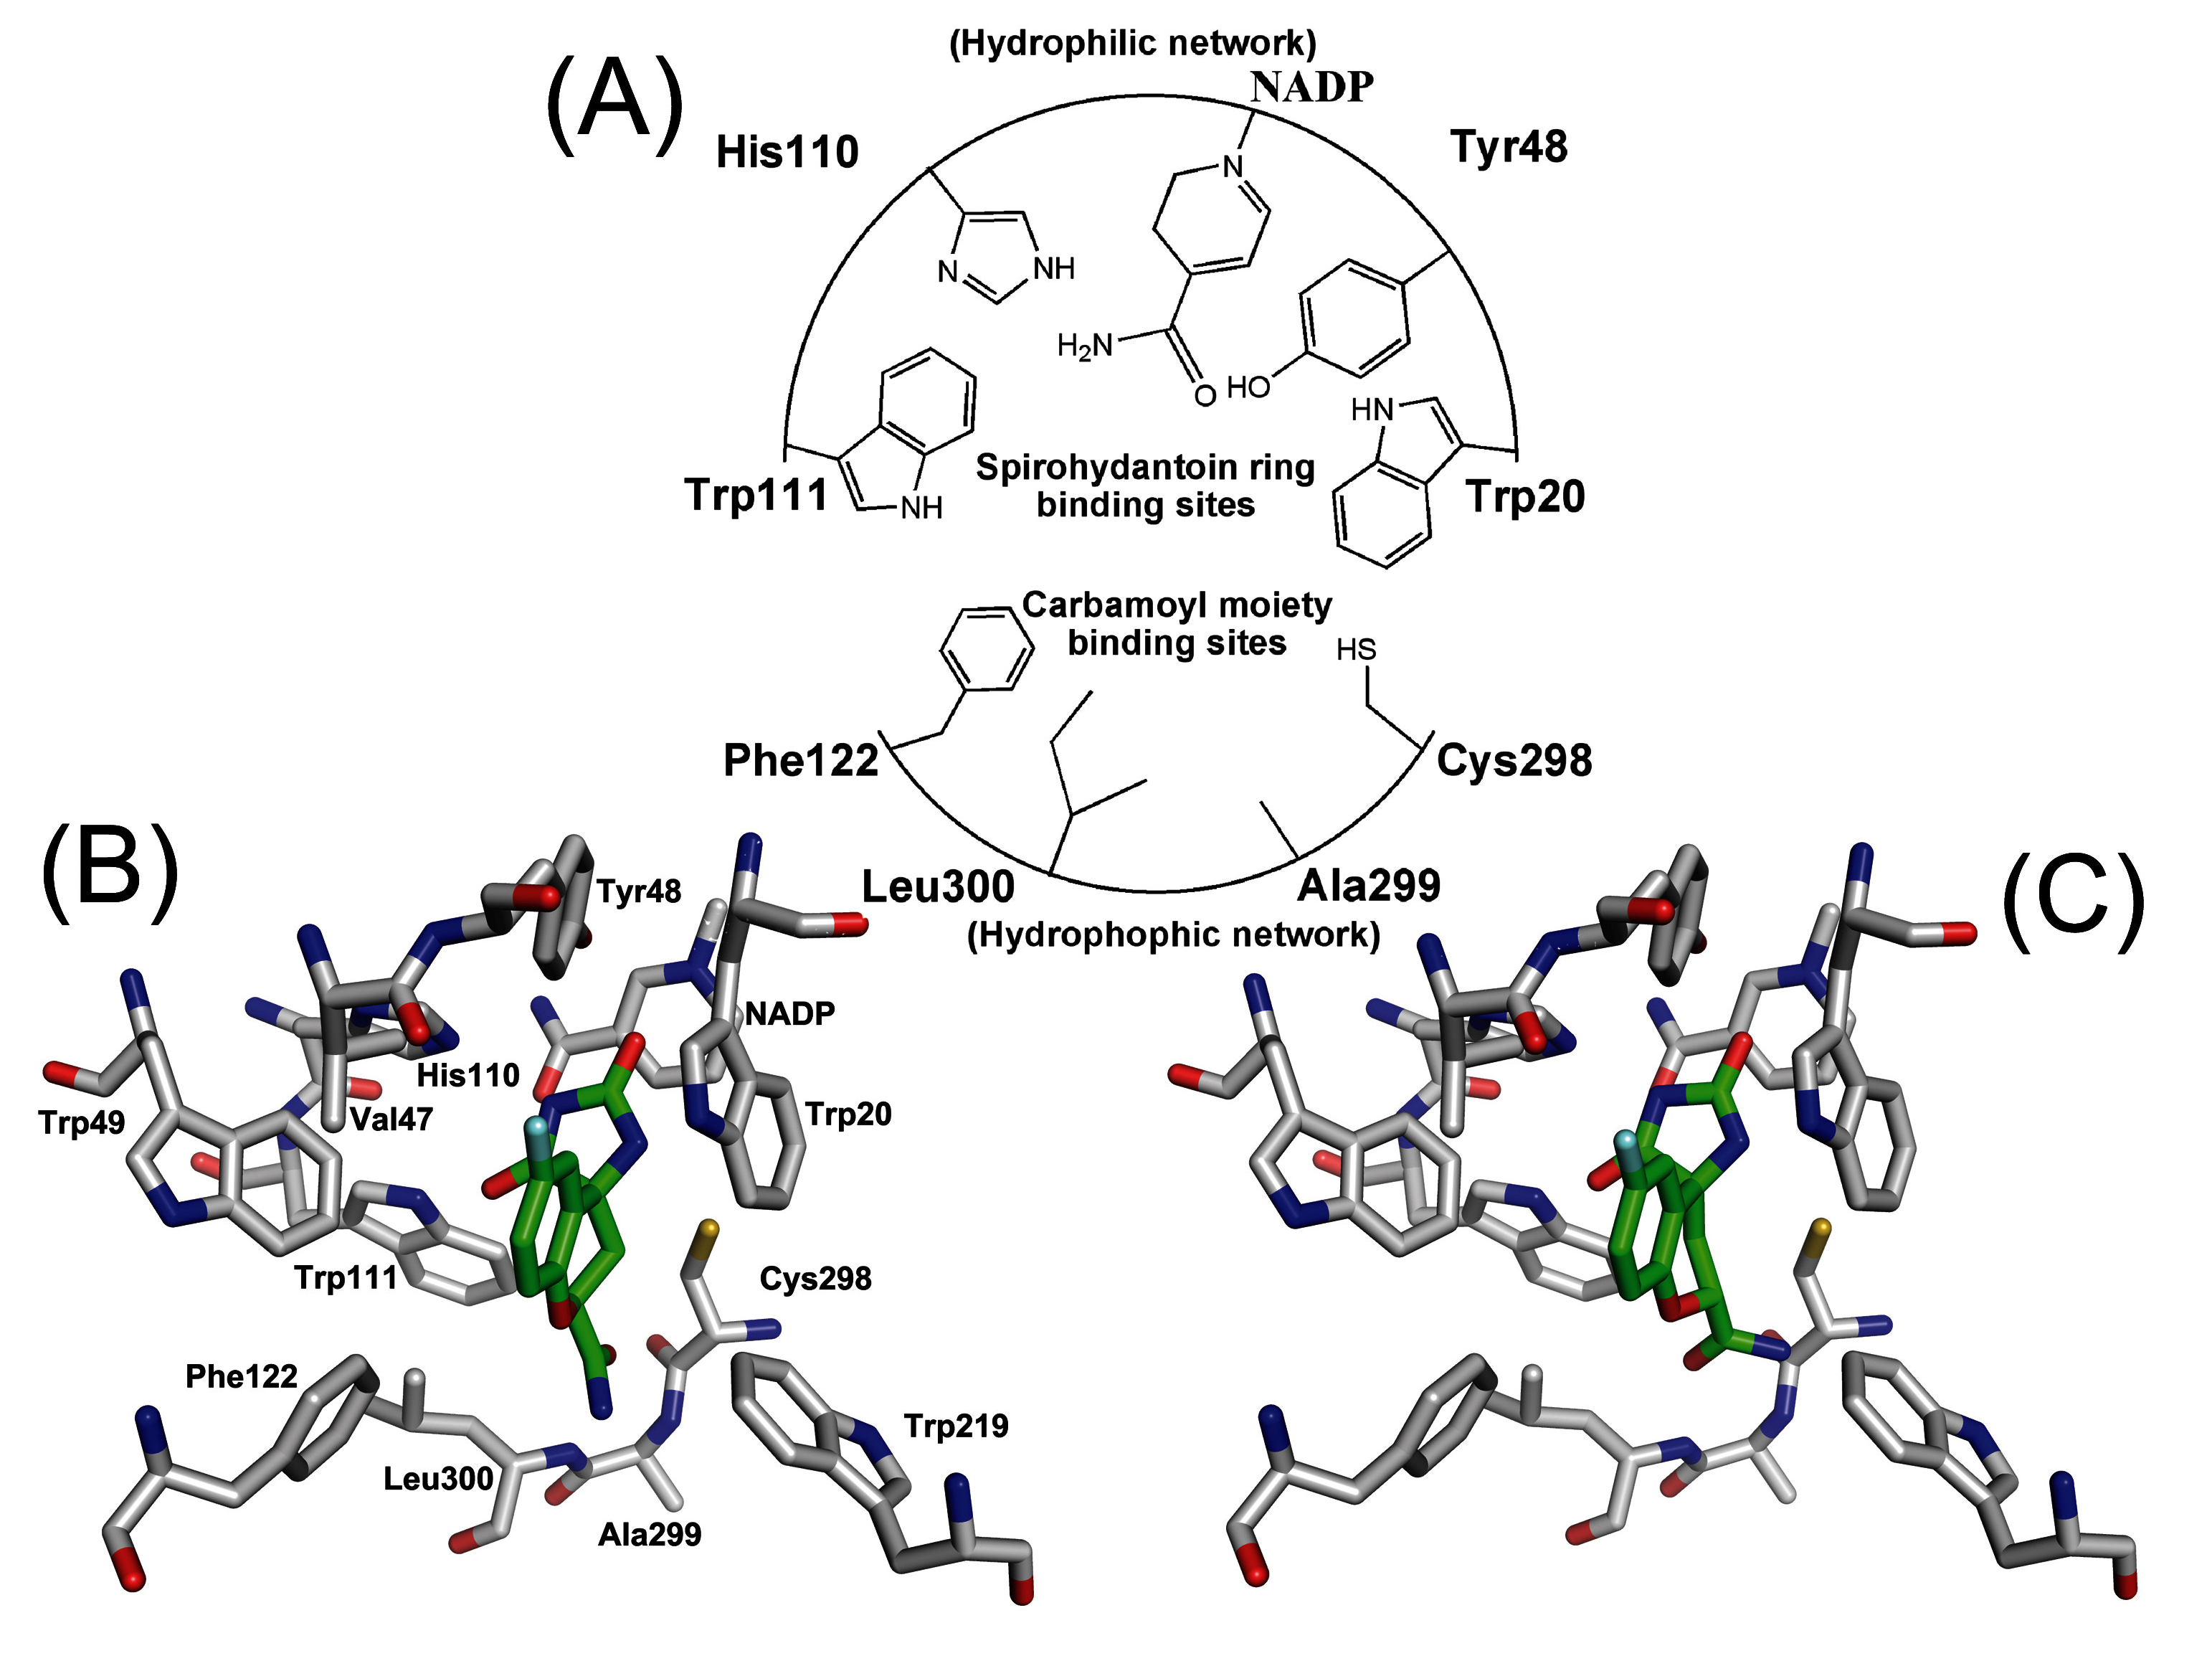
Figure 6.
(A) Schematic diagram depicting the pharmacophores of ALR2 consisted of the active residues. Stereoview of (B) (2S,4S)-Fidarestat and (C) (2R,4S)-Fidarestat bounded into the active site of ALR2. This is average structure from molecular dynamics simulation.
Figure 6.
(A) Schematic diagram depicting the pharmacophores of ALR2 consisted of the active residues. Stereoview of (B) (2S,4S)-Fidarestat and (C) (2R,4S)-Fidarestat bounded into the active site of ALR2. This is average structure from molecular dynamics simulation.
In the structures from the runs with the Mulliken charges (S* series), the carbamoyl moiety of the fidarestats stays fixed with C1 close to the hydrophobic network cavity formed by Phe122, Cys298, Ala299, and Leu300. The variation in these distances among the different S* structures is only about 0.5 Å. In contrast, the cyclic imide moiety of both fidarestats changes its position during the simulations (
Figure 6). In the first two structures it remains in the hydrophilic pocket close to Trp20 and Tyr48 but in subsequent simulations, it moves out of the pocket and over to the other side of the active site, near to His110 and Trp111. Once there, it moves only slightly back and forth during the remaining integration runs.
With EPF charges (S series), the carbamoyl group of the fidarestat appears to be attached less rigidly to the nearby region of Phe122. This is seen in
Table 4 as the distances to these residues are similar to the corresponding distances in the S* series of runs. Further, as a consequence of the weaker electrostatic interactions in the system with EPF charges, the fluctuations in these distances between different structures are now 0.5 - 1.7 Å compared to 0.2 - 0.7 Å in the S* series. In this case, the cyclic imide moiety of the fidarestats remains in the hydrophilic pocket close to NADP+ (
Figure 6).
3.3. Order parameter calculation
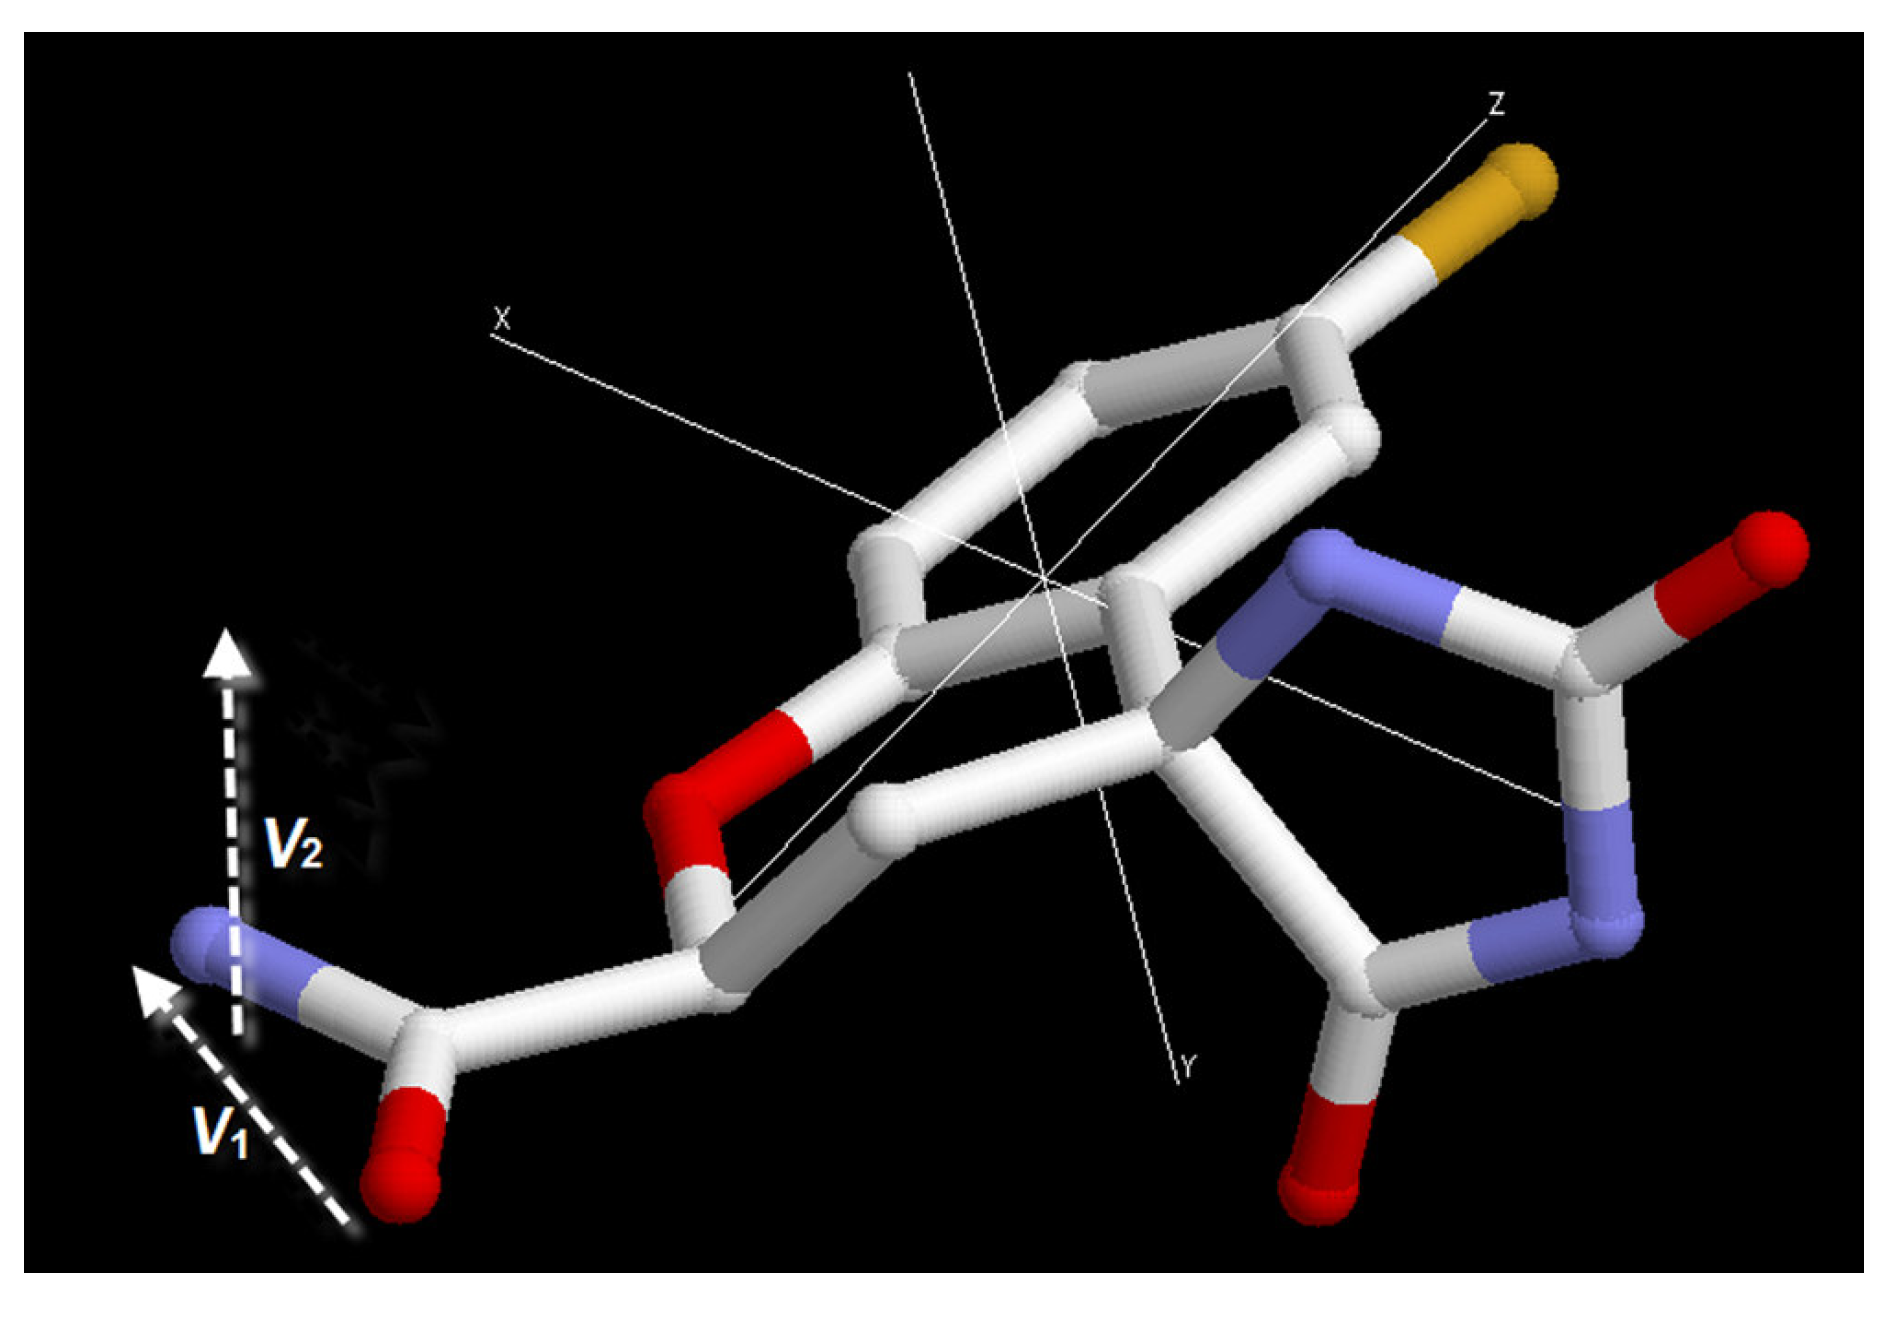
To describe the orientation of the fidarestat carbamoyl moiety in the active site we can use two vectors, one connecting the carboxyl-oxygen to the nitrogen and the other one perpendicular to the O
1-C
1-N
1 plane of the carbamoyl group (
Figure 7). To compare the orientation in a series of structures we define two order parameters,
SA and
SB, associated with these vectors in the following way. The vectors are first normalized and then averaged over the series of structures. The average lengths of the vectors obtained in this way are taken as the order parameters,
SA and
SB. If the orientation of the fidarestat is exactly the same in all structures, the order parameters will be 1 and the more different the orientations of the Fidarestat ring are in the different structures, the closer the order parameters will be to 0.
Figure 7.
A schematic representation of the vectors and the order parameters to define the orientation of the inhibitor at the active site. SA= |ΣV1/N|, SB= |ΣV2/N|, where N is the number of structures and V1 and V2 are the vectors.
Figure 7.
A schematic representation of the vectors and the order parameters to define the orientation of the inhibitor at the active site. SA= |ΣV1/N|, SB= |ΣV2/N|, where N is the number of structures and V1 and V2 are the vectors.
Table 5.
The order parameters SA and SB, as described in the text, calculated for normal and higher charged structures.
Table 5.
The order parameters SA and SB, as described in the text, calculated for normal and higher charged structures.
| Structures | SA | SB |
| S1∙∙∙ S8 (All strucutres) | 0.77 | 0.29 |
| S1, S3, S5, S7 (only (2S, 4S)-Fidarestat structures) | 0.81 | 0.65 |
| S2, S4, S6, S8 (only (2R, 4S)-Fidarestat structures) | 0.72 | 0.78 |
| S*1∙∙∙ S*8 (All strucutres) | 0.84 | 0.67 |
| S*1, S*3, S*5, S*7 (only (2S, 4S)-Fidarestat structures) | 0.79 | 0.88 |
| S*2, S*4, S*6, S*8 (only (2R, 4S)-Fidarestat structures) | 0.96 | 0.97 |
From
Table 5 it is seen that order parameter
SA, is fairly close to 1 both for the
S and
S* structures, indicating that the O
1-N
1 vector does not change orientation much during the integration runs. The
SB order parameter is much smaller, especially for the
S structures. This indicates that the carbamoyl plane has a quite different orientation in the different structures. However, if
SB is calculated separately for the (2
R,4
S) and (2
S,4
S) conformations, we get values that are closer to one. This suggests that stereoisomerization occurs by rotation of the carbamoyl plane through 70°, just as the (2
R,4
S) → (2
S,4
S) conversion is accomplished by changing the improper dihedral angle around the O
1-N
1 vector from +35° to -35°. The conversion occurs therefore with the ring fixed in the hydrophilic pocket and the free energy difference is small.
Table 6.
Dihedral angle (°) θ (N1-C1-C2-O2) from the simulations.
Table 6.
Dihedral angle (°) θ (N1-C1-C2-O2) from the simulations.
| Structures | EPF charges | Structures | Mulliken charges |
| | θ | Δθ | | θ | Δθ |
| S1 | 61 | | S*1 | 159 | |
| S2 | 38 | -22 | S*2 | 60 | -98 |
| S3 | 178 | 139 | S*3 | 161 | 100 |
| S4 | 65 | -114 | S*4 | 53 | -107 |
| S5 | -162 | 134 | S*5 | 75 | 23 |
| S6 | -177 | -16 | S*6 | 66 | -10 |
| S7 | -174 | 25 | S*7 | 77 | 9 |
| S8 | 175 | 159 | S*8 | -159 | 125 |
The (N
1-C
1-C
2-O
2) dihedral angle
θ for the different structures is shown in
Table 6. It lies close to one of the minima of the dihedral potential at ±60° or 180° for all the structures. If the changes of this dihedral angle during the isomerization are considered, it may be seen that the mechanism suggested previously can not explain the phenomenon. If the ring is kept fixed and the carbamoyl moiety is rotated 70° around the O
1-N
1 vector to achieve the isomerization, the dihedral
θ will change by +60° for the (2
R,4
S)F into (2
S,4
S)F conversion and -60° for the opposite transition. This can be calculated by the three-dimensional geometry and seen readily from a molecular model. That rotation will bring the dihedral from a potential minimum up on the top of a barrier, which is clearly unfavorable. The dihedral will therefore either remain in the initial well or make an additional 60° rotation over to reach the next well. This is also what is seen from
Table 6. For the (2
R,4
S)F → (2
S,4
S)F conversions we have Δ
θ approximately 0° or +120° while the change is 0° or -120° for the opposite transition. A single exception is that in which the (2
R,4
S)F → (2
S,4
S)F conversion involves a change in dihedral angle of +126°. In this case, the fidarestat ring changes orientation considerably.
3.4. Interaction energy between carbamoyl moiety and hydrophobic cavity
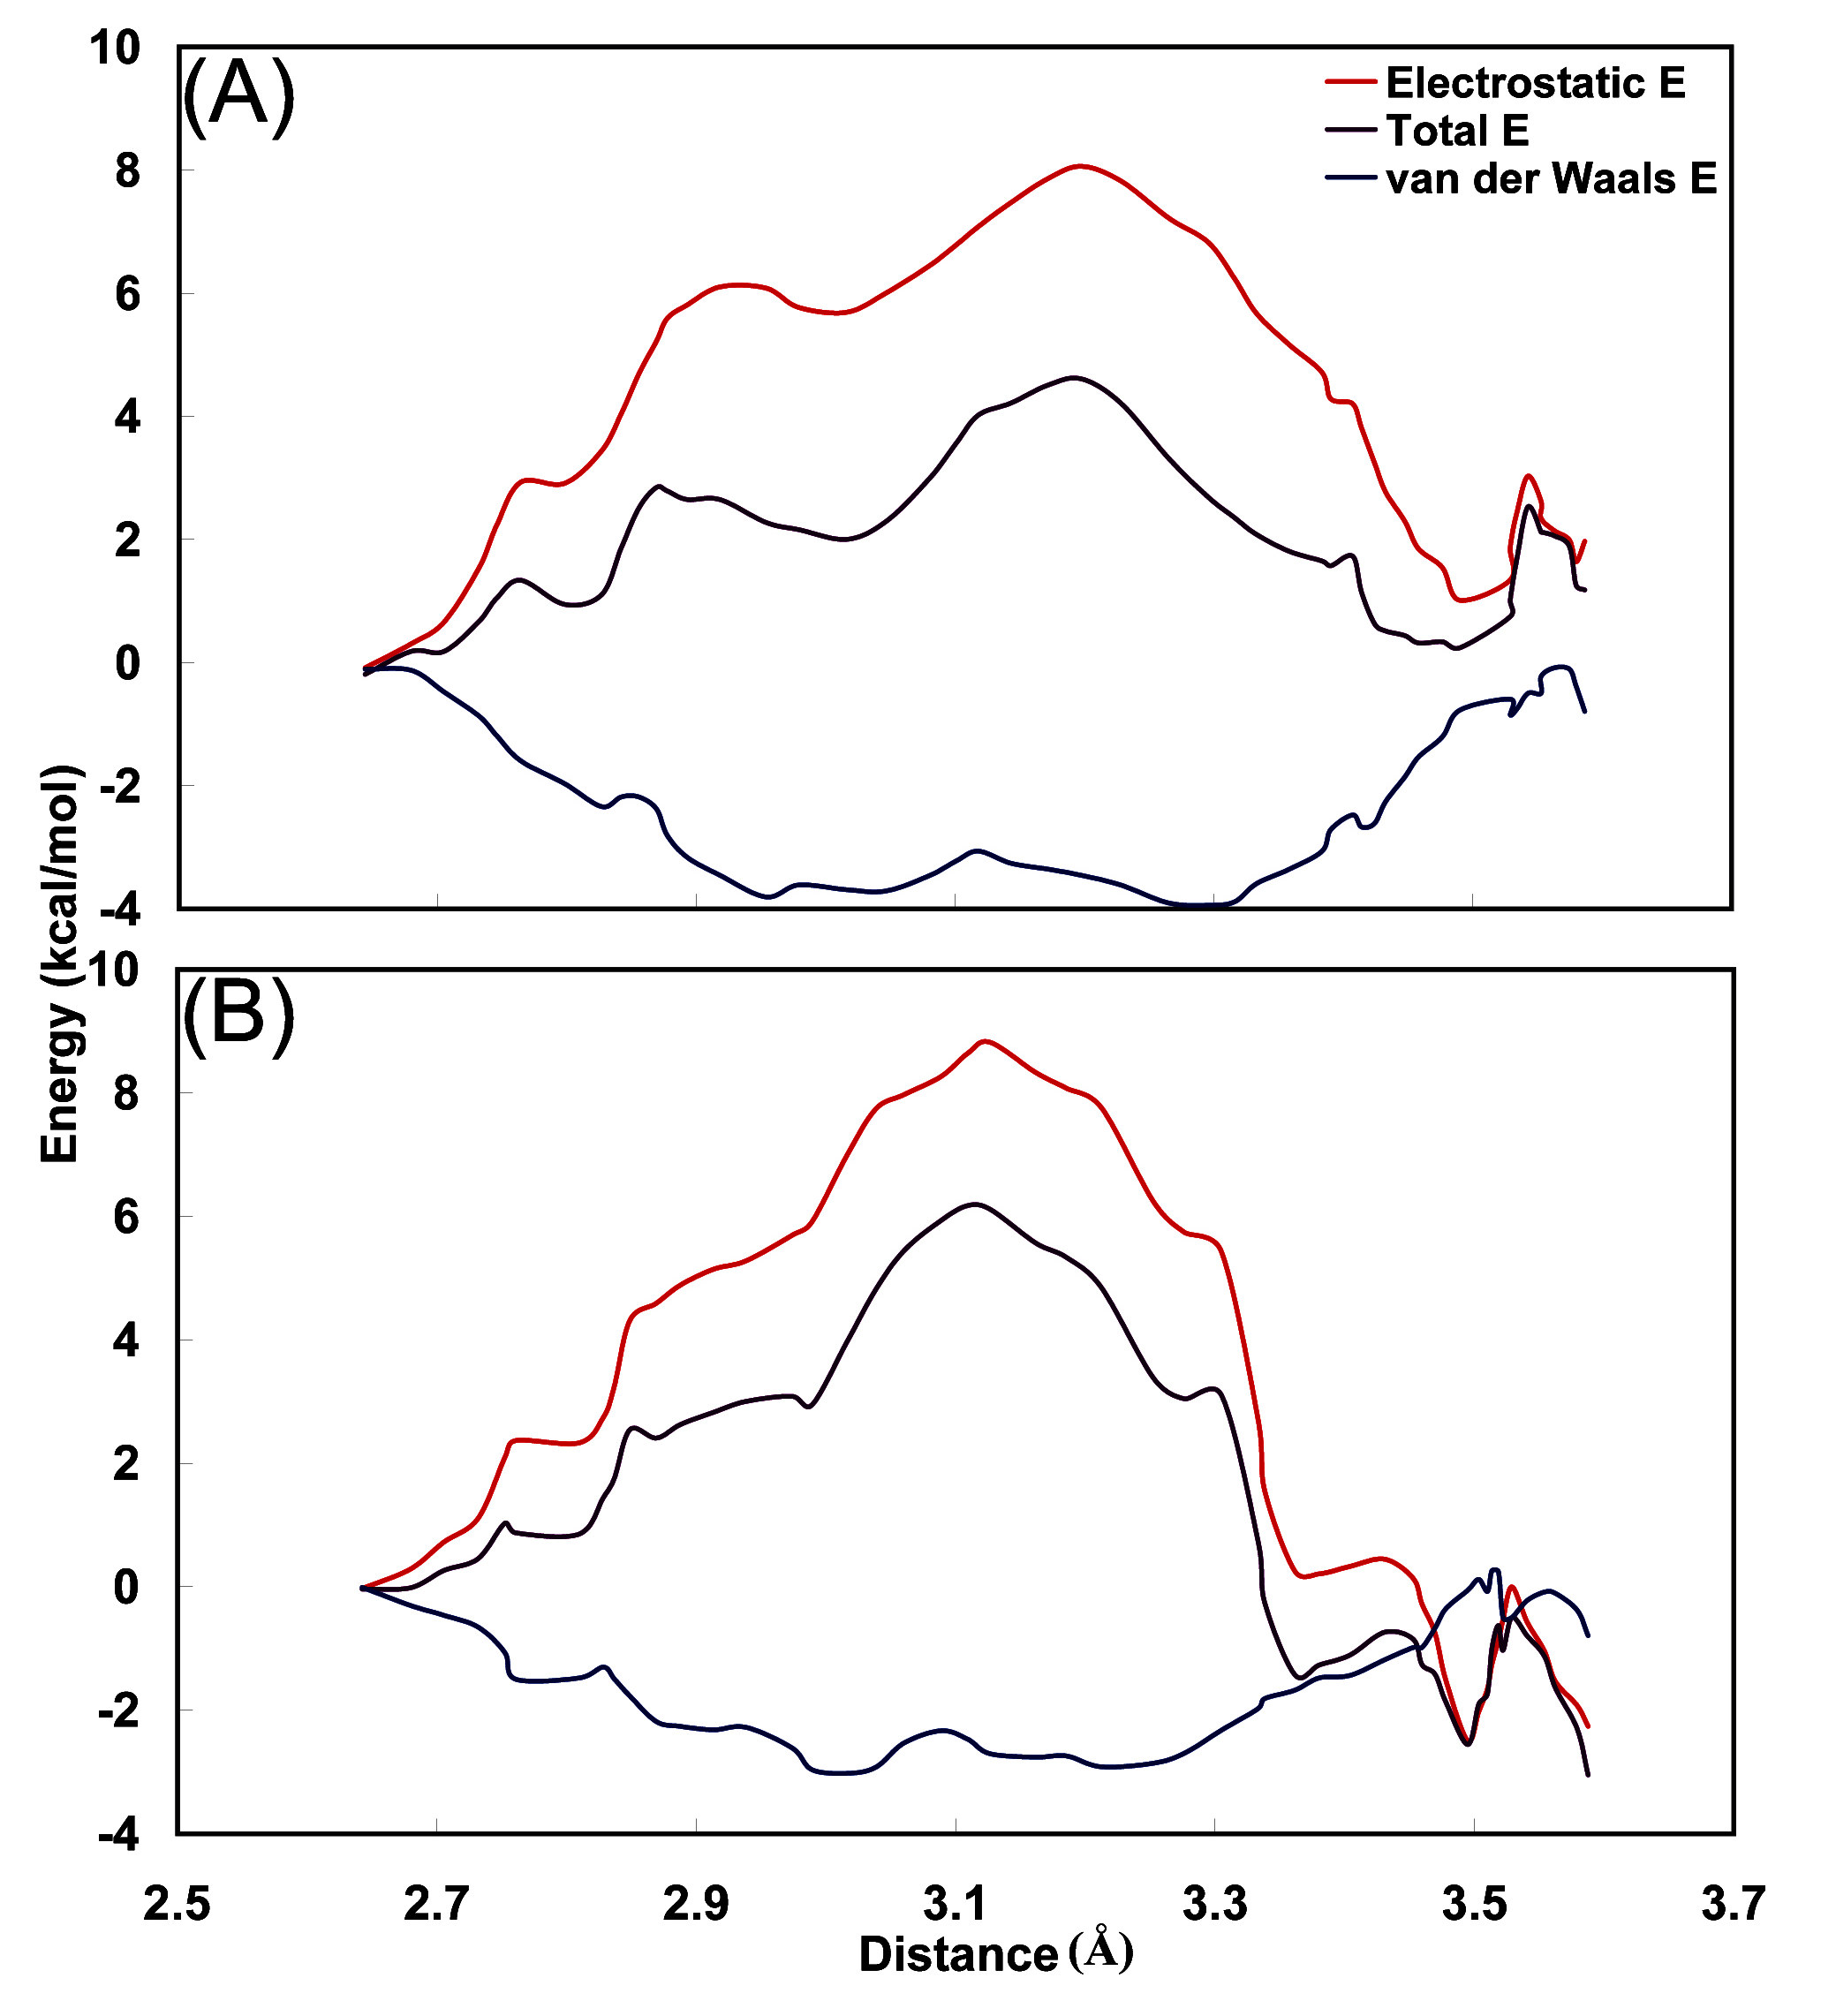
To interpret the differences between these free energy profiles, we calculated the average total interaction energy of carbamoyl group in fidarestat with its surrounding residues Phe122, Cys298, Ala299 and Leu300, using the trajectories of the free energy profile simulations. In the ALR2-Fidarestat complexes, the carbamoyl group is expected to be most often associated with Leu300 or Ala299. In
Figure 8, the energy profile, and its decomposition into van der Waals and electrostatic contributions are plotted as functions of the O
1(Fidarestat)-N(Leu300) distance. In both complexes, the total energy profile has a shape determined by the electrostatic interaction energy and similar to the corresponding free energy profile, with a barrier at intermediate distances and low values at the distances corresponding to Leu300 and Ala299. The interactions of the carbamoyl moiety with Leu300 and Ala299 stabilize the profile at the extreme positions, whereas the loss of electrostatic interactions at intermediate distances creates the large energy barrier. In the (2
S,4
S)F-ALR2 complex, inspection of the contributions from individual residues shows that the interaction with Leu300 is more stable energetically than that with Ala299 due to better interactions with residue Cys298, a result that is consistent with published observations [
34]. In the (2
R,4
S)F-ARL2 complex, Ala299 is more stable energetically and this is attributable to the electrostatic energy term. The main contribution to this stabilization is from interactions with residue Phe122 and Tyr123. The Cys298 residue favors the interaction of the carbamoyl moiety with Leu300, but to a smaller degree than in the (2
R,4
S)F-ALR2 complex.
Figure 8.
Change in the average energy of interaction between the carbamoyl moiety and surrounding residues, in the translocation of carbamoyl from the region of Leu300 to that of Ala299 in the (A) ALR2-(2R,4S)F and (B) ALR2-(2S,4S)F complex. The energy curves have been shifted to 0.0 at the point close to Leu300.
This analysis shows that the superior stabilization of the (2S,4S)F-ALR2 complex as compared to the (2R,4S)F-ALR2 complex stems from electrostatic interactions, particularly with Leu300. Inspection of the structures from the restrained-distance simulations, in which the carbamoyl moiety was restrained at Leu300, shows that the average distance between the carbamoyl moiety hydrogens and the backbone nitrogen of Leu300 is smaller in the (2S,4S)F-ALR2 complex. At the same time, the distance between atoms Leu300 N and Ala299 N is approximately 0.18 Å larger in the (2S,4S)F-ALR2 complex as a result of backbone dihedral angle distortion; this could contribute to the improved interactions between carbamoyl moiety and Leu300 in the (2S,4S)F-ALR2 complex.


 i, j = 1,…, N, where E(c1,…, cN) is the Hartree-Fock energy and c1,…, cN are the N = 3M - 6 independent internal coordinates, M being the number of atoms of the QM system. In the present case, M = 30. The terms used in the CHARMM force field correspond to the diagonal elements, ki,j divided by 2 (the factor 0.5 of the Taylor expansion for the energy is included in the force constant).

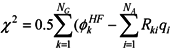 , where
  is the Hartree-Fock potential at the NG grid points,
  is the matrix of the inverse distances between the grid point rk and the ith atom position Ri with a partial charge qi, and NA is the number of atoms.