Binding of Fidarestat Stereoisomers with Aldose Reductase

Abstract
:1. Introduction

| Residues | (2S, 4S)-Fidarestat (IC50 = 0.035μM) | (2R, 4S)-Fidarestat (IC50 = 0.57μM) | ||||||||||
| Dista | CAb | HBc | ARd | PHe | DCf | Dista | CAb | HBc | ARd | PHe | DCf | |
| Trp20* | 3.3 | 61.3 | - | + | + | - | 3.2 | 46.5 | - | + | - | - |
| Val47* | 3.2 | 48.9 | - | - | + | - | 3.1 | 46.5 | - | - | + | - |
| Tyr48* | 2.6 | 30.0 | + | + | - | - | 2.5 | 32.5 | + | + | - | - |
| Trp79* | 3.6 | 7.6 | - | + | - | - | 3.5 | 8.1 | - | - | - | - |
| His110* | 2.8 | 26.6 | + | + | - | - | 2.7 | 32.2 | + | + | - | - |
| Trp111* | 2.8 | 32.5 | + | - | + | - | 2.8 | 32.4 | + | - | + | - |
| Phe122* | 3.8 | 28.3 | - | + | - | - | 3.7 | 35.9 | - | + | - | - |
| Trp219* | 3.6 | 27.1 | - | + | - | - | 3.0 | 45.0 | - | + | - | - |
| Cys298* | 3.4 | 34.0 | - | - | + | + | 3.0 | 33.1 | - | - | - | + |
| Ala299 | 4.9 | 0.4 | + | - | - | - | 3.7 | 3.2 | + | - | - | - |
| Leu300* | 2.9 | 50.7 | + | - | - | + | 2.8 | 39.8 | + | - | - | + |
| NADP+ | 3.0 | 34.0 | + | - | - | - | 2.9 | 34.1 | + | + | - | - |
2. Methods
2.1. Partial charge and force constant calculation for fidarestat
2.2. Molecular dynamics simulations
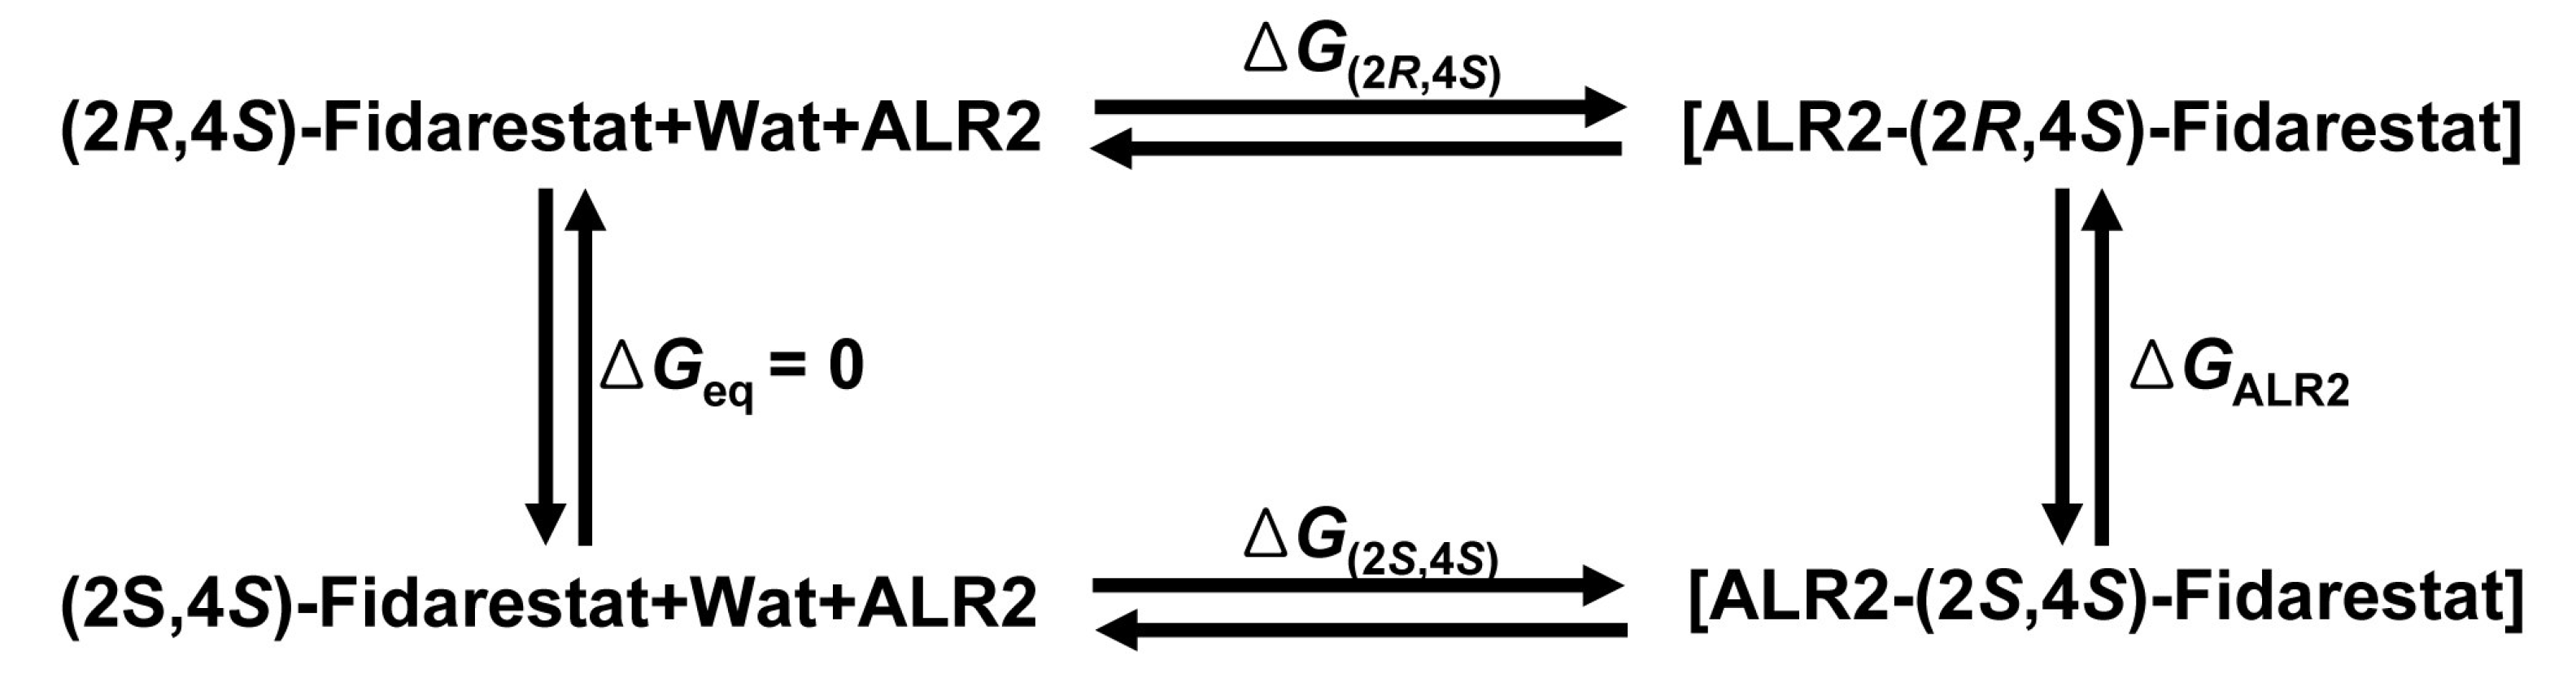
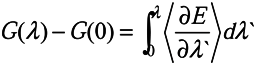
2.3. Free energy perturbation
3. Results and Discussion
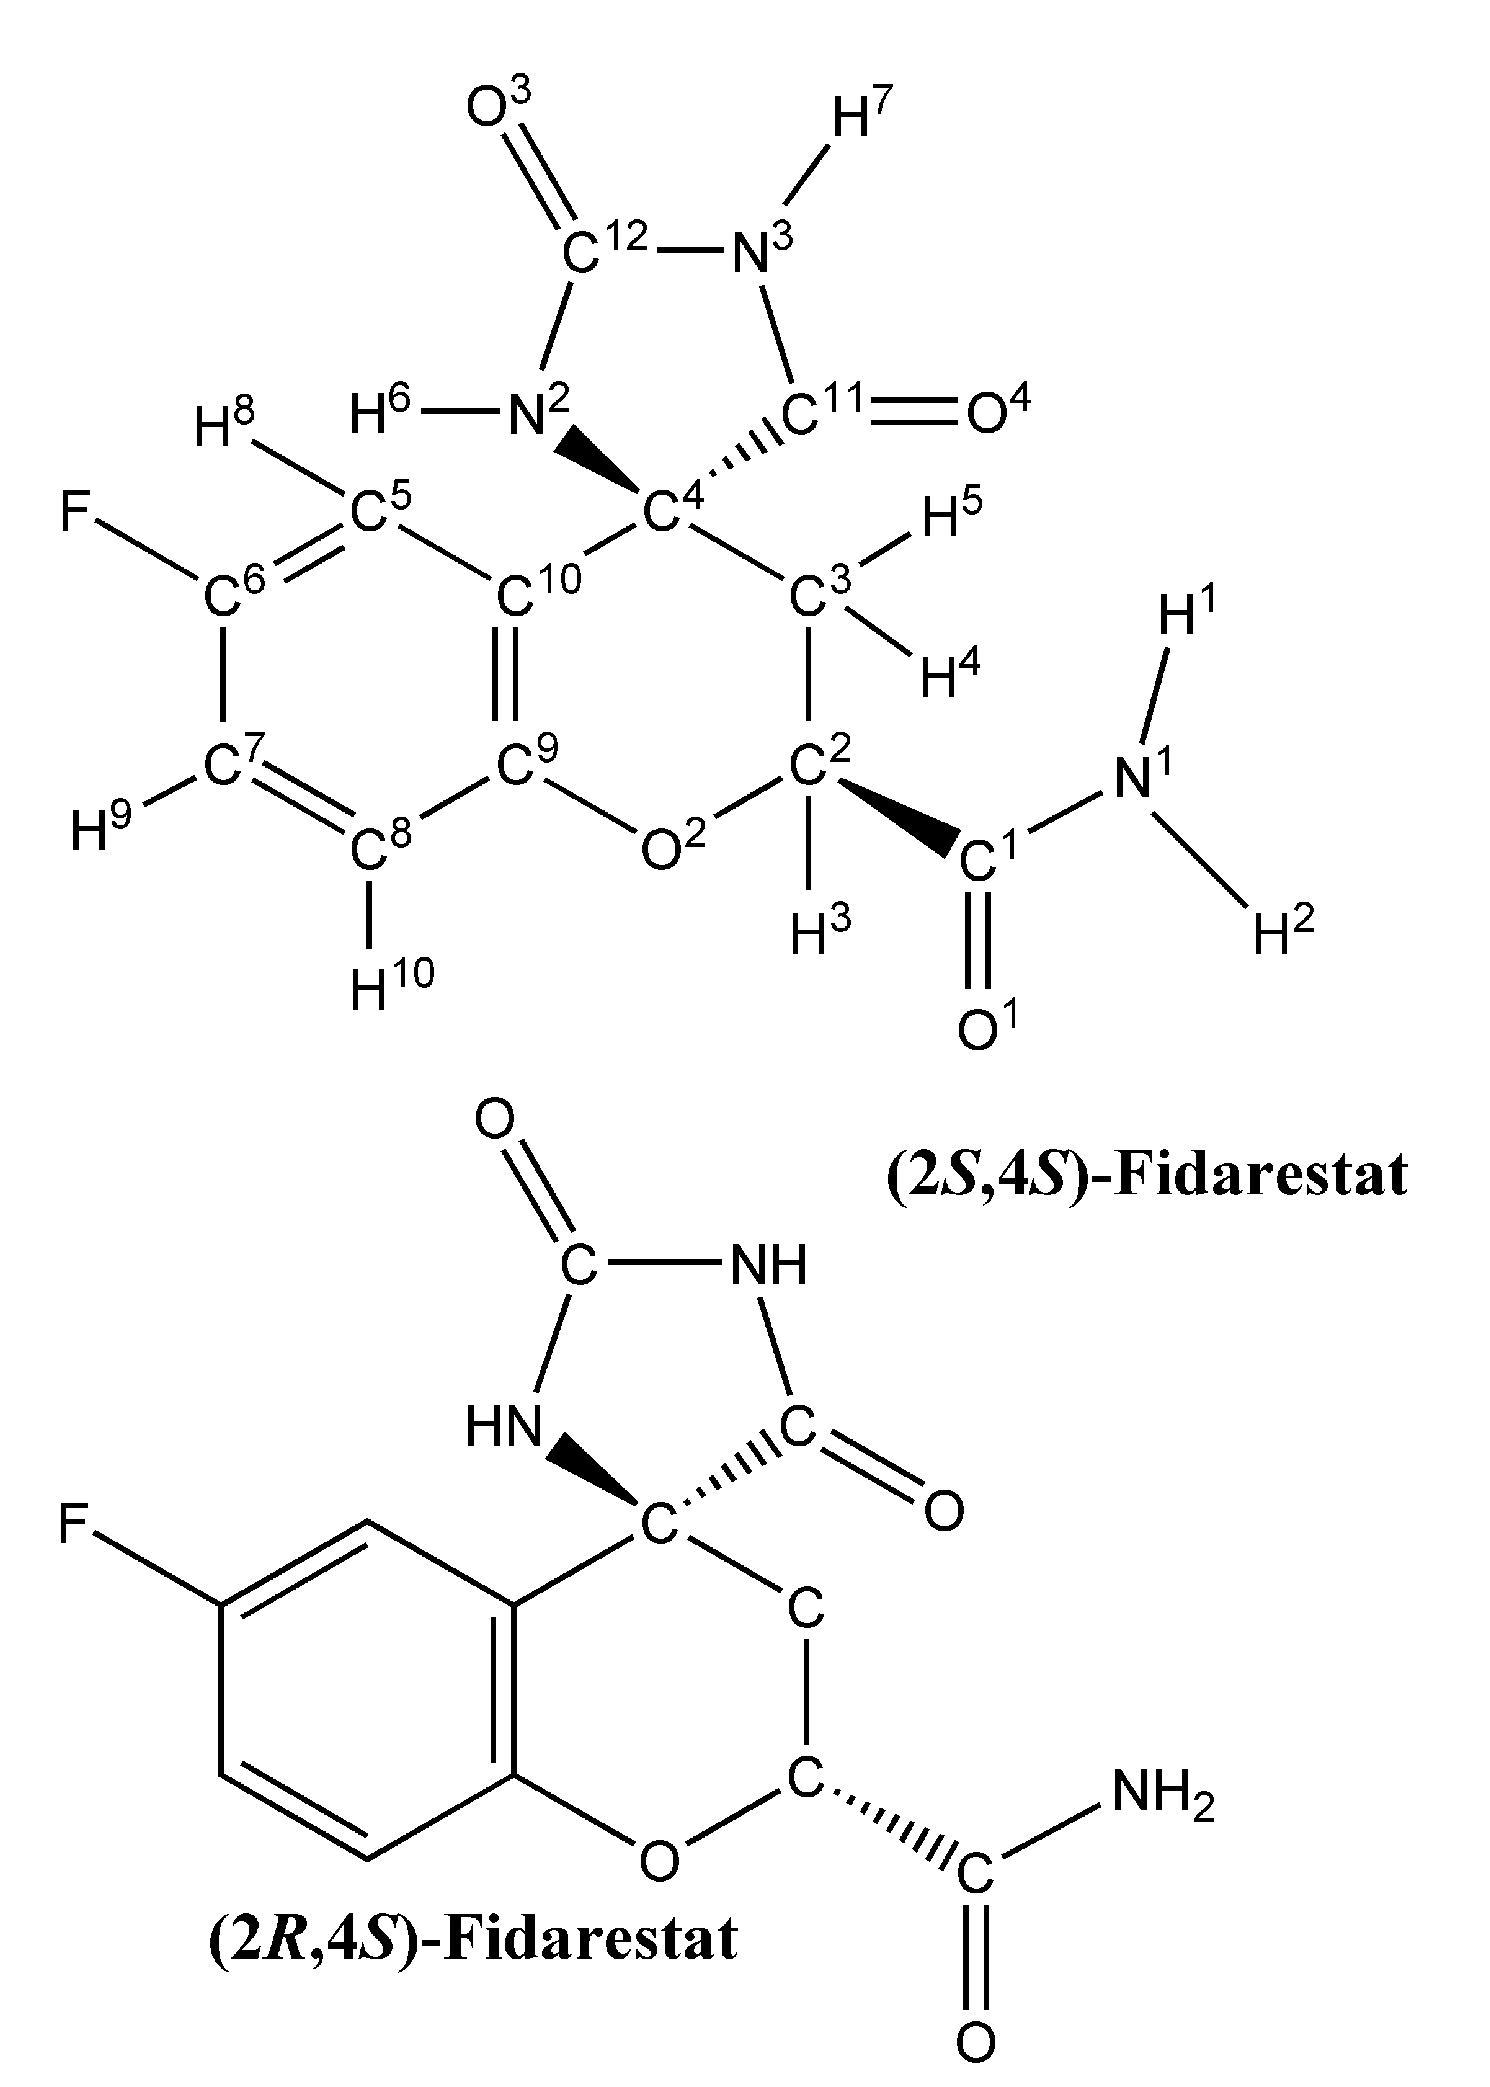
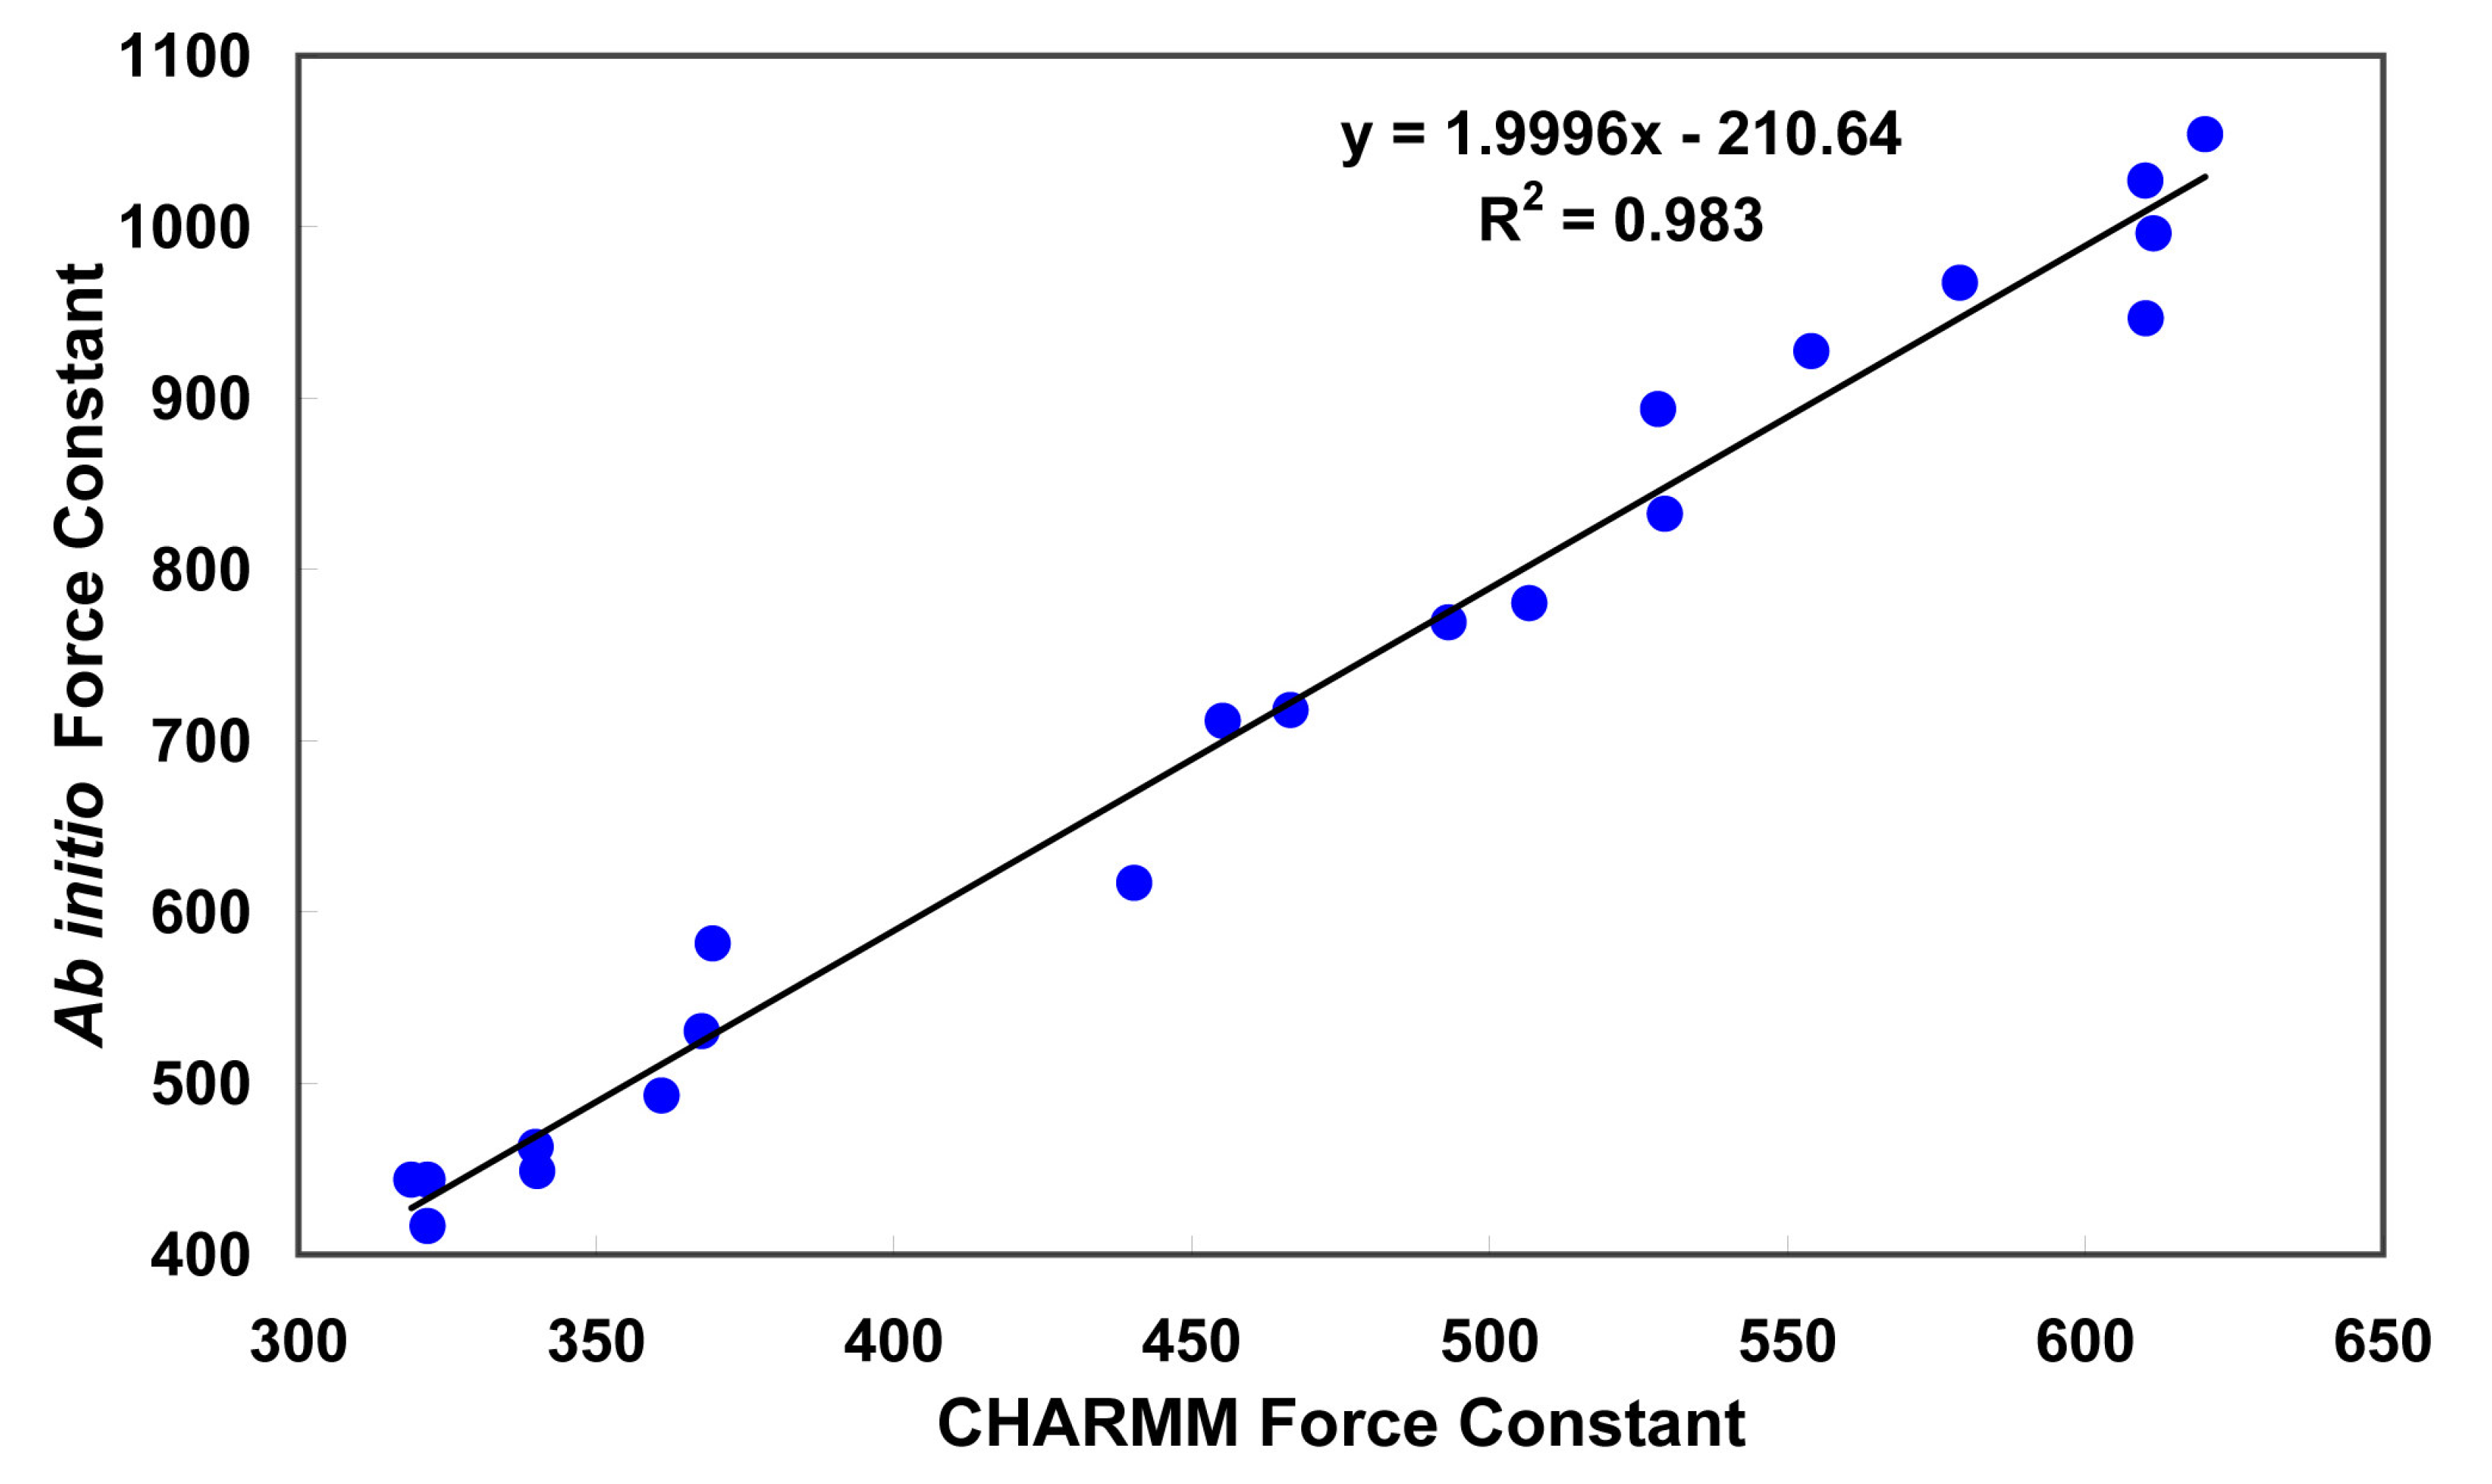
3.1. Partial charges and force constant for fidarestat atoms
 i, j = 1,…, N, where E(c1,…, cN) is the Hartree-Fock energy and c1,…, cN are the N = 3M - 6 independent internal coordinates, M being the number of atoms of the QM system. In the present case, M = 30. The terms used in the CHARMM force field correspond to the diagonal elements, ki,j divided by 2 (the factor 0.5 of the Taylor expansion for the energy is included in the force constant).
i, j = 1,…, N, where E(c1,…, cN) is the Hartree-Fock energy and c1,…, cN are the N = 3M - 6 independent internal coordinates, M being the number of atoms of the QM system. In the present case, M = 30. The terms used in the CHARMM force field correspond to the diagonal elements, ki,j divided by 2 (the factor 0.5 of the Taylor expansion for the energy is included in the force constant).
i, j = 1,…, N, where E(c1,…, cN) is the Hartree-Fock energy and c1,…, cN are the N = 3M - 6 independent internal coordinates, M being the number of atoms of the QM system. In the present case, M = 30. The terms used in the CHARMM force field correspond to the diagonal elements, ki,j divided by 2 (the factor 0.5 of the Taylor expansion for the energy is included in the force constant).
| Atom | Mulliken charges | EPF charges |
| N1 | -0.492316 | -0.135382 |
| H1 | 0.800010 | 0.219992 |
| H2 | 0.800010 | 0.219992 |
| C1 | 0.307696 | 0.084615 |
| O1 | -1.784636 | -0.490770 |
| C2 | 0.861549 | 0.236923 |
| H3 | 0.430774 | 0.118462 |
| O2 | -1.600019 | -0.439999 |
| C3 | 0.061540 | 0.016923 |
| H4 | 0.184618 | 0.050769 |
| H5 | 0.184618 | 0.050769 |
| C4 | 0.800010 | 0.219992 |
| N2 | -0.307696 | -0.084622 |
| H6 | 0.800010 | 0.219992 |
| C12 | 0.030770 | 0.008462 |
| O3 | -1.784637 | -0.490769 |
| N3 | 0.492314 | 0.135385 |
| H7 | 0.861549 | 0.236923 |
| C11 | 0.615392 | 0.169231 |
| O4 | -1.723098 | -0.473846 |
| C5 | 0.061540 | 0.016923 |
| H8 | 0.430774 | 0.118462 |
| C6 | 0.061540 | 0.016923 |
| F | -1.046166 | -0.287692 |
| C7 | 0.030770 | 0.008462 |
| H9 | 0.430774 | 0.118462 |
| C8 | -0.061540 | -0.016923 |
| H10 | 0.430774 | 0.118462 |
| C9 | 0.061540 | 0.016923 |
| C10 | 0.061540 | 0.016923 |
 , where
  is the Hartree-Fock potential at the NG grid points,
  is the matrix of the inverse distances between the grid point rk and the ith atom position Ri with a partial charge qi, and NA is the number of atoms.
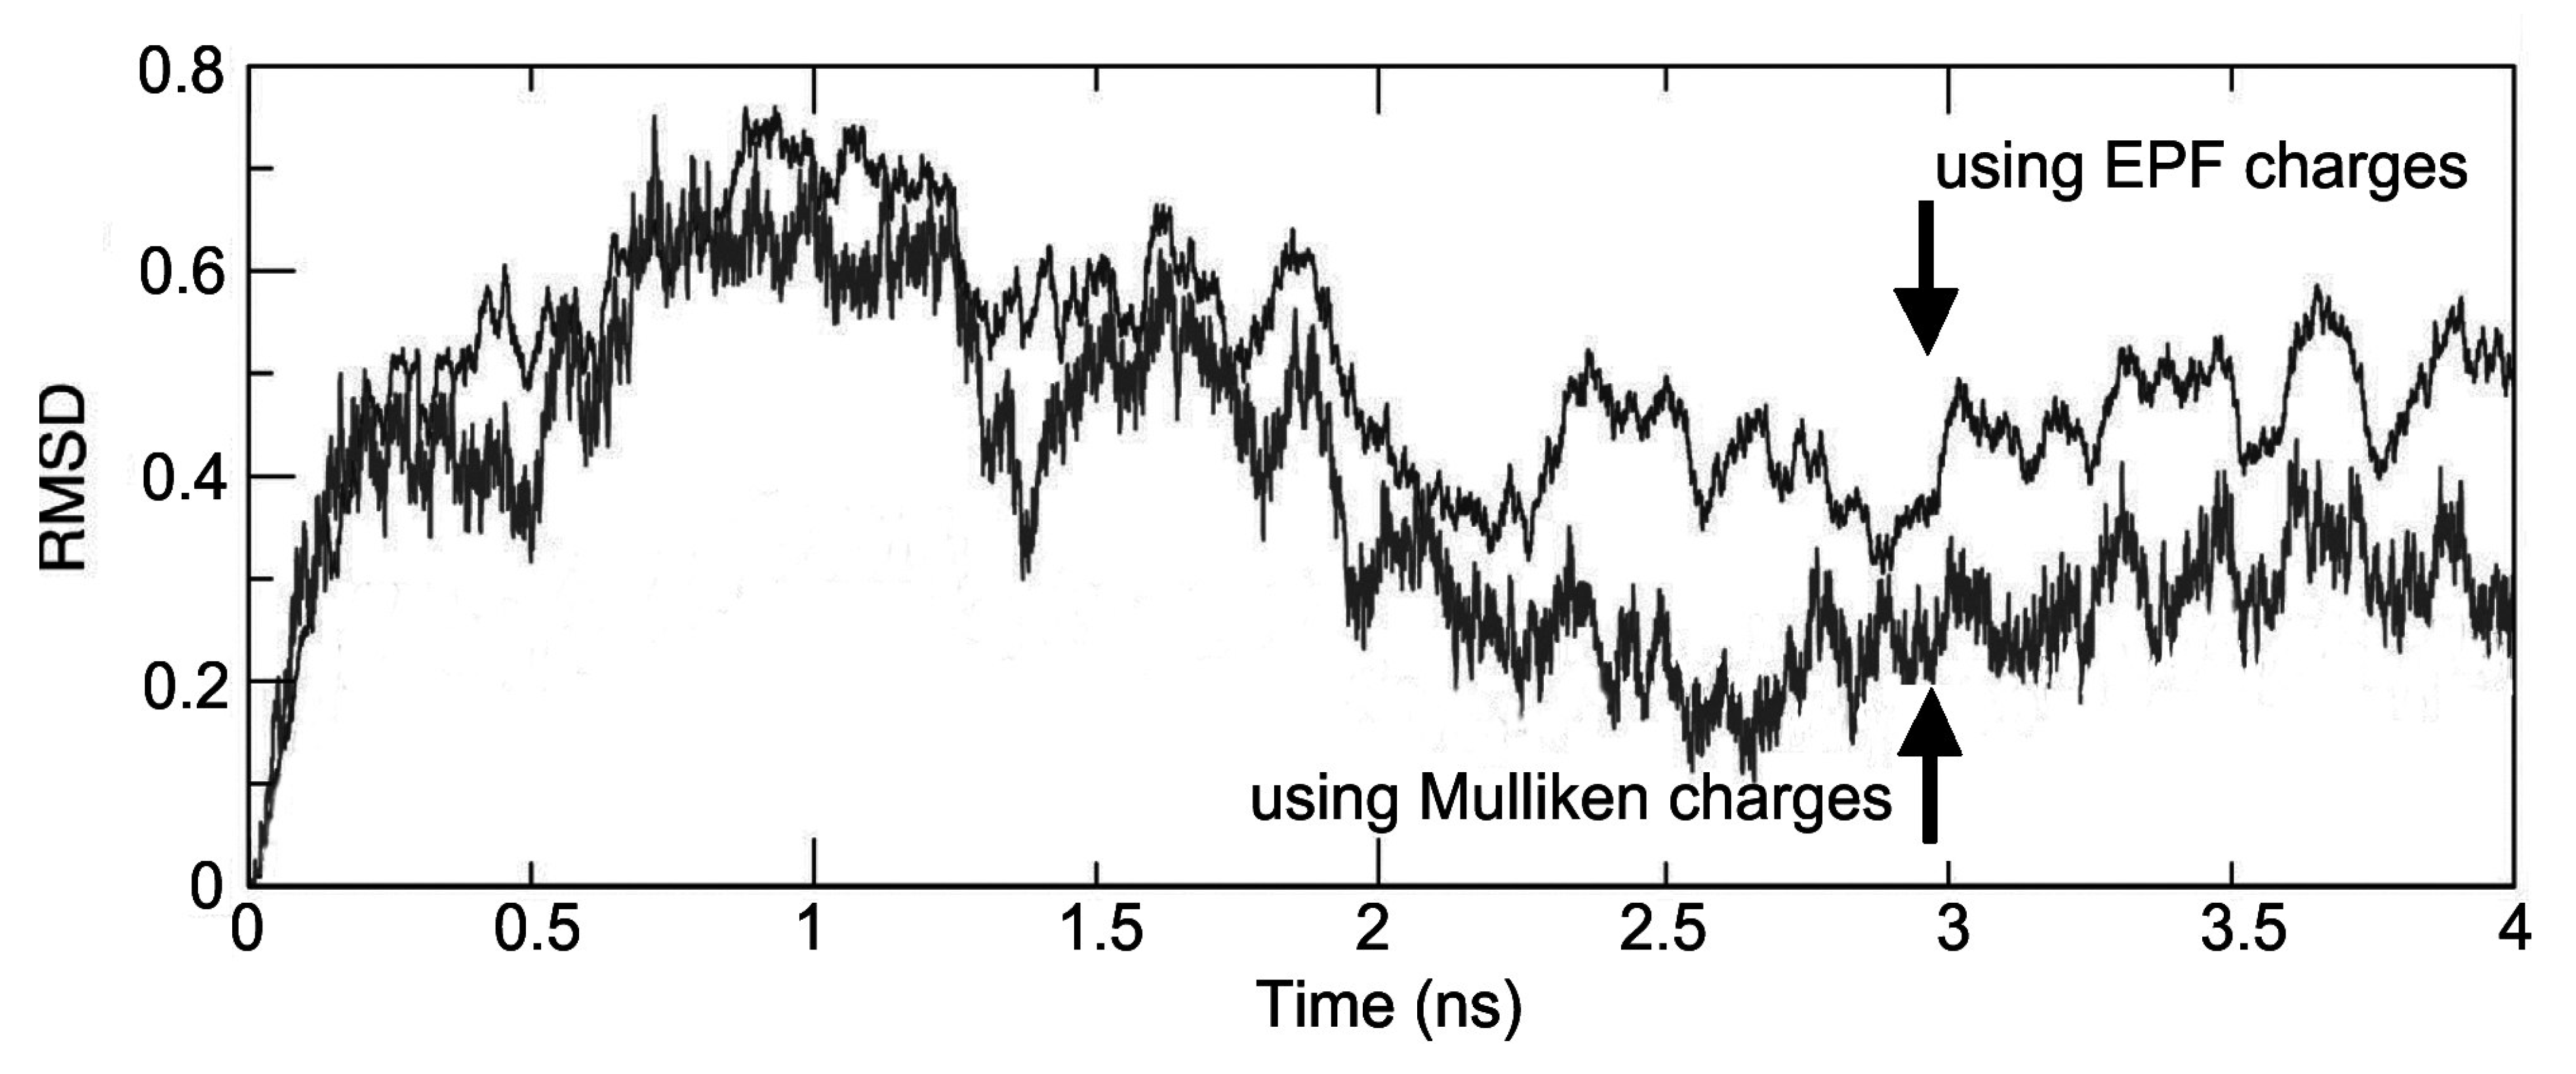
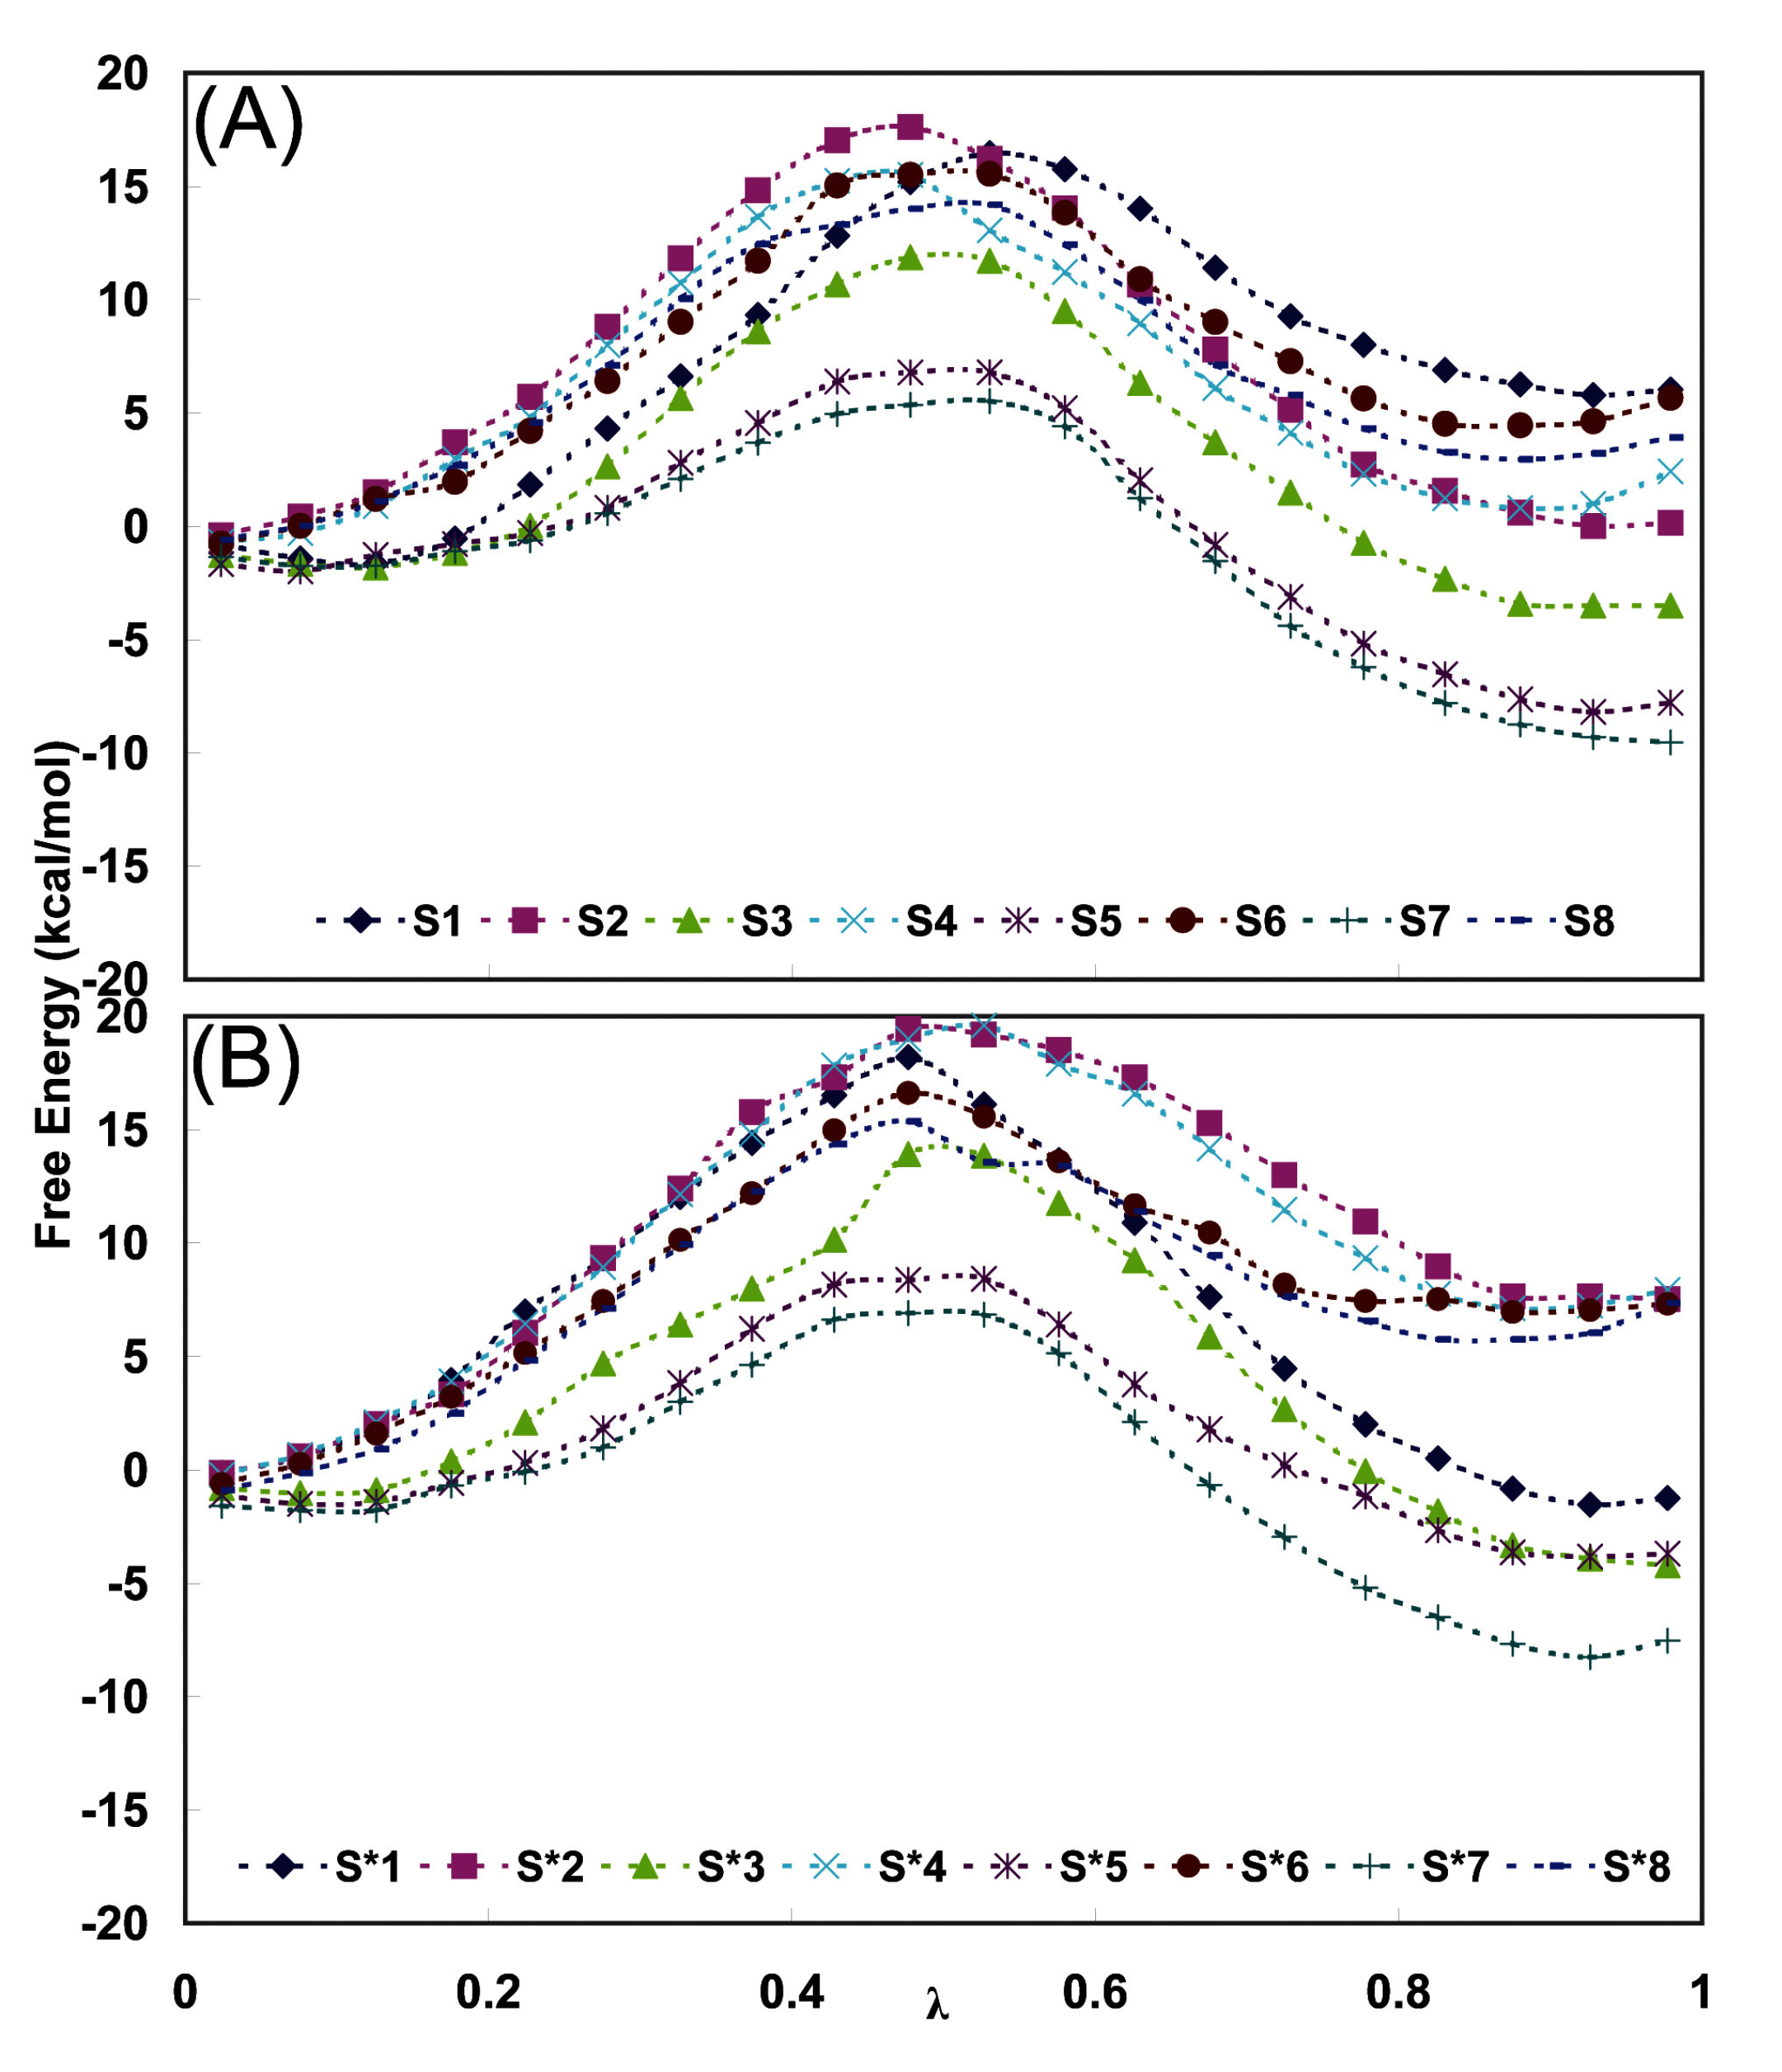
3.2. Molecular dynamics and Free Energy calculation

| Time(ns) | EPF charges | Mulliken charges | ||
| Final Conformation | <Δ ΔG> (kJ/mol) | Final Conformation | <Δ ΔG> (kJ/mol) | |
| 0.5 | S1(2R,4S)→(2S,4S) | +6.19 | S*1(2R,4S)→(2S,4S) | -1.20 |
| 1.0 | S2(2S,4S) →(2R,4S) | +6.10 | S*2(2S,4S)→(2R,4S) | +8.12 |
| 1.5 | S3(2R,4S)→(2S,4S) | -3.26 | S*3(2R,4S)→(2S,4S) | -4.05 |
| 2.0 | S4(2S,4S) →(2R,4S) | +2,77 | S*4(2S,4S)→(2R,4S) | +9.19 |
| 2.5 | S5(2R,4S)→(2S,4S) | +4.89 | S*5(2R,4S)→(2S,4S) | -7.40 |
| 3.0 | S6(2S,4S) →(2R,4S) | +0.50 | S*6(2S,4S)→(2R,4S) | +7.61 |
| 3.5 | S7(2R,4S)→(2S,4S) | -1.40 | S*7(2R,4S)→(2S,4S) | -3.49 |
| 4.0 | S8(2S,4S) →(2R,4S) | +7.40 | S*8(2S,4S)→(2R,4S) | +7.61 |
| Average of all | ||||
| (2R,4S) → (2S,4S) | +0.9 ± 4.1 | (2R,4S) → (2S,4S) | -4.0 ± 2.2 | |
| (2S,4S) → (2R,4S) | +4.9 ± 2.7 | (2S,4S) → (2R,4S) | +8.1 ± 0.7 | |
| Final average | ||||
| (2R,4S) → (2S,4S) | -2.0 ± 1.7 | (2R,4S) → (2S,4S) | -6.0 ± 0.8 | |
| Fidarestat | Classa | Residue | Atom | Classa | S series (Distb) | S* series (Distb) |
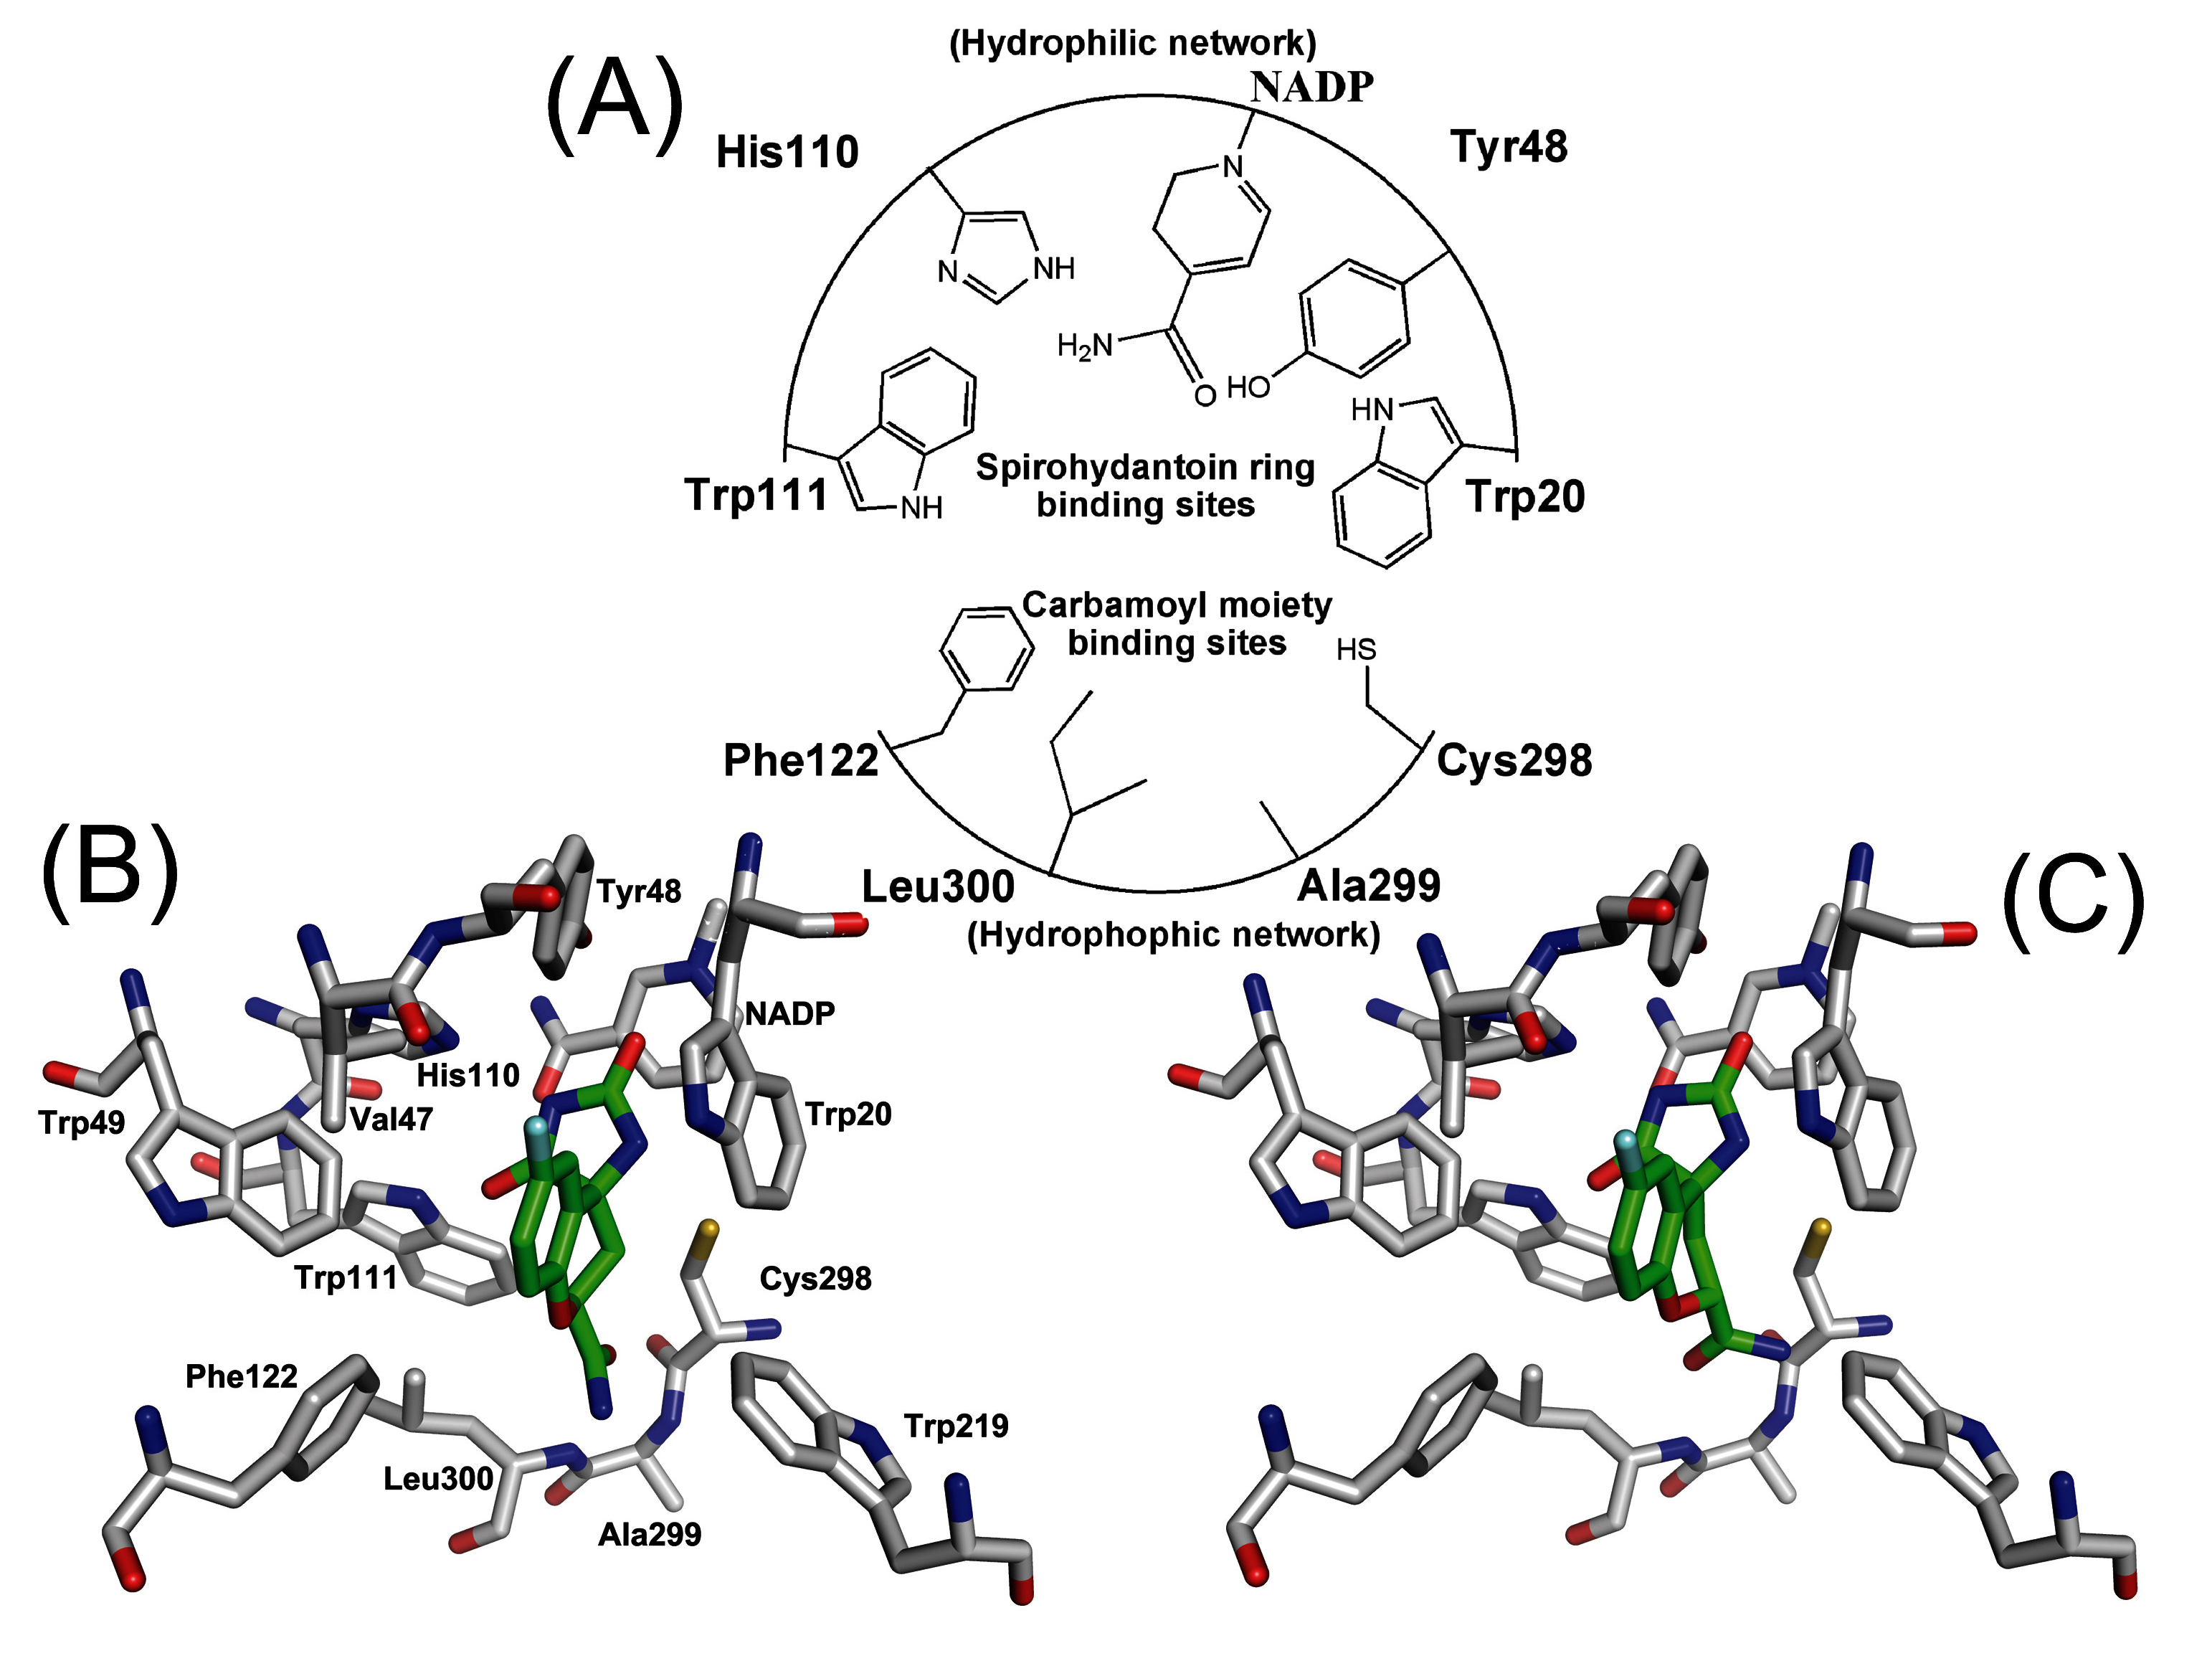
| Hydrophilic Network | ||||||
| N3 | II | Tyr20 | OH | I | 3.7 ± 1.3 | 3.3 ± 0.3 |
| O3 | II | Tyr48 | OH | I | 2.8 ± 1.6 | 2.7 ± 0.5 |
| N3 or O3 | I or II | NADP+ | NO7 or NN1 | II or I | 3.3 ± 1.2 | 3.1 ± 0.6 |
| N3 or O4 | I or II | His110 | NE2 | I | 2.6 ± 0.9 | 2.5 ± 0.4 |
| O4 | II | Trp111 | NE1 | III | 2.8 ± 1.7 | 2.7 ± 0.2 |
| Hydrophobic Network | ||||||
| N1 | I | Phe122 | N | III | 3.5 ± 1.5 | 3.3 ± 0.3 |
| O1 | I | Ser298 | N | III | 4.7 ± 1.1 | 4.6 ± 0.4 |
| N1 | I | Ala299 | N | III | 4.9 ± 1.4 | 3.7 ± 0.7 |
| N1 or O1 | I or II | Leu300 | N | III | 3.1 ± 0.5 | 3.0 ± 0.6 |

3.3. Order parameter calculation

| Structures | SA | SB |
| S1∙∙∙ S8 (All strucutres) | 0.77 | 0.29 |
| S1, S3, S5, S7 (only (2S, 4S)-Fidarestat structures) | 0.81 | 0.65 |
| S2, S4, S6, S8 (only (2R, 4S)-Fidarestat structures) | 0.72 | 0.78 |
| S*1∙∙∙ S*8 (All strucutres) | 0.84 | 0.67 |
| S*1, S*3, S*5, S*7 (only (2S, 4S)-Fidarestat structures) | 0.79 | 0.88 |
| S*2, S*4, S*6, S*8 (only (2R, 4S)-Fidarestat structures) | 0.96 | 0.97 |
| Structures | EPF charges | Structures | Mulliken charges | ||
| θ | Δθ | θ | Δθ | ||
| S1 | 61 | S*1 | 159 | ||
| S2 | 38 | -22 | S*2 | 60 | -98 |
| S3 | 178 | 139 | S*3 | 161 | 100 |
| S4 | 65 | -114 | S*4 | 53 | -107 |
| S5 | -162 | 134 | S*5 | 75 | 23 |
| S6 | -177 | -16 | S*6 | 66 | -10 |
| S7 | -174 | 25 | S*7 | 77 | 9 |
| S8 | 175 | 159 | S*8 | -159 | 125 |
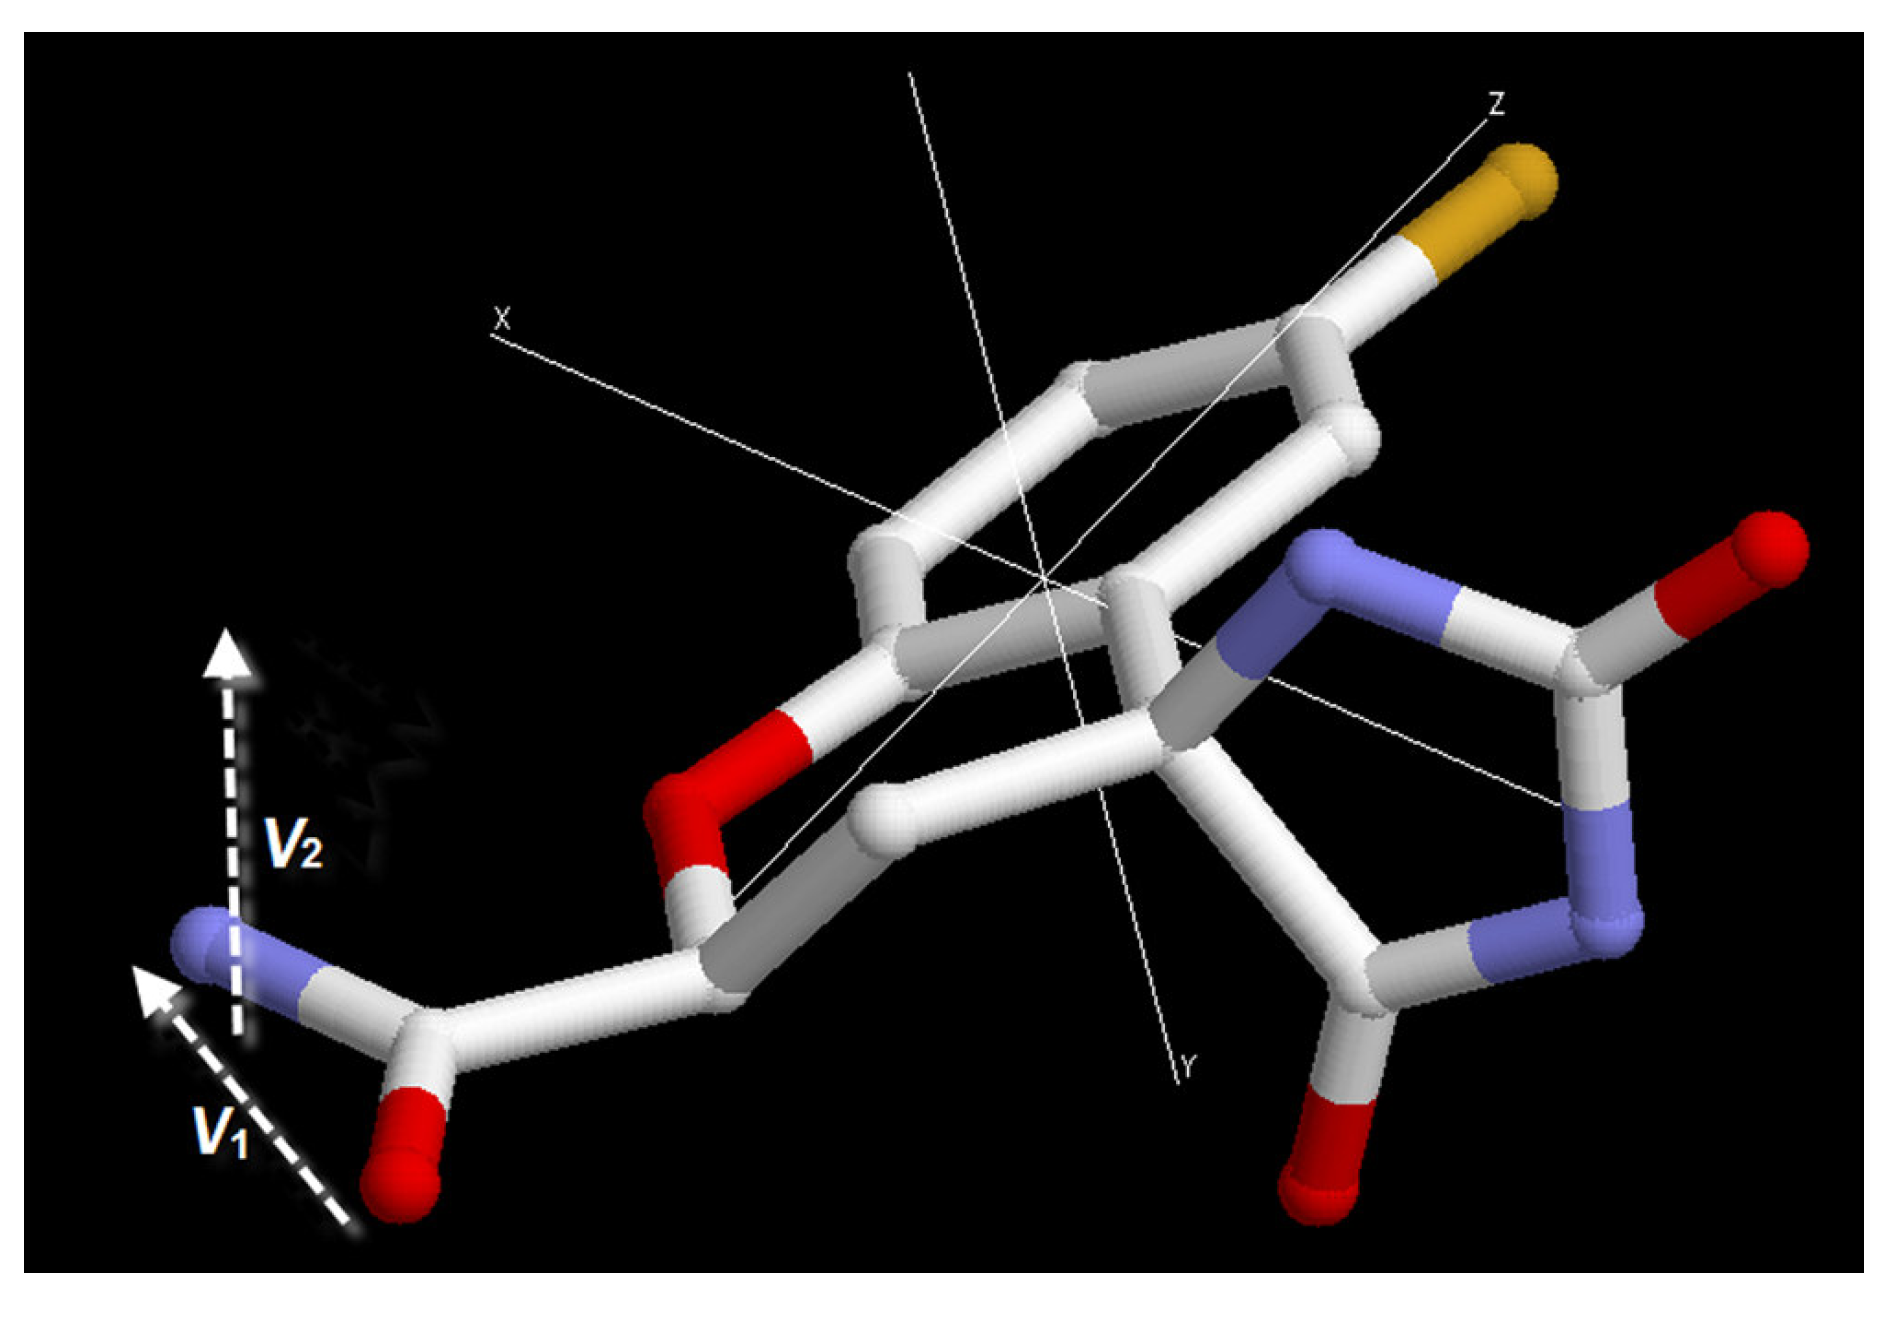
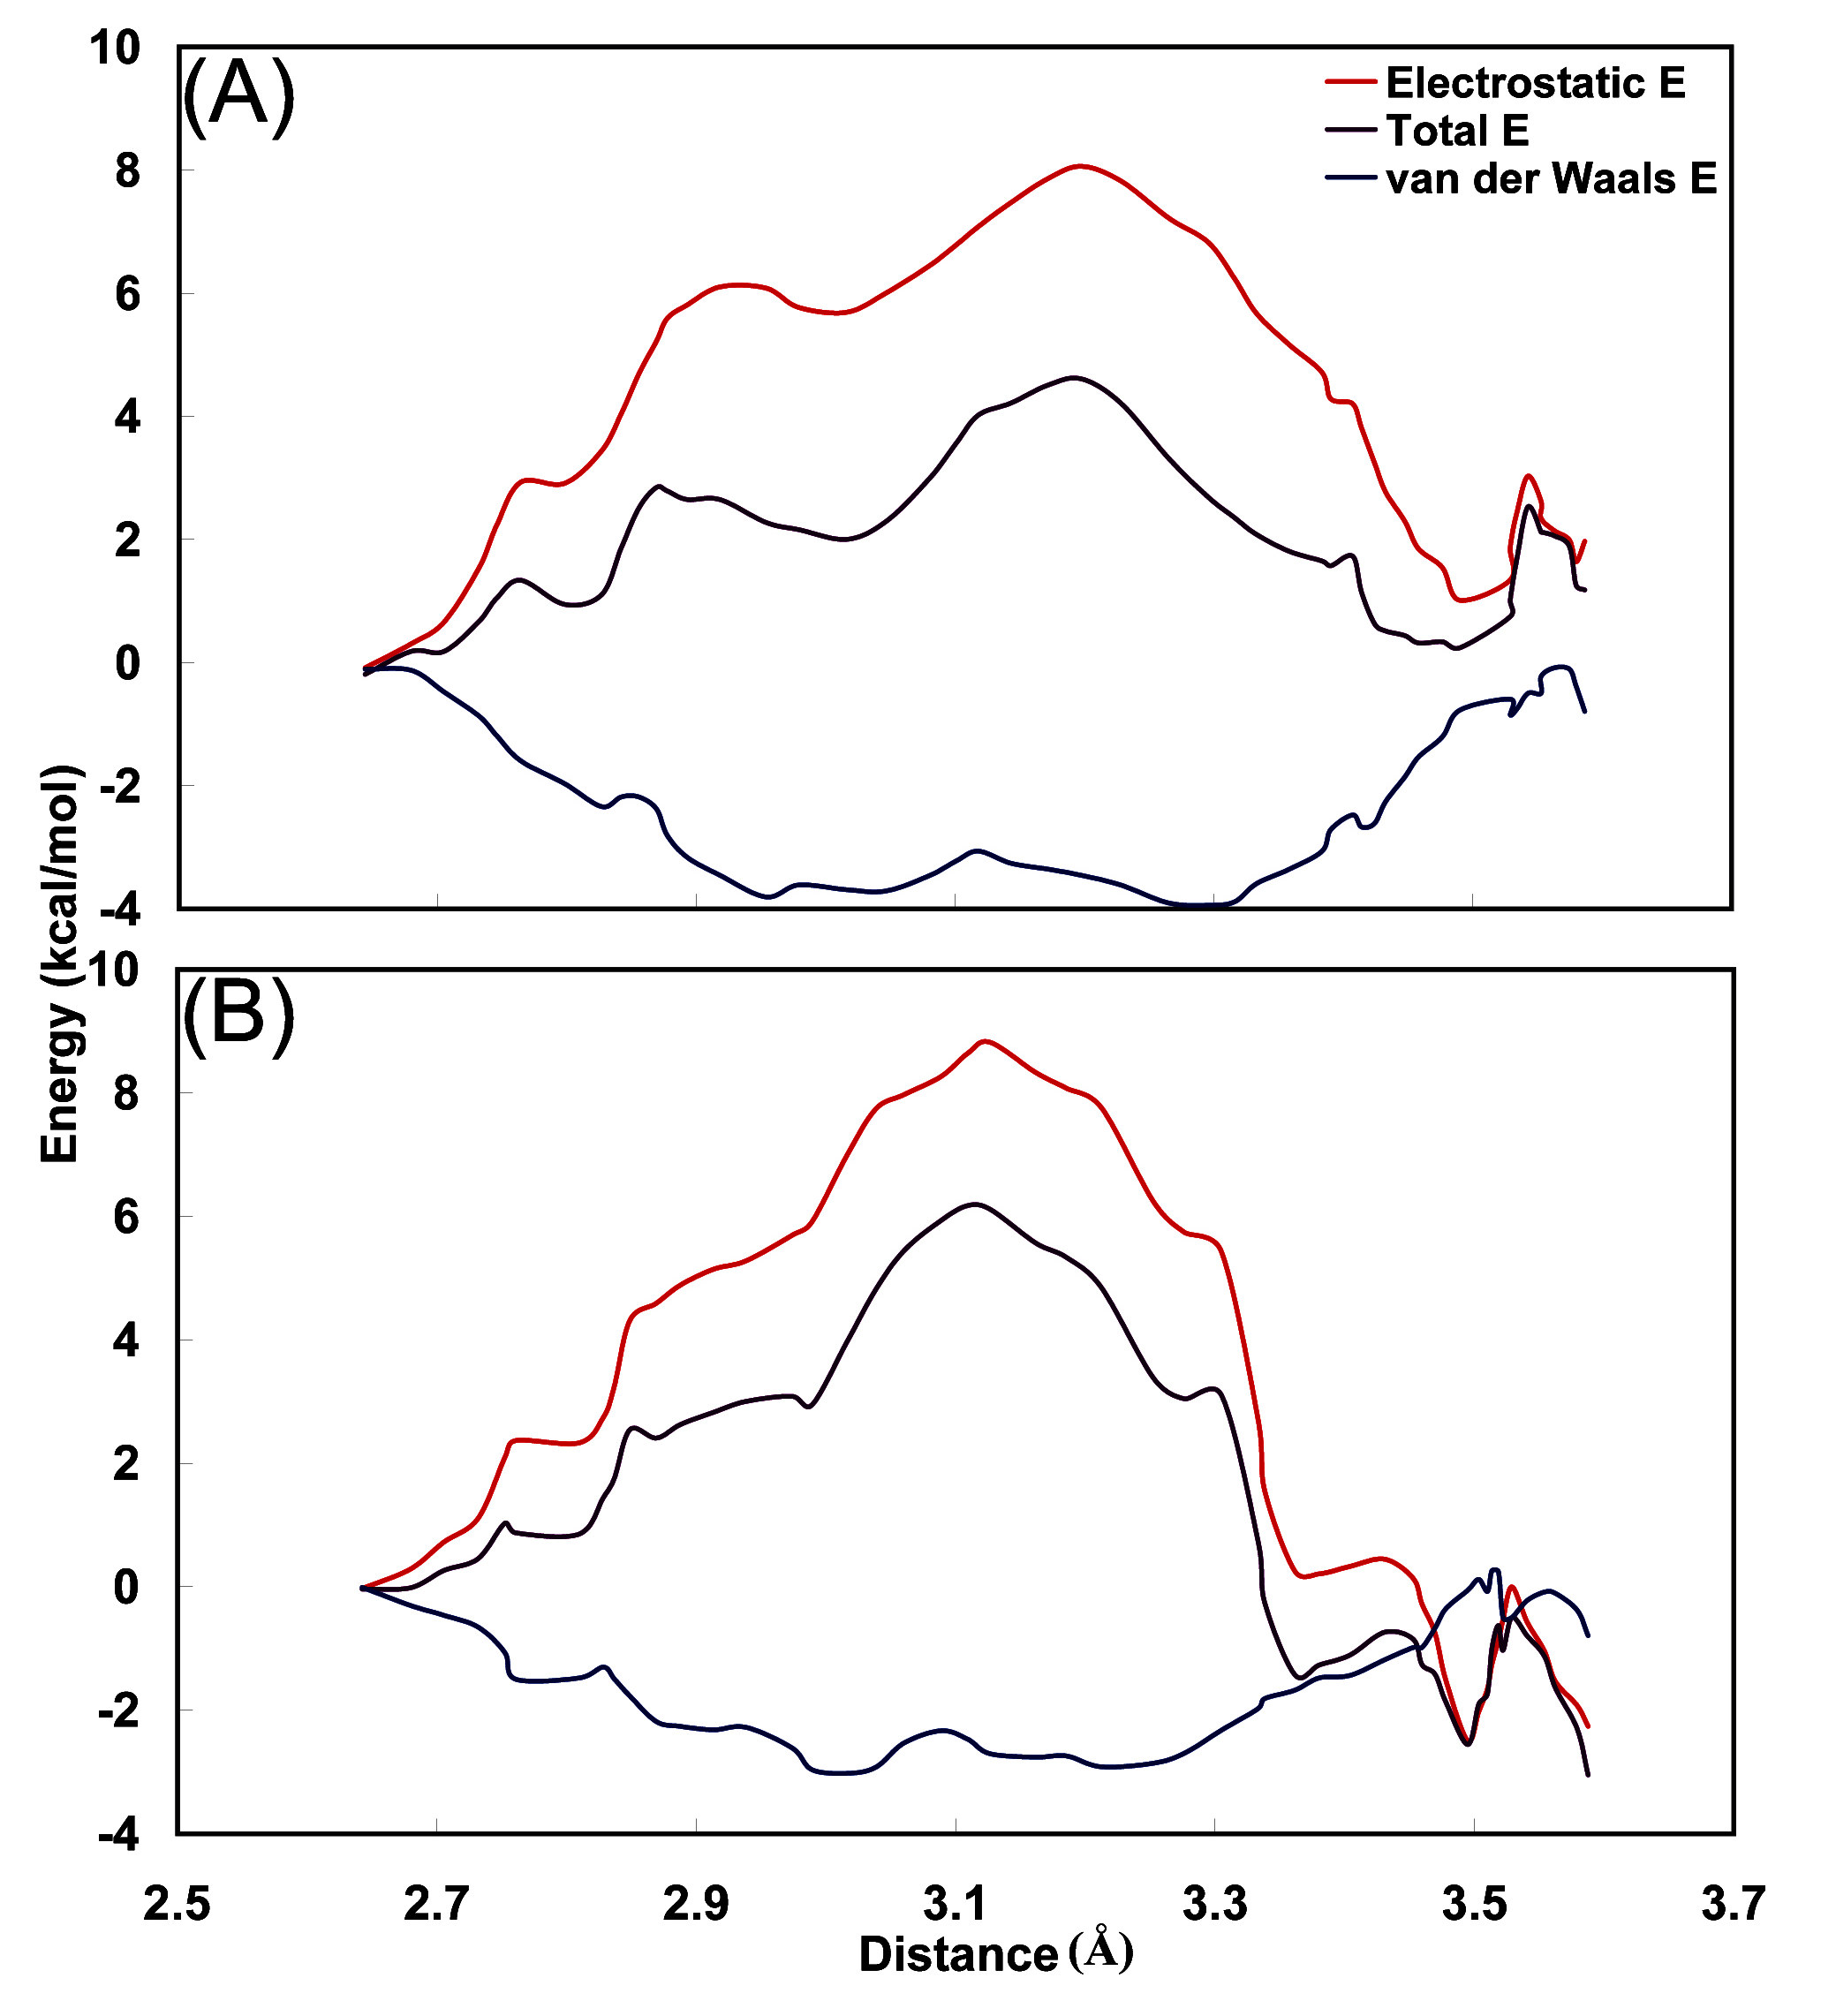
3.4. Interaction energy between carbamoyl moiety and hydrophobic cavity

4. Conclusions
Acknowledgements
References
- Laakso, M. Hyperglycemia and cardiovascular disease in type 2 diabetes. Diabetes 1999, 48, 937–942. [Google Scholar] [CrossRef]
- El-Kabbani, O.; Ruiz, F.; Darmanin, C.; Chung, R. P. T. Aldose reductase structures: Implications for mechanism and inhibition. Cell. Mol. Life. Sci. 2004, 61, 750–762. [Google Scholar] [CrossRef]
- Kador, P.F. The role of aldose reductase in the development of diabetic complications. Med. Res. Rev. 1988, 8, 325–352. [Google Scholar] [CrossRef]
- Tomlinson, D. R.; Stevens, E. J.; Diemel, L. T. Aldose reductase inhibitors and their potential for the treatment of diabetic complications. Trends Pharmacol. Sci. 1994, 15, 293–297. [Google Scholar] [CrossRef]
- Lee, A. Y. W.; Chung, S. S. M. Contributions of polyol pathway to oxidative stress in diabetic cataract. FASEB J. 1999, 13, 23–30. [Google Scholar]
- Nishimura, C. Y. Aldose Reductase in Glucose Toxicity: A Potential Target for the Prevention of Diabetic Complications. Pharmacol. Rev. 1998, 50, 21–34. [Google Scholar]
- Yamagishi, M.; Yamada, Y.; Ozaki, K.; Asao, M.; Shimizu, R.; Suzuki, M.; Matsumoto, M.; Matsuoka, Y.; Matsumoto, K. Biological activities and quantitative structure-activity relationships of spiro[imidazolidine-4,4'(1'H)-quinazoline]-2,2',5(3'H)-triones as aldose reductase inhibitors. J. Med. Chem. 1992, 35, 2085–2094. [Google Scholar] [CrossRef]
- Costantino, L.; Rastelli, G.; Vescovini, K.; Cignarella, G.; Vianello, P.; Del Corso, A.; Cappiello, M.; Mura, U.; Barlocco, D. Synthesis, activity, and molecular modeling of a new series of tricyclic pyridazinones as selective aldose reductase inhibitors. J. Med. Chem. 1996, 39, 4396–4405. [Google Scholar] [CrossRef]
- Kotani, T.; Nagaki, Y.; Ishii, A.; Konishi, Y.; Yago, H.; Suehiro, S.; Okukado, N.; Okamoto, K. Highly selective aldose reductase inhibitors. 3. Structural diversity of 3-(arylmethyl)-2,4,5-trioxoimidazolidine-1-acetic acids. J. Med. Chem. 1997, 40, 684–694. [Google Scholar] [CrossRef]
- Costantino, L.; Rastelli, G.; Gamberini, M.C.; Vinson, J. A.; Bose, P.; Iannone, A.; Staffieri, M.; Antolini, L.; Del Corso, A.; Mura, U.; Albasini, A. 1-Benzopyran-4-one antioxidants as aldose reductase inhibitors. J. Med. Chem. 1999, 42, 1881–1893. [Google Scholar] [CrossRef]
- Costantino, L.; Rastelli, G.; Gamberini, M.C.; Giovannoni, M. P.; Piaz, V. D.; Vianello, P.; Barlocco, D. Isoxazolo-[3,4-d]-pyridazin-7-(6H)-one as a potential substrate for new aldose reductase inhibitors. J. Med. Chem. 1999, 42, 1894–1900. [Google Scholar] [CrossRef]
- Fresneau, P.; Cussac, M.; Morand, J. M.; Szymonski, B.; Tranqui, D.; Leclerc, G. Synthesis, activity, and molecular modeling of new 2,4-dioxo-5-(naphthylmethylene)-3-thiazolidineacetic acids and 2-thioxo analogues as potent aldose reductase inhibitors. J. Med. Chem. 1998, 41, 4706–4715. [Google Scholar] [CrossRef]
- Nicolaou, I.; Zika, C.; Demopoulos, V. J. [1-(3,5-Difluoro-4-hydroxyphenyl)-1H-pyrrol-3-yl]phenylmethanone as a Bioisostere of a Carboxylic Acid Aldose Reductase Inhibitor. J. Med. Chem. 2004, 47, 2706–2709. [Google Scholar]
- Settimo, F. D.; Primofiore, G.; Settimo, A. D.; Motta, C. L.; Simorini, F.; Novellino, E.; Greco, G.; Lavecchia, A.; Boldrini, E. Novel, highly potent aldose reductase inhibitors: Cyano(2-oxo-2,3-dihydroindol-3-yl)acetic acid derivatives. J. Med. Chem. 2003, 46, 1419–1428. [Google Scholar]
- Pau, A.; Asproni, B.; Boatto, G.; Grella, G. E.; Caprariis, P. D.; Costantino, L.; Pinna, G. A. Synthesis and aldose reductase inhibitory activities of novel thienocinnolinone derivatives. Eur. J. Pharm. Sci. 2004, 21, 545–552. [Google Scholar] [CrossRef]
- Bruno, G.; Costantino, L.; Curinga, C.; Maccari, R.; Monforte, F.; Nicolò, F.; Ottanà, R.; Vigorita, M. G. Synthesis and aldose reductase inhibitory activity of 5-arylidene-2,4-thiazolidinediones. Bioorg. Med. Chem. 2002, 10, 1077–1084. [Google Scholar]
- Costantino, L.; Corso, A. D.; Rastelli, G.; Petrash, J. M.; Mura, U. 7-Hydroxy-2-substituted-4-H-1-benzopyran-4-one derivatives as aldose reductase inhibitors: A SAR study. Eur. J. Med. Chem. 2001, 36, 697–703. [Google Scholar] [CrossRef]
- Singh, S. B.; Malamas, M. S.; Hohman, T. C.; Nilakantan, R.; Carper, D. A.; Kitchen, D. Molecular modeling of the aldose reductase-inhibitor complex based on the X-ray crystal structure and studies with single-site-directed mutants. J. Med. Chem. 2000, 43, 1062–1070. [Google Scholar]
- Parenti, M. D.; Pacchioni, S.; Ferrari, A. M.; Rastelli, G. Three-dimensional quantitative structure-activity relationship analysis of a set of Plasmodium falciparum dihydrofolate reductase inhibitors using a pharmacophore generation approach. J. Med. Chem. 2004, 47, 4258–4267. [Google Scholar] [CrossRef]
- Bohren, K. M.; Grimshaw, C. E.; Lai, C. J.; Harrison, D. H.; Ringe, D.; Petsko, G. A.; Gabbay, K. H. Tyrosin-48 is the proton donor and histidine-110 directs substrate stereochemical selectivity in the reduction reaction of human aldose reductase: enzyme kinetics and crystal structure of the Y48H mutant enzyme. Biochemistry 1994, 33, 2021–2032. [Google Scholar] [CrossRef]
- Harrison, D. H.; Bohren, K. M.; Petsko, G. A.; Ringe, D.; Gabbay, K. H. The alrestatin double-decker: binding of two inhibitor molecules to human aldose reductase reveals a new specificity determinant. Biochemistry 1997, 36, 16134–16140. [Google Scholar]
- Lee, Y. S.; Chen, Z.; Kador, P. F. Molecular modeling studies of the binding modes of aldose reductase inhibitors at the active site of human aldose reductase. Bioorg. Med. Chem. 1998, 6, 1811–1819. [Google Scholar]
- Giulio, R.; Luca, C. Molecular dynamics simulations of the structure of aldose reductase complexed with the inhibitor tolrestat. Bioorg. Med. Chem. Lett. 1998, 8, 641–646. [Google Scholar] [CrossRef]
- Kawamura, M.; Hamanaka, N. Development of Eparlestat (Kinedak), aldose reductase inhibitor. J. Synth. Org. Chem. 1997, 37, 787–792. [Google Scholar]
- Pfeifer, M. A.; Schumer, M. P.; Gelber, D. A. Aldose reductase inhibitors: The end of an era or the need for different trial designs? Diabetes 1997, 46, S82–S89. [Google Scholar] [CrossRef]
- Costantino, L.; Rastelli, G.; Vianello, P.; Cignarella, G.; Barlocco, D. Diabetes complications and their potential prevention: Aldose reductase inhibition and other approaches. Med. Res. Rev. 1999, 19, 3–23. [Google Scholar]
- Yasuda, H.; Terada, M.; Maeda, K.; Kogawa, S.; Sanada, M.; Haneda, M.; Kashiwagi, A.; Kikkawa, R. Diabetic neuropathy and nerve regeneration. Prog. Neurobiol. 2003, 69, 229–285. [Google Scholar] [CrossRef]
- Asano, T.; Saito, Y.; Kawakami, M.; Yamada, N. Fidarestat (SNK-860), a potent aldose reductase inhibitor, normalizes the elevated sorbitol accumulation in erythrocytes of diabetic patients. J. Diabetes Complicat. 2002, 16, 133–138. [Google Scholar]
- Petrova, T.; Steuber, H.; Hazemann, I.; Cousido-Siah, A.; Mitschler, A.; Chung, R.; Oka, M.; Klebe, G.; El-Kabbani, O.; Joachimiak, A.; Podjarny, A. Factorizing selectivity determinants of inhibitor binding toward aldose and aldehyde reductases: structural and thermodynamic properties of the aldose reductase mutant Leu300Pro-fidarestat complex. J. Med. Chem. 2005, 48, 5659–5665. [Google Scholar] [CrossRef]
- El-Kabbani, O.; Carbone, V.; Darmanin, C.; Oka, M.; Mitschler, A.; Podjarny, A.; Schulze-Briese, C.; Chung, R. P. Structure of aldehyde reductase holoenzyme in complex with the potent aldose reductase inhibitor fidarestat: implications for inhibitor binding and selectivity. J. Med. Chem. 2005, 48, 5536–5542. [Google Scholar] [CrossRef]
- Oka, M.; Matsumoto, Y.; Sugiyama, S.; Tsuruta, N.; Matsushima, M. A potent aldose reductase inhibitor, (2S,4S)-6-fluoro-2', 5'-dioxospiro[chroman-4,4'-imidazolidine]-2-carboxamide (Fidarestat): its absolute configuration and interactions with the aldose reductase by X-ray crystallography. J. Med. Chem. 2000, 43, 2479–2483. [Google Scholar] [CrossRef]
- El-Kabbani, O.; Darmanin, C.; Schneider, T. R.; Hazemann, I.; Ruiz, F.; Oka, M.; Joachimiak, A.; Schulze-Briese, C.; Tomizaki, T.; Mitschler, A.; Podjarny, A. Ultrahigh resolution drug design. II. Atomic resolution structures of human aldose reductase holoenzyme complexed with fidarestat and minalrestat: Implications for the binding of cyclic imide inhibitors. Proteins 2004, 55, 805–813. [Google Scholar] [CrossRef]
- El-Kabbani, O.; Darmanin, C.; Oka, M.; Schulze-Briese, C.; Tomizaki, T.; Hazemann, I.; Mitschler, A.; Podjarny, A. High-Resolution Structures of Human Aldose Reductase Holoenzyme in Complex with Stereoisomers of the Potent Inhibitor Fidarestat: Stereospecific Interaction between the Enzyme and a Cyclic Imide Type Inhibitor. J. Med. Chem. 2004, 47, 4530–4537. [Google Scholar] [CrossRef]
- Darmanin, C.; Chevreux, G.; Potier, N.; Van Dorsselaer, A.; Hazemann, I.; Podjarny, A.; El-Kabbani, O. Probing the ultra-high resolution structure of aldose reductase with molecular modelling and noncovalent mass spectrometry. Bioorg. Med. Chem. 2004, 12, 3797–3806. [Google Scholar] [CrossRef]
- Kirkwood, J. G. Statistical mechanics of fluid mixtures. J. Chem. Phys. 1935, 3, 300–313. [Google Scholar] [CrossRef]
- Mulliken, R. S. Electronic Population Analysis on LCAO-MO Molecular Wave Functions. I, J. Chem. Phys. 1995, 23, 1833–1840. [Google Scholar] [CrossRef]
- Bayly, C. I.; Cieplak, P.; Cornell, W.; Kollman, P. A. A well-behaved electrostatic potential based method using charge restraints for deriving atomic charges: the RESP model. J. Phys. Chem. 1993, 97, 10269–10280. [Google Scholar] [CrossRef]
- Anisimov, V. M.; Lamoureux, G.; Vorobyov, I. V.; Huang, N.; Roux, B.; MacKerell, A.D., Jr. Determination of Electrostatic Parameters for a Polarizable Force Field Based on the Classical Drude Oscillator. J. Comp. Theor. Chem. 2005, 1, 153–168. [Google Scholar] [CrossRef]
- Brooks, B. R.; Bruccoleri, R. E.; Olafson, B. D.; States, D. J.; Swaminathan, S.; Karplus, M. CHARMM: a program for macromolecular energy, minimization, and dynamics calculations. J. Comput. Chem. 1983, 4, 187–217. [Google Scholar] [CrossRef]
- Brooks, C. L., III; Karplus, M. Deformable stochastic boundaries in molecular dynamics. J. Chem. Phys. 1983, 79, 6312–6325. [Google Scholar] [CrossRef]
- Mackerell, A. D.; Bashford, D.; Bellott, M.; Dunbrack, R.; Evanseck, J.; Field, M.; Fischer, S.; Gao, J.; Guo, H.; Ha, S.; Joseph, D.; Kuchnir, L.; Kuczera, K.; Lau, F.; Mattos, C.; Michnick, S.; Ngo, T.; Nguyen, D.; Prodhom, B.; Reiher, W.; Roux, B.; Smith, J.; Stote, R.; Straub, J.; Watanabe, M.; Wiorkewicz-Kuczera, J.; Yin, D.; Karplus, M. An all-atom empirical potential for molecular modelling and dynamics study of proteins. J. Phys. Chem. B 1998, 102, 3586–3616. [Google Scholar] [CrossRef]
- Halgren, T.A. Merck Molecular Force Field: I. Basis, form, scope, parameterization, and performance of MMFF94. J. Comp. Chem. 1996, 17, 490–519. [Google Scholar] [CrossRef]
- Schmidt, M. W.; Baldridge, K. K.; Boatz, J. A.; Elbert, S. T.; Gordon, M. S.; Jensen, J. J.; Koseki, S.; Matsunaga, N.; Nguyen, K. A.; Su, S.; Windus, T. L.; Dupuis, M.; Montgomery, J. A. GAMESS. J. Comput. Chem. 1993, 14, 1347–1363. [Google Scholar] [CrossRef]
- Ryckaert, J. P.; Ciccotti, G.; Berendsen, H. J. C. Numerical integration of cartesian equations of motion of a system with constraints: molecular dynamics of n-alkanes. J. Comput. Phys. 1977, 23, 327–341. [Google Scholar] [CrossRef]
- Jorgensen, W. L.; Chandrasekhar, J.; Madura, J. D.; Impey, R. W.; Klein, M. L. Comparison of simple potential functions for simulating liquid water. J. Chem. Phys. 1983, 79, 926–935. [Google Scholar] [CrossRef]
- Tembe, B. L.; McCammon, J. A. Ligand-receptor interactions. Comput. Chem. 1984, 8, 281–283. [Google Scholar] [CrossRef]
- Wong, C. F.; McCammon, J. A. Dynamics and design of enzymes and inhibitors. J. Am. Chem. Soc. 1986, 108, 3830–3832. [Google Scholar] [CrossRef]
- Pearhnan, D. A.; Kollman, P. A. A new method for carrying out free energy perturbation calculations: Dynamically modified windows. J. Chem. Phys. 1989, 90, 2460–2470. [Google Scholar] [CrossRef]
- Wood, R.H. Estimation of errors in free energy calculations due to the lag between the hamiltonian and the system configuration. J. Phys. Chem. 1991, 95, 4838–4842. [Google Scholar] [CrossRef]
- Hermans, J. Simple analysis of noise and hysteresis in (slow-growth) free energy simulations. J. Phys. Cbem. 1991, 95, 9029–9032. [Google Scholar]
- Hermans, J.; Yun, R.H.; Anderson, A.G. Precision of free energies calculated by molecular dynamics simulations of peptides in solution. J. Comput. Chem. 1992, 13, 429–442. [Google Scholar] [CrossRef]
© 2006 by MDPI (http://www.mdpi.org). Reproduction is permitted for noncommercial purposes.
Share and Cite
Kim, D.; Hong, S.-I.; Lee, D.-S. Binding of Fidarestat Stereoisomers with Aldose Reductase. Int. J. Mol. Sci. 2006, 7, 519-536. https://doi.org/10.3390/i7110519
Kim D, Hong S-I, Lee D-S. Binding of Fidarestat Stereoisomers with Aldose Reductase. International Journal of Molecular Sciences. 2006; 7(11):519-536. https://doi.org/10.3390/i7110519
Chicago/Turabian StyleKim, Dooil, Suk-In Hong, and Dae-Sil Lee. 2006. "Binding of Fidarestat Stereoisomers with Aldose Reductase" International Journal of Molecular Sciences 7, no. 11: 519-536. https://doi.org/10.3390/i7110519
APA StyleKim, D., Hong, S.-I., & Lee, D.-S. (2006). Binding of Fidarestat Stereoisomers with Aldose Reductase. International Journal of Molecular Sciences, 7(11), 519-536. https://doi.org/10.3390/i7110519