
The Cellular Response Is Determined by a Combination of Different ELF-EMF Exposure Parameters: A Scope Review


Abstract
:1. Introduction
1.1. Introduction Rationale
1.2. Objective
2. Methods
2.1. Eligibility Criteria
2.2. Information Sources and Search Strategy
2.3. Selection of Sources of Evidence
2.4. Data Charting Process and Data Items
- Author and year of publication (full reference of the selected article);
- Cell line used;
- Frequency;
- Intensity;
- Exposure time;
- Exposure mode (intermittent/continuous);
- Results obtained: significant or non-significant for each cellular process studied (viability, proliferation, apoptosis, oxidative stress/mitochondria, cell cycle).
2.5. Synthesis of Results
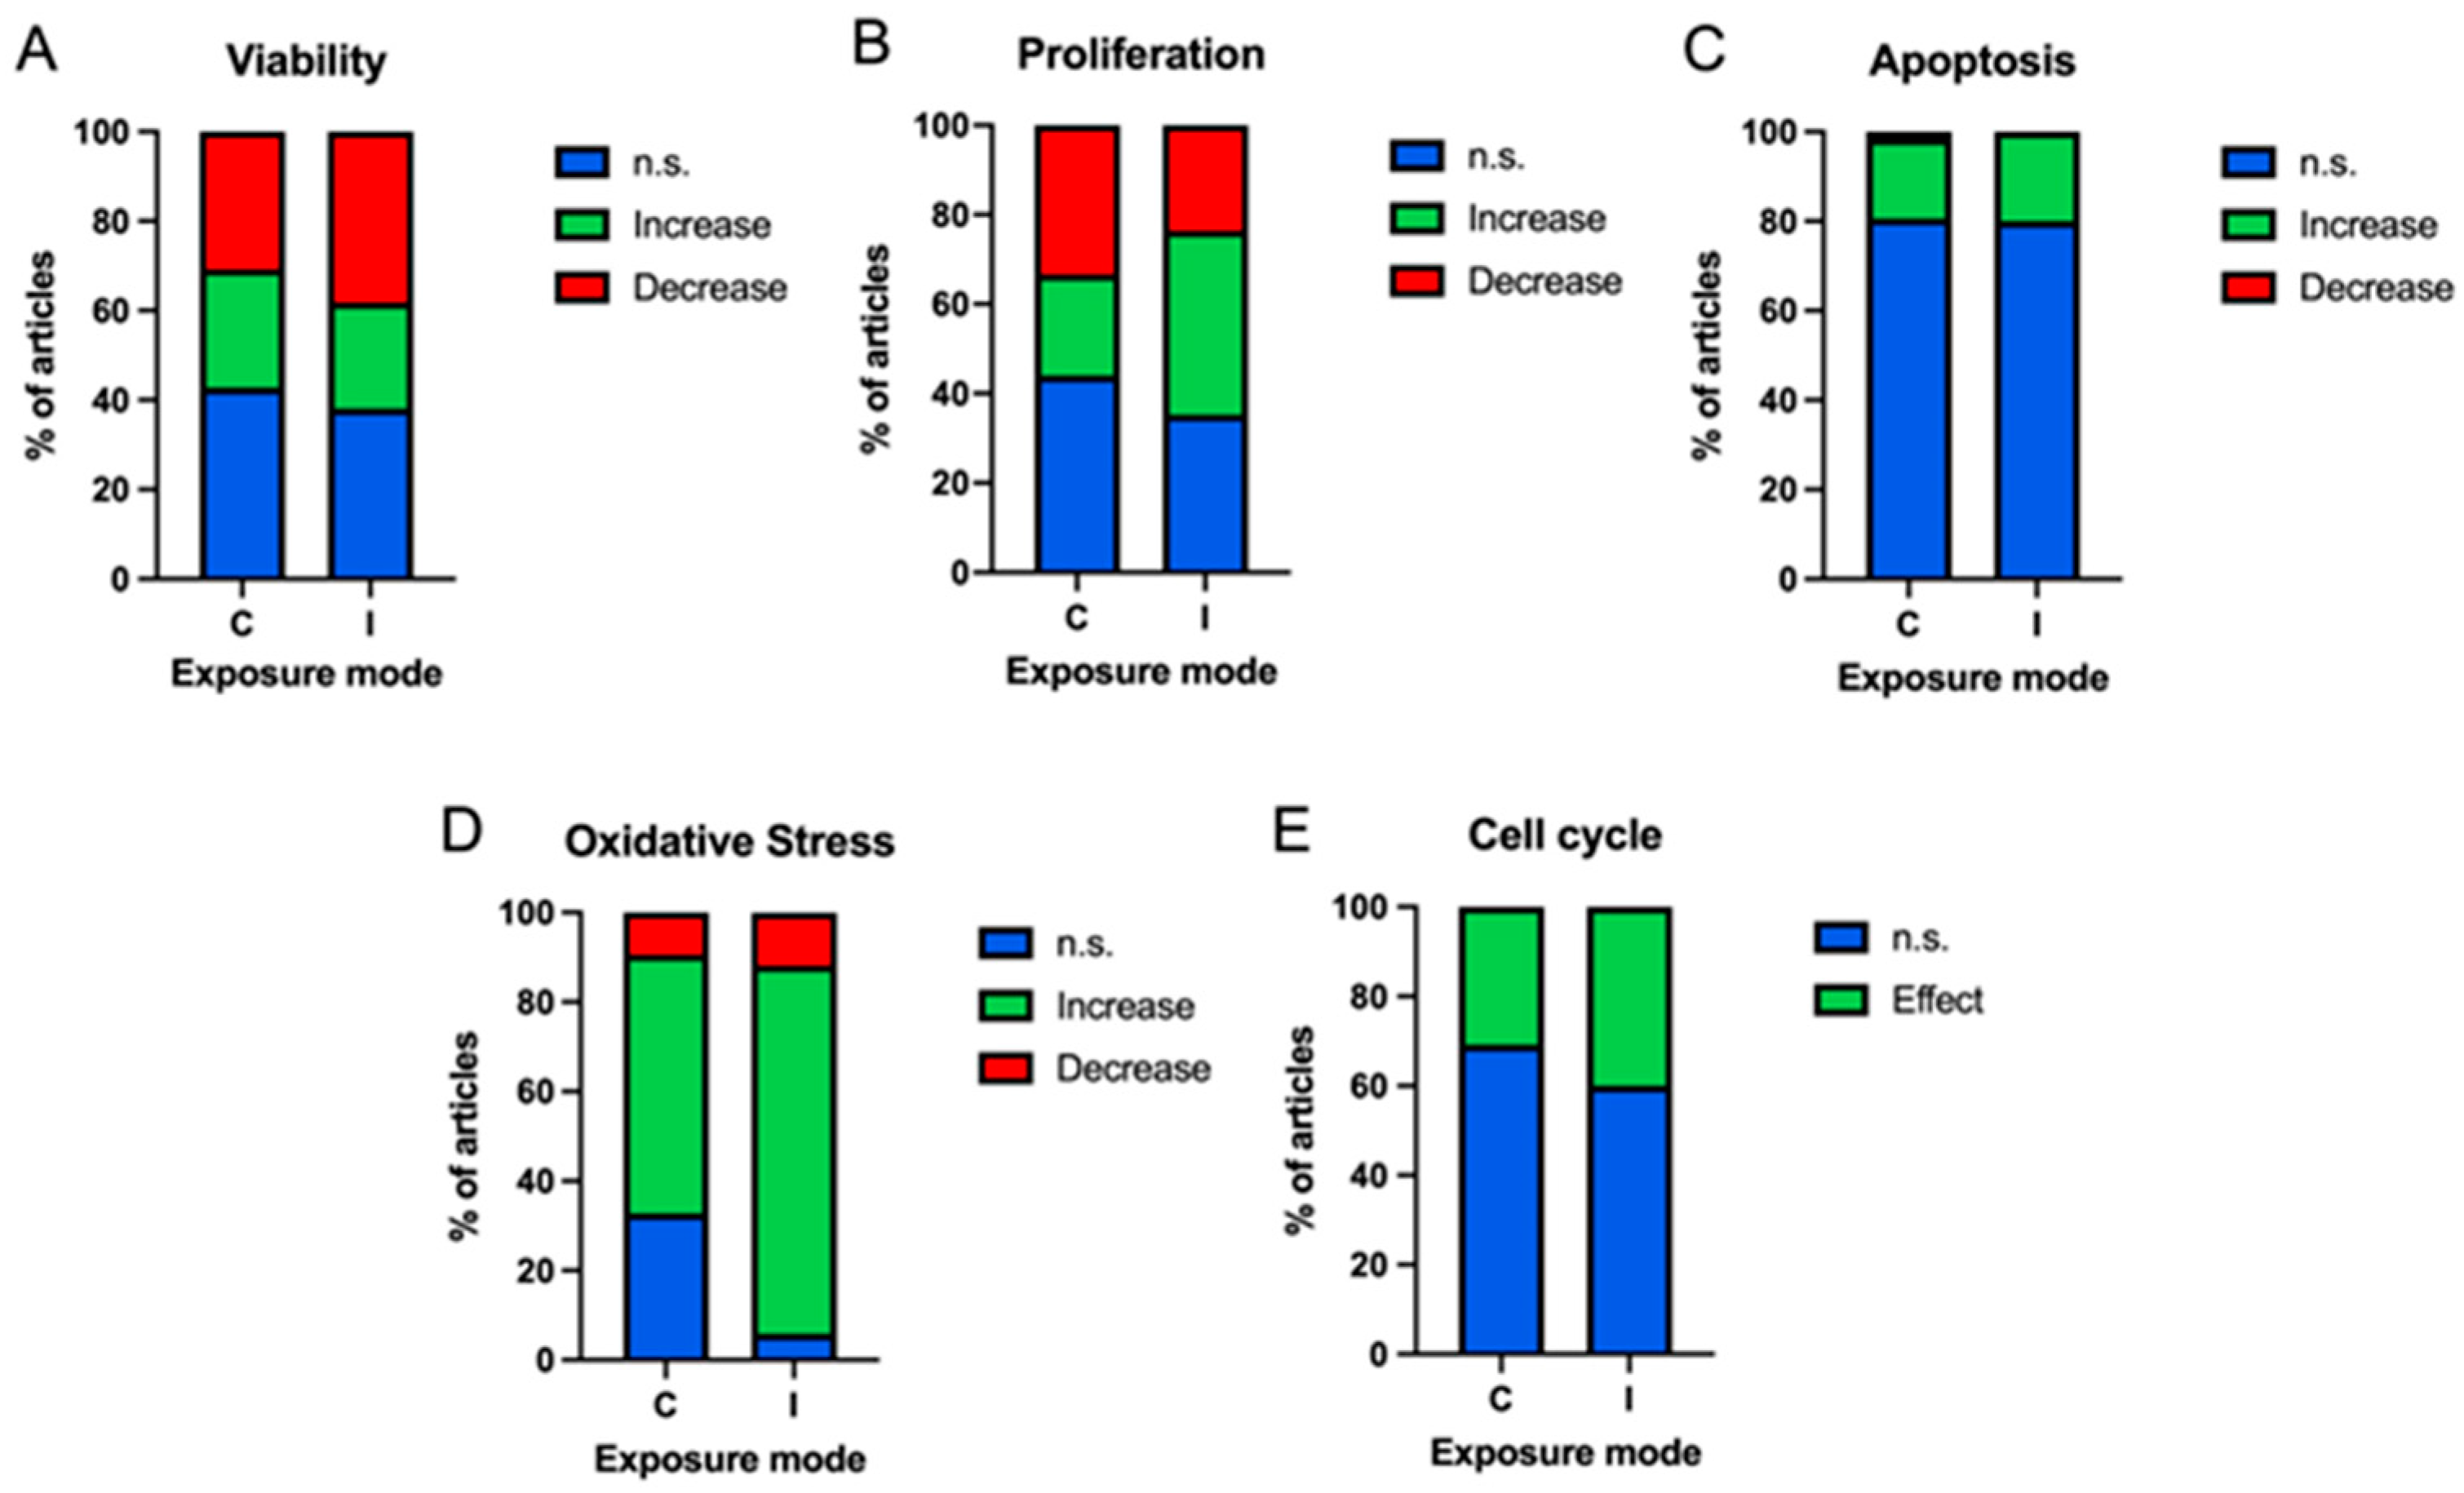
- First division: continuous (C)/intermittent (I) exposure. The articles were separated according to whether the exposure was continuous over time or intermittent (ON/OFF) regardless of the exposure time.
- Second division: tumour cells (T)/non-tumour cells (NT). The results of the different articles are divided according to whether they use tumour or non-tumour cells independently of the tissue from which they originate.
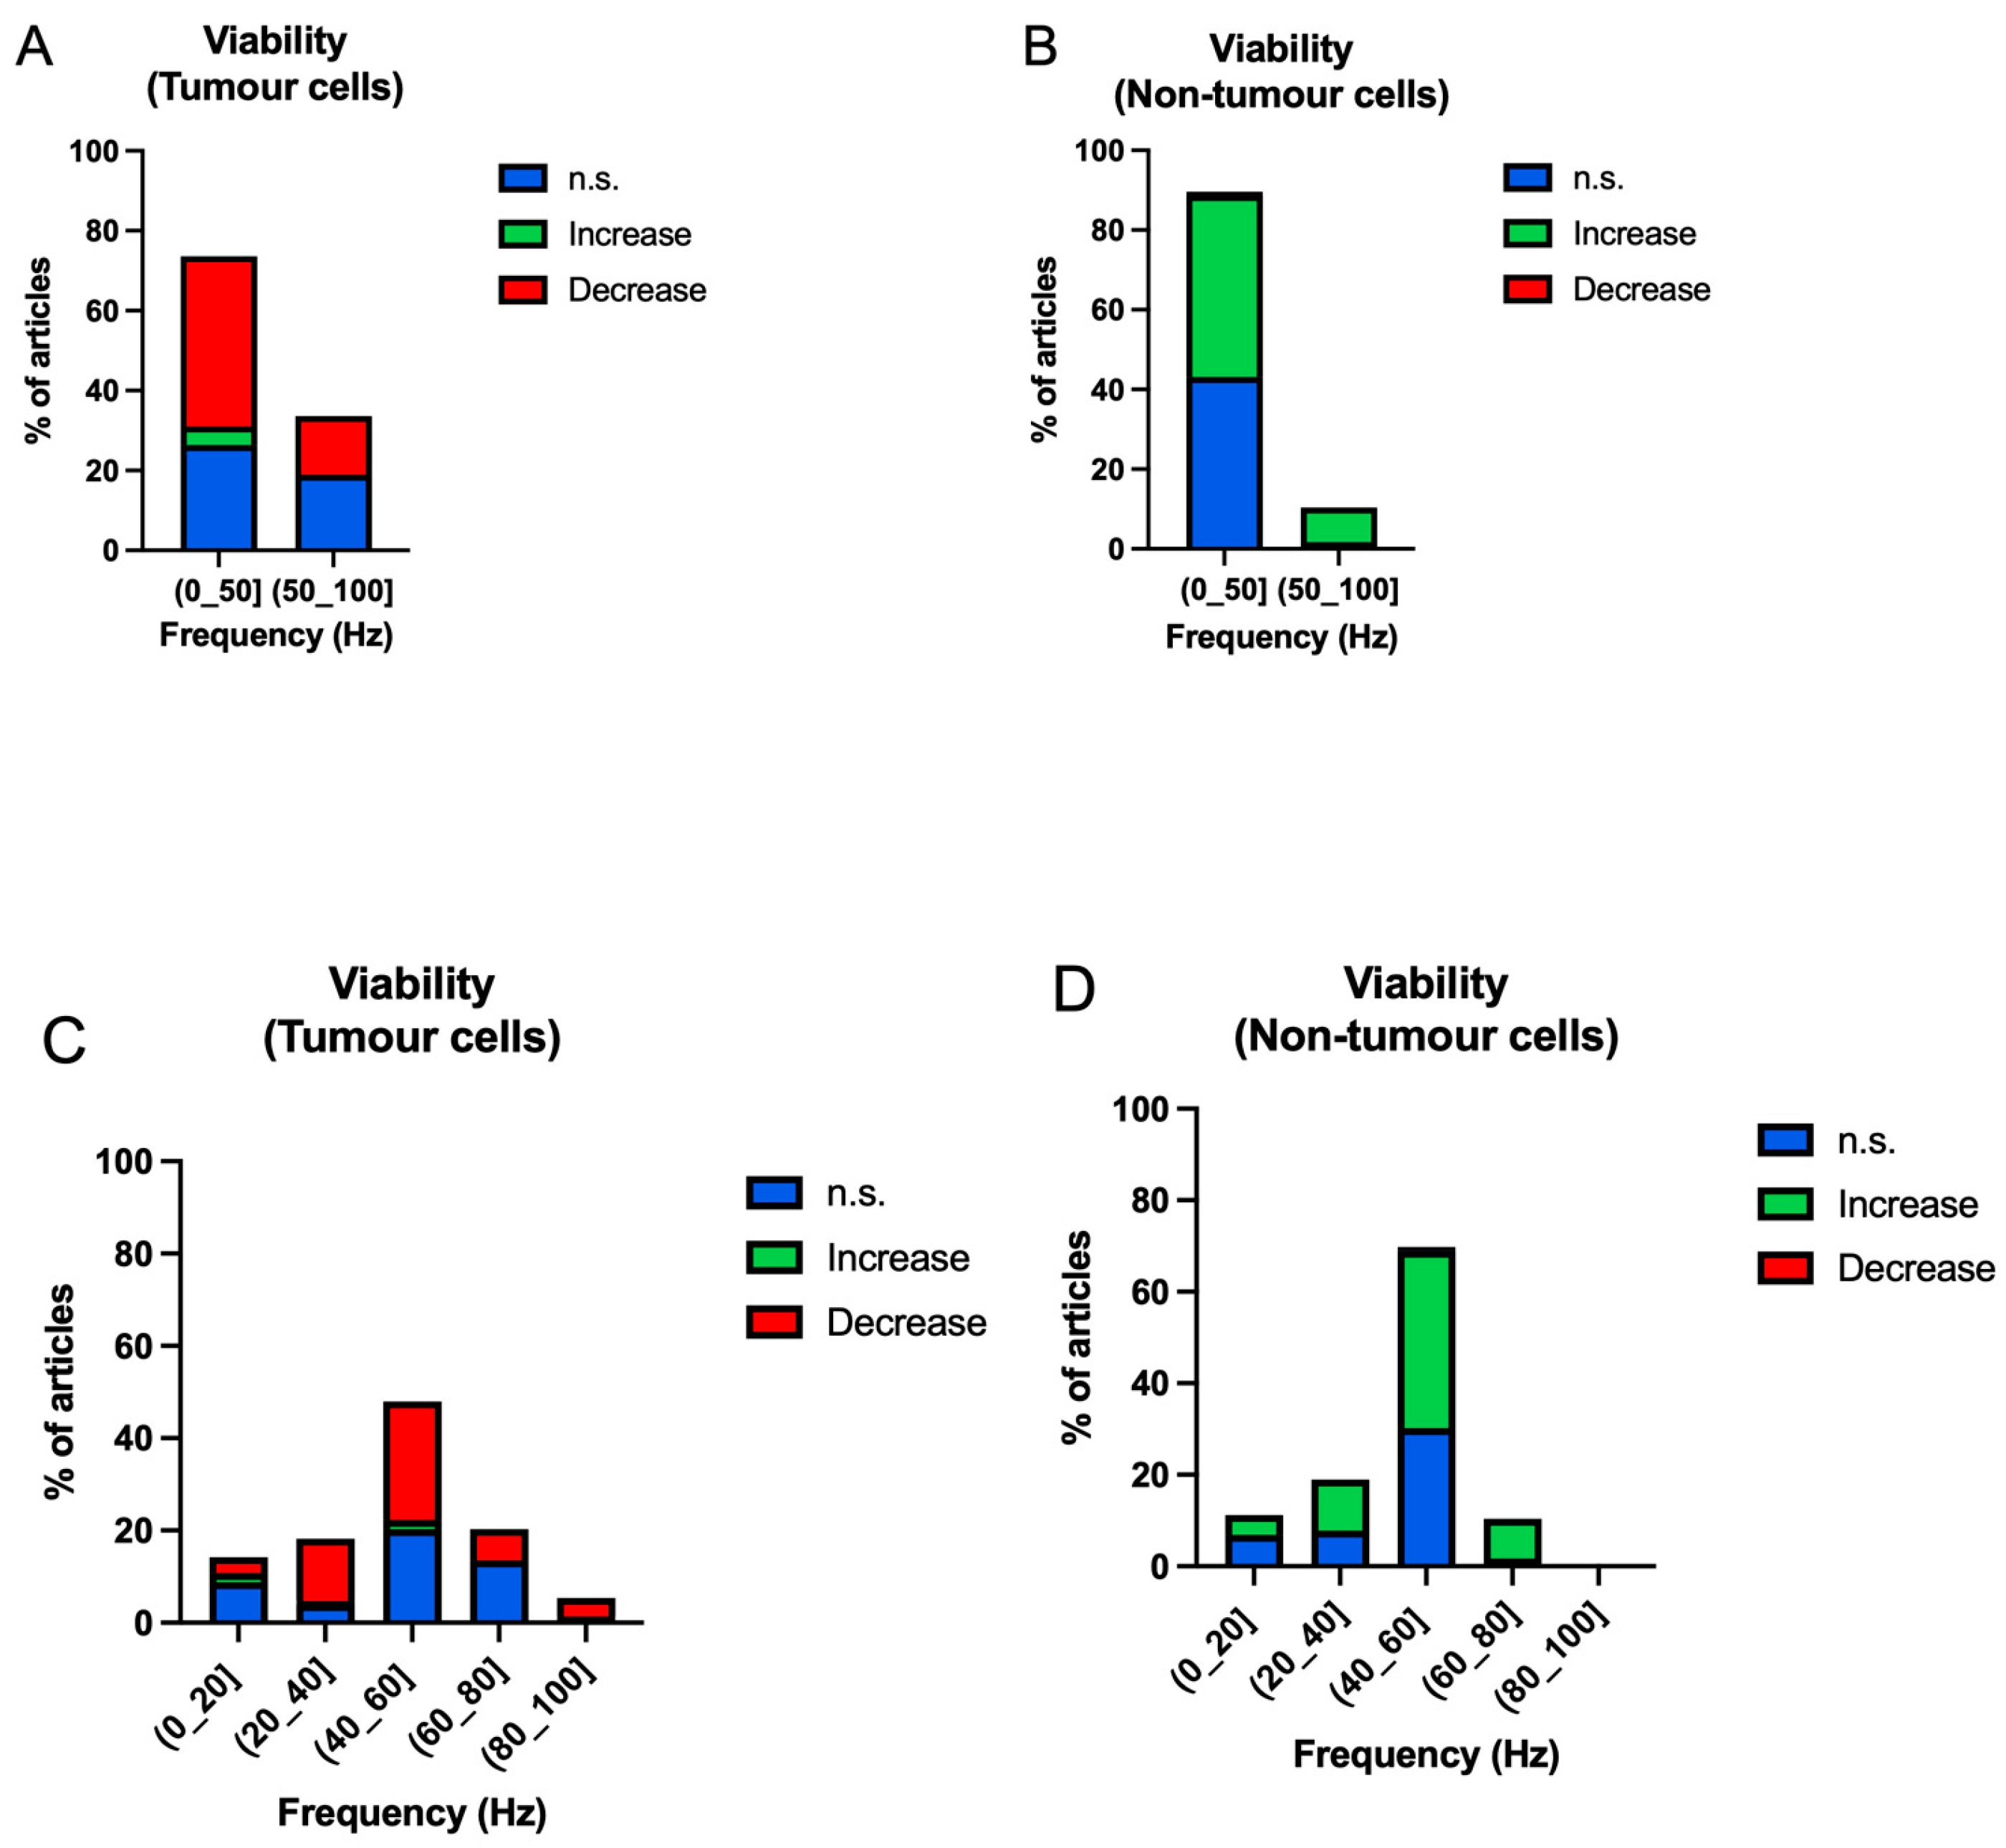
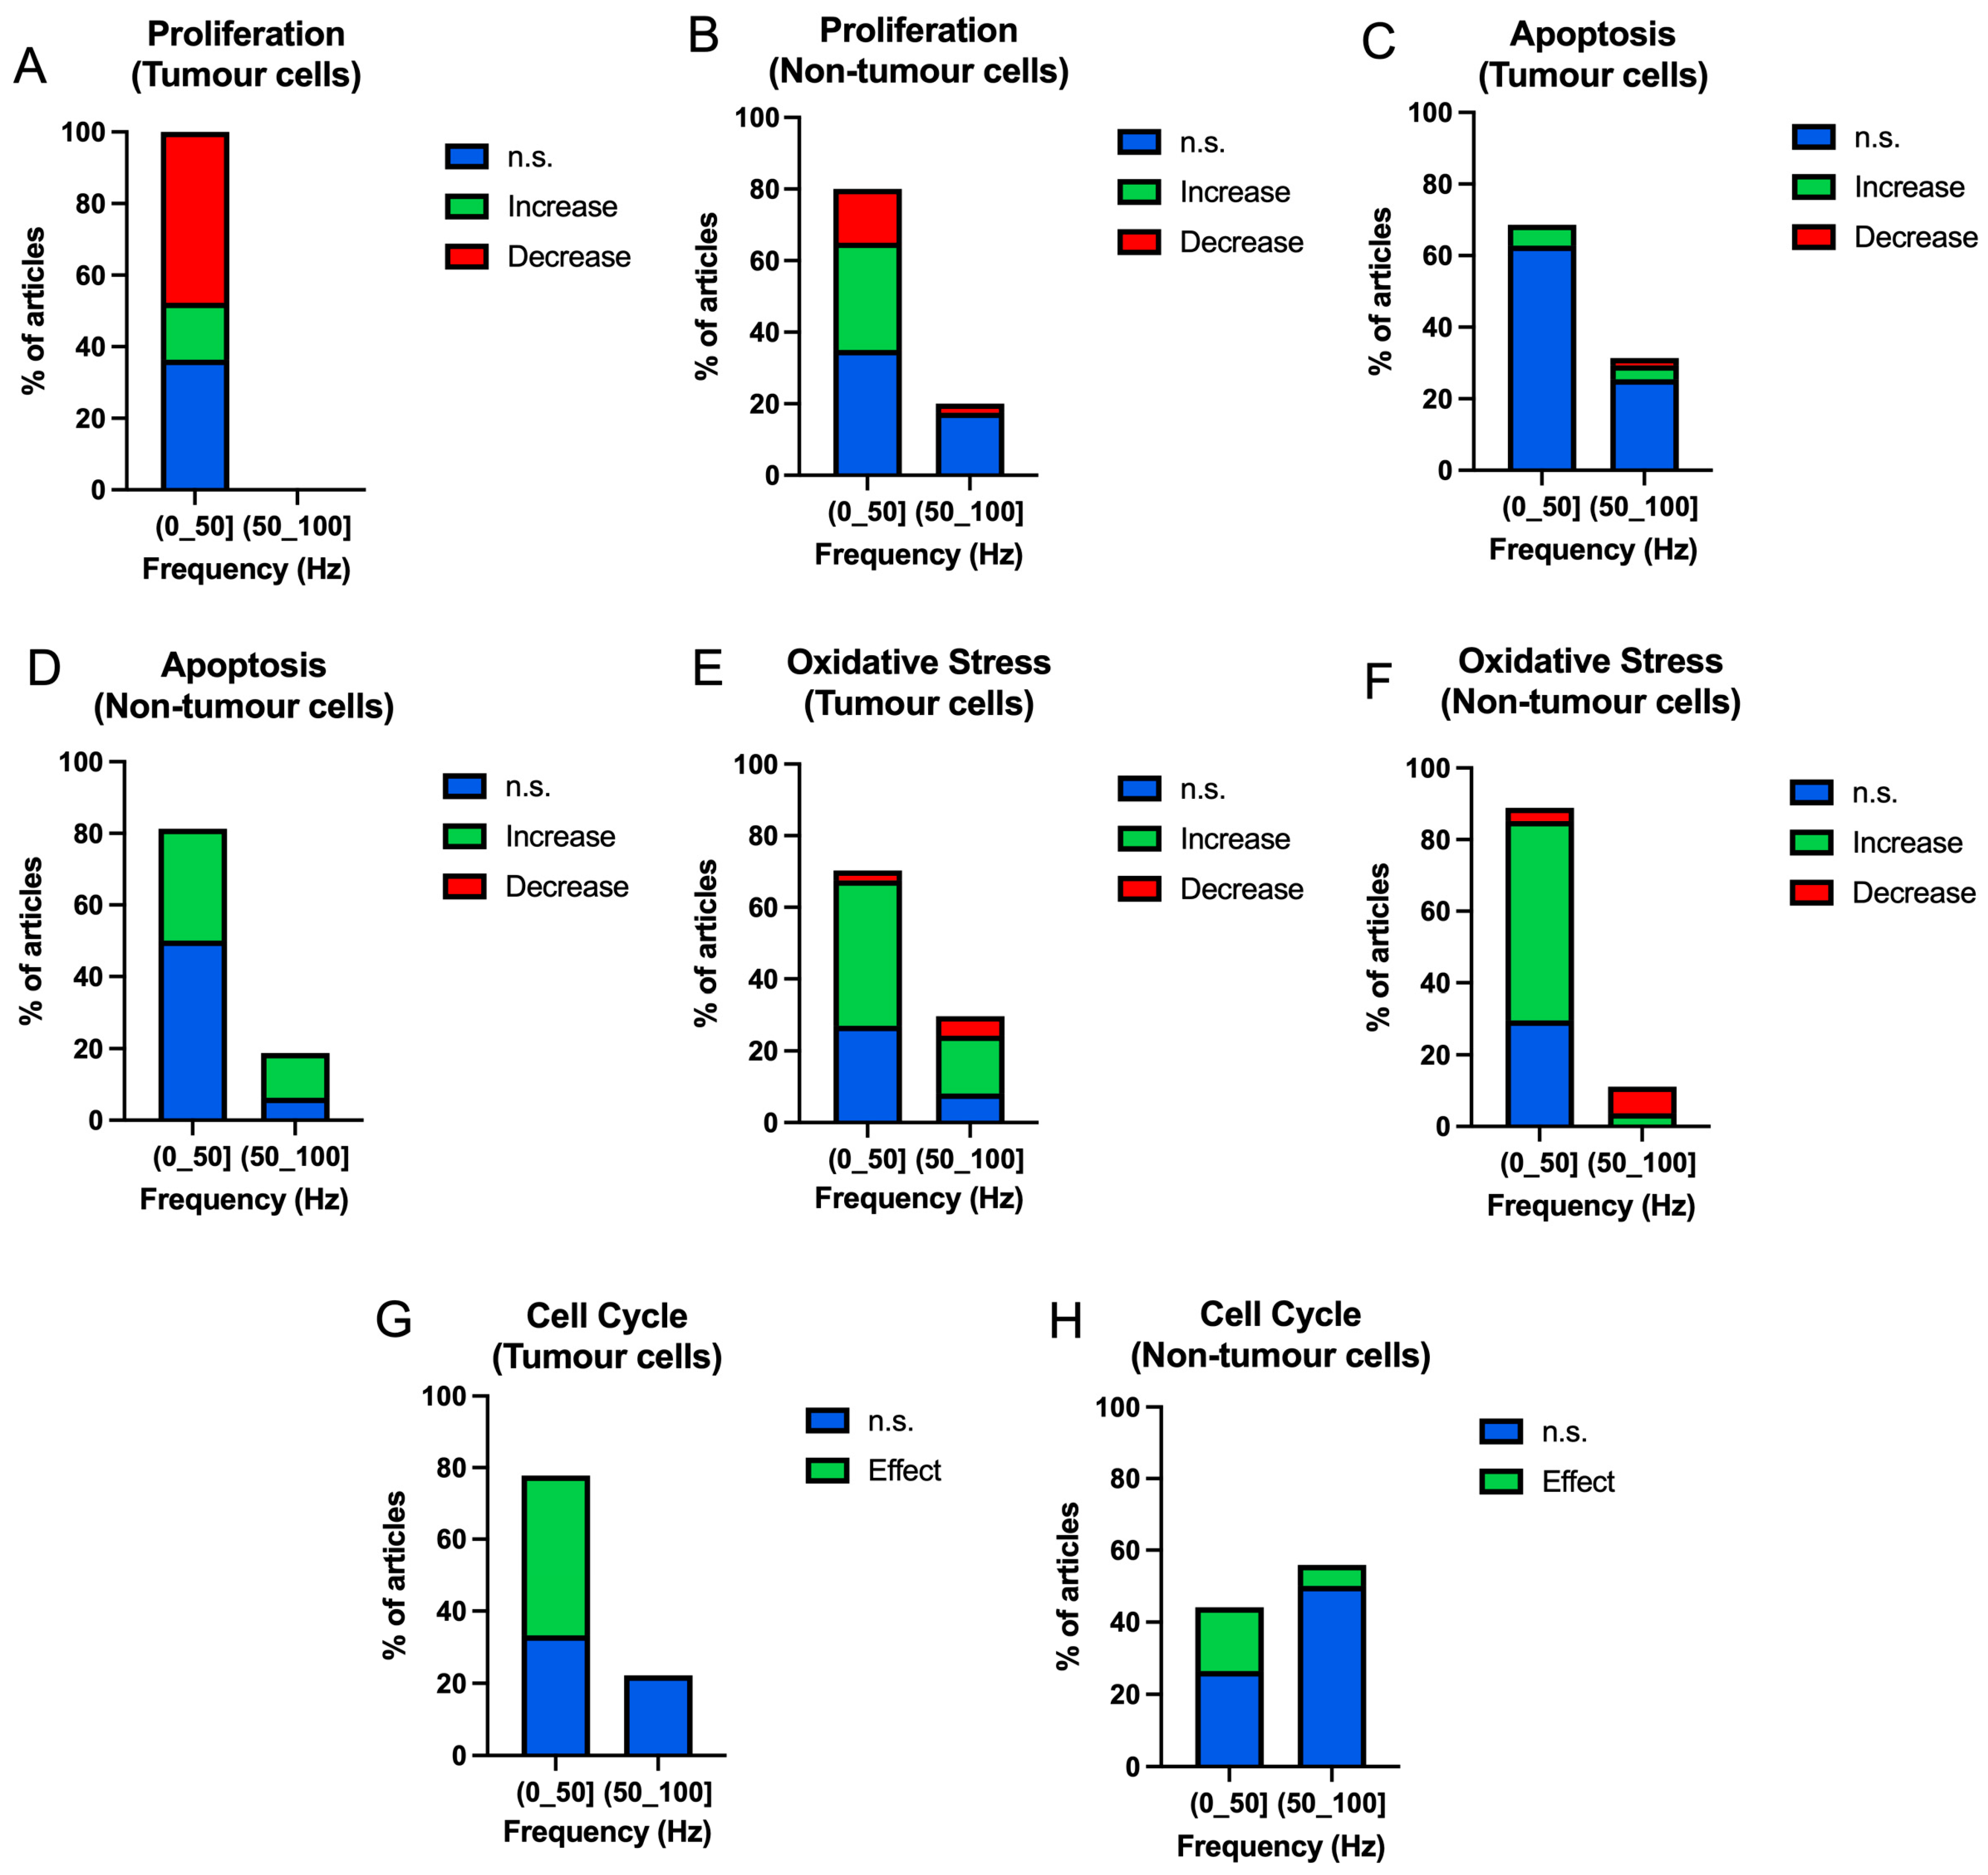
- Third division: frequency. Two frequency divisions are established: exposures at frequencies less than or equal to 50 Hz and exposures greater than 50 Hz.
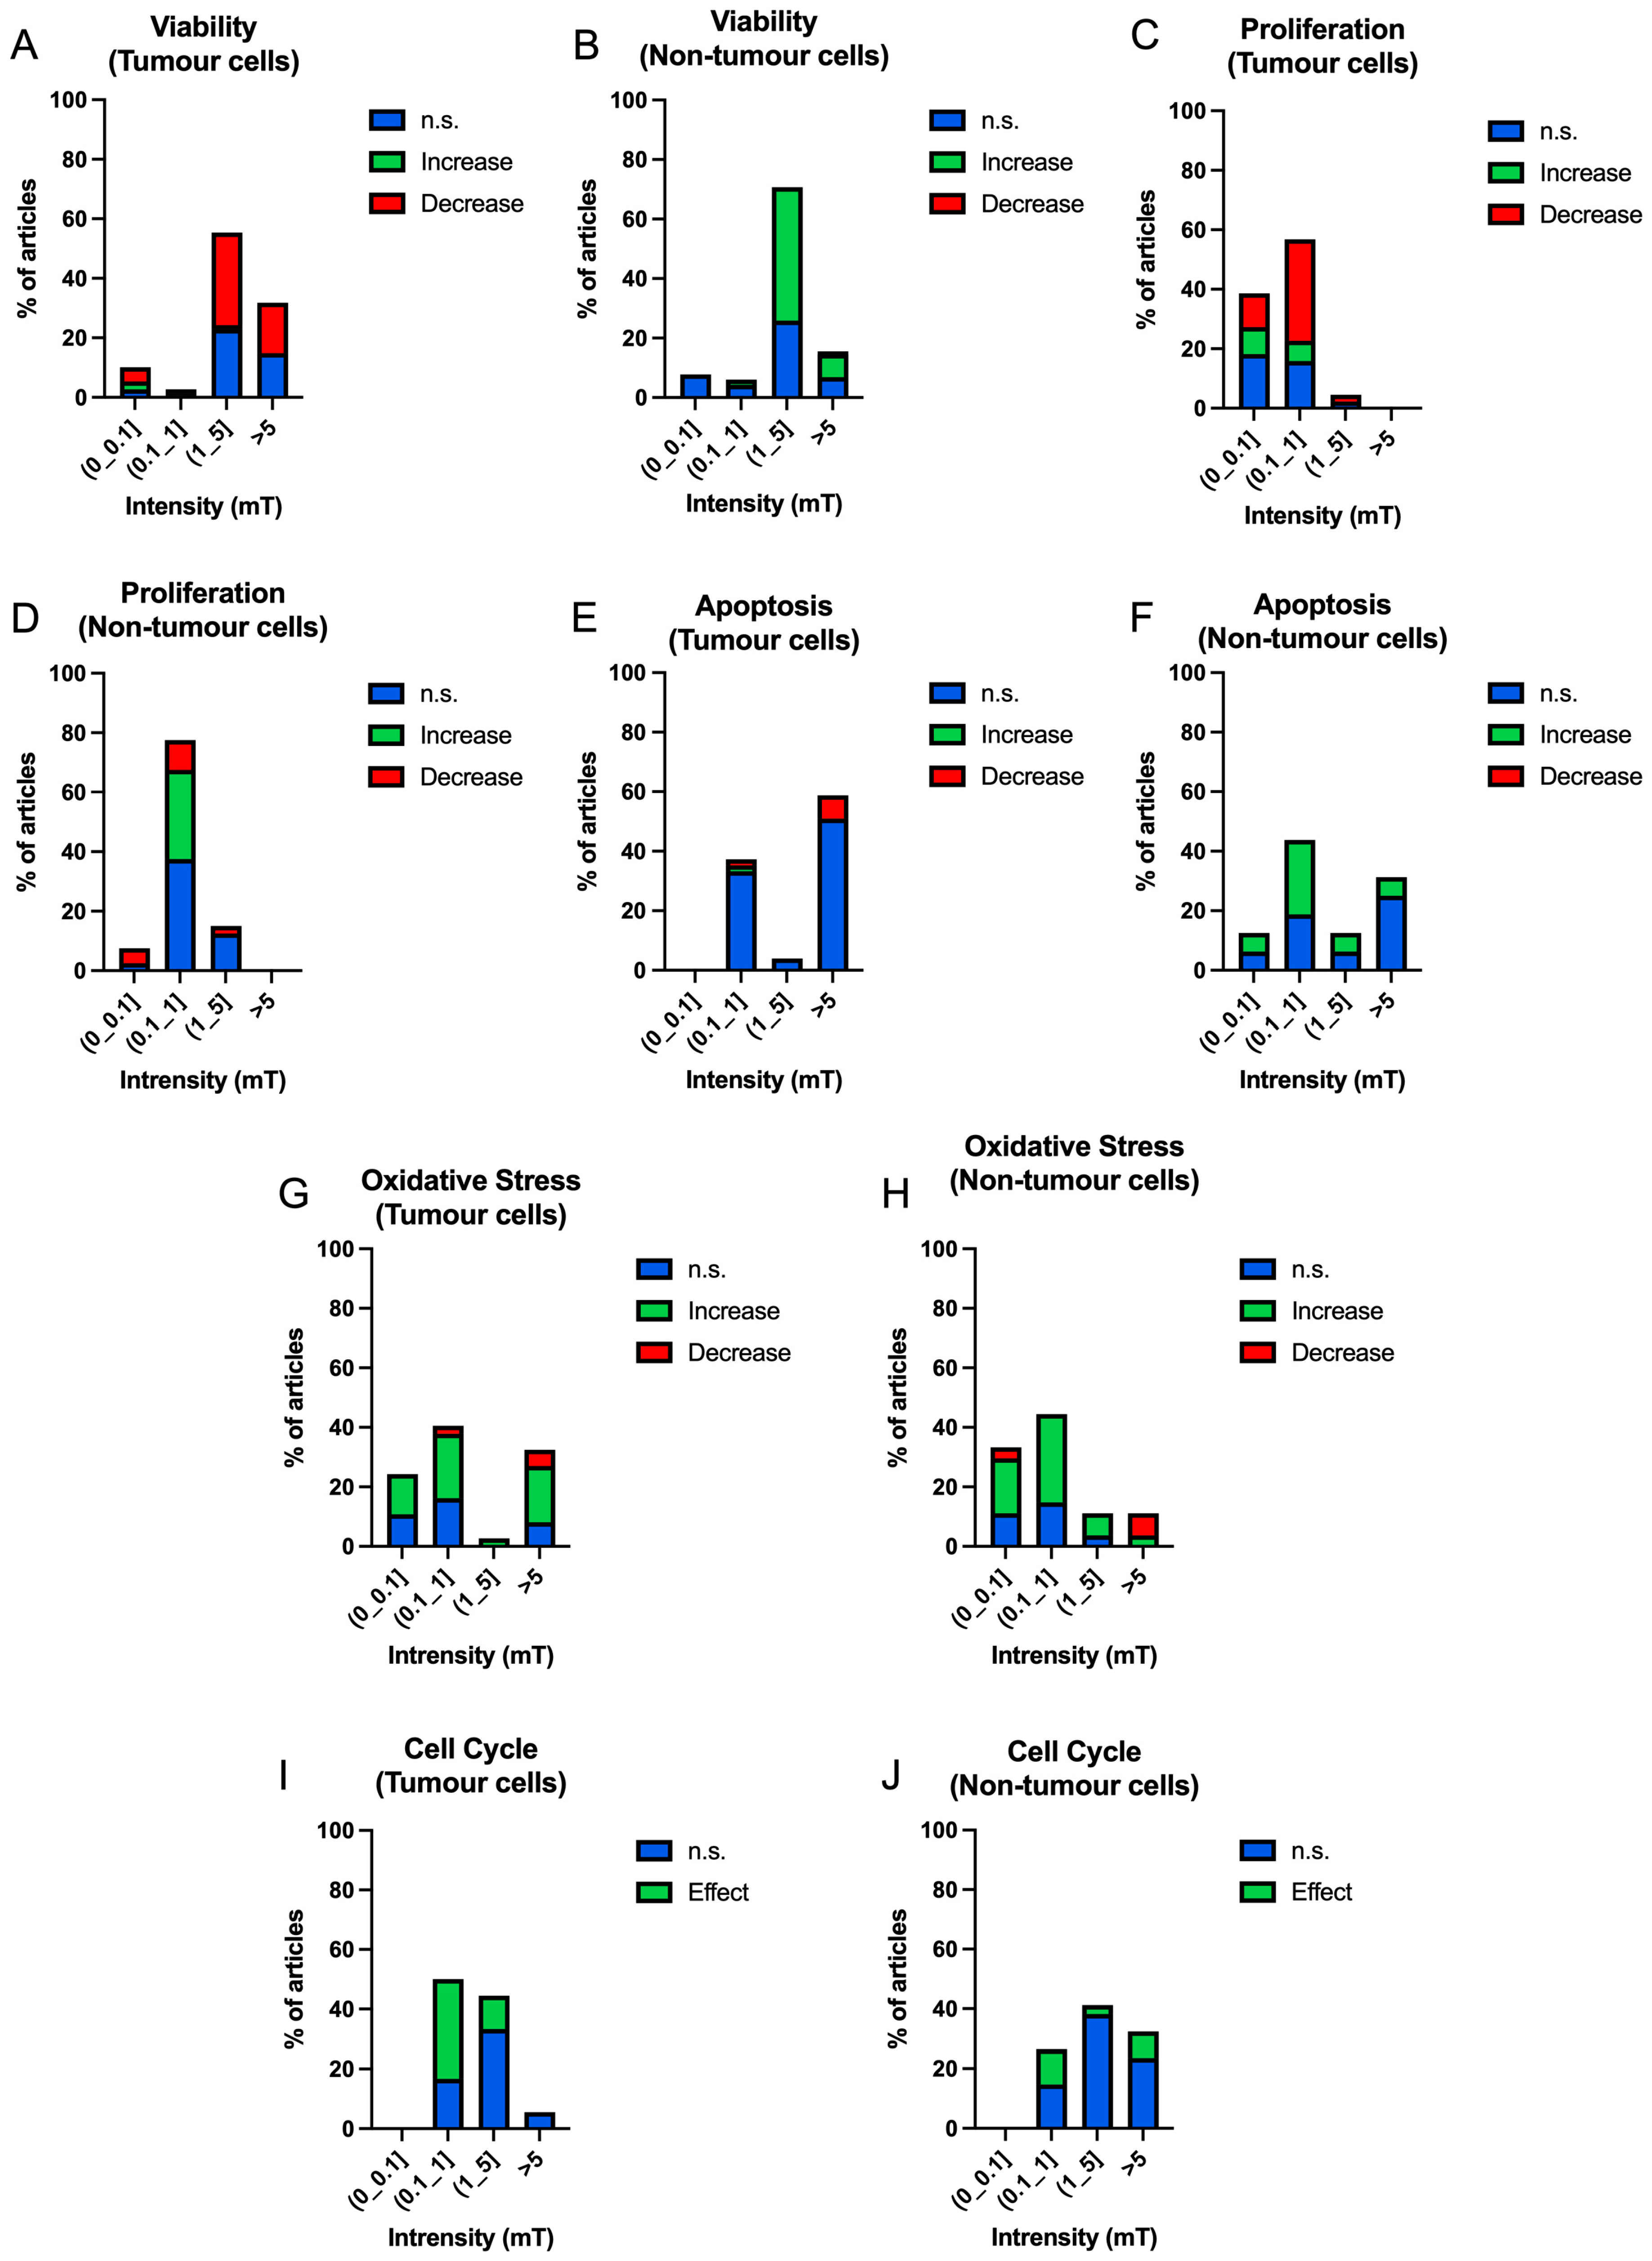
- Fourth division: intensity. Four levels of intensity are established: exposures at intensities less than or equal to 100 µT, exposures greater than 100 µT and less than or equal to 1 mT, exposures greater than 1 mT and less than or equal to 5 mT and, finally, exposures greater than 5 mT.
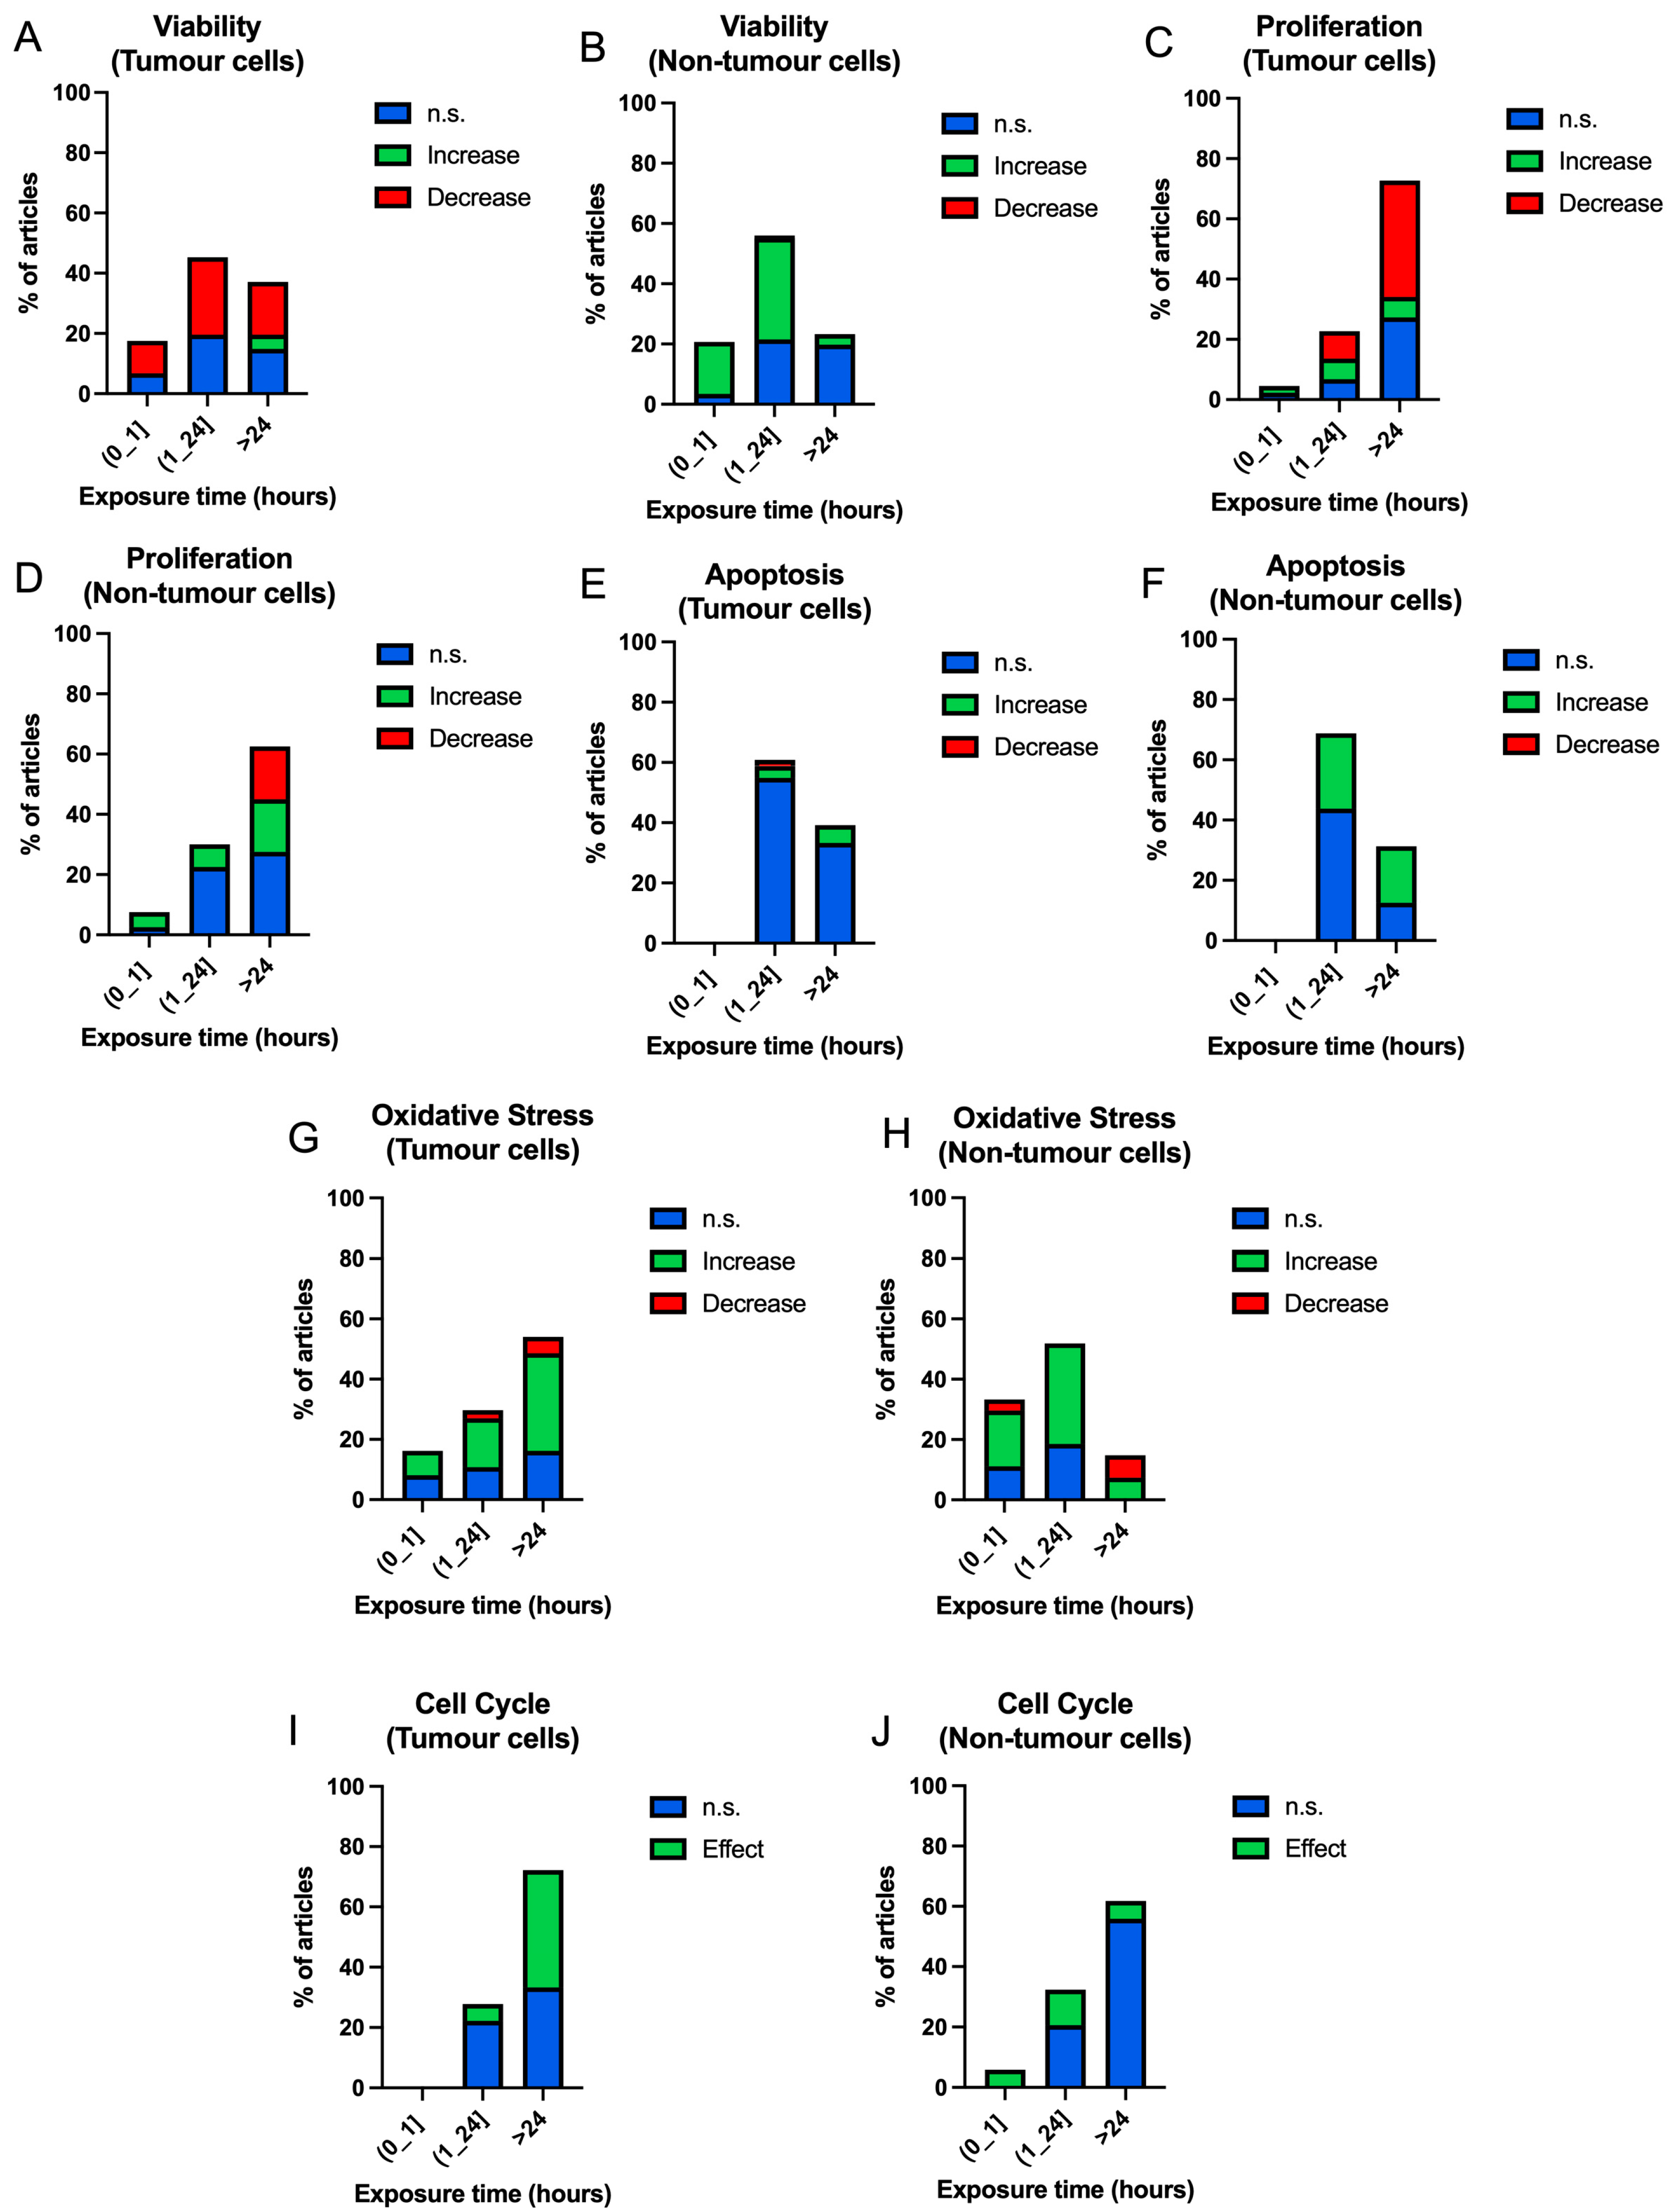
- Fifth division: time. Three exposure time bands are established: exposures less than or equal to 1 h; exposures greater than 1 h and less than or equal to 1 day; and, finally, exposures greater than 1 day.
3. Results
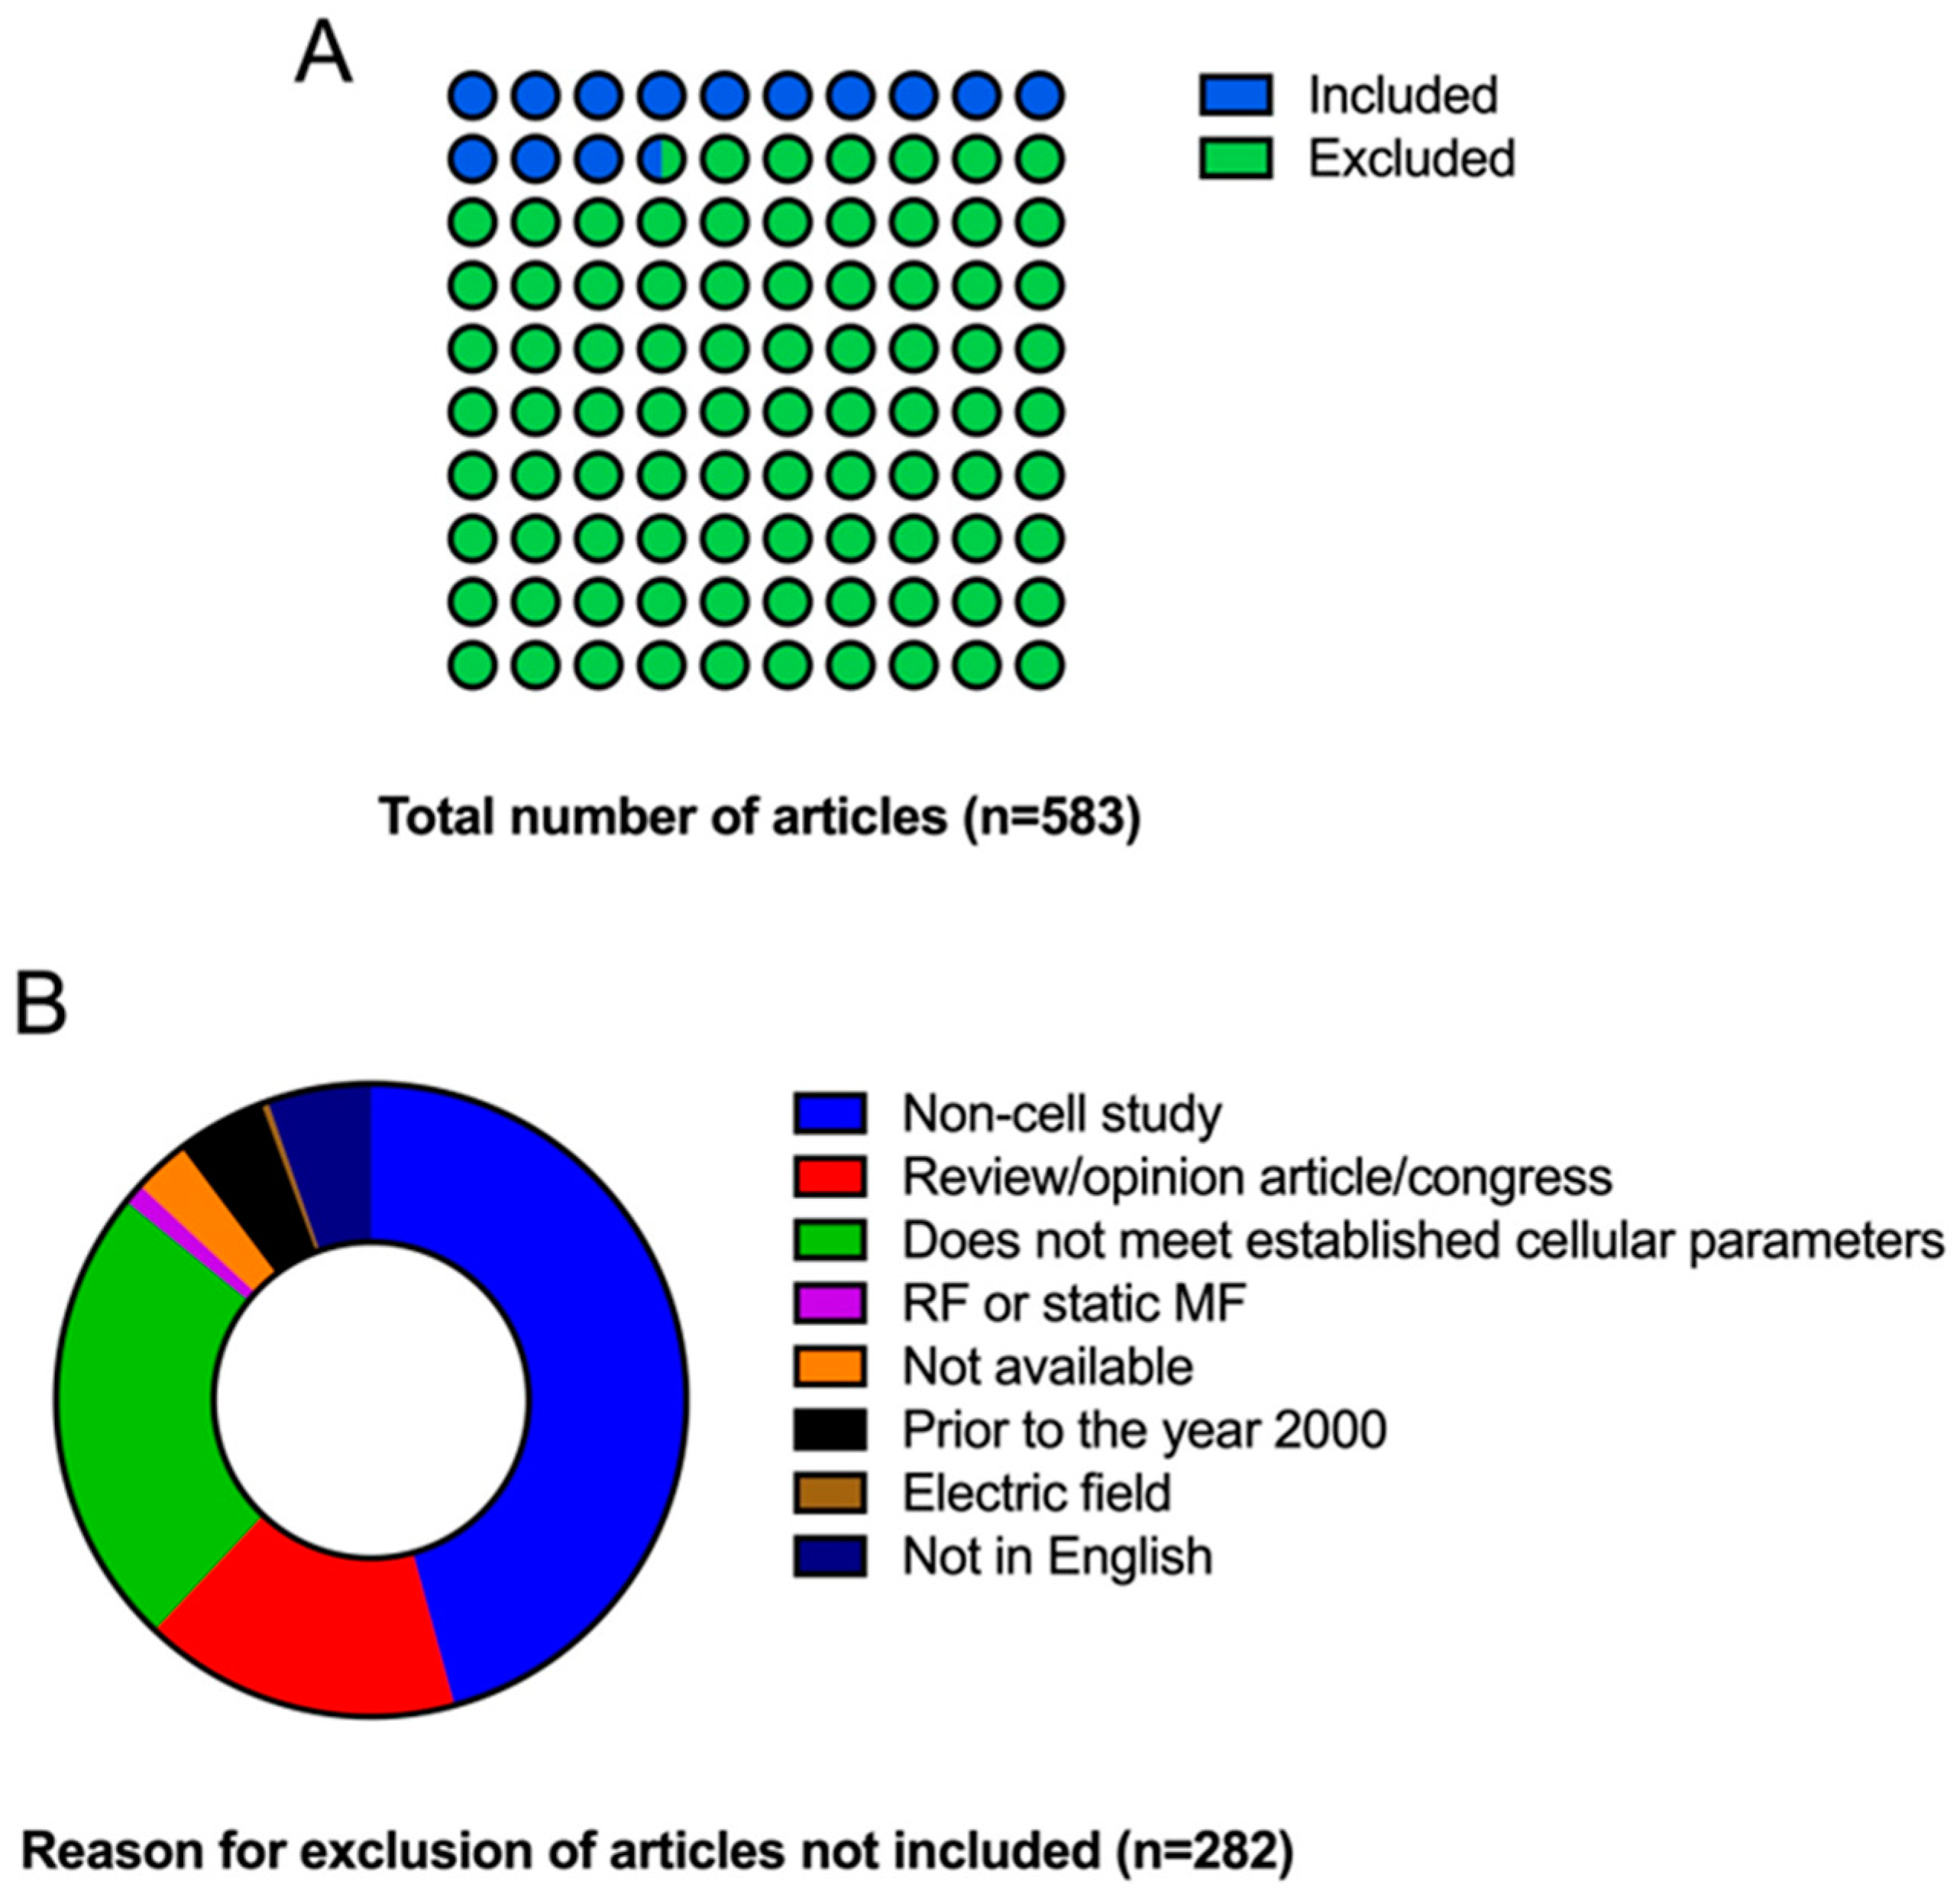
3.1. Selection of Sources of Evidence
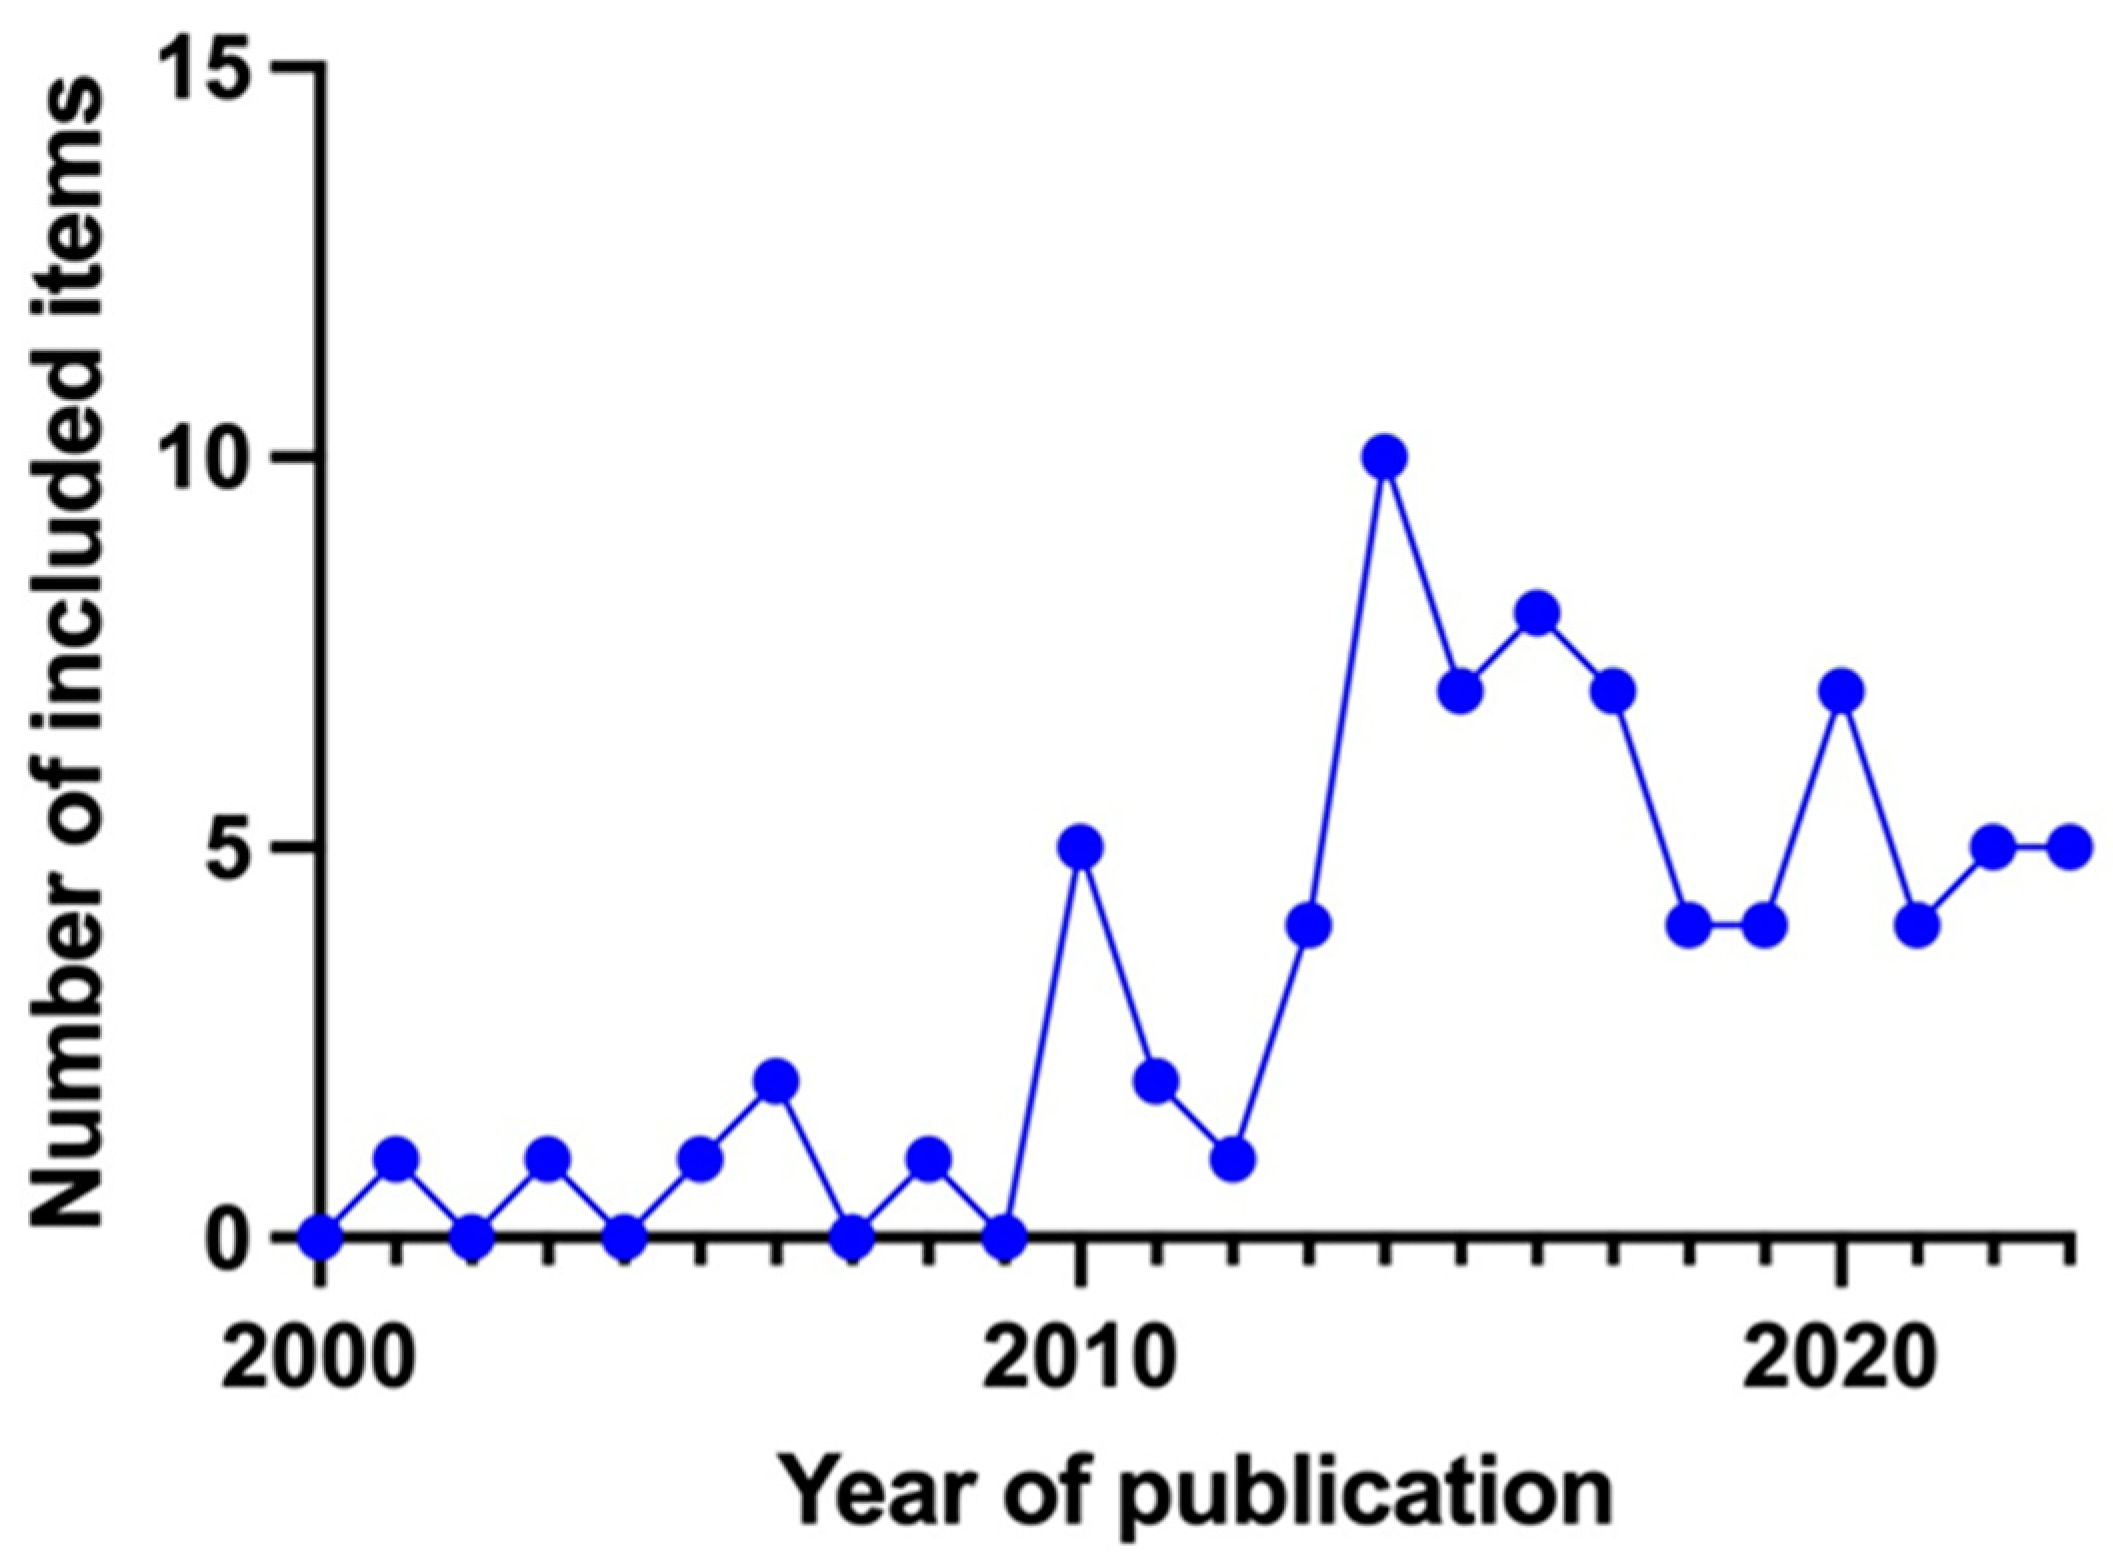
3.2. Characteristics of Sources of Evidence
3.3. The Results and Critical Appraisal of the Source of Evidence
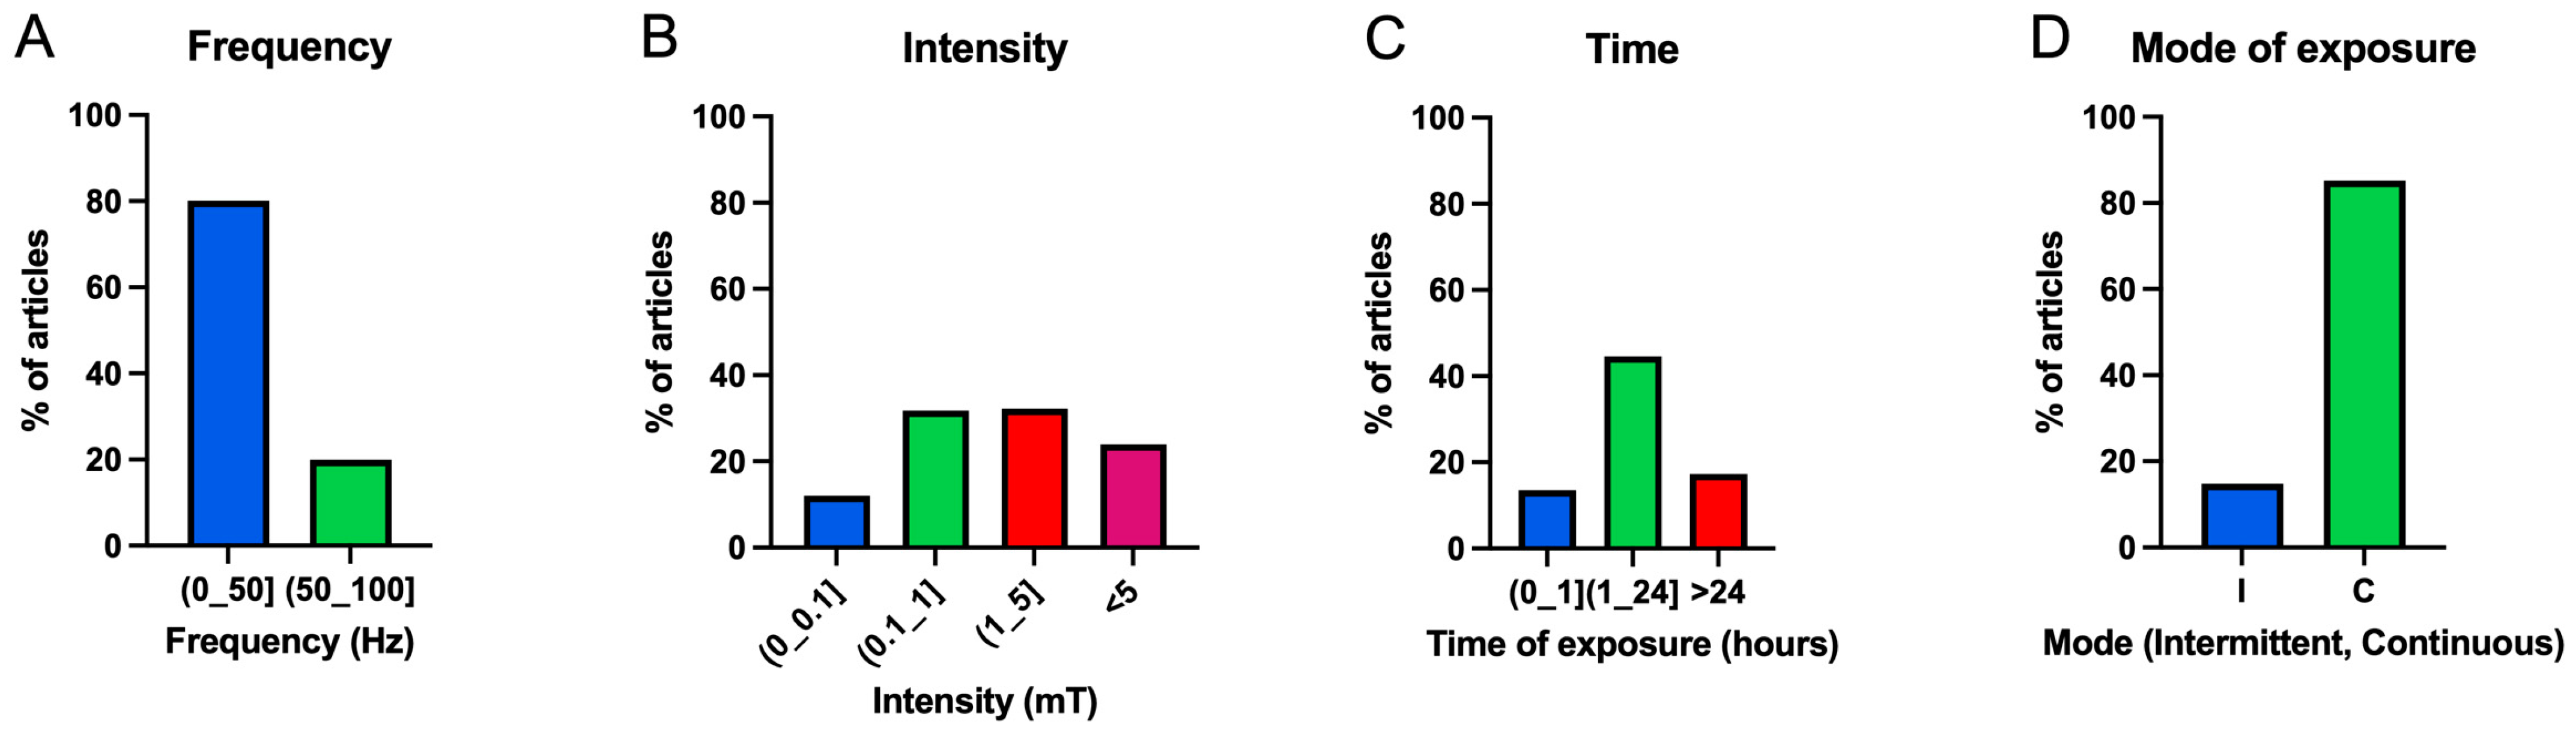
3.3.1. Frequency
3.3.2. Intensity
3.3.3. Exposure Time
3.3.4. Exposure Mode
4. Discussion
4.1. Summary of Evidence
4.2. Limitations
5. Conclusions
Supplementary Materials
Author Contributions
Funding
Institutional Review Board Statement
Informed Consent Statement
Data Availability Statement
Conflicts of Interest
References
- Blackman, C.F.; Benane, S.G.; Kinney, L.S.; Joines, W.T.; House, D.E. Effects of ELF Fields on Calcium-Ion Efflux from Brain Tissue in Vitro. Radiat. Res. 1982, 92, 510–520. [Google Scholar] [CrossRef] [PubMed]
- Blackman, C.F.; Benane, S.G.; House, D.E.; Joines, W.T. Effects of ELF (1–120 Hz) and Modulated (50 Hz) RF Fields on the Efflux of Calcium Ions from Brain Tissue in Vitro. Bioelectromagnetics 1985, 6, 1–11. [Google Scholar] [CrossRef] [PubMed]
- Blackman, C.F.; Benane, S.G.; Rabinowitz, J.R.; House, D.E.; Joines, W.T. A Role for the Magnetic Field in the Radiation-induced Efflux of Calcium Ions from Brain Tissue in Vitro. Bioelectromagnetics 1985, 6, 327–337. [Google Scholar] [CrossRef] [PubMed]
- Goodman, R.; Henderson, A.S. Sine Waves Enhance Cellular Transcription. Bioelectromagnetics 1986, 7, 23–29. [Google Scholar] [CrossRef] [PubMed]
- Goodman, R.; Bassett, C.A.L.; Henderson, A.S. Pulsing Electromagnetic Fields Induce Cellular Transcription. Science 1983, 220, 1283–1285. [Google Scholar] [CrossRef]
- Liboff, A.R.; Williams, T.; Strong, D.M.; Wistar, R. Time-Varying Magnetic Fields: Effect on DNA Synthesis. Science 1984, 223, 818–820. [Google Scholar] [CrossRef] [PubMed]
- Luben, R.A.; Cain, C.D.; Chen, M.C.-Y.; Rosen, D.M.; Adey, W.R. Effects of Electromagnetic Stimuli on Bone and Bone Cells in Vitro: Inhibition of Responses to Parathyroid Hormone by Low-Energy Low-Frequency Fields. Proc. Natl. Acad. Sci. USA 1982, 79, 4180–4184. [Google Scholar] [CrossRef]
- Mooney, N.A.; Smith, R.E.; Watson, B.W. Effect of Extremely-low-frequency Pulsed Magnetic Fields on the Mitogenic Response of Peripheral Blood Mononuclear Cells. Bioelectromagnetics 1986, 7, 387–394. [Google Scholar] [CrossRef] [PubMed]
- Frazier, M.E.; Reese, J.A.; Morris, J.E.; Jostes, R.F.; Miller, D.L. Exposure of Mammalian Cells to 60-Hz Magnetic or Electric Fields: Analysis of DNA Repair of Induced, Single-strand Breaks. Bioelectromagnetics 1990, 11, 229–234. [Google Scholar] [CrossRef]
- Liboff, A.R.; Parkinson, W.C. Search for Ion-cyclotron Resonance in an Na+-transport System. Bioelectromagnetics 1991, 12, 77–83. [Google Scholar] [CrossRef]
- Goodman, E.M.; Sharpe, P.T.; Greenebaum, B.; Marron, M.T. Pulsed Magnetic Fields Alter the Cell Surface. FEBS Lett. 1986, 199, 275–278. [Google Scholar] [CrossRef]
- International Commission on Non-Ionizing Radiation Protection (ICNIRP). Guidelines for Limiting Exposure to Time-Varying Electric, Magnetic, and Electromagnetic Fields (up to 300 GHz). Health Phys. 1998, 74, 494–522. [Google Scholar]
- Piszczek, P.; Wójcik-Piotrowicz, K.; Gil, K.; Kaszuba-Zwoińska, J. Immunity and Electromagnetic Fields. Environ. Res. 2021, 200, 111505. [Google Scholar] [CrossRef] [PubMed]
- Zhang, G.; Liu, X.; Liu, Y.; Zhang, S.; Yu, T.; Chai, X.; He, J.; Yin, D.; Zhang, C. The Effect of Magnetic Fields on Tumor Occurrence and Progression: Recent Advances. Prog. Biophys. Mol. Biol. 2023, 179, 38–50. [Google Scholar] [CrossRef]
- Golbach, L.A.; Portelli, L.A.; Savelkoul, H.F.J.; Terwel, S.R.; Kuster, N.; de Vries, R.B.M.; Verburg-van Kemenade, B.M.L. Calcium Homeostasis and Low-Frequency Magnetic and Electric Field Exposure: A Systematic Review and Meta-Analysis of in Vitro Studies. Environ. Int. 2016, 92–93, 695–706. [Google Scholar] [CrossRef] [PubMed]
- Ma, T.; Ding, Q.; Liu, C.; Wu, H. Electromagnetic Fields Regulate Calcium-Mediated Cell Fate of Stem Cells: Osteogenesis, Chondrogenesis and Apoptosis. Stem Cell Res. Ther. 2023, 14, 133. [Google Scholar] [CrossRef]
- Wang, H.; Zhang, X. Magnetic Fields and Reactive Oxygen Species. Int. J. Mol. Sci. 2017, 18, 2175. [Google Scholar] [CrossRef]
- Montoya, R.D. Magnetic Fields, Radicals and Cellular Activity. Electromagn. Biol. Med. 2017, 36, 102–113. [Google Scholar] [CrossRef]
- Vadalà, M.; Morales-Medina, J.C.; Vallelunga, A.; Palmieri, B.; Laurino, C.; Iannitti, T. Mechanisms and Therapeutic Effectiveness of Pulsed Electromagnetic Field Therapy in Oncology. Cancer Med. 2016, 5, 3128–3139. [Google Scholar] [CrossRef]
- Maffei, M.E. Magnetic Fields and Cancer: Epidemiology, Cellular Biology, and Theranostics. Int. J. Mol. Sci. 2022, 23, 1339. [Google Scholar] [CrossRef]
- Löscher, W.; Liburdy, R.P. Animal and Cellular Studies on Carcinogenic Effects of Low Frequency (50/60-Hz) Magnetic Fields 1 This Is the Last in a Series of Four Papers, the First of Which Was Published in Mutation Res. 387 (1997) pp. 165–171.1. Mutat. Res./Rev. Mutat. Res. 1998, 410, 185–220. [Google Scholar] [CrossRef] [PubMed]
- Kavet, R. EMF and Current Cancer Concepts. Bioelectromagnetics 1996, 17, 339–357. [Google Scholar] [CrossRef]
- Kocaman, A.; Altun, G.; Kaplan, A.A.; Deniz, Ö.G.; Yurt, K.K.; Kaplan, S. Genotoxic and Carcinogenic Effects of Non-Ionizing Electromagnetic Fields. Environ. Res. 2018, 163, 71–79. [Google Scholar] [CrossRef] [PubMed]
- Diab, K.A. The Impact of the Low Frequency of the Electromagnetic Field on Human. In Advances in Experimental Medicine and Biology; Springer: Berlin/Heidelberg, Germany, 2020; Volume 1237, pp. 135–149. [Google Scholar]
- Duan, Y.; Wu, X.; Gong, Z.; Guo, Q.; Kong, Y. Pathological Impact and Medical Applications of Electromagnetic Field on Melanoma: A Focused Review. Front. Oncol. 2022, 12, 857068. [Google Scholar] [CrossRef] [PubMed]
- Goldberg, R.B.; Creasey, W.A. A Review of Cancer Induction by Extremely Low Frequency Electromagnetic Fields. Is There a Plausible Mechanism? Med. Hypotheses 1991, 35, 265–274. [Google Scholar] [CrossRef] [PubMed]
- Holmberg, B. Magnetic Fields and Cancer: Animal and Cellular Evidence—An Overview. Environ. Health Perspect. 1995, 103, 63–67. [Google Scholar] [CrossRef] [PubMed]
- Lei, H.; Pan, Y.; Wu, R.; Lv, Y. Innate Immune Regulation Under Magnetic Fields With Possible Mechanisms and Therapeutic Applications. Front. Immunol. 2020, 11, 582772. [Google Scholar] [CrossRef]
- Simkó, M.; Mattsson, M.O. Extremely Low Frequency Electromagnetic Fields as Effectors of Cellular Responses in Vitro: Possible Immune Cell Activation. J. Cell Biochem. 2004, 93, 83–92. [Google Scholar] [CrossRef]
- Walleczek, J. Electromagnetic Field Effects on Cells of the Immune System: The Role of Calcium Signaling. FASEB J. 1992, 6, 3177–3185. [Google Scholar] [CrossRef]
- Simkó, M. Induction of Cell Activation Processes by Low Frequency Electromagnetic Fields. Sci. World J. 2004, 4 (Suppl. S2), 4–22. [Google Scholar] [CrossRef]
- Mahaki, H.; Tanzadehpanah, H.; Jabarivasal, N.; Sardanian, K.; Zamani, A. A Review on the Effects of Extremely Low Frequency Electromagnetic Field (ELF-EMF) on Cytokines of Innate and Adaptive Immunity. Electromagn. Biol. Med. 2019, 38, 84–95. [Google Scholar] [CrossRef] [PubMed]
- Lopez-Martin, M.E.; Sueiro-Benavides, R.A.; Leiro-Vidal, J.M.; Rodriguez-Gonzalez, J.A.; Ares-Pena, F.J. Can Electromagnetic Fields Modulate Inflammation and Cell Death by Acting on the Immune System? IEEE Access 2023, 11, 92167–92187. [Google Scholar] [CrossRef]
- Guerriero, F.; Ricevuti, G. Extremely Low Frequency Electromagnetic Fields Stimulation Modulates Autoimmunity and Immune Responses: A Possible Immuno-Modulatory Therapeutic Effect in Neurodegenerative Diseases. Neural Regen. Res. 2016, 11, 1888–1895. [Google Scholar] [CrossRef] [PubMed]
- Rosado, M.M.; Simkó, M.; Mattsson, M.O.; Pioli, C. Immune-Modulating Perspectives for Low Frequency Electromagnetic Fields in Innate Immunity. Front. Public Health 2018, 6, 323464. [Google Scholar] [CrossRef] [PubMed]
- Saliev, T.; Begimbetova, D.; Masoud, A.R.; Matkarimov, B. Biological Effects of Non-Ionizing Electromagnetic Fields: Two Sides of a Coin. Prog. Biophys. Mol. Biol. 2019, 141, 25–36. [Google Scholar] [CrossRef] [PubMed]
- Bassett, C.A.L. Beneficial Effects of Electromagnetic Fields. J. Cell Biochem. 1993, 51, 387–393. [Google Scholar] [CrossRef] [PubMed]
- Lai, H. Genetic Effects of Non-Ionizing Electromagnetic Fields. Electromagn. Biol. Med. 2021, 40, 264–273. [Google Scholar] [CrossRef]
- Valberg, P.A. Designing EMF Experiments: What Is Required to Characterize “Exposure”? Bioelectromagnetics 1995, 16, 396–401. [Google Scholar] [CrossRef] [PubMed]
- Misakian, M.; Kaune, W.T. Optimal Experimental Design for in Vitro Studies with ELF Magnetic Fields. Bioelectromagnetics 1990, 11, 251–255. [Google Scholar] [CrossRef]
- Misakian, M.; Sheppard, A.R.; Krause, D.; Frazier, M.E.; Miller, D.L. Biological, Physical, and Electrical Parameters for in Vitro Studies with ELF Magnetic and Electric Fields: A Primer. Bioelectromagnetics 1993, 14, 1–73. [Google Scholar] [CrossRef]
- Ruiz-Gómez, M.J.; Martínez-Morillo, M. Electromagnetic Fields and the Induction of DNA Strand Breaks. Electromagn. Biol. Med. 2009, 28, 201–214. [Google Scholar] [CrossRef] [PubMed]
- Vijayalaxmi; Obe, G. Controversial Cytogenetic Observations in Mammalian Somatic Cells Exposed to Extremely Low Frequency Electromagnetic Radiation: A Review and Future Research Recommendations. Bioelectromagnetics 2005, 26, 412–430. [Google Scholar] [CrossRef] [PubMed]
- Barati, M.; Darvishi, B.; Javidi, M.A.; Mohammadian, A.; Shariatpanahi, S.P.; Eisavand, M.R.; Madjid Ansari, A. Cellular Stress Response to Extremely Low-Frequency Electromagnetic Fields (ELF-EMF): An Explanation for Controversial Effects of ELF-EMF on Apoptosis. Cell Prolif. 2021, 54, e13154. [Google Scholar] [CrossRef] [PubMed]
- Costin, G.-E.; Birlea, S.A.; Norris, D.A. Trends in Wound Repair: Cellular and Molecular Basis of Regenerative Therapy Using Electromagnetic Fields. Curr. Mol. Med. 2012, 12, 14–26. [Google Scholar] [CrossRef]
- Adey, W.R. Biological Effects of Electromagnetic Fields. J. Cell Biochem. 1993, 51, 410–416. [Google Scholar] [CrossRef] [PubMed]
- Azanza, M.J.; del Moral, A. Cell Membrane Biochemistry and Neurobiological Approach to Biomagnetism. Prog. Neurobiol. 1994, 44, 517–601. [Google Scholar] [CrossRef] [PubMed]
- Barnes, F.S. Some Engineering Models for Interactions of Electric and Magnetic Fields with Biological Systems. Bioelectromagnetics 1992, 13, 67–85. [Google Scholar] [CrossRef]
- Grundler, W.; Kaiser, F.; Keilmann, F.; Walleczek, J. Mechanisms of Electromagnetic Interaction with Cellular Systems. Naturwissenschaften 1992, 79, 551–559. [Google Scholar] [CrossRef] [PubMed]
- Pilla, A.A.; Markov, M.S. Bioeffects of Weak Electromagnetic Fields. Rev. Environ. Health 1994, 10, 155–170. [Google Scholar] [CrossRef]
- Krylov, V.V.; Osipova, E.A. Molecular Biological Effects of Weak Low-Frequency Magnetic Fields: Frequency–Amplitude Efficiency Windows and Possible Mechanisms. Int. J. Mol. Sci. 2023, 24, 10989. [Google Scholar] [CrossRef]
- Lednev, V.V. Possible Mechanism for the Influence of Weak Magnetic Fields on Biological Systems. Bioelectromagnetics 1991, 12, 71–75. [Google Scholar] [CrossRef] [PubMed]
- Adey, W.R. Tissue Interactions with Nonionizing Electromagnetic Fields. Physiol. Rev. 1981, 61, 435–514. [Google Scholar] [CrossRef] [PubMed]
- Bawin, S.M.; Sheppard, A.; Adey, W.R. 203—Possible Mechanisms of Weak Electromagnetic Field Coupling in Brain Tissue. Bioelectrochem. Bioenerg. 1978, 5, 67–76. [Google Scholar] [CrossRef]
- García-minguillán, O.; Maestú, C. 30 Hz, Could It Be Part of a Window Frequency for Cellular Response? Int. J. Mol. Sci. 2021, 22, 3642. [Google Scholar] [CrossRef]
- Maziarz, A.; Kocan, B.; Bester, M.; Budzik, S.; Cholewa, M.; Ochiya, T.; Banas, A. How Electromagnetic Fields Can Influence Adult Stem Cells: Positive and Negative Impacts. Stem Cell Res. Ther. 2016, 7, 54. [Google Scholar] [CrossRef] [PubMed]
- Klimek, A.; Rogalska, J. Extremely Low-Frequency Magnetic Field as a Stress Factor—Really Detrimental?—Insight into Literature from the Last Decade. Brain Sci. 2021, 11, 174. [Google Scholar] [CrossRef] [PubMed]
- Lacy-hulbert, A.; Metcalfe, J.C.; Hesketh, R. Biological Responses to Electromagnetic Fields. FASEB J. 1998, 12, 395–420. [Google Scholar] [CrossRef] [PubMed]
- Lai, H.; Levitt, B.B. Cellular and molecular effects of non-ionizing electromagnetic fields. Rev. Environ. Health 2023. [Google Scholar] [CrossRef] [PubMed]
- Lee, S.K.; Park, S.; Gimm, Y.M.; Kim, Y.W. Extremely Low Frequency Magnetic Fields Induce Spermatogenic Germ Cell Apoptosis: Possible Mechanism. Biomed. Res. Int. 2014, 2014, 567183. [Google Scholar] [CrossRef]
- Lai, H. Exposure to Static and Extremely-Low Frequency Electromagnetic Fields and Cellular Free Radicals. Electromagn. Biol. Med. 2019, 38, 231–248. [Google Scholar] [CrossRef]
- Schuermann, D.; Mevissen, M. Manmade Electromagnetic Fields and Oxidative Stress—Biological Effects and Consequences for Health. Int. J. Mol. Sci. 2021, 22, 3772. [Google Scholar] [CrossRef] [PubMed]
- Perez, F.P.; Bandeira, J.P.; Perez Chumbiauca, C.N.; Lahiri, D.K.; Morisaki, J.; Rizkalla, M. Multidimensional Insights into the Repeated Electromagnetic Field Stimulation and Biosystems Interaction in Aging and Age-Related Diseases. J. Biomed. Sci. 2022, 29, 39. [Google Scholar]
- Luben, R.A. Effects of Low-Energy Electromagnetic Fields (Pulsed and DC) on Membrane Signal Transduction Processes in Biological Systems. Health Phys. 1991, 61, 15–28. [Google Scholar] [CrossRef] [PubMed]
- Saliev, T.; Mustapova, Z.; Kulsharova, G.; Bulanin, D.; Mikhalovsky, S. Therapeutic Potential of Electromagnetic Fields for Tissue Engineering and Wound Healing. Cell Prolif. 2014, 47, 485–493. [Google Scholar] [CrossRef] [PubMed]
- Gualdi, G.; Costantini, E.; Reale, M.; Amerio, P. Wound Repair and Extremely Low Frequency-Electromagnetic Field: Insight from In Vitro Study and Potential Clinical Application. Int. J. Mol. Sci. 2021, 22, 5037. [Google Scholar] [CrossRef] [PubMed]
- Wang, T.; Xie, W.; Ye, W.; He, C. Effects of Electromagnetic Fields on Osteoarthritis. Biomed. Pharmacother. 2019, 118, 109282. [Google Scholar] [CrossRef] [PubMed]
- Otter, M.W.; McLeod, K.J.; Rubin, C.T. Effects of Electromagnetic Fields in Experimental Fracture Repair. Clin. Orthop. Relat. Res. 1998, 355, S90–S104. [Google Scholar] [CrossRef] [PubMed]
- Ross, C.L.; Siriwardane, M.; Almeida-Porada, G.; Porada, C.D.; Brink, P.; Christ, G.J.; Harrison, B.S. The Effect of Low-Frequency Electromagnetic Field on Human Bone Marrow Stem/Progenitor Cell Differentiation. Stem Cell Res. 2015, 15, 96–108. [Google Scholar] [CrossRef] [PubMed]
- Galli, C.; Colangelo, M.; Pedrazzi, G.; Guizzardi, S. The Response of Osteoblasts and Bone to Sinusoidal Electromagnetic Fields: Insights from the Literature. Calcif. Tissue Int. 2019, 105, 127–147. [Google Scholar] [CrossRef]
- Yuan, J.; Xin, F.; Jiang, W. Underlying Signaling Pathways and Therapeutic Applications of Pulsed Electromagnetic Fields in Bone Repair. Cell. Physiol. Biochem. 2018, 46, 1581–1594. [Google Scholar] [CrossRef]
- Moya Gómez, A.; Font, L.P.; Brône, B.; Bronckaers, A. Electromagnetic Field as a Treatment for Cerebral Ischemic Stroke. Front. Mol. Biosci. 2021, 8, 742596. [Google Scholar] [CrossRef]
- Tricco, A.C.; Lillie, E.; Zarin, W.; O’Brien, K.K.; Colquhoun, H.; Levac, D.; Moher, D.; Peters, M.D.J.; Horsley, T.; Weeks, L.; et al. PRISMA Extension for Scoping Reviews (PRISMA-ScR): Checklist and Explanation. Ann. Intern. Med. 2018, 169, 467–473. [Google Scholar] [CrossRef]
- Nezamtaheri, M.S.; Goliaei, B.; Shariatpanahi, S.P.; Ansari, A.M. Differential Biological Responses of Adherent and Non-Adherent (Cancer and Non-Cancerous) Cells to Variable Extremely Low Frequency Magnetic Fields. Sci. Rep. 2022, 12, 14225. [Google Scholar] [CrossRef]
- Koziorowska, A.; Romerowicz-Misielak, M.; Sołek, P.; Koziorowski, M. Extremely Low Frequency Variable Electromagnetic Fields Affect Cancer and Noncancerous Cells in Vitro Differently: Preliminary Study. Electromagn. Biol. Med. 2018, 37, 35–42. [Google Scholar] [CrossRef]
- Ledda, M.; D’emilia, E.; Lolli, M.G.; Marchese, R.; De Lazzari, C.; Lisi, A. Non-Ionizing Radiation for Cardiac Human Amniotic Mesenchymal Stromal Cell Commitment: A Physical Strategy in Regenerative Medicine. Int. J. Mol. Sci. 2018, 19, 2324. [Google Scholar] [CrossRef] [PubMed]
- López, O.G.M.; Valbuena, A.J.; Unturbe, C.M. Significant Cellular Viability Dependence on Time Exposition at ELF-EMF and RF-EMF in Vitro Studies. Int. J. Environ. Res. Public. Health 2019, 16, 2085. [Google Scholar] [CrossRef] [PubMed]
- García-minguillán, O.; Prous, R.; Ramirez-castillejo, M.D.C.; Maestú, C. CT2A Cell Viability Modulated by Electromagnetic Fields at Extremely Low Frequency under No Thermal Effects. Int. J. Mol. Sci. 2020, 21, 152. [Google Scholar] [CrossRef] [PubMed]
- Wang, M.H.; Chen, K.W.; Ni, D.X.; Fang, H.J.; Jang, L.S.; Chen, C.H. Effect of Extremely Low Frequency Electromagnetic Field Parameters on the Proliferation of Human Breast Cancer. Electromagn. Biol. Med. 2021, 40, 384–392. [Google Scholar] [CrossRef]
- Yin, C.; Luo, X.; Duan, Y.; Duan, W.; Zhang, H.; He, Y.; Sun, G.; Sun, X. Neuroprotective Effects of Lotus Seedpod Procyanidins on Extremely Low Frequency Electromagnetic Field-Induced Neurotoxicity in Primary Cultured Hippocampal Neurons. Biomed. Pharmacother. 2016, 82, 628–639. [Google Scholar] [CrossRef]
- Cho, S.; Lee, Y.; Lee, S.; Choi, Y.J.; Chung, H.W. Enhanced Cytotoxic and Genotoxic Effects of Gadolinium Following ELF-EMF Irradiation in Human Lymphocytes. Drug Chem. Toxicol. 2014, 37, 440–447. [Google Scholar] [CrossRef]
- de Groot, M.W.G.D.M.; van Kleef, R.G.D.M.; de Groot, A.; Westerink, R.H.S. Developmental Neurotoxicity Following Chronic Exposure to 50 Hz Extremely Low-Frequency Electromagnetic Fields in Primary Rat Cortical Cultures. Toxicol. Sci. 2016, 149, 433–440. [Google Scholar] [CrossRef] [PubMed]
- Calcabrini, C.; Mancini, U.; De Bellis, R.; Diaz, A.R.; Martinelli, M.; Cucchiarini, L.; Sestili, P.; Stocchi, V.; Potenza, L. Effect of Extremely Low-Frequency Electromagnetic Fields on Antioxidant Activity in the Human Keratinocyte Cell Line NCTC 2544. Biotechnol. Appl. Biochem. 2017, 64, 415–422. [Google Scholar] [CrossRef]
- Morabito, C.; Steimberg, N.; Rovetta, F.; Boniotti, J.; Guarnieri, S.; Mazzoleni, G.; Mariggiò, M.A. Extremely Low-Frequency Electromagnetic Fields Affect Myogenic Processes in C2C12 Myoblasts: Role of Gap-Junction-Mediated Intercellular Communication. Biomed. Res. Int. 2017, 2017, 2460215. [Google Scholar] [CrossRef]
- Ma, Q.; Deng, P.; Zhu, G.; Liu, C.; Zhang, L.; Zhou, Z.; Luo, X.; Li, M.; Zhong, M.; Yu, Z.; et al. Extremely Low-Frequency Electromagnetic Fields Affect Transcript Levels of Neuronal Differentiation-Related Genes in Embryonic Neural Stem Cells. PLoS ONE 2014, 9, e90041. [Google Scholar] [CrossRef]
- Costantini, E.; Marconi, G.D.; Fonticoli, L.; Aielli, L.; Trubiani, O.; Rajan, T.S.; Pizzicannella, J.; Reale, M.; Diomede, F. Improved Osteogenic Differentiation by Extremely Low Electromagnetic Field Exposure: Possible Application for Bone Engineering. Histochem. Cell Biol. 2022, 158, 369–381. [Google Scholar] [CrossRef] [PubMed]
- Duan, W.; Liu, C.; Zhang, L.; He, M.; Xu, S.; Chen, C.; Pi, H.; Gao, P.; Zhang, Y.; Zhong, M.; et al. Comparison of the Genotoxic Effects Induced by 50 Hz Extremely Low-Frequency Electromagnetic Fields and 1800 MHz Radiofrequency Electromagnetic Fields in GC-2 Cells. Radiat. Res. 2015, 183, 305–314. [Google Scholar] [CrossRef] [PubMed]
- Park, J.E.; Seo, Y.K.; Yoon, H.H.; Kim, C.W.; Park, J.K.; Jeon, S. Electromagnetic Fields Induce Neural Differentiation of Human Bone Marrow Derived Mesenchymal Stem Cells via ROS Mediated EGFR Activation. Neurochem. Int. 2013, 62, 418–424. [Google Scholar] [CrossRef]
- Song, K.; Im, S.H.; Yoon, Y.J.; Kim, H.M.; Lee, H.J.; Park, G.S. A 60 Hz Uniform Electromagnetic Field Promotes Human Cell Proliferation by Decreasing Intracellular Reactive Oxygen Species Levels. PLoS ONE 2018, 13, e0199753. [Google Scholar] [CrossRef]
- Garip, A.; Akan, Z. Effect of ELF-EMF on Number of Apoptotic Cells; Correlation with Reactive Oxygen Species and HSP. Acta Biol. Hung. 2010, 61, 158–167. [Google Scholar] [CrossRef]
- Vianale, G.; Reale, M.; Amerio, P.; Stefanachi, M.; Di Luzio, S.; Muraro, R. Extremely Low Frequency Electromagnetic Field Enhances Human Keratinocyte Cell Growth and Decreases Proinflammatory Chemokine Production. Br. J. Dermatol. 2008, 158, 1189–1196. [Google Scholar] [CrossRef]
- Morabito, C.; Guarnieri, S.; Fanò, G.; Mariggiò, M.A. Effects of Acute and Chronic Low Frequency Electromagnetic Field Exposure on PC12 Cells during Neuronal Differentiation. Cell. Physiol. Biochem. 2010, 26, 947–958. [Google Scholar] [CrossRef] [PubMed]
- Reale, M.; Kamal, M.A.; Patruno, A.; Costantini, E.; D’Angelo, C.; Pesce, M.; Greig, N.H. Neuronal Cellular Responses to Extremely Low Frequency Electromagnetic Field Exposure: Implications Regarding Oxidative Stress and Neurodegeneration. PLoS ONE 2014, 9, e104973. [Google Scholar] [CrossRef] [PubMed]
- Falone, S.; Grossi, M.R.; Cinque, B.; D’Angelo, B.; Tettamanti, E.; Cimini, A.; Di Ilio, C.; Amicarelli, F. Fifty Hertz Extremely Low-Frequency Electromagnetic Field Causes Changes in Redox and Differentiative Status in Neuroblastoma Cells. Int. J. Biochem. Cell Biol. 2007, 39, 2093–2106. [Google Scholar] [CrossRef]
- Akbarnejad, Z.; Eskandary, H.; Vergallo, C.; Nematollahi-Mahani, S.N.; Dini, L.; Darvishzadeh-Mahani, F.; Ahmadi, M. Effects of Extremely Low-Frequency Pulsed Electromagnetic Fields (ELF-PEMFs) on Glioblastoma Cells (U87). Electromagn. Biol. Med. 2017, 36, 238–247. [Google Scholar] [CrossRef]
- Shoorche, A.B.; Mohammadkarim, A.; Jadidi, M.; Bahraminasab, M.; Bagheri, H.; Gholami, S. Human Osteosarcoma Cells in Response to ELF-MF: Morphological Remodeling Compared to Cell Proliferation. J. Cancer Res. Ther. 2023, 19, 1311–1315. [Google Scholar] [CrossRef] [PubMed]
- Rahimi, S.; Ahrabi, M.; Samiei, M.; Roshangar, L.; Ahrabi, B.; Hashemi, B.; Shahi, S.; Rahimi Darehchi, N. The Effect of Low-Frequency Pulsed Electromagnetic Fields on the Differentiation of Permanent Dental Pulp Stem Cells into Odontoblasts. Iran. Endod. J. 2023, 18, 218–223. [Google Scholar] [CrossRef]
- Razavi, S.; Salimi, M.; Shahbazi-Gahrouei, D.; Karbasi, S.; Kermani, S. Extremely Low-Frequency Electromagnetic Field Influences the Survival and Proliferation Effect of Human Adipose Derived Stem Cells. Adv. Biomed. Res. 2014, 3, 25. [Google Scholar] [CrossRef]
- Focke, F.; Schuermann, D.; Kuster, N.; Schär, P. DNA Fragmentation in Human Fibroblasts under Extremely Low Frequency Electromagnetic Field Exposure. Mutat. Res.—Fundam. Mol. Mech. Mutagen. 2010, 683, 74–83. [Google Scholar] [CrossRef] [PubMed]
- Grant, D.N.; Cozad, M.J.; Grant, D.A.; White, R.A.; Grant, S.A. In Vitro Electromagnetic Stimulation to Enhance Cell Proliferation in Extracellular Matrix Constructs with and without Metallic Nanoparticles. J. Biomed. Mater. Res. B Appl. Biomater. 2015, 103, 1532–1540. [Google Scholar] [CrossRef]
- Cios, A.; Ciepielak, M.; Stankiewicz, W.; Szymański, Ł. The Influence of the Extremely Low Frequency Electromagnetic Field on Clear Cell Renal Carcinoma. Int. J. Mol. Sci. 2021, 22, 1342. [Google Scholar] [CrossRef]
- Ross, C.L.; Pettenati, M.J.; Procita, J.; Cathey, L.; George, S.K.; Almeida-Porada, G. Evaluation of Cytotoxic and Genotoxic Effects of Extremely Low-Frequency Electromagnetic Field on Mesenchymal Stromal Cells. Glob. Adv. Health Med. 2018, 7, 1–7. [Google Scholar] [CrossRef] [PubMed]
- Liu, Y.; Liu, W.B.; Liu, K.J.; Ao, L.; Cao, J.; Zhong, J.L.; Liu, J.Y. Extremely Low-Frequency Electromagnetic Fields Affect the MiRNA-Mediated Regulation of Signaling Pathways in the GC-2 Cell Line. PLoS ONE 2015, 10, e0139949. [Google Scholar] [CrossRef] [PubMed]
- Samiei, M.; Aghazadeh, Z.; Abdolahinia, E.D.; Vahdati, A.; Daneshvar, S.; Noghani, A. The Effect of Electromagnetic Fields on Survival and Proliferation Rate of Dental Pulp Stem Cells. Acta Odontol. Scand. 2020, 78, 494–500. [Google Scholar] [CrossRef]
- Ma, Q.; Chen, C.; Deng, P.; Zhu, G.; Lin, M.; Zhang, L.; Xu, S.; He, M.; Lu, Y.; Duan, W.; et al. Extremely Low-Frequency Electromagnetic Fields Promote in Vitro Neuronal Differentiation and Neurite Outgrowth of Embryonic Neural Stem Cells via up- Regulating TRPC1. PLoS ONE 2016, 11, e0150923. [Google Scholar] [CrossRef] [PubMed]
- Mehdizadeh, R.; Madjid Ansari, A.; Forouzesh, F.; Shahriari, F.; Shariatpanahi, S.P.; Salaritabar, A.; Javidi, M.A. P53 Status, and G2/M Cell Cycle Arrest, Are Determining Factors in Cell-Death Induction Mediated by ELF-EMF in Glioblastoma. Sci. Rep. 2023, 13, 10845. [Google Scholar] [CrossRef] [PubMed]
- Lekovic, M.H.; Drekovic, N.E.; Granica, N.D.; Mahmutovic, E.H.; Djordjevic, N.Z. Extremely Low-Frequency Electromagnetic Field Induces a Change in Proliferative Capacity and Redox Homeostasis of Human Lung Fibroblast Cell Line MRC-5. Environ. Sci. Pollut. Res. 2020, 27, 39466–39473. [Google Scholar] [CrossRef]
- Fathi, E.; Farahzadi, R. Zinc Sulphate Mediates the Stimulation of Cell Proliferation of Rat Adipose Tissue-Derived Mesenchymal Stem Cells Under High Intensity of EMF Exposure. Biol. Trace Elem. Res. 2018, 184, 529–535. [Google Scholar] [CrossRef] [PubMed]
- AyeŞ, I.G.; Zafer, A.; Şule, O.; IŞil, I.T.; Kalkan, T. Differentiation of K562 Cells under ELF-EMF Applied at Different Time Courses. Electromagn. Biol. Med. 2010, 29, 122–130. [Google Scholar] [CrossRef]
- Choi, J.H.; Kim, Y.M.; Park, H.J.; Nam, M.H.; Seo, Y.K. Extremely Low-Frequency Electromagnetic Fields Increase Cytokines in Human Hair Follicles through Wnt/β-Catenin Signaling. Biomedicines 2022, 10, 924. [Google Scholar] [CrossRef]
- Ki, G.E.; Kim, Y.M.; Lim, H.M.; Lee, E.C.; Choi, Y.K.; Seo, Y.K. Extremely Low-Frequency Electromagnetic Fields Increase the Expression of Anagen-Related Molecules in Human Dermal Papilla Cells via GSK-3Β/ERK/Akt Signaling Pathway. Int. J. Mol. Sci. 2020, 21, 784. [Google Scholar] [CrossRef]
- Restrepo, A.F.; Tobar, V.E.; Camargo, R.J.; Franco, E.; Pinedo, C.R.; Gutierrez, O. Effects of Extremely Low Frequency Electromagnetic Fields on In-Vitro Cellular Cultures HeLa and CHO. In Proceedings of the 2016 38th Annual International Conference of the IEEE Engineering in Medicine and Biology Society (EMBC), Orlando, FL, USA, 16–20 August 2016; IEEE: Piscataway, NJ, USA, 2016; pp. 4193–4196. [Google Scholar]
- Falone, S.; Marchesi, N.; Osera, C.; Fassina, L.; Comincini, S.; Amadio, M.; Pascale, A. Pulsed Electromagnetic Field (PEMF) Prevents pro-Oxidant Effects of H2O2 in SK-N-BE(2) Human Neuroblastoma Cells. Int. J. Radiat. Biol. 2016, 92, 281–286. [Google Scholar] [CrossRef] [PubMed]
- Fan, W.; Qian, F.; Ma, Q.; Zhang, P.; Chen, T.; Chen, C.; Zhang, Y.; Deng, P.; Zhou, Z.; Yu, Z. 50 Hz Electromagnetic Field Exposure Promotes Proliferation and Cytokine Production of Bone Marrow Mesenchymal Stem Cells. Int. J. Clin. Exp. Med. 2015, 8, 7394–7404. [Google Scholar] [PubMed]
- Cheng, Y.; Dai, Y.; Zhu, X.; Xu, H.; Cai, P.; Xia, R.; Mao, L.; Zhao, B.Q.; Fan, W. Extremely Low-Frequency Electromagnetic Fields Enhance the Proliferation and Differentiation of Neural Progenitor Cells Cultured from Ischemic Brains. Neuroreport 2015, 26, 896–902. [Google Scholar] [CrossRef] [PubMed]
- Bergandi, L.; Lucia, U.; Grisolia, G.; Salaroglio, I.C.; Gesmundo, I.; Granata, R.; Borchiellini, R.; Ponzetto, A.; Silvagno, F. Thermomagnetic Resonance Effect of the Extremely Low Frequency Electromagnetic Field on Three-Dimensional Cancer Models. Int. J. Mol. Sci. 2022, 23, 7955. [Google Scholar] [CrossRef] [PubMed]
- Rezaie-Tavirani, M.; Hasanzadeh, H.; Seyyedi, S.; Zali, H. Proteomic Analysis of the Effect of Extremely Low-Frequency Electromagnetic Fields (ELF-EMF) with Different Intensities in SH-SY5Y Neuroblastoma Cell Line. J. Lasers Med. Sci. 2017, 8, 79–83. [Google Scholar] [CrossRef] [PubMed]
- Patruno, A.; Pesce, M.; Grilli, A.; Speranza, L.; Franceschelli, S.; De Lutiis, M.A.; Vianale, G.; Costantini, E.; Amerio, P.; Muraro, R.; et al. MTOR Activation by PI3K/Akt and ERK Signaling in Short ELF-EMF Exposed Human Keratinocytes. PLoS ONE 2015, 10, e0139644. [Google Scholar] [CrossRef] [PubMed]
- Oh, I.R.; Raymundo, B.; Jung, S.A.; Kim, H.J.; Park, J.K.; Kim, C.W. Extremely Low-Frequency Electromagnetic Field Altered PPARγ and CCL2 Levels and Suppressed CD44+/CD24− Breast Cancer Cells Characteristics. Bull. Korean Chem. Soc. 2020, 41, 812–823. [Google Scholar] [CrossRef]
- Wolf, F.I.; Torsello, A.; Tedesco, B.; Fasanella, S.; Boninsegna, A.; D’Ascenzo, M.; Grassi, C.; Azzena, G.B.; Cittadini, A. 50-Hz Extremely Low Frequency Electromagnetic Fields Enhance Cell Proliferation and DNA Damage: Possible Involvement of a Redox Mechanism. Biochim. Biophys. Acta Mol. Cell Res. 2005, 1743, 120–129. [Google Scholar] [CrossRef] [PubMed]
- Ruiz Gómez, M. 25 Hz Electromagnetic Field Exposure Has No Effect on Cell Cycle Distribution and Apoptosis in U-937 and HCA-2/1cch Cells. Bioelectrochemistry 2001, 53, 137–140. [Google Scholar] [CrossRef]
- Kim, H.J.; Jung, J.; Park, J.H.; Kim, J.H.; Ko, K.N.; Kim, C.W. Extremely Low-Frequency Electromagnetic Fields Induce Neural Differentiation in Bone Marrow Derived Mesenchymal Stem Cells. Exp. Biol. Med. 2013, 238, 923–931. [Google Scholar] [CrossRef]
- Destefanis, M.; Viano, M.; Leo, C.; Gervino, G.; Ponzetto, A.; Silvagno, F. Extremely Low Frequency Electromagnetic Fields Affect Proliferation and Mitochondrial Activity of Human Cancer Cell Lines. Int. J. Radiat. Biol. 2015, 91, 964–972. [Google Scholar] [CrossRef] [PubMed]
- Kim, Y.M.; Cho, S.E.; Kim, S.C.; Jang, H.J.; Seo, Y.K. Effects of Extremely Low Frequency Electromagnetic Fields on Melanogenesis through P-ERK and P-SAPK/JNK Pathways in Human Melanocytes. Int. J. Mol. Sci. 2017, 18, 2120. [Google Scholar] [CrossRef] [PubMed]
- Srdjenovic, B.; Mrdjanovic, J.; Galovic, A.J.; Kladar, N.; Bozin, B.; Jurisic, V.; Bogdanovic, G. Effect of ELF-EMF on Antioxidant Status and Micronuclei in K562 Cells and Normal Lymphocytes. Cent. Eur. J. Biol. 2014, 9, 931–940. [Google Scholar] [CrossRef]
- Huang, C.Y.; Chuang, C.Y.; Shu, W.Y.; Chang, C.W.; Chen, C.R.; Fan, T.C.; Hsu, I.C. Distinct Epidermal Keratinocytes Respond to Extremely Low-Frequency Electromagnetic Fields Differently. PLoS ONE 2014, 9, e113424. [Google Scholar] [CrossRef] [PubMed]
- Qiu, L.; Chen, L.; Yang, X.; Ye, A.; Jiang, W.; Sun, W. S1P Mediates Human Amniotic Cells Proliferation Induced by a 50-Hz Magnetic Field Exposure via ERK1/2 Signaling Pathway. J. Cell Physiol. 2019, 234, 7734–7741. [Google Scholar] [CrossRef] [PubMed]
- Chen, L.; Xia, Y.; Lu, J.; Xie, Q.; Ye, A.; Sun, W. A 50-Hz Magnetic-Field Exposure Promotes Human Amniotic Cells Proliferation via SphK–S1P–S1PR Cascade Mediated ERK Signaling Pathway. Ecotoxicol. Environ. Saf. 2020, 194, 110407. [Google Scholar] [CrossRef]
- Ding, Z.; Li, J.; Li, F.; Mephryar, M.M.; Wu, S.; Zhang, C.; Zeng, Y. Vitamin C and Vitamin E Protected B95-8 and Balb/c-3T3 Cells from Apoptosis Induced by Intermittent 50 Hz ELF-EMF Radiation. Iran. J. Public Health 2017, 46, 23–34. [Google Scholar] [PubMed]
- Ramazi, S.; Salimian, M.; Allahverdi, A.; Kianamiri, S.; Abdolmaleki, P. Synergistic Cytotoxic Effects of an Extremely Low-Frequency Electromagnetic Field with Doxorubicin on MCF-7 Cell Line. Sci. Rep. 2023, 13, 8844. [Google Scholar] [CrossRef] [PubMed]
- Iorio, R.; Delle Monache, S.; Bennato, F.; Di Bartolomeo, C.; Scrimaglio, R.; Cinque, B.; Colonna, R.C. Involvement of Mitochondrial Activity in Mediating ELF-EMF Stimulatory Effect on Human Sperm Motility. Bioelectromagnetics 2011, 32, 15–27. [Google Scholar] [CrossRef]
- Patruno, A.; Amerio, P.; Pesce, M.; Vianale, G.; Di Luzio, S.; Tulli, A.; Franceschelli, S.; Grilli, A.; Muraro, R.; Reale, M. Extremely Low Frequency Electromagnetic Fields Modulate Expression of Inducible Nitric Oxide Synthase, Endothelial Nitric Oxide Synthase and Cyclooxygenase-2 in the Human Keratinocyte Cell Line HaCat: Potential Therapeutic Effects in Wound Healing. Br. J. Dermatol. 2010, 162, 258–266. [Google Scholar] [CrossRef]
- Frahm, J.; Lantow, M.; Lupke, M.; Weiss, D.G.; Simkó, M. Alteration in Cellular Functions in Mouse Macrophages after Exposure to 50 Hz Magnetic Fields. J. Cell Biochem. 2006, 99, 168–177. [Google Scholar] [CrossRef] [PubMed]
- Kim, S.J.; Jang, Y.W.; Hyung, K.E.; Lee, D.K.; Hyun, K.H.; Jeong, S.H.; Min, K.H.; Kang, W.; Jeong, J.H.; Park, S.Y.; et al. Extremely Low-Frequency Electromagnetic Field Exposure Enhances Inflammatory Response and Inhibits Effect of Antioxidant in RAW 264.7 Cells. Bioelectromagnetics 2017, 38, 374–385. [Google Scholar] [CrossRef] [PubMed]
- Patruno, A.; Costantini, E.; Ferrone, A.; Pesce, M.; Francesca, D.; Trubiani, O.; Reale, M. Short ELF-EMF Exposure Targets SIRT1/NRF2/HO-1 Signaling in THP-1 Cells. Int. J. Mol. Sci. 2020, 21, 7284. [Google Scholar] [CrossRef] [PubMed]
- Buldak, R.J.; Polaniak, R.; Buldak, L.; Zwirska-Korczala, K.; Skonieczna, M.; Monsiol, A.; Kukla, M.; Dulawa-Buldak, A.; Birkner, E. Short-Term Exposure to 50Hz ELF-EMF Alters the Cisplatin-Induced Oxidative Response in AT478 Murine Squamous Cell Carcinoma Cells. Bioelectromagnetics 2012, 33, 641–651. [Google Scholar] [CrossRef] [PubMed]
- Huang, C.Y.; Chang, C.W.; Chen, C.R.; Chuang, C.Y.; Chiang, C.S.; Shu, W.Y.; Fan, T.C.; Hsu, I.C. Extremely Low-Frequency Electromagnetic Fields Cause G1 Phase Arrest through the Activation of the ATM-Chk2-P21 Pathway. PLoS ONE 2014, 9, e104732. [Google Scholar] [CrossRef]
- Mihai, C.T.; Rotinberg, P.; Brinza, F.; Vochita, G. Extremely Low-Frequency Electromagnetic Fields Cause DNA Strand Breaks in Normal Cells. J. Environ. Health Sci. Eng. 2014, 12, 15. [Google Scholar] [CrossRef] [PubMed]
- National Radiological Protection Board (NRPB). Advice on Limiting Exposure to Electromagnetic Fields (0–300 GHz). In Documents of the NRPB; 2004; Volume 15, pp. 1–35. ISBN 978-0-85951-532-0. Available online: https://www.emf-portal.org/en/article/10656 (accessed on 1 May 2024).
- National Radiological Protection Board (NRPB). Review of the Scientific Evidence for Limiting Exposure to Electromagnetic Fields (0–300 GHz); 2004; Volume 15, ISBN 978-0-85951-533-7. Available online: https://www.emf-portal.org/en/article/10657 (accessed on 1 May 2024).
- Scientific Committee on Emerging Newly Identified Health Risks. Opinion on potential health effects of exposure to electromagnetic fields. Bioelectromagnetics 2015, 36, 480–484. [Google Scholar] [CrossRef] [PubMed]
- Scientific Committee on Emerging and Newly Identified Health Risks (SCENIHR). Health Effects of Exposure to EMF; 2009; Available online: https://ec.europa.eu/health/ph_risk/committees/04_scenihr/docs/scenihr_o_022.pdf (accessed on 1 May 2024).
- Kaczmarek, L.K.; Adey, W.R. The Efflux Of 45Ca2+ and [3H]γ-Aminobutyric Acid from Cat Cerebral Cortex. Brain Res. 1973, 63, 331–342. [Google Scholar] [CrossRef] [PubMed]
- Bernardi, P.; D’Inzeo, G. Analysis of the Interaction between Microwave Fields and Snail Neurons by an Ionic Model of the Membrane Electrical Activity. Alta. Freq. 1989, 4, 341–347. [Google Scholar]
- Adair, R.K. Criticism of Lednev’s Mechanism for the Influence of Weak Magnetic Fields on Biological Systems. Bioelectromagnetics 1992, 13, 231–235. [Google Scholar] [CrossRef]
- Parkinson, W.C.; Hanks, C.T. Search for Cyclotron Resonance in Cells in Vitro. Bioelectromagnetics 1989, 10, 129–145. [Google Scholar] [CrossRef] [PubMed]
- Liboff, A.R.; McLeod, B.R. Kinetics of Channelized Membrane Ions in Magnetic Fields. Bioelectromagnetics 1988, 9, 39–51. [Google Scholar] [CrossRef] [PubMed]
- Smith, S.D.; McLeod, B.R.; Liboff, A.R.; Cooksey, K. Calcium Cyclotron Resonance and Diatom Mobility. Bioelectromagnetics 1987, 8, 215–227. [Google Scholar] [CrossRef] [PubMed]
- Blackman, C.F.; Blanchard, J.P.; Benane, S.G.; House, D.E. Empirical Test of an Ion Parametric Resonance Model for Magnetic Field Interactions with PC-12 Cells. Bioelectromagnetics 1994, 15, 239–260. [Google Scholar] [CrossRef] [PubMed]
- Blanchard, J.P.; Blackman, C.F. Clarification and Application of an Ion Parametric Resonance Model for Magnetic Field Interactions with Biological Systems. Bioelectromagnetics 1994, 15, 217–238. [Google Scholar] [CrossRef] [PubMed]
- Azanza, M.J.; del Moral, A.; Pérez Bruzón, R.N. Frequency Resonance Effect of Neurons under Low-Frequency Weak Magnetic Field. J. Magn. Magn. Mater. 2007, 310, 2865–2867. [Google Scholar] [CrossRef]
- Blackman, C.F.; Blanchard, J.P.; Benane, S.G.; House, D.E. Experimental Determination of Hydrogen Bandwidth for the Ion Parametric Resonance Model. Bioelectromagnetics 1999, 20, 5–12. [Google Scholar] [CrossRef]
- Markov, M. Dosimetry in Bioelectromagnetics. In Dosimetry in Bioelectromagnetics; Markov, M., Ed.; Taylor & Francis: New York, NY, USA, 2017; pp. 1–23. ISBN 978-1-4987-7413-0. [Google Scholar]
- Adair, R.K. Effects of Very Weak Magnetic Fields on Radical Pair Reformation. Bioelectromagnetics 1999, 20, 255–263. [Google Scholar] [CrossRef]
- Barnes, F.S.; Greenebaum, B. The Effects of Weak Magnetic Fields on Radical Pairs. Bioelectromagnetics 2015, 36, 45–54. [Google Scholar] [CrossRef]
- Wang, K.; Ritz, T. Zeeman Resonances for Radical-Pair Reactions in Weak Static Magnetic Fields. Mol. Phys. 2006, 104, 1649–1658. [Google Scholar] [CrossRef]


| ID | Authors | Frequency (Hz) | Intensity (mT) | Exposure Time (h) | Cell Type (T/NT) | Results | ID | Authors | Frequency (Hz) | Intensity (mT) | Exposure Time (h) | Cell Type (T/NT) | Results |
|---|---|---|---|---|---|---|---|---|---|---|---|---|---|
| 1 | Nezamtaheri et al. (2022) [74] | 0.01 | 10 | 2 | T | 0 | 133 | Koziorowska, A. et al. (2018) [75] | 50 | 2 | 0.5 | T | 1 |
| 2 | Nezamtaheri et al. (2022) [74] | 0.01 | 10 | 2 | NT | 0 | 134 | Koziorowska, A. et al. (2018) [75] | 50 | 2 | 0.5 | T | 1 |
| 3 | Nezamtaheri et al. (2022) [74] | 0.01 | 10 | 2 | T | 0 | 135 | Koziorowska, A. et al. (2018) [75] | 50 | 2 | 0.5 | NT | 2 |
| 4 | Nezamtaheri et al. (2022) [74] | 0.01 | 10 | 2 | T | 0 | 136 | Koziorowska, A. et al. (2018) [75] | 50 | 2 | 0.5 | NT | 2 |
| 5 | Koziorowska, A. et al. (2018) [75] | 2 | 2 | 2 | T | 1 | 137 | Koziorowska, A. et al. (2018) [75] | 50 | 2 | 1 | T | 1 |
| 6 | Ledda et al. (2018) [76] | 7 | 0.0125 | 120 | T | 2 | 138 | Koziorowska, A. et al. (2018) [75] | 50 | 2 | 1 | T | 1 |
| 7 | Ledda et al. (2018) [76] | 7 | 0.0125 | 120 | T | 2 | 139 | Koziorowska, A. et al. (2018) [75] | 50 | 2 | 1 | NT | 2 |
| 8 | García-Minguillán, O. et al. (2019) [77] | 7.8 | 0.03 | 24 | NT | 0 | 140 | Koziorowska, A. et al. (2018) [75] | 50 | 2 | 1 | NT | 2 |
| 9 | García-Minguillán, O. et al. (2019) [77] | 7.8 | 0.03 | 24 | NT | 0 | 141 | Koziorowska, A. et al. (2018) [75] | 50 | 2 | 2 | T | 1 |
| 10 | García-Minguillán, O. et al. (2019) [77] | 14 | 0.03 | 24 | T | 0 | 142 | Koziorowska, A. et al. (2018) [75] | 50 | 2 | 2 | T | 1 |
| 11 | García-Minguillán, O. et al. (2020) [78] | 20 | 0.03 | 24 | T | 1 | 143 | Koziorowska, A. et al. (2018) [75] | 50 | 2 | 2 | NT | 2 |
| 12 | García-Minguillán, O. et al. (2020) [78] | 20 | 0.1 | 24 | T | 0 | 144 | Koziorowska, A. et al. (2018) [75] | 50 | 2 | 2 | NT | 0 |
| 13 | García-Minguillán, O. et al. (2020) [78] | 20 | 0.1 | 48 | T | 2 | 145 | Koziorowska, A. et al. (2018) [75] | 50 | 2 | 3 | T | 1 |
| 14 | García-Minguillán, O. et al. (2020) [78] | 20 | 0.1 | 72 | T | 0 | 146 | Koziorowska, A. et al. (2018) [75] | 50 | 2 | 3 | T | 1 |
| 15 | Koziorowska, A. et al. (2018) [75] | 20 | 2 | 2 | T | 1 | 147 | Koziorowska, A. et al. (2018) [75] | 50 | 2 | 3 | NT | 2 |
| 16 | Koziorowska, A. et al. (2018) [75] | 20 | 2 | 2 | T | 0 | 148 | Koziorowska, A. et al. (2018) [75] | 50 | 2 | 3 | NT | 0 |
| 17 | Koziorowska, A. et al. (2018) [75] | 20 | 2 | 2 | NT | 2 | 149 | Koziorowska, A. et al. (2018) [75] | 50 | 2.5 | 0.5 | T | 0 |
| 18 | Koziorowska, A. et al. (2018) [75] | 20 | 2 | 2 | NT | 0 | 150 | Koziorowska, A. et al. (2018) [75] | 50 | 2.5 | 0.5 | T | 1 |
| 19 | Koziorowska, A. et al. (2018) [75] | 20 | 2.5 | 2 | T | 1 | 151 | Koziorowska, A. et al. (2018) [75] | 50 | 2.5 | 0.5 | NT | 2 |
| 20 | Koziorowska, A. et al. (2018) [75] | 20 | 2.5 | 2 | T | 0 | 152 | Koziorowska, A. et al. (2018) [75] | 50 | 2.5 | 0.5 | NT | 2 |
| 21 | Koziorowska, A. et al. (2018) [75] | 20 | 2.5 | 2 | NT | 2 | 153 | Koziorowska, A. et al. (2018) [75] | 50 | 2.5 | 1 | T | 1 |
| 22 | Koziorowska, A. et al. (2018) [75] | 20 | 2.5 | 2 | NT | 0 | 154 | Koziorowska, A. et al. (2018) [75] | 50 | 2.5 | 1 | T | 1 |
| 23 | Koziorowska, A. et al. (2018) [75] | 20 | 3 | 2 | T | 0 | 155 | Koziorowska, A. et al. (2018) [75] | 50 | 2.5 | 1 | NT | 2 |
| 24 | Koziorowska, A. et al. (2018) [75] | 20 | 3 | 2 | T | 0 | 156 | Koziorowska, A. et al. (2018) [75] | 50 | 2.5 | 1 | NT | 2 |
| 25 | Koziorowska, A. et al. (2018) [75] | 20 | 3 | 2 | NT | 2 | 157 | Koziorowska, A. et al. (2018) [75] | 50 | 2.5 | 2 | T | 1 |
| 26 | Koziorowska, A. et al. (2018) [75] | 20 | 3 | 2 | NT | 0 | 158 | Koziorowska, A. et al. (2018) [75] | 50 | 2.5 | 2 | T | 1 |
| 27 | Koziorowska, A. et al. (2018) [75] | 20 | 4 | 2 | T | 0 | 159 | Koziorowska, A. et al. (2018) [75] | 50 | 2.5 | 2 | NT | 2 |
| 28 | Koziorowska, A. et al. (2018) [75] | 20 | 4 | 2 | T | 0 | 160 | Koziorowska, A. et al. (2018) [75] | 50 | 2.5 | 2 | NT | 0 |
| 29 | Koziorowska, A. et al. (2018) [75] | 20 | 4 | 2 | NT | 2 | 161 | Koziorowska, A. et al. (2018) [75] | 50 | 2.5 | 3 | T | 1 |
| 30 | Koziorowska, A. et al. (2018) [75] | 20 | 4 | 2 | NT | 0 | 162 | Koziorowska, A. et al. (2018) [75] | 50 | 2.5 | 3 | T | 1 |
| 31 | Koziorowska, A. et al. (2018) [75] | 20 | 6 | 2 | T | 0 | 163 | Koziorowska, A. et al. (2018) [75] | 50 | 2.5 | 3 | NT | 2 |
| 32 | Koziorowska, A. et al. (2018) [75] | 20 | 6 | 2 | T | 1 | 164 | Koziorowska, A. et al. (2018) [75] | 50 | 2.5 | 3 | NT | 2 |
| 33 | Koziorowska, A. et al. (2018) [75] | 20 | 6 | 2 | NT | 2 | 165 | Koziorowska, A. et al. (2018) [75] | 50 | 3 | 0.5 | T | 0 |
| 34 | Koziorowska, A. et al. (2018) [75] | 20 | 6 | 2 | NT | 0 | 166 | Koziorowska, A. et al. (2018) [75] | 50 | 3 | 0.5 | T | 1 |
| 35 | Wang, M. et al. (2021) [79] | 23.49 | 0.5 | 48 | T | 1 | 167 | Koziorowska, A. et al. (2018) [75] | 50 | 3 | 0.5 | NT | 2 |
| 36 | Wang, M. et al. (2021) [79] | 23.49 | 0.5 | 48 | T | 1 | 168 | Koziorowska, A. et al. (2018) [75] | 50 | 3 | 0.5 | NT | 2 |
| 37 | Wang, M. et al. (2021) [79] | 23.49 | 0.5 | 48 | NT | 2 | 169 | Koziorowska, A. et al. (2018) [75] | 50 | 3 | 1 | T | 1 |
| 38 | García-Minguillán, O. et al. (2020) [78] | 30 | 0.1 | 24 | T | 1 | 170 | Koziorowska, A. et al. (2018) [75] | 50 | 3 | 1 | T | 1 |
| 39 | García-Minguillán, O. et al. (2020) [78] | 30 | 0.1 | 48 | T | 1 | 171 | Koziorowska, A. et al. (2018) [75] | 50 | 3 | 1 | NT | 2 |
| 40 | García-Minguillán, O. et al. (2020) [78] | 30 | 0.1 | 72 | T | 1 | 172 | Koziorowska, A. et al. (2018) [75] | 50 | 3 | 1 | NT | 2 |
| 41 | Koziorowska, A. et al. (2018) [75] | 30 | 2 | 2 | T | 1 | 173 | Koziorowska, A. et al. (2018) [75] | 50 | 3 | 2 | T | 1 |
| 42 | Koziorowska, A. et al. (2018) [75] | 30 | 2 | 2 | T | 1 | 174 | Koziorowska, A. et al. (2018) [75] | 50 | 3 | 2 | T | 1 |
| 43 | Koziorowska, A. et al. (2018) [75] | 30 | 2 | 2 | NT | 0 | 175 | Koziorowska, A. et al. (2018) [75] | 50 | 3 | 2 | NT | 2 |
| 44 | Koziorowska, A. et al. (2018) [75] | 30 | 2 | 2 | NT | 2 | 176 | Koziorowska, A. et al. (2018) [75] | 50 | 3 | 2 | NT | 2 |
| 45 | Koziorowska, A. et al. (2018) [75] | 30 | 2.5 | 2 | T | 1 | 177 | Koziorowska, A. et al. (2018) [75] | 50 | 3 | 3 | T | 1 |
| 46 | Koziorowska, A. et al. (2018) [75] | 30 | 2.5 | 2 | T | 1 | 178 | Koziorowska, A. et al. (2018) [75] | 50 | 3 | 3 | T | 1 |
| 47 | Koziorowska, A. et al. (2018) [75] | 30 | 2.5 | 2 | NT | 2 | 179 | Koziorowska, A. et al. (2018) [75] | 50 | 3 | 3 | NT | 2 |
| 48 | Koziorowska, A. et al. (2018) [75] | 30 | 2.5 | 2 | NT | 2 | 180 | Koziorowska, A. et al. (2018) [75] | 50 | 3 | 3 | NT | 0 |
| 49 | Koziorowska, A. et al. (2018) [75] | 30 | 3 | 2 | T | 1 | 181 | Koziorowska, A. et al. (2018) [75] | 50 | 4 | 0.5 | T | 0 |
| 50 | Koziorowska, A. et al. (2018) [75] | 30 | 3 | 2 | T | 1 | 182 | Koziorowska, A. et al. (2018) [75] | 50 | 4 | 0.5 | T | 1 |
| 51 | Koziorowska, A. et al. (2018) [75] | 30 | 3 | 2 | NT | 2 | 183 | Koziorowska, A. et al. (2018) [75] | 50 | 4 | 0.5 | NT | 2 |
| 52 | Koziorowska, A. et al. (2018) [75] | 30 | 3 | 2 | NT | 2 | 184 | Koziorowska, A. et al. (2018) [75] | 50 | 4 | 0.5 | NT | 2 |
| 53 | Koziorowska, A. et al. (2018) [75] | 30 | 4 | 2 | T | 1 | 185 | Koziorowska, A. et al. (2018) [75] | 50 | 4 | 1 | T | 1 |
| 54 | Koziorowska, A. et al. (2018) [75] | 30 | 4 | 2 | T | 1 | 186 | Koziorowska, A. et al. (2018) [75] | 50 | 4 | 1 | T | 1 |
| 55 | Koziorowska, A. et al. (2018) [75] | 30 | 4 | 2 | NT | 0 | 187 | Koziorowska, A. et al. (2018) [75] | 50 | 4 | 1 | NT | 2 |
| 56 | Koziorowska, A. et al. (2018) [75] | 30 | 4 | 2 | NT | 2 | 188 | Koziorowska, A. et al. (2018) [75] | 50 | 4 | 1 | NT | 2 |
| 57 | Koziorowska, A. et al. (2018) [75] | 30 | 6 | 2 | T | 0 | 189 | Koziorowska, A. et al. (2018) [75] | 50 | 4 | 2 | T | 1 |
| 58 | Koziorowska, A. et al. (2018) [75] | 30 | 6 | 2 | T | 1 | 190 | Koziorowska, A. et al. (2018) [75] | 50 | 4 | 2 | T | 1 |
| 59 | Koziorowska, A. et al. (2018) [75] | 30 | 6 | 2 | NT | 0 | 191 | Koziorowska, A. et al. (2018) [75] | 50 | 4 | 2 | NT | 2 |
| 60 | Koziorowska, A. et al. (2018) [75] | 30 | 6 | 2 | NT | 0 | 192 | Koziorowska, A. et al. (2018) [75] | 50 | 4 | 2 | NT | 0 |
| 61 | Wang, M. et al. (2021) [79] | 39.15 | 0.5 | 48 | T | 0 | 193 | Koziorowska, A. et al. (2018) [75] | 50 | 4 | 3 | T | 1 |
| 62 | Wang, M. et al. (2021) [79] | 39.15 | 0.5 | 48 | T | 2 | 194 | Koziorowska, A. et al. (2018) [75] | 50 | 4 | 3 | T | 1 |
| 63 | Wang, M. et al. (2021) [79] | 39.15 | 0.5 | 48 | NT | 2 | 195 | Koziorowska, A. et al. (2018) [75] | 50 | 4 | 3 | NT | 2 |
| 64 | Koziorowska, A. et al. (2018) [75] | 40 | 2 | 2 | T | 1 | 196 | Koziorowska, A. et al. (2018) [75] | 50 | 4 | 3 | NT | 2 |
| 65 | Koziorowska, A. et al. (2018) [75] | 40 | 2 | 2 | T | 1 | 197 | Koziorowska, A. et al. (2018) [75] | 50 | 6 | 0.5 | T | 0 |
| 66 | Koziorowska, A. et al. (2018) [75] | 40 | 2 | 2 | NT | 2 | 198 | Koziorowska, A. et al. (2018) [75] | 50 | 6 | 0.5 | T | 1 |
| 67 | Koziorowska, A. et al. (2018) [75] | 40 | 2 | 2 | NT | 0 | 199 | Koziorowska, A. et al. (2018) [75] | 50 | 6 | 0.5 | NT | 2 |
| 68 | Koziorowska, A. et al. (2018) [75] | 40 | 2.5 | 2 | T | 0 | 200 | Koziorowska, A. et al. (2018) [75] | 50 | 6 | 0.5 | NT | 2 |
| 69 | Koziorowska, A. et al. (2018) [75] | 40 | 2.5 | 2 | T | 1 | 201 | Koziorowska, A. et al. (2018) [75] | 50 | 6 | 1 | T | 1 |
| 70 | Koziorowska, A. et al. (2018) [75] | 40 | 2.5 | 2 | NT | 2 | 202 | Koziorowska, A. et al. (2018) [75] | 50 | 6 | 1 | T | 1 |
| 71 | Koziorowska, A. et al. (2018) [75] | 40 | 2.5 | 2 | NT | 0 | 203 | Koziorowska, A. et al. (2018) [75] | 50 | 6 | 1 | NT | 2 |
| 72 | Koziorowska, A. et al. (2018) [75] | 40 | 3 | 2 | T | 0 | 204 | Koziorowska, A. et al. (2018) [75] | 50 | 6 | 1 | NT | 2 |
| 73 | Koziorowska, A. et al. (2018) [75] | 40 | 3 | 2 | T | 1 | 205 | Koziorowska, A. et al. (2018) [75] | 50 | 6 | 2 | T | 1 |
| 74 | Koziorowska, A. et al. (2018) [75] | 40 | 3 | 2 | NT | 2 | 206 | Koziorowska, A. et al. (2018) [75] | 50 | 6 | 2 | T | 1 |
| 75 | Koziorowska, A. et al. (2018) [75] | 40 | 3 | 2 | NT | 0 | 207 | Koziorowska, A. et al. (2018) [75] | 50 | 6 | 2 | NT | 2 |
| 76 | Koziorowska, A. et al. (2018) [75] | 40 | 4 | 2 | T | 0 | 208 | Koziorowska, A. et al. (2018) [75] | 50 | 6 | 2 | NT | 0 |
| 77 | Koziorowska, A. et al. (2018) [75] | 40 | 4 | 2 | T | 1 | 209 | Koziorowska, A. et al. (2018) [75] | 50 | 6 | 3 | T | 0 |
| 78 | Koziorowska, A. et al. (2018) [75] | 40 | 4 | 2 | NT | 2 | 210 | Koziorowska, A. et al. (2018) [75] | 50 | 6 | 3 | T | 1 |
| 79 | Koziorowska, A. et al. (2018) [75] | 40 | 4 | 2 | NT | 0 | 211 | Koziorowska, A. et al. (2018) [75] | 50 | 6 | 3 | NT | 0 |
| 80 | Koziorowska, A. et al. (2018) [75] | 40 | 6 | 2 | T | 0 | 212 | Koziorowska, A. et al. (2018) [75] | 50 | 6 | 3 | NT | 0 |
| 81 | Koziorowska, A. et al. (2018) [75] | 40 | 6 | 2 | T | 1 | 213 | Yin, C. et al. (2016) [80] | 50 | 8 | 1.5 | NT | 1 |
| 82 | Koziorowska, A. et al. (2018) [75] | 40 | 6 | 2 | NT | 2 | 214 | García-Minguillán, O. et al. (2019) [77] | 51 | 0.03 | 24 | T | 1 |
| 83 | Koziorowska, A. et al. (2018) [75] | 40 | 6 | 2 | NT | 0 | 215 | Cho, S. et al. (2014) [81] | 60 | 0.8 | 24 | NT | 0 |
| 84 | García-Minguillán, O. et al. (2019) [77] | 45 | 0.03 | 24 | T | 1 | 216 | Cho, S. et al. (2014) [81] | 60 | 0.8 | 48 | NT | 0 |
| 85 | De Groot, M. et al. (2016) [82] | 50 | 0.001 | 168 | NT | 0 | 217 | Koziorowska, A. et al. (2018) [75] | 60 | 2 | 2 | T | 0 |
| 86 | De Groot, M. et al. (2016) [82] | 50 | 0.01 | 168 | NT | 0 | 218 | Koziorowska, A. et al. (2018) [75] | 60 | 2 | 2 | T | 0 |
| 87 | Calcabrini, C. et al. (2017) [83] | 50 | 0.025 | 1 | NT | 0 | 219 | Koziorowska, A. et al. (2018) [75] | 60 | 2 | 2 | NT | 2 |
| 88 | Calcabrini, C. et al. (2017) [83] | 50 | 0.05 | 1 | NT | 0 | 220 | Koziorowska, A. et al. (2018) [75] | 60 | 2 | 2 | NT | 2 |
| 89 | Calcabrini, C. et al. (2017) [83] | 50 | 0.1 | 1 | NT | 0 | 221 | Koziorowska, A. et al. (2018) [75] | 60 | 2.5 | 2 | T | 0 |
| 90 | De Groot, M. et al. (2016) [82] | 50 | 0.1 | 168 | NT | 0 | 222 | Koziorowska, A. et al. (2018) [75] | 60 | 2.5 | 2 | T | 0 |
| 91 | García-Minguillán, O. et al. (2020) [78] | 50 | 0.1 | 24 | T | 1 | 223 | Koziorowska, A. et al. (2018) [75] | 60 | 2.5 | 2 | NT | 2 |
| 92 | García-Minguillán, O. et al. (2020) [78] | 50 | 0.1 | 48 | T | 0 | 224 | Koziorowska, A. et al. (2018) [75] | 60 | 2.5 | 2 | NT | 2 |
| 93 | García-Minguillán, O. et al. (2020) [78] | 50 | 0.1 | 72 | T | 2 | 225 | Koziorowska, A. et al. (2018) [75] | 60 | 3 | 2 | T | 0 |
| 94 | Morabito, C. et al. (2017) [84] | 50 | 0.1 | 168 | NT | 0 | 226 | Koziorowska, A. et al. (2018) [75] | 60 | 3 | 2 | T | 0 |
| 95 | Calcabrini, C. et al. (2017) [83] | 50 | 0.2 | 1 | NT | 0 | 227 | Koziorowska, A. et al. (2018) [75] | 60 | 3 | 2 | NT | 2 |
| 96 | Morabito, C. et al. (2017) [84] | 50 | 0.5 | 168 | NT | 0 | 228 | Koziorowska, A. et al. (2018) [75] | 60 | 3 | 2 | NT | 2 |
| 97 | Ma, Q. et al. (2014) [85] | 50 | 0.5 | 72 | NT | 0 | 229 | Koziorowska, A. et al. (2018) [75] | 60 | 4 | 2 | T | 0 |
| 98 | Ma, Q. et al. (2014) [85] | 50 | 1 | 72 | NT | 0 | 230 | Koziorowska, A. et al. (2018) [75] | 60 | 4 | 2 | T | 0 |
| 99 | Costantini, E. et al. (2022) [86] | 50 | 1 | 6 | NT | 2 | 231 | Koziorowska, A. et al. (2018) [75] | 60 | 4 | 2 | NT | 2 |
| 100 | Costantini, E. et al. (2022) [86] | 50 | 1 | 24 | NT | 2 | 232 | Koziorowska, A. et al. (2018) [75] | 60 | 4 | 2 | NT | 2 |
| 101 | Costantini, E. et al. (2022) [86] | 50 | 1 | 48 | NT | 2 | 233 | Koziorowska, A. et al. (2018) [75] | 60 | 6 | 2 | T | 0 |
| 102 | Morabito, C. et al. (2017) [84] | 50 | 1 | 168 | NT | 0 | 234 | Koziorowska, A. et al. (2018) [75] | 60 | 6 | 2 | T | 0 |
| 103 | De Groot, M. et al. (2016) [82] | 50 | 1 | 168 | NT | 0 | 235 | Koziorowska, A. et al. (2018) [75] | 60 | 6 | 2 | NT | 2 |
| 104 | Duan, W. et al. (2015) [87] | 50 | 1 | 24 | NT | 0 | 236 | Koziorowska, A. et al. (2018) [75] | 60 | 6 | 2 | NT | 2 |
| 105 | Park, J. et al. (2013) [88] | 50 | 1 | 96 | NT | 0 | 237 | Song, K. et al. (2018) [89] | 60 | 6 | 0.5 | T | 0 |
| 106 | Park, J. et al. (2013) [88] | 50 | 1 | 192 | NT | 0 | 238 | Song, K. et al. (2018) [89] | 60 | 6 | 0.5 | T | 0 |
| 107 | Garip, A. et al. (2010) [90] | 50 | 1 | 3 | T | 0 | 239 | Song, K. et al. (2018) [89] | 60 | 6 | 2.5 | T | 0 |
| 108 | Vianale, G. et al. (2008) [91] | 50 | 1 | 4 | NT | 0 | 240 | Song, K. et al. (2018) [89] | 60 | 6 | 2.5 | T | 0 |
| 109 | Vianale, G. et al. (2008) [91] | 50 | 1 | 12 | NT | 0 | 241 | Song, K. et al. (2018) [89] | 60 | 6 | 24 | T | 0 |
| 110 | Vianale, G. et al. (2008) [91] | 50 | 1 | 24 | NT | 0 | 242 | Song, K. et al. (2018) [89] | 60 | 6 | 24 | T | 0 |
| 111 | Vianale, G. et al. (2008) [91] | 50 | 1 | 48 | NT | 0 | 243 | Song, K. et al. (2018) [89] | 60 | 6 | 48 | T | 1 |
| 112 | Vianale, G. et al. (2008) [91] | 50 | 1 | 72 | NT | 0 | 244 | Song, K. et al. (2018) [89] | 60 | 6 | 48 | T | 1 |
| 113 | Vianale, G. et al. (2008) [91] | 50 | 1 | 96 | NT | 0 | 245 | Song, K. et al. (2018) [89] | 60 | 6 | 72 | T | 1 |
| 114 | Morabito, C. et al. (2010) [92] | 50 | 1 | 0.5 | T | 0 | 246 | Song, K. et al. (2018) [89] | 60 | 6 | 72 | T | 1 |
| 115 | Morabito, C. et al. (2010) [92] | 50 | 1 | 24 | T | 0 | 247 | Song, K. et al. (2018) [89] | 60 | 6 | 96 | T | 0 |
| 116 | Morabito, C. et al. (2010) [92] | 50 | 1 | 48 | T | 0 | 248 | Song, K. et al. (2018) [89] | 60 | 6 | 96 | T | 0 |
| 117 | Morabito, C. et al. (2010) [92] | 50 | 1 | 72 | T | 0 | 249 | Song, K. et al. (2018) [89] | 60 | 6 | 96 | T | 0 |
| 118 | Morabito, C. et al. (2010) [92] | 50 | 1 | 96 | T | 0 | 250 | Song, K. et al. (2018) [89] | 60 | 6 | 120 | T | 0 |
| 119 | Morabito, C. et al. (2010) [92] | 50 | 1 | 144 | T | 0 | 251 | Song, K. et al. (2018) [89] | 60 | 6 | 120 | T | 1 |
| 120 | Morabito, C. et al. (2010) [92] | 50 | 1 | 192 | T | 0 | 252 | Song, K. et al. (2018) [89] | 60 | 6 | 144 | T | 1 |
| 121 | Reale, M. et al. (2014) [93] | 50 | 1 | 1 | T | 0 | 253 | Song, K. et al. (2018) [89] | 60 | 6 | 144 | T | 1 |
| 122 | Reale, M. et al. (2014) [93] | 50 | 1 | 3 | T | 0 | 254 | Song, K. et al. (2018) [89] | 60 | 6 | 144 | T | 1 |
| 123 | Reale, M. et al. (2014) [93] | 50 | 1 | 6 | T | 0 | 255 | Song, K. et al. (2018) [89] | 60 | 6 | 168 | T | 1 |
| 124 | Reale, M. et al. (2014) [93] | 50 | 1 | 24 | T | 0 | 256 | Song, K. et al. (2018) [89] | 60 | 6 | 168 | T | 1 |
| 125 | Falone, S. et al. (2007) [94] | 50 | 1 | 24 | T | 0 | 257 | Akbarnejad, Z. et al. (2017) [95] | 100 | 10 | 72 | T | 0 |
| 126 | Falone, S. et al. (2007) [94] | 50 | 1 | 48 | T | 0 | 258 | Akbarnejad, Z. et al. (2017) [95] | 100 | 10 | 72 | T | 0 |
| 127 | Falone, S. et al. (2007) [94] | 50 | 1 | 72 | T | 2 | 259 | Akbarnejad, Z. et al. (2017) [95] | 100 | 10 | 96 | T | 1 |
| 128 | Falone, S. et al. (2007) [94] | 50 | 1 | 96 | T | 2 | 260 | Akbarnejad, Z. et al. (2017) [95] | 100 | 10 | 96 | T | 1 |
| 129 | Ma, Q. et al. (2014) [85] | 50 | 2 | 24 | NT | 0 | 261 | Akbarnejad, Z. et al. (2017) [95] | 100 | 10 | 120 | T | 1 |
| 130 | Ma, Q. et al. (2014) [85] | 50 | 2 | 48 | NT | 0 | 262 | Akbarnejad, Z. et al. (2017) [95] | 100 | 10 | 120 | T | 1 |
| 131 | Ma, Q. et al. (2014) [85] | 50 | 2 | 72 | NT | 0 | 263 | Akbarnejad, Z. et al. (2017) [95] | 100 | 10 | 144 | T | 1 |
| 132 | Barati, A. et al. (2023) [96] | 50 | 2 | 72 | T | 1 | 264 | Akbarnejad, Z. et al. (2017) [95] | 100 | 10 | 144 | T | 1 |
| ID | Authors | Cell Type (T/NT) | Results | ID | Authors | Cell Type (T/NT) | Results |
|---|---|---|---|---|---|---|---|
| VIABILITY | 27 | Rahimi, S. et al. (2023) [97] | NT | 0 | |||
| 1 | Wang, M. et al. (2021) [79] | T | 0 | 28 | Razavi, S. et al. (2013) [98] | NT | 2 |
| 2 | Wang, M. et al. (2021) [79] | T | 1 | 29 | Razavi, S. et al. (2013) [98] | NT | 2 |
| 3 | Wang, M. et al. (2021) [79] | NT | 0 | 30 | Razavi, S. et al. (2013) [98] | NT | 2 |
| 4 | Wang, M. et al. (2021) [79] | T | 0 | 31 | Razavi, S. et al. (2013) [98] | NT | 0 |
| 5 | Wang, M. et al. (2021) [79] | T | 1 | 32 | Focke, F. et al. (2010) [99] | NT | 1 |
| 6 | Wang, M. et al. (2021) [79] | NT | 0 | 33 | Focke, F. et al. (2010) [99] | T | 0 |
| 7 | Wang, M. et al. (2021) [79] | T | 0 | 34 | Grant, D. et al. (2014) [100] | NT | 0 |
| 8 | Wang, M. et al. (2021) [79] | T | 1 | APOPTOSIS | |||
| 9 | Wang, M. et al. (2021) [79] | NT | 2 | 1 | Cios, A. et al. (2021) [101] | NT | 0 |
| 10 | Ross, C. et al. (2018) [102] | NT | 0 | 2 | Cios, A. et al. (2021) [101] | T | 2 |
| 11 | García-Minguillán, O. et al. (2019) [77] | T | 0 | 3 | Cios, A. et al. (2021) [101] | NT | 0 |
| 12 | García-Minguillán, O. et al. (2019) [77] | T | 1 | 4 | Cios, A. et al. (2021) [101] | T | 0 |
| 13 | Barati, A. et al. (2021) [96] | T | 1 | 5 | Liu, Y. et al. (2015) [103] | NT | 0 |
| 14 | Samiei, M. et al. (2020) [104] | NT | 2 | 6 | Liu, Y. et al. (2015) [103] | NT | 0 |
| 15 | Samiei, M. et al. (2020) [104] | NT | 2 | 7 | Liu, Y. et al. (2015) [103] | NT | 0 |
| 16 | Samiei, M. et al. (2020) [104] | NT | 2 | 8 | Ma, Q. et al. (2016) [105] | NT | 0 |
| 17 | Samiei, M. et al. (2020) [104] | NT | 0 | 9 | Focke, F. et al. (2010) [99] | NT | 2 |
| 18 | Cios, A. et al. (2021) [101] | NT | 2 | 10 | Focke, F. et al. (2010) [99] | T | 0 |
| 19 | Cios, A. et al. (2021) [101] | T | 1 | OXIDATIVE STRESS/MITOCHONDRIA | |||
| 20 | Cios, A. et al. (2021) [101] | NT | 1 | 1 | Cios, A. et al. (2021) [101] | NT | 2 |
| 21 | Cios, A. et al. (2021) [101] | T | 1 | 2 | Cios, A. et al. (2021) [101] | T | 2 |
| PROLIFERATION | 3 | Cios, A. et al. (2021) [101] | NT | 2 | |||
| 1 | Mehdizadeh, R. et al. (2023) [106] | 1 | 4 | Cios, A. et al. (2021) [101] | T | 2 | |
| 2 | Mehdizadeh, R. et al. (2023) [106] | T | 0 | 5 | Lekovic, M. et al. (2020) [107] | NT | 1 |
| 3 | Mehdizadeh, R. et al. (2023) [106] | T | 1 | 6 | Lekovic, M. et al. (2020) [107] | NT | 0 |
| 4 | Ross, C. et al. (2018) [102] | T | 0 | 7 | Lekovic, M. et al. (2020) [107] | NT | 1 |
| 5 | Ross, C. et al. (2018) [102] | NT | 0 | 8 | Lekovic, M. et al. (2020) [107] | NT | 2 |
| 6 | Fathi, E. et al. (2017) [108] | NT | 1 | 9 | Ayse, I. et al. (2010) [109] | T | 2 |
| 7 | Lekovic, M. et al. (2020) [107] | NT | 0 | 10 | Choi, J. et al. (2022) [110] | NT | 2 |
| 8 | Lekovic, M. et al. (2020) [107] | NT | 2 | 11 | Choi, J. et al. (2022) [110] | NT | 2 |
| 9 | Lekovic, M. et al. (2020) [107] | NT | 0 | 12 | Choi, J. et al. (2022) [110] | NT | 2 |
| 10 | Lekovic, M. et al. (2020) [107] | NT | 1 | 13 | Choi, J. et al. (2022) [110] | NT | 2 |
| 11 | Ma, Q. et al. (2016) [105] | NT | 0 | 14 | Choi, J. et al. (2022) [110] | NT | 2 |
| 12 | Ma, Q. et al. (2016) [105] | NT | 0 | 15 | Choi, J. et al. (2022) [110] | NT | 2 |
| 13 | Ma, Q. et al. (2016) [105] | NT | 2 | 16 | Ki, G. et al. (2020) [111] | NT | 2 |
| 14 | Restrepo, A.F. et al. (2016) [112] | NT | 0 | 17 | Falone, S. et al. (2016) [113] | T | 2 |
| 15 | Restrepo, A.F. et al. (2016) [112] | NT | 2 | CELL CYCLE | |||
| 16 | Restrepo, A.F. et al. (2016) [112] | NT | 2 | 1 | Cios, A. et al. (2021) [101] | NT | 0 |
| 17 | Restrepo, A.F. et al. (2016) [112] | NT | 2 | 2 | Cios, A. et al. (2021) [101] | T | 1 |
| 18 | Restrepo, A.F. et al. (2016) [112] | NT | 2 | 3 | Cios, A. et al. (2021) [101] | NT | 1 |
| 19 | Restrepo, A.F. et al. (2016) [112] | NT | 2 | 4 | Cios, A. et al. (2021) [101] | T | 1 |
| 20 | Restrepo, A.F. et al. (2016) [112] | NT | 2 | 5 | Fan, W. et al. (2015) [114] | NT | 1 |
| 21 | Restrepo, A.F. et al. (2016) [112] | NT | 2 | 6 | Liu, Y. et al. (2015) [103] | NT | 0 |
| 22 | Restrepo, A.F. et al. (2016) [112] | NT | 2 | 7 | Liu, Y. et al. (2015) [103] | NT | 0 |
| 23 | Restrepo, A.F. et al. (2016) [112] | NT | 2 | 8 | Liu, Y. et al. (2015) [103] | NT | 0 |
| 24 | Rahimi, S. et al. (2023) [97] | NT | 2 | 9 | Focke, F. et al. (2010) [99] | NT | 0 |
| 25 | Rahimi, S. et al. (2023) [97] | NT | 1 | 10 | Focke, F. et al. (2010) [99] | T | 0 |
| 26 | Rahimi, S. et al. (2023) [97] | NT | 1 | ||||
| ID | Authors | Frequency (Hz) | Intensity (mT) | Exposure Time (h) | Cell Type (T/NT) | Results | ID | Authors | Frequency (Hz) | Intensity (mT) | Exposure Time (h) | Cell Type (T/NT) | Results |
|---|---|---|---|---|---|---|---|---|---|---|---|---|---|
| 1 | Nezamtaheri, M. et al. (2022) [74] | 0.01 | 1 | 2 | T | 1 | 43 | Cheng, Y. et al. (2015) [115] | 50 | 0.4 | 4 | NT | 0 |
| 2 | Nezamtaheri, M. et al. (2022) [74] | 0.01 | 1 | 120 | T | 1 | 44 | Cheng, Y. et al. (2015) [115] | 50 | 0.4 | 8 | NT | 0 |
| 3 | Nezamtaheri, M. et al. (2022) [74] | 0.01 | 1 | 120 | NT | 1 | 45 | Cheng, Y. et al. (2015) [115] | 50 | 0.4 | 16 | NT | 2 |
| 4 | Nezamtaheri, M. et al. (2022) [74] | 0.01 | 1 | 120 | T | 1 | 46 | Cheng, Y. et al. (2015) [115] | 50 | 0.4 | 24 | NT | 2 |
| 5 | Nezamtaheri, M. et al. (2022) [74] | 1 | 0.1 | 120 | T | 1 | 47 | Cheng, Y. et al. (2015) [115] | 50 | 0.4 | 32 | NT | 2 |
| 6 | Bergandi, L. et al. (2022) [116] | 3 | 0.115 | 48 | T | 1 | 48 | Rezaie-Tavirani, M. et al. (2017) [117] | 50 | 0.5 | 3 | T | 1 |
| 7 | Bergandi, L. et al. (2022) [116] | 4 | 0.115 | 48 | T | 1 | 49 | Morabito, C. et al. (2017) [84] | 50 | 0.5 | 168 | NT | 0 |
| 8 | Bergandi, L. et al. (2022) [116] | 6 | 0.115 | 48 | T | 1 | 50 | Patruno, A. et al. (2015) [118] | 50 | 1 | 1 | NT | 2 |
| 9 | Bergandi, L. et al. (2022) [116] | 6 | 0.115 | 48 | T | 0 | 51 | Patruno, A. et al. (2015) [118] | 50 | 1 | 24 | NT | 2 |
| 10 | Bergandi, L. et al. (2022) [116] | 6 | 0.115 | 96 | T | 1 | 52 | Rezaie-Tavirani, M. et al. (2017) [117] | 50 | 1 | 3 | T | 1 |
| 11 | Bergandi, L. et al. (2022) [116] | 6 | 0.115 | 96 | T | 0 | 53 | Oh, I. et al. (2020) [119] | 50 | 1 | 120 | T | 1 |
| 12 | Ledda, M. et al. (2018) [76] | 7 | 0.0125 | 120 | NT | 1 | 54 | Morabito, C. et al. (2017) [84] | 50 | 1 | 168 | NT | 0 |
| 13 | Ledda, M. et al. (2018) [76] | 7 | 0.0125 | 120 | NT | 1 | 55 | Vianale, G. et al. (2008) [91] | 50 | 1 | 4 | NT | 0 |
| 14 | Wang, M. et al. (2021) [79] | 7.83 | 0.5 | 48 | T | 1 | 56 | Vianale, G. et al. (2008) [91] | 50 | 1 | 12 | NT | 0 |
| 15 | Wang, M. et al. (2021) [79] | 7.83 | 0.5 | 48 | T | 1 | 57 | Vianale, G. et al. (2008) [91] | 50 | 1 | 24 | NT | 0 |
| 16 | Wang, M. et al. (2021) [79] | 7.83 | 0.5 | 48 | NT | 1 | 58 | Vianale, G. et al. (2008) [91] | 50 | 1 | 48 | NT | 2 |
| 17 | Bergandi, L. et al. (2022) [116] | 8 | 115 | 96 | T | 0 | 59 | Vianale, G. et al. (2008) [91] | 50 | 1 | 72 | NT | 2 |
| 18 | Bergandi, L. et al. (2022) [116] | 8 | 115 | 96 | T | 1 | 60 | Vianale, G. et al. (2008) [91] | 50 | 1 | 96 | NT | 2 |
| 19 | Bergandi, L. et al. (2022) [116] | 10 | 115 | 48 | T | 1 | 61 | Wolf, F. et al. (2005) [120] | 50 | 1 | 48 | T | 2 |
| 20 | Bergandi, L. et al. (2022) [116] | 14 | 115 | 48 | T | 1 | 62 | Wolf, F. et al. (2005) [120] | 50 | 1 | 49 | NT | 2 |
| 21 | Ruiz Gómez, M.J. et al. (2000) [121] | 25 | 1.5 | 2.75 | T | 0 | 63 | Wolf, F. et al. (2005) [120] | 50 | 1 | 50 | NT | 2 |
| 22 | Ruiz Gómez, M.J. et al. (2000) [121] | 25 | 1.5 | 2.75 | T | 1 | 64 | Kim, H. et al. (2013) [122] | 50 | 1 | 48 | NT | 0 |
| 23 | Destefanis, M. et al. (2015) [123] | 50 | 0.045 | 168 | T | 1 | 65 | Kim, H. et al. (2013) [122] | 50 | 1 | 144 | NT | 1 |
| 24 | Destefanis, M. et al. (2015) [123] | 50 | 0.045 | 168 | T | 1 | 66 | Kim, H. et al. (2013) [122] | 50 | 1 | 288 | NT | 1 |
| 25 | Destefanis, M. et al. (2015) [123] | 50 | 0.045 | 168 | T | 1 | 67 | Morabito, C. et al. (2017) [84] | 50 | 1 | 0.5 | NT | 0 |
| 26 | Destefanis, M. et al. (2015) [123] | 50 | 0.045 | 168 | T | 1 | 68 | Morabito, C. et al. (2017) [84] | 50 | 1 | 24 | NT | 0 |
| 27 | Morabito, C. et al. (2017) [84] | 50 | 0.1 | 168 | NT | 0 | 69 | Morabito, C. et al. (2017) [84] | 50 | 1 | 48 | NT | 0 |
| 28 | Morabito, C. et al. (2010) [92] | 50 | 0.1 | 0.5 | T | 0 | 70 | Morabito, C. et al. (2017) [84] | 50 | 1 | 72 | NT | 2 |
| 29 | Morabito, C. et al. (2010) [92] | 50 | 0.1 | 24 | T | 0 | 71 | Morabito, C. et al. (2017) [84] | 50 | 1 | 96 | NT | 0 |
| 30 | Morabito, C. et al. (2010) [92] | 50 | 0.1 | 48 | T | 0 | 72 | Morabito, C. et al. (2017) [84] | 50 | 1 | 120 | NT | 0 |
| 31 | Morabito, C. et al. (2010) [92] | 50 | 0.1 | 72 | T | 2 | 73 | Falone, S. et al. (2007) [94] | 50 | 1 | 24 | T | 0 |
| 32 | Morabito, C. et al. (2010) [92] | 50 | 0.1 | 96 | T | 0 | 74 | Falone, S. et al. (2007) [94] | 50 | 1 | 48 | T | 0 |
| 33 | Morabito, C. et al. (2010) [92] | 50 | 0.1 | 120 | T | 0 | 75 | Falone, S. et al. (2007) [94] | 50 | 1 | 72 | T | 0 |
| 34 | Morabito, C. et al. (2010) [92] | 50 | 0.1 | 144 | T | 0 | 76 | Falone, S. et al. (2007) [94] | 50 | 1 | 96 | T | 0 |
| 35 | Morabito, C. et al. (2010) [92] | 50 | 0.1 | 168 | T | 0 | 77 | Kim, S. et al. (2017) [124] | 60 | 0.8 | 10 | NT | 0 |
| 36 | Morabito, C. et al. (2010) [92] | 50 | 0.1 | 192 | T | 0 | 78 | Kim, S. et al. (2017) [124] | 60 | 0.8 | 20 | NT | 0 |
| 37 | Srdjenovic, B. et al. (2014) [125] | 50 | 0.1 | 3 | T | 2 | 79 | Huang, C. et al. (2014) [126] | 60 | 1.5 | 24 | NT | 0 |
| 38 | Srdjenovic, B. et al. (2014) [125] | 50 | 0.1 | 24 | T | 2 | 80 | Huang, C. et al. (2014) [126] | 60 | 1.5 | 48 | NT | 0 |
| 39 | Srdjenovic, B. et al. (2014) [125] | 50 | 0.1 | 48 | T | 2 | 81 | Huang, C. et al. (2014) [126] | 60 | 1.5 | 72 | NT | 0 |
| 40 | Qiu, L. et al. (2018) [127] | 50 | 0.4 | 1 | NT | 2 | 82 | Huang, C. et al. (2014) [126] | 60 | 1.5 | 96 | NT | 0 |
| 41 | Chen, L. et al. (2020) [128] | 50 | 0.4 | 1 | T | 2 | 83 | Huang, C. et al. (2014) [126] | 60 | 1.5 | 120 | NT | 0 |
| 42 | Nezamtaheri, M. et al. (2022) [74] | 0.01 | 1 | 2 | T | 1 | 84 | Huang, C. et al. (2014) [126] | 60 | 1.5 | 144 | NT | 1 |
| ID | Authors | Frequency (Hz) | Intensity (mT) | Exposure time (h) | Cell Type (T/NT) | Results | ID | Authors | Frequency (Hz) | Intensity (mT) | Exposure Time (h) | Cell Type (T/NT) | Results |
|---|---|---|---|---|---|---|---|---|---|---|---|---|---|
| 1 | Nezamtaheri, M. et al. (2022) [74] | 0.01 | 1 | 2 | T | 2 | 35 | Ledda, M. et al. (2018) [76] | 10 | 1 | 2 | T | 0 |
| 2 | Nezamtaheri, M. et al. (2022) [74] | 0.01 | 1 | 2 | NT | 2 | 36 | Ledda, M. et al. (2018) [76] | 10 | 1 | 2 | NT | 0 |
| 3 | Nezamtaheri, M. et al. (2022) [74] | 0.01 | 1 | 2 | T | 0 | 37 | Ledda, M. et al. (2018) [76] | 10 | 1 | 2 | T | 0 |
| 4 | Nezamtaheri, M. et al. (2022) [74] | 0.01 | 1 | 2 | T | 0 | 38 | Ledda, M. et al. (2018) [76] | 10 | 1 | 2 | T | 0 |
| 5 | Nezamtaheri, M. et al. (2022) [74] | 0.01 | 1 | 24 | T | 0 | 39 | Ledda, M. et al. (2018) [76] | 10 | 10 | 2 | T | 0 |
| 6 | Nezamtaheri, M. et al. (2022) [74] | 0.01 | 1 | 24 | NT | 2 | 40 | Ledda, M. et al. (2018) [76] | 10 | 10 | 2 | NT | 0 |
| 7 | Nezamtaheri, M. et al. (2022) [74] | 0.01 | 1 | 24 | T | 0 | 41 | Ledda, M. et al. (2018) [76] | 10 | 10 | 2 | T | 0 |
| 8 | Nezamtaheri, M. et al. (2022) [74] | 0.01 | 1 | 48 | T | 0 | 42 | Ledda, M. et al. (2018) [76] | 10 | 10 | 2 | T | 0 |
| 9 | Nezamtaheri, M. et al. (2022) [74] | 0.01 | 1 | 48 | NT | 2 | 43 | Ledda, M. et al. (2018) [76] | 10 | 100 | 2 | T | 0 |
| 10 | Nezamtaheri, M. et al. (2022) [74] | 0.01 | 1 | 48 | T | 0 | 44 | Ledda, M. et al. (2018) [76] | 10 | 100 | 2 | NT | 0 |
| 11 | Nezamtaheri, M. et al. (2022) [74] | 0.01 | 1 | 72 | T | 0 | 45 | Ledda, M. et al. (2018) [76] | 10 | 100 | 2 | T | 0 |
| 12 | Nezamtaheri, M. et al. (2022) [74] | 0.01 | 1 | 72 | NT | 0 | 46 | Ledda, M. et al. (2018) [76] | 10 | 100 | 2 | T | 0 |
| 13 | Nezamtaheri, M. et al. (2022) [74] | 0.01 | 1 | 72 | T | 0 | 47 | Ruiz Gómez, M.J. et al. (2001) [121] | 25 | 1.5 | 2.75 | T | 0 |
| 14 | Nezamtaheri, M. et al. (2022) [74] | 0.01 | 1 | 120 | NT | 2 | 48 | Ruiz Gómez, M.J. et al. (2001) [121] | 25 | 1.5 | 2.75 | T | 0 |
| 15 | Nezamtaheri, M. et al. (2022) [74] | 0.01 | 100 | 2 | T | 0 | 49 | Falone, S. et al. (2007) [94] | 50 | 1 | 24 | T | 0 |
| 16 | Nezamtaheri, M. et al. (2022) [74] | 0.01 | 100 | 2 | NT | 0 | 50 | Falone, S. et al. (2007) [94] | 50 | 1 | 48 | T | 0 |
| 17 | Nezamtaheri, M. et al. (2022) [74] | 0.01 | 100 | 2 | T | 0 | 51 | Falone, S. et al. (2007) [94] | 50 | 1 | 72 | T | 0 |
| 18 | Nezamtaheri, M. et al. (2022) [74] | 0.01 | 100 | 2 | T | 0 | 52 | Falone, S. et al. (2007) [94] | 50 | 1 | 96 | T | 0 |
| 19 | Nezamtaheri, M. et al. (2022) [74] | 0.1 | 1 | 2 | T | 0 | 53 | Garip, A. et al. (2010) [90] | 50 | 1 | 3 | T | 1 |
| 20 | Nezamtaheri, M. et al. (2022) [74] | 0.1 | 1 | 2 | NT | 0 | 54 | Ding, Z. et al. (2017) [129] | 50 | 2.3 | 16 | NT | 0 |
| 21 | Nezamtaheri, M. et al. (2022) [74] | 0.1 | 10 | 2 | T | 0 | 55 | Ding, Z. et al. (2017) [129] | 50 | 2.3 | 16 | NT | 2 |
| 22 | Nezamtaheri, M. et al. (2022) [74] | 0.1 | 100 | 2 | T | 0 | 56 | Yin, C. et al. (2016) [80] | 50 | 8 | 90 | NT | 2 |
| 23 | Nezamtaheri, M. et al. (2022) [74] | 1 | 1 | 2 | T | 0 | 57 | Ramazi, S. et al. (2023) [130] | 50 | 20 | 24 | T | 0 |
| 24 | Nezamtaheri, M. et al. (2022) [74] | 1 | 10 | 2 | T | 0 | 58 | Akbarnejad, Z. et al. (2017) [95] | 100 | 10 | 72 | T | 0 |
| 25 | Nezamtaheri, M. et al. (2022) [74] | 1 | 100 | 2 | T | 0 | 59 | Akbarnejad, Z. et al. (2017) [95] | 100 | 10 | 72 | T | 0 |
| 26 | Nezamtaheri, M. et al. (2022) [74] | 1 | 100 | 2 | NT | 0 | 60 | Akbarnejad, Z. et al. (2017) [95] | 100 | 10 | 72 | T | 0 |
| 27 | Nezamtaheri, M. et al. (2022) [74] | 1 | 100 | 2 | T | 2 | 61 | Akbarnejad, Z. et al. (2017) [95] | 100 | 10 | 96 | T | 0 |
| 28 | Nezamtaheri, M. et al. (2022) [74] | 1 | 100 | 2 | T | 0 | 62 | Akbarnejad, Z. et al. (2017) [95] | 100 | 10 | 96 | T | 0 |
| 29 | Nezamtaheri, M. et al. (2022) [74] | 1 | 100 | 24 | T | 0 | 63 | Akbarnejad, Z. et al. (2017) [95] | 100 | 10 | 96 | T | 0 |
| 30 | Nezamtaheri, M. et al. (2022) [74] | 1 | 100 | 48 | T | 0 | 64 | Akbarnejad, Z. et al. (2017) [95] | 100 | 10 | 120 | T | 0 |
| 31 | Nezamtaheri, M. et al. (2022) [74] | 1 | 100 | 72 | T | 0 | 65 | Akbarnejad, Z. et al. (2017) [95] | 100 | 10 | 120 | T | 0 |
| 32 | Nezamtaheri, M. et al. (2022) [74] | 1 | 100 | 120 | T | 2 | 66 | Akbarnejad, Z. et al. (2017) [95] | 100 | 10 | 144 | T | 2 |
| 33 | Ledda, M. et al. (2018) [76] | 7 | 0.0125 | 120 | NT | 0 | 67 | Akbarnejad, Z. et al. (2017) [95] | 100 | 10 | 144 | T | 2 |
| 34 | Ledda, M. et al. (2018) [76] | 7 | 0.0125 | 120 | NT | 2 |
| ID | Authors | Frequency (Hz) | Intensity (mT) | Exposure Time (h) | Cell Type (T/NT) | Results | ID | Authors | Frequency (Hz) | Intensity (mT) | Exposure Time (h) | Cell Type (T/NT) | Results |
|---|---|---|---|---|---|---|---|---|---|---|---|---|---|
| 1 | Nezamtaheri, M. et al. (2022) [74] | 0.01 | 1 | 120 | T | 2 | 33 | Iorio, R. et al. (2010) [131] | 50 | 5 | 1 | NT | 0 |
| 2 | Nezamtaheri, M. et al. (2022) [74] | 0.01 | 1 | 120 | NT | 2 | 34 | Iorio, R. et al. (2010) [131] | 50 | 5 | 2 | NT | 2 |
| 3 | Nezamtaheri, M. et al. (2022) [74] | 0.01 | 1 | 120 | T | 0 | 35 | Iorio, R. et al. (2010) [131] | 50 | 5 | 3 | NT | 2 |
| 4 | Nezamtaheri, M. et al. (2022) [74] | 1 | 0.1 | 120 | T | 2 | 36 | Patruno, A. et al. (2010) [132] | 50 | 1 | 3 | NT | 2 |
| 5 | Srdjenovic, B. et al. (2014) [125] | 50 | 0.04 | 3 | T | 0 | 37 | Patruno, A. et al. (2010) [132] | 50 | 1 | 18 | NT | 2 |
| 6 | Srdjenovic, B. et al. (2014) [125] | 50 | 0.04 | 24 | T | 0 | 38 | Wolf, F. et al. (2005) [120] | 50 | 1 | 3 | NT | 0 |
| 7 | Destefanis, M. et al. (2015) [123] | 50 | 0.045 | 72 | T | 2 | 39 | Wolf, F. et al. (2005) [120] | 50 | 1 | 24 | NT | 0 |
| 8 | Destefanis, M. et al. (2015) [123] | 50 | 0.045 | 72 | T | 2 | 40 | Morabito, C. et al. (2010) [92] | 50 | 1 | 0.5 | T | 2 |
| 9 | Destefanis, M. et al. (2015) [123] | 50 | 0.045 | 168 | T | 2 | 41 | Reale, M. et al. (2014) [93] | 50 | 1 | 3 | T | 2 |
| 10 | Destefanis, M. et al. (2015) [123] | 50 | 0.045 | 168 | T | 2 | 42 | Reale, M. et al. (2014) [93] | 50 | 1 | 6 | T | 2 |
| 11 | Calcabrini, C. et al. (2017) [83] | 50 | 0.05 | 1 | NT | 1 | 43 | Reale, M. et al. (2014) [93] | 50 | 1 | 24 | T | 2 |
| 12 | Calcabrini, C. et al. (2017) [83] | 50 | 0.05 | 2 | NT | 2 | 44 | Frahm, J. et al. (2006) [133] | 50 | 1 | 0.75 | NT | 2 |
| 13 | Calcabrini, C. et al. (2017) [83] | 50 | 0.05 | 4 | NT | 0 | 45 | Falone, S. et al. (2007) [94] | 50 | 1 | 24 | T | 0 |
| 14 | Frahm, J. et al. (2006) [133] | 50 | 0.05 | 0.75 | NT | 2 | 46 | Falone, S. et al. (2007) [94] | 50 | 1 | 48 | T | 0 |
| 15 | Morabito, C. et al. (2010) [92] | 50 | 0.1 | 0.5 | T | 0 | 47 | Falone, S. et al. (2007) [94] | 50 | 1 | 72 | T | 0 |
| 16 | Frahm, J. et al. (2006) [133] | 50 | 0.1 | 0.75 | NT | 2 | 48 | Falone, S. et al. (2007) [94] | 50 | 1 | 96 | T | 0 |
| 17 | Srdjenovic, B. et al. (2014) [125] | 50 | 0.1 | 3 | T | 0 | 49 | Yin, C. et al. (2016) [80] | 50 | 8 | 1.5 | NT | 2 |
| 18 | Srdjenovic, B. et al. (2014) [125] | 50 | 0.1 | 24 | NT | 0 | 50 | Ramazi, S. et al. (2023) [130] | 50 | 20 | 24 | T | 2 |
| 19 | Calcabrini, C. et al. (2017) [83] | 50 | 0.1 | 1 | NT | 2 | 51 | Kim, S. et al. (2017) [134] | 60 | 0.8 | 20 | NT | 2 |
| 20 | Calcabrini, C. et al. (2017) [83] | 50 | 0.1 | 2 | NT | 2 | 52 | Falone, S. et al. (2007) [94] | 60 | 6 | 0.5 | T | 0 |
| 21 | Calcabrini, C. et al. (2017) [83] | 50 | 0.1 | 4 | NT | 0 | 53 | Song, K. et al. (2018) [89] | 60 | 6 | 72 | T | 1 |
| 22 | Calcabrini, C. et al. (2017) [83] | 50 | 0.15 | 1 | NT | 0 | 54 | Song, K. et al. (2018) [89] | 60 | 6 | 72 | NT | 1 |
| 23 | Calcabrini, C. et al. (2016) [83] | 50 | 0.2 | 1 | NT | 0 | 55 | Song, K. et al. (2018) [89] | 60 | 6 | 168 | T | 1 |
| 24 | Frahm, J. et al. (2006) [133] | 50 | 0.5 | 0.75 | NT | 2 | 56 | Song, K. et al. (2018) [89] | 60 | 6 | 168 | NT | 1 |
| 25 | Patruno, A. et al. (2020) [135] | 50 | 1 | 1 | T | 2 | 57 | Akbarnejad, Z. et al. (2017) [95] | 100 | 10 | 72 | T | 0 |
| 26 | Patruno, A. et al. (2020) [135] | 50 | 1 | 6 | T | 1 | 58 | Akbarnejad, Z. et al. (2017) [95] | 100 | 10 | 72 | T | 0 |
| 27 | Patruno, A. et al. (2020) [135] | 50 | 1 | 24 | T | 2 | 59 | Akbarnejad, Z. et al. (2017) [95] | 100 | 10 | 96 | T | 2 |
| 28 | Park, J. et al. (2013) [88] | 50 | 1 | 1.5 | NT | 2 | 60 | Akbarnejad, Z. et al. (2017) [95] | 100 | 10 | 96 | T | 2 |
| 29 | Park, J. et al. (2013) [88] | 50 | 1 | 96 | NT | 2 | 61 | Akbarnejad, Z. et al. (2017) [95] | 100 | 10 | 120 | T | 2 |
| 30 | Garip, A. et al. (2010) [90] | 50 | 1 | 3 | T | 2 | 62 | Akbarnejad, Z. et al. (2017) [95] | 100 | 10 | 120 | T | 2 |
| 31 | Buldak, R. et al. (2012) [136] | 50 | 1 | 0.66 | T | 0 | 63 | Akbarnejad, Z. et al. (2017) [95] | 100 | 10 | 144 | T | 2 |
| 32 | Ayse, I. et al. (2010) [109] | 50 | 5 | 1 | T | 2 | 64 | Akbarnejad, Z. et al. (2017) [95] | 100 | 10 | 144 | T | 2 |
| ID | Authors | Frequency (Hz) | Intensity (mT) | Exposure Time (h) | Cell Type (T/NT) | Results | ID | Authors | Frequency (Hz) | Intensity (mT) | Exposure Time (h) | Cell Type (T/NT) | Results |
|---|---|---|---|---|---|---|---|---|---|---|---|---|---|
| 1 | Nezamtaheri, M. et al. (2022) [74] | 0.01 | 1 | 2 | T | 1 | 27 | Falone, S. et al. (2007) [94] | 50 | 1 | 48 | T | 0 |
| 2 | Nezamtaheri, M. et al. (2022) [74] | 0.01 | 1 | 120 | T | 1 | 28 | Falone, S. et al. (2007) [94] | 50 | 1 | 72 | T | 0 |
| 3 | Nezamtaheri, M. et al. (2022) [74] | 0.01 | 1 | 120 | NT | 1 | 29 | Falone, S. et al. (2007) [94] | 50 | 1 | 96 | T | 0 |
| 4 | Nezamtaheri, M. et al. (2022) [74] | 0.01 | 1 | 120 | T | 1 | 30 | Song, K. et al. (2018) [89] | 60 | 6 | 24 | T | 0 |
| 5 | Nezamtaheri, M. et al. (2022) [74] | 0.01 | 1 | 120 | T | 1 | 31 | Song, K. et al. (2018) [89] | 60 | 6 | 24 | NT | 0 |
| 6 | Nezamtaheri, M. et al. (2022) [74] | 1 | 100 | 120 | T | 1 | 32 | Song, K. et al. (2018) [89] | 60 | 6 | 48 | T | 0 |
| 7 | Nezamtaheri, M. et al. (2022) [74] | 1 | 100 | 120 | T | 1 | 33 | Song, K. et al. (2018) [89] | 60 | 6 | 48 | NT | 0 |
| 8 | Ruiz Gómez, M.J. et al. (2001) [121] | 25 | 1.5 | 2.75 | T | 0 | 34 | Song, K. et al. (2018) [89] | 60 | 6 | 72 | T | 0 |
| 9 | Ruiz Gómez, M.J. et al. (2001) [121] | 25 | 1.6 | 2.75 | T | 0 | 35 | Song, K. et al. (2018) [89] | 60 | 6 | 72 | NT | 0 |
| 10 | Patruno, A. et al. (2015) [118] | 50 | 1 | 1 | NT | 1 | 36 | Song, K. et al. (2018) [89] | 60 | 6 | 168 | T | 0 |
| 11 | Patruno, A. et al. (2015) [118] | 50 | 1 | 24 | NT | 1 | 37 | Song, K. et al. (2018) [89] | 60 | 6 | 168 | NT | 0 |
| 12 | Oh, I. Et al. (2020) [119] | 50 | 1 | 120 | T | 1 | 38 | Cho, S. et al. (2014) [81] | 60 | 0.8 | 24 | NT | 0 |
| 13 | Oh, I. Et al. (2020) [119] | 50 | 1 | 120 | T | 1 | 39 | Huang, C. et al. (2014) [126] | 60 | 1.5 | 24 | NT | 0 |
| 14 | Yin, C. et al. (2016) [80] | 50 | 8 | 1.5 | NT | 1 | 40 | Huang, C. et al. (2014) [126] | 60 | 1.5 | 24 | NT | 0 |
| 15 | Wolf, F. et al. (2005) [120] | 50 | 1 | 12 | NT | 1 | 41 | Huang, C. et al. (2014) [126] | 60 | 1.5 | 48 | NT | 0 |
| 16 | Wolf, F. et al. (2005) [120] | 50 | 1 | 24 | NT | 0 | 42 | Huang, C. et al. (2014) [126] | 60 | 1.5 | 72 | NT | 0 |
| 17 | Wolf, F. et al. (2005) [120] | 50 | 1 | 24 | NT | 1 | 43 | Huang, C. et al. (2014) [126] | 60 | 1.5 | 96 | NT | 0 |
| 18 | Wolf, F. et al. (2005) [120] | 50 | 1 | 72 | NT | 0 | 44 | Huang, C. et al. (2014) [126] | 60 | 1.5 | 120 | NT | 0 |
| 19 | Huang, C. et al. (2014) [126] | 50 | 1.5 | 24 | NT | 0 | 45 | Huang, C. et al. (2014) [126] | 60 | 1.5 | 144 | NT | 0 |
| 20 | Huang, C. et al. (2014) [126] | 50 | 1.5 | 48 | NT | 0 | 46 | Huang, C. et al. (2014) [137] | 60 | 1.5 | 24 | NT | 0 |
| 21 | Huang, C. et al. (2014) [126] | 50 | 1.5 | 72 | NT | 0 | 47 | Huang, C. et al. (2014) [137] | 60 | 1.5 | 48 | NT | 0 |
| 22 | Huang, C. et al. (2014) [126] | 50 | 1.5 | 96 | NT | 0 | 48 | Huang, C. et al. (2014) [137] | 60 | 1.5 | 72 | NT | 0 |
| 23 | Huang, C. et al. (2014) [126] | 50 | 1.5 | 120 | NT | 0 | 49 | Huang, C. et al. (2014) [137] | 60 | 1.5 | 96 | NT | 0 |
| 24 | Huang, C. et al. (2014) [126] | 50 | 1.5 | 144 | NT | 0 | 50 | Huang, C. et al. (2014) [137] | 60 | 1.5 | 120 | NT | 0 |
| 25 | Ma, Q. et al. (2014) (42) | 50 | 2 | 72 | NT | 0 | 51 | Huang, C. et al. (2014) [137] | 60 | 1.5 | 144 | NT | 1 |
| 26 | Falone, S. et al. (2007) (46) | 50 | 1 | 24 | T | 0 | 52 | Mihai, C. et al. (2014) [138] | 100 | 5.6 | 0.75 | NT | 1 |
Disclaimer/Publisher’s Note: The statements, opinions and data contained in all publications are solely those of the individual author(s) and contributor(s) and not of MDPI and/or the editor(s). MDPI and/or the editor(s) disclaim responsibility for any injury to people or property resulting from any ideas, methods, instructions or products referred to in the content. |
© 2024 by the authors. Licensee MDPI, Basel, Switzerland. This article is an open access article distributed under the terms and conditions of the Creative Commons Attribution (CC BY) license (https://creativecommons.org/licenses/by/4.0/).
Share and Cite
López de Mingo, I.; Rivera González, M.-X.; Maestú Unturbe, C. The Cellular Response Is Determined by a Combination of Different ELF-EMF Exposure Parameters: A Scope Review. Int. J. Mol. Sci. 2024, 25, 5074. https://doi.org/10.3390/ijms25105074
López de Mingo I, Rivera González M-X, Maestú Unturbe C. The Cellular Response Is Determined by a Combination of Different ELF-EMF Exposure Parameters: A Scope Review. International Journal of Molecular Sciences. 2024; 25(10):5074. https://doi.org/10.3390/ijms25105074
Chicago/Turabian StyleLópez de Mingo, Isabel, Marco-Xavier Rivera González, and Ceferino Maestú Unturbe. 2024. "The Cellular Response Is Determined by a Combination of Different ELF-EMF Exposure Parameters: A Scope Review" International Journal of Molecular Sciences 25, no. 10: 5074. https://doi.org/10.3390/ijms25105074