

Association between Fasting and Postprandial Levels of Liver Enzymes with Metabolic Syndrome and Suspected Prediabetes in Prepubertal Children
 , ,
, ,
Abstract
:1. Introduction
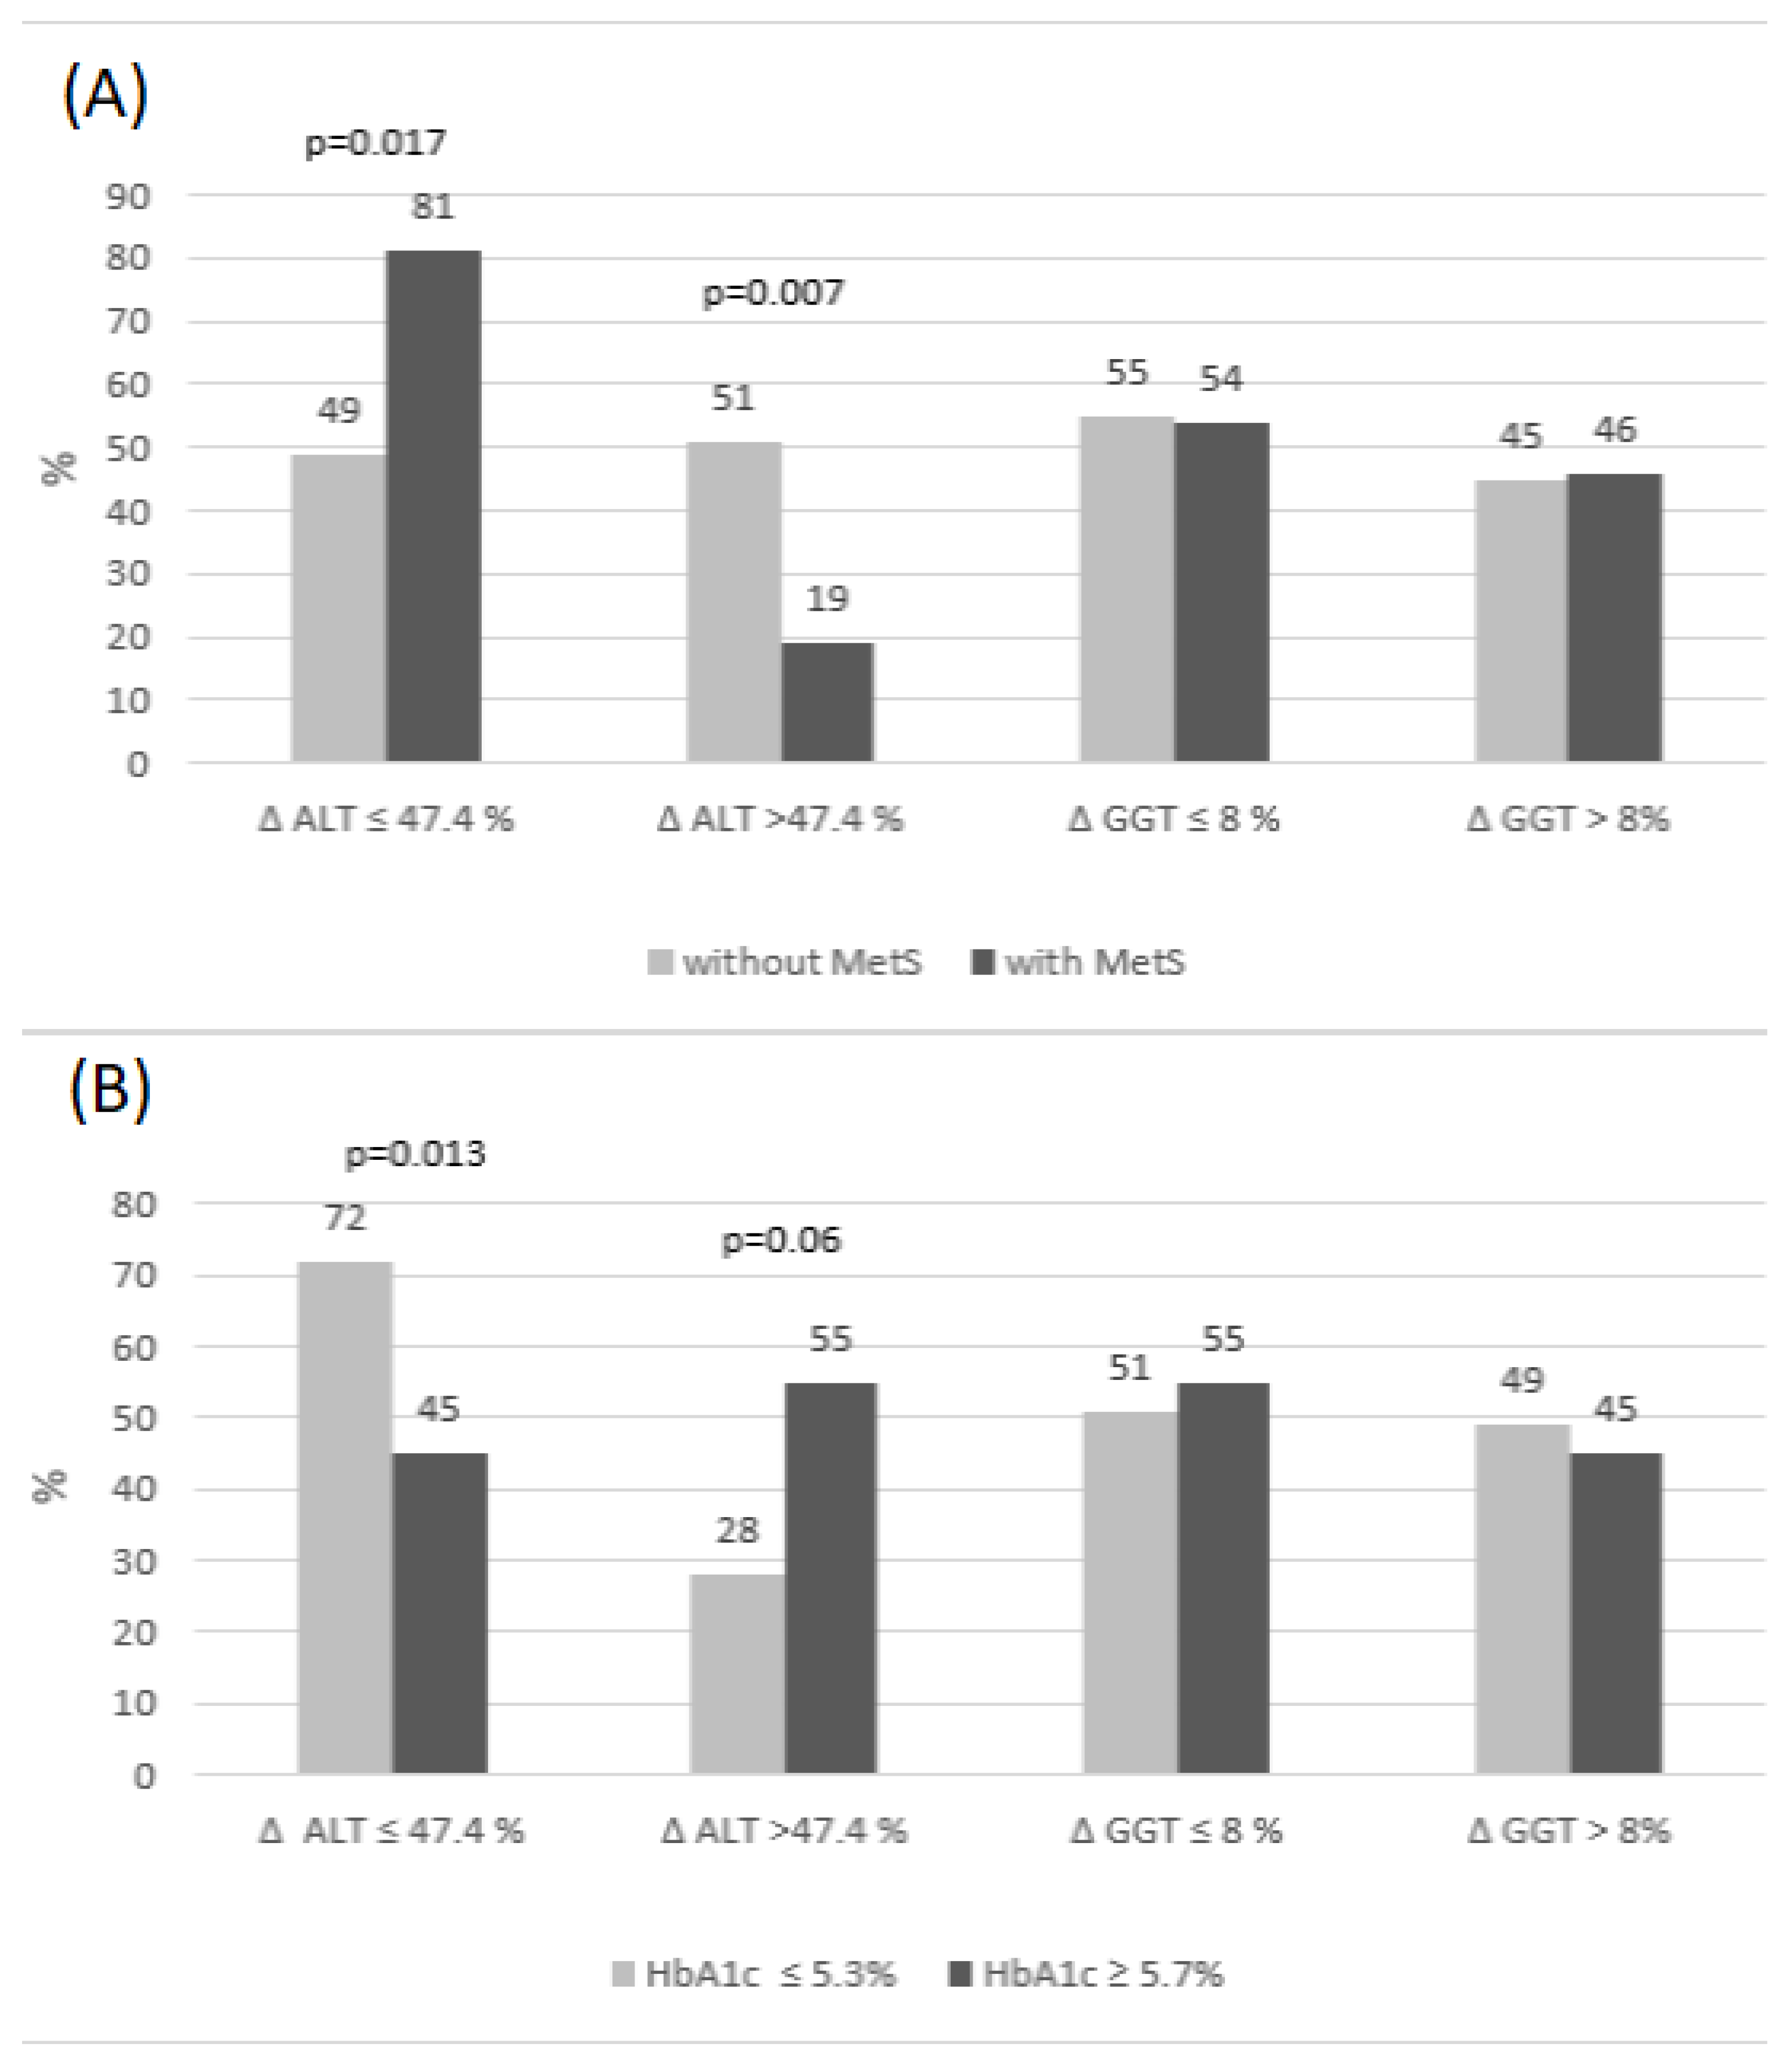
2. Results
3. Discussion
4. Conclusions
5. Materials and Methods
5.1. Subjects
5.2. Methods
5.3. Statistical Analysis
Author Contributions
Funding
Institutional Review Board Statement
Informed Consent Statement
Data Availability Statement
Acknowledgments
Conflicts of Interest
References
- De Boer, M. Assessing and Managing the Metabolic Syndrome in Children and Adolescents. Nutrients 2019, 11, 1788. [Google Scholar] [CrossRef] [Green Version]
- Morrison, J.A.; Friedman, L.A.; Gray-McGuire, C. Metabolic syndrome in childhood predicts adult cardiovascular disease 25 years later: The Princeton Lipid Research Clinics follow-up study. Pediatrics 2007, 120, 340–345. [Google Scholar] [CrossRef]
- Morrison, J.A.; Friedman, L.A.; Wang, P.; Glueck, C.J. Metabolic syndrome in childhood predicts adult metabolic syndrome and type 2 diabetes mellitus 25 to 30 years later. J. Pediatr. 2008, 152, 201–206. [Google Scholar] [CrossRef] [PubMed]
- Krzyzaniak, A.; Krzywinska-Wiewiorowska, M.; Stawinska-Witoszynska, B.; Kaczmarek, M.; Krzych, L.; Kowalska, M.; Szilágyi-Pągowska, I.; Palczewska, I.; Karch, A.; Jośko, J.; et al. Blood pressure references for Polish children and adolescents. Eur. J. Pediatr. 2009, 168, 1335–1342. [Google Scholar] [CrossRef] [PubMed]
- Burgert, T.S.; Taksali, S.E.; Dziura, J.; Goodman, T.R.; Yeckel, C.W.; Papademetris, X.; Constable, R.T.; Weiss, R.; Tamborlane, W.V.; Savoye, M.; et al. Alanine aminotransferase levels and fatty liver in childhood obesity: Associations with insulin resistance, adiponectin, and visceral fat. J. Clin. Endocrinol. Metab. 2006, 91, 4287–4294. [Google Scholar] [CrossRef] [PubMed]
- Koutny, F.; Weghuber, D.; Bollow, E.; Greber-Platzer, S.; Hartmann, K.; Körner, A.; Reinehr, T.; Roebl, M.; Simic-Schleicher, G.; Wabitsch, M.; et al. Prevalence of prediabetes and type 2 diabetes in children with obesity and increased transaminases in European German-speaking countries. Analysis of the APV initiative. Pediatr. Obes. 2020, 15, e12601. [Google Scholar] [CrossRef] [Green Version]
- Pasic, M.D.; Colantonio, D.A.; Chan, M.K.; Venner, A.A.; Brinc, D.; Adeli, K. Influence of fasting and sample collection time on 38 biochemical markers in healthy children: A CALIPER substudy. Clin. Biochem. 2012, 45, 1125–1130. [Google Scholar] [CrossRef]
- Reisinger, C.; Nkeh-Chungag, B.N.; Fredriksen, P.M.; Goswami, N. The prevalence of pediatric metabolic syndrome—A critical look on the discrepancies between definitions and its clinical importance. Int. J. Obes. 2021, 45, 12–24. [Google Scholar] [CrossRef]
- Di Bonito, P.; Licenziati, M.R.; Corica, D.; Wasniewska, M.G.; Di Sessa, A.; Del Giudice, E.M.; Morandi, A.; Maffeis, C.; Faienza, M.F.; Mozzillo, E.; et al. Phenotypes of prediabetes and metabolic risk in Caucasian youths with overweight or obesity. J. Endocrinol. Investig. 2022, 45, 1719–1727. [Google Scholar] [CrossRef]
- Zimmet, P.; Alberti, K.G.M.; Kaufman, F.; Tajima, N.; Silink, M.; Arslanian, S.; Wong, G.; Bennett, P.; Shaw, J.; Caprio, S.; et al. The metabolic syndrome in children and adolescents—An IDF consensus report. Pediatr. Diabetes 2007, 8, 299–306. [Google Scholar] [CrossRef]
- Ford, E.S.; Ajani, U.A.; Mokdad, A.H. The metabolic syndrome and concentrations of C-reactive protein among U.S. youth. Diabetes Care 2005, 28, 878–881. [Google Scholar] [CrossRef] [Green Version]
- Jeans, M.R.; Ghaddar, R.; Vandyousefi, S.; Landry, M.J.; Gray, M.J.; Leidy, H.J.; Whittaker, T.A.; Bray, M.S.; Davis, J.N. Distinct racial and ethnic metabolic syndrome characteristics: A comparative assessment in low-income children 7-10 years of age. Pediatr. Obes 2022, 17, e12925. [Google Scholar] [CrossRef] [PubMed]
- Valle-Martos, R.; Valle, M.; Martos, R.; Cañete, R.; Jiménez-Reina, L.; Cañete, M.D. Liver enzymes correlate with metabolic syndrome, inflammation and endothelial dysfunction in prepubertal children with obesity. Front. Pediatr. 2021, 9, 629346. [Google Scholar] [CrossRef] [PubMed]
- Yasuda, Y.; Miyake, N.; Matsuoka, H.; Sugihara, S. Adiponectin, ALT and family history as critical markers for the development of type 2 diabetes in obese Japanese children. Endocrinol. Diabetes Metab. 2021, 4, e00178. [Google Scholar] [CrossRef] [PubMed]
- Lee, D.H.; Steffen, L.M.; Jacobs, D.R. Association between serum γ-glutamyltransferase and dietary factors: The Coronary Artery Risk Development in Young Adults (CARDIA) Study. Am. J. Clin. Nutr. 2004, 79, 600–605. [Google Scholar] [CrossRef] [PubMed] [Green Version]
- Kunutsor, S.K.; Abbasi, A.; Adler, A.I. Gammaglutamyl transferase and risk of type II diabetes: An updated systematic review and dose-response meta-analysis. Ann. Epidemiol. 2014, 24, 809–816. [Google Scholar] [CrossRef]
- Malnick, S.; Chertin, L.; Neuman, M. Gamma Glutamyl Transferase—An Underestimated Marker for Cardiovascular Disease and the Metabolic Syndrome. J. Pharm. Pharm. Sci. 2020, 23, 65–74. [Google Scholar] [CrossRef] [Green Version]
- Plumelle, D.; Lombard, E.; Nicolai, A.; Portugal, H. Influence of diet and sample collection time on 77 laboratory tests on healthy adults. Clin. Biochem. 2014, 47, 31–37. [Google Scholar] [CrossRef]
- Adeli, K.; Higgins, V.; Trajcevski, K.; White-Al Habeeb, N. The Canadian laboratory initiative on pediatric reference intervals: A CALIPER white paper. Crit. Rev. Clin. Lab. Sci. 2017, 54, 358–413. [Google Scholar] [CrossRef] [Green Version]
- Tobisch, B.; Blatniczky, L.; Barkai, L. Cardiometabolic risk factors and insulin resistance in obese children and adolescents: Relation to puberty. Pediatr. Obes. 2015, 10, 37–44. [Google Scholar] [CrossRef]
- Bilinski, W.J.; Stefanska, A.; Szternel, L.; Bergmann, K.; Siodmiak, J.; Krintus, M.; Paradowski, P.T.; Sypniewska, G. Relationships between Bone Turnover Markers and Factors Associated with Metabolic Syndrome in Prepubertal Girls and Boys. Nutrients 2022, 14, 1205. [Google Scholar] [CrossRef] [PubMed]
- Katsa, M.E.; Ioannidis, A.; Sachlas, A.; Dimopoulos, I.; Chatzipanagiotou, S.; Rojas, A.P. The roles of triglyceride/high-density lipoprotein cholesterol ratio and uric acid as predisposing factors for metabolic syndrome in healthy children. Ann. Pediatr. Endocrinol. Metab. 2019, 24, 172–179. [Google Scholar] [CrossRef] [Green Version]
- Kotronen, A.; Westerbacka, J.; Bergholm, R.; Pietiläinen, K.H.; Yki-Järvinen, H. Liver fat in the metabolic syndrome. J. Clin. Endocrinol. Metab. 2007, 92, 3490–3497. [Google Scholar] [CrossRef] [PubMed]
- Bugianesi, E.; McCullough, A.J.; Marchesini, G. Insulin resistance: A metabolic pathway to chronic liver disease. Hepatology 2005, 42, 987–1000. [Google Scholar] [CrossRef] [PubMed]
- Horiuchi, S. The liver is the main site for metabolism of circulating advanced glycation end products. J. Hepatol. 2002, 36, 123–125. [Google Scholar] [CrossRef]
- Yagmur, E.; Tacke, F.; Weiss, C.; Lahme, B.; Manns, M.P.; Kiefer, P.; Trautwein, C.; Gressner, A.M. Elevation of Nepsilon-(carboxymethyl)lysine-modified advanced glycation end products in chronic liver disease is an indicator of liver cirrhosis. Clin. Biochem. 2006, 39, 39–45. [Google Scholar] [CrossRef] [PubMed]
- Schwimmer, J.B.; Dunn, W.; Norman, G.J.; Pardee, P.E.; Middleton, M.S.; Kerkar, N.; Sirlin, C.B. SAFETY study: Alanine aminotransferase cutoff values are set too high for reliable detection of pediatric chronic liver disease. Gastroenterology 2010, 138, 1357–1364. [Google Scholar] [CrossRef] [PubMed] [Green Version]
- Bobrus-Chociej, A.; Daniluk, U.; Flisiak-Jackiewicz, M.; Wojtkowska, M.; Klusek-Oksiuta, M.; Tarasow, E.; Lebensztejn, D. Estimation of gamma-glutamyl transferase as a suitable simple biomarker of the cardiovascular risk in children with non-alcoholic fatty liver disease. Acta Biochim. Pol. 2018, 65, 539–544. [Google Scholar] [CrossRef]
- Dowla, S.; Aslibekyan, S.; Goss, A.; Fontaine, K.; Ashraf, A.P. Dyslipidemia is associated with pediatric nonalcoholic fatty liver disease. J. Clin. Lipidol. 2018, 12, 981–987. [Google Scholar] [CrossRef]
- Tomizawa, M.; Kawanabe, Y.; Shinozaki, F.; Sato, S.; Motoyoshi, Y.; Sugiyama, T.; Yamamoto, S.; Sueishi, M. Triglyceride is strongly associated with nonalcoholic fatty liver disease among markers of hyperlipidemia and diabetes. Biomed. Rep. 2014, 2, 633–636. [Google Scholar] [CrossRef]
- Geurtsen, M.L.; Santos, S.; Felix, J.F.; Duijts, L.; Vernooij, M.W.; Gaillard, R.; Jaddoe, V.W.V. Liver Fat and Cardiometabolic Risk Factors Among School-Age Children. Hepatology 2020, 72, 119–129. [Google Scholar] [CrossRef] [PubMed] [Green Version]
- Szternel, L.; Krintus, M.; Bergmann, K.; Derezinski, T.; Sypniewska, G. Non-fasting lipid profile detetrmination in presumably healthy children: Impact on the assessment of lipid abnormalities. PLoS ONE 2018, 13, e0198433. [Google Scholar] [CrossRef] [PubMed]
- Peng, J.L.; Hui, P.L.; Yan, N.Z. Screening for Metabolic Syndrome Using an Integrated Continuous Index Consisting of Waist Circumference and Triglyceride: A Preliminary Cross-sectional Study. Diabetes Metab. Syndr. Obes. 2020, 13, 2899–2907. [Google Scholar] [CrossRef]
- Vijayakumar, P.; Nelson, R.G.; Hanson, R.L.; Knowler, W.C.; Sinha, M. HbA1c and the Prediction of Type 2 Diabetes in Children and Adults. Diabetes Care 2017, 40, 16–21. [Google Scholar] [CrossRef] [PubMed] [Green Version]
- Cole, T.J.; Bellizzi, M.C.; Flegal, K.M.; Dietz, W.H. Establishing a standard definition for child overweight and obesity worldwide: International survey. BMJ 2000, 320, 1240–1243. [Google Scholar] [CrossRef] [Green Version]
- Bailey, D.; Bevilacqua, V.; Colantonio, D.A.; Pasic, M.D.; Perumal, N.; Chan, M.K.; Adeli, K. Pediatric Within-Day Biological Variation and Quality Specifications for 38 Biochemical Markers in the CALIPER Cohort. Clin. Chem. 2014, 60, 518–529. [Google Scholar] [CrossRef]


| Variables | MetS(−) (n = 73) | MetS(+) (n = 26) | p | HbA1c ≤ 5.3% (n = 39) | HbA1c ≥ 5.7 (n = 11) | p |
|---|---|---|---|---|---|---|
| Age (years) | 10 (9–10) | 10 (9–10) | 0.676 | 10 (9–10) | 10 (9–10) | 0.669 |
| Sex F/M (F%) | 40/33 (55) | 10/16 (38) | 0.137 | 17/22 (44) | 6/5 (55) | 0.518 |
| BMI centile | 42 (24–63) | 96 (95–97) | <0.001 | 45 (24–86) | 43 (9.0–78) | 0.511 |
| HOMA-IR | 1.58 (1.07–2.38) | 3.13 (2.47–4.91) | <0.001 | 1.58 (1.14–2.50) | 2.70 (2.14–3.45) | 0.008 |
| TG/HDL-C | 0.89 (0.66–1.50) | 2.44 (1.63–3.03) | <0.001 | 1.16 (0.73–1.87) | 1.38 (0.65–1.93) | 0.854 |
| GGT (IU/L) | 11 (9–14) | 17 (12–21) | <0.001 | 11 (9–15) | 12 (10–16) | 0.689 |
| ALT (IU/L) | 5 (3–8) | 12 (9–16) | <0.001 | 8 (5–16) | 6 (4–8) | 0.300 |
| AST (IU/L) | 29 (27–31) | 32 (29–38) | 0.006 | 30 (28–33) | 28 (25–32) | 0.133 |
| ALP (IU/L) | 168 (140–229) | 216 (167–240) | 0.019 | 180 (140–225) | 166 (113–231) | 0.699 |
| WTI | 7.51 (7.24–7.88) | 8.47 (8.32–8.71) | <0.001 | 7.77 (7.26–8.11) | 7.89 (7.26–8.15) | 0.892 |
| HbA1c (%) | 5.4 (5.2–5.5) | 5.4 (5.3–5.5) | 0.522 | 5.2 (5.1–5.3) | 5.7 (5.7–5.8) | <0.001 |
| CRP (mg/L) | 0.46 (0.14–1.10) | 1.82 (0.75–3.03) | <0.001 | 0.65 (0.14–1.49) | 0.34 (0.15–1.86) | 0.725 |
| Δ ALT U/L | 1.7 ± 4.6 | 1.10 ± 5.19 | 0.590 | −0.65 ± 4.2 | 2.95 ± 3.14 | 0.011 |
| Δ GGT U/L | 0.40 ± 3.4 | 1.13 ± 4.41 | 0.359 | −0.06 ± 3.2 | 0.86 ± 3.11 | 0.39 |
| Variable | Study Group (n = 99) | |||
|---|---|---|---|---|
| p | OR (95% CI) per 1 Unit | NR2 | AUC (95% CI) | |
| HOMA-IR | <0.001 | 1.81 (1.33–2.46) | 0.27 | 0.81 (0.72–0.88) |
| TG/HDL | <0.001 | 8.67 (3.41–22.06) | 0.52 | 0.88 (0.80–0.94) |
| ALP | 0.122 | 1.0 (0.99–1.01) | 0.04 | 0.64 (0.53–0.73) |
| GGT | <0.001 | 1.16 (1.06–1.26) | 0.23 | 0.76 (0.67–0.84) |
| ALT | <0.001 | 1.29 (1.15–1.44) | 0.36 | 0.82 (0.73–0.89) |
| AST | 0.530 | 1.01 (0.97–1.05) | 0.01 | 0.67 (0.57–0.76) |
| WTI | <0.001 | 14.50 (5.20–8.12) | 0.75 | 0.96 (0.89–0.99) |
| Variables | OR (95% CI) per 1 Unit (n = 99) | p |
|---|---|---|
| GGT | 1.09 (1.00–1.19) | 0.046 |
| ALT | 1.25 (1.11–1.42) | <0.001 |
| ALP | 1.01 (0.99–1.02) | 0.157 |
| MetS(−) vs. MetS(+) | ||||
|---|---|---|---|---|
| Variable | p | OR (95% CI) per 1 Unit | NR2 | AUC (95% CI) |
| Δ GGT | 0.092 | 1.16 (0.97–1.39) | 0.040 | 0.58 (0.47–0.68) |
| Δ ALT | 0.588 | 0.97 (0.88–1.07) | 0.004 | 0.54 (0.44–0.64) |
| HbA1c ≤ 5.3% vs. ≥5.7% | ||||
| Variable | p | OR per 1 Unit (95% CI) | NR2 | AUC (95% CI) |
| Δ GGT | 0.384 | 1.10 (0.88–1.38) | 0.024 | 0.61 (0.46–0.74) |
| Δ ALT * | 0.021 | 1.33 (1.04–1.69) | 0.216 | 0.74 (0.59–0.85) |
Disclaimer/Publisher’s Note: The statements, opinions and data contained in all publications are solely those of the individual author(s) and contributor(s) and not of MDPI and/or the editor(s). MDPI and/or the editor(s) disclaim responsibility for any injury to people or property resulting from any ideas, methods, instructions or products referred to in the content. |
© 2023 by the authors. Licensee MDPI, Basel, Switzerland. This article is an open access article distributed under the terms and conditions of the Creative Commons Attribution (CC BY) license (https://creativecommons.org/licenses/by/4.0/).
Share and Cite
Bergmann, K.; Stefanska, A.; Krintus, M.; Szternel, L.; Panteghini, M.; Sypniewska, G. Association between Fasting and Postprandial Levels of Liver Enzymes with Metabolic Syndrome and Suspected Prediabetes in Prepubertal Children. Int. J. Mol. Sci. 2023, 24, 1090. https://doi.org/10.3390/ijms24021090
Bergmann K, Stefanska A, Krintus M, Szternel L, Panteghini M, Sypniewska G. Association between Fasting and Postprandial Levels of Liver Enzymes with Metabolic Syndrome and Suspected Prediabetes in Prepubertal Children. International Journal of Molecular Sciences. 2023; 24(2):1090. https://doi.org/10.3390/ijms24021090
Chicago/Turabian StyleBergmann, Katarzyna, Anna Stefanska, Magdalena Krintus, Lukasz Szternel, Mauro Panteghini, and Grazyna Sypniewska. 2023. "Association between Fasting and Postprandial Levels of Liver Enzymes with Metabolic Syndrome and Suspected Prediabetes in Prepubertal Children" International Journal of Molecular Sciences 24, no. 2: 1090. https://doi.org/10.3390/ijms24021090