Article

Mathematical Modeling of ROS Production and Diode-like Behavior in the SDHA/SDHB Subcomplex of Succinate Dehydrogenases in Reverse Quinol-Fumarate Reductase Direction

by
Nikolay I. Markevich
1,* and
Lubov N. Markevich
2
1
Institute of Theoretical and Experimental Biophysics of RAS, 142290 Pushchino, Russia
2
Institute of Cell Biophysics of RAS, 142290 Pushchino, Russia
*
Author to whom correspondence should be addressed.
Int. J. Mol. Sci. 2022, 23(24), 15596; https://doi.org/10.3390/ijms232415596
Submission received: 21 September 2022 / Revised: 6 December 2022 / Accepted: 7 December 2022 / Published: 9 December 2022
(This article belongs to the Collection Feature Paper Collection in Biochemistry)

Abstract

:
Succinate dehydrogenase (SDH) plays an important role in reverse electron transfer during hypoxia/anoxia, in particular, in ischemia, when blood supply to an organ is disrupted, and oxygen is not available. It was detected in the voltammetry studies about three decades ago that the SDHA/SDHB subcomplex of SDH can have such a strong nonlinear property as a “tunnel-diode” behavior in reverse quinol-fumarate reductase direction. The molecular and kinetic mechanisms of this phenomenon, that is, a strong drop in the rate of fumarate reduction as the driving force is increased, are still unclear. In order to account for this property of SDH, we developed and analyzed a mechanistic computational model of reverse electron transfer in the SDHA/SDHB subcomplex of SDH. It was shown that a decrease in the rate of succinate release from the active center during fumarate reduction quantitatively explains the experimentally observed tunnel-diode behavior in SDH and threshold values of the electrode potential of about −80 mV. Computational analysis of ROS production in the SDHA/SDHB subcomplex of SDH during reverse electron transfer predicts that the rate of ROS production decreases when the tunnel-diode behavior appears. These results predict a low rate of ROS production by the SDHA/SDHB subcomplex of SDH during ischemia.

1. Introduction

Succinate dehydrogenase (SDH) is one of the key enzymes of cell energy metabolism, linking the Krebs cycle and the electron transport chain (ETC). SDH reversibly oxidizes succinate to fumarate and transfers the electrons produced by this reaction to the membrane quinone pool, providing ubiquinol QH2 for oxidative phosphorylation in the cell. SDH can have strong nonlinear properties in both directions, such as hysteresis and bistability in forward succinate-quinone oxidoreductase activity [1] and a “tunnel-diode” behavior in reverse quinol-fumarate reductase direction [2]. Although the “tunnel-diode” behavior, that is, a strong drop in the rate of fumarate reduction as the driving force (over potential) is increased, has been detected in the voltammetry studies about three decades ago [2], however, molecular and kinetic mechanisms of this phenomenon remain unclear and studied in this work.
It is important to note that the “tunnel-diode” behavior in the reverse electron transfer in complex II is observed at the level of the hydrophilic SDHA/SDHB subcomplex. Figure 1 schematically shows the reverse electron transfer in complex II. In this case, the electron donor is quinol QH2 in the CoQ (quinone-binding) site localized in the hydrophobic SDHC/SDHD subcomplex in the inner mitochondrial membrane. Two electrons are sequentially transferred, one after the other, to the soluble SDHA/SDHB subcomplex exposed on the matrix side of the mitochondrial inner membrane. First, the electrons are transferred to the chain of [Fe-S] clusters located in the SDHB subunit and then to the FAD-containing SDHA subunit, where the fumarate is reduced to succinate.
Reverse electron transfer in SDH occurs in conditions of oxygen deficiency (hypoxia/anoxia). It was found [3] that complex I (CI) and dihydroorotate dehydrogenase (DHODH) can still deposit electrons into ETC when oxygen is not available as the terminal electron acceptor of the respiratory chain. In this case, cells lacking oxygen reduction accumulate ubiquinol, driving SDH in the reverse direction and depositing electrons onto fumarate, resulting in succinate generation [3] which may be very important during ischemia.
It was proposed that in ischemia when blood supply to an organ is disrupted and oxygen is not available, reversal of mitochondrial complex II (CII) results in ischemic succinate accumulation, that is, ubiquinone Q reduction by CI driving reversal of CII, with fumarate as an electron acceptor yielding succinate oxidation that drives injury at reperfusion [4]. However, the mechanism of experimentally observed ischemic succinate accumulation is controversial [5]. It was shown recently [6] that CII reversal is possible in hypoxic mitochondria but is not the primary succinate source in hypoxic cardiomyocytes or ischemic hearts. That is, ischemic succinate is generated by canonical Krebs cycle activity mostly from α-ketoglutarate and upstream metabolites rather than by mitochondrial CII reversal [6]. A detailed analysis of different models of ischemic succinate accumulation was performed by Chinopoulos in the review [5]. In particular, it was noted that in ischemia, SDH reverses, forming succinate only minorly due to a diode-like property. And besides, mammalian mitochondria lack suitable quinones that could support SDH reversal.
Thus, the main goal of this work was not only to analyze changes in the kinetics of electron transfer responsible for the diode-like behavior of SDH in reverse quinol-fumarate reductase direction but also to study conditions when diode-like behavior is observed.
The authors who first discovered the tunnel-diode behavior [2] suggested that this phenomenon may be based on a strong decrease in the binding of fumarate or release of succinate when electron transfer is accelerated in the opposite direction, that is, fumarate reduction. We tested this hypothesis by analyzing computer-simulated steady-state rates of reverse electron transfer in the SDHA/SDHB subunits of SDH with a change in the binding/release constants of fumarate/succinate with the active center of SDH during the fumarate reductase reaction and analyzed a dependence of threshold values of the electrode potential when diode-like behavior is observed on different kinetic parameters and concentration of reduced/oxidized redox centers of CII.
Besides, we analyzed ROS production in the SDHA/SDHB subcomplex of SDH during the reverse quinol-fumarate reductase activity and predicted that the rate of ROS production decreases at a decrease in the rate of succinate release from the active site of SDH when FADH and FADH2 are proposed as the major ROS producing redox centers. These results predict a low rate of ROS production by the SDHA/SDHB subcomplex of SDH during hypoxia/anoxia, that is, during ischemia.

2. Results and Discussion

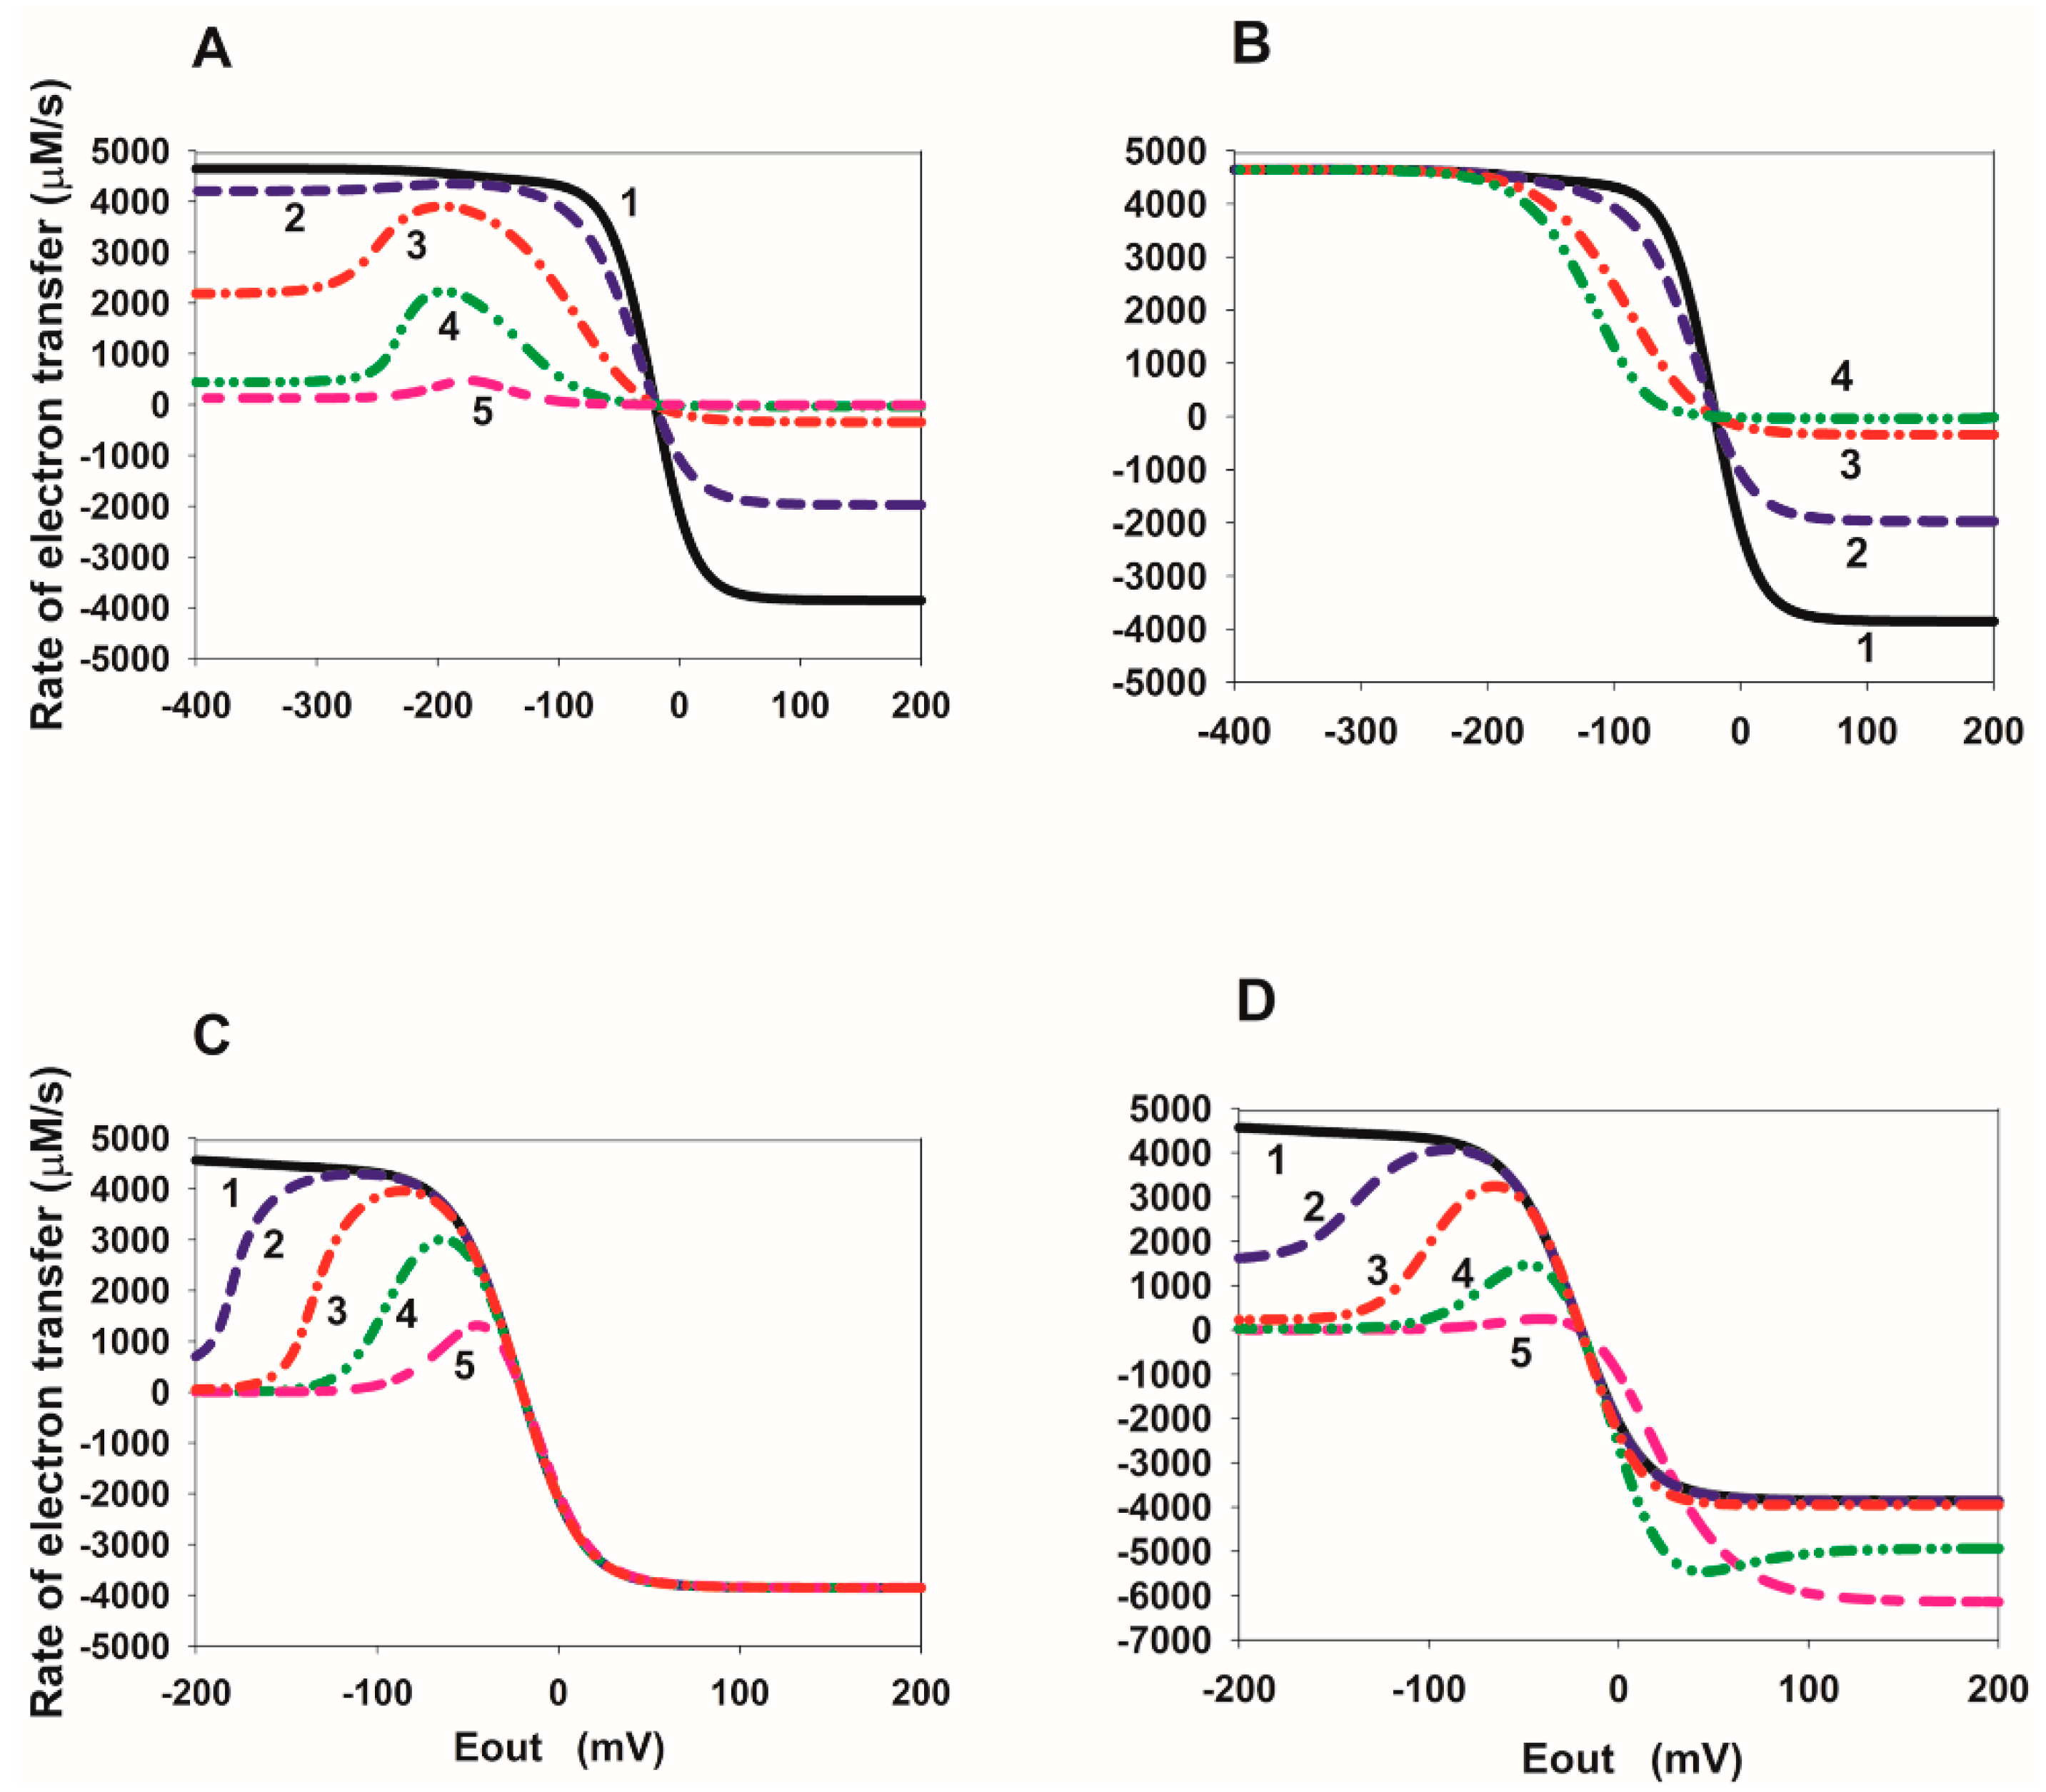
2.1. Eout Dependency of the Total Rate of Reverse Electron Transfer in SDH

Steady-state Eout dependencies of the total rate of reverse electron transfer in the SDHA/SDHB subcomplex of SDH at different values of the rate constants of fumarate and succinate binding to the dicarboxylate binding site upon FAD reduction are presented in Figure 2. The total rate of reverse electron transfer (Vrev_tot) in SDH is computed as the sum of rates of oxidation of the cluster [2Fe-2S] in reactions 5, 6, 9, 11, 13, 15 and equal to Vrev_tot = V5 + V6 + V9 + V11 + V13 + V15. It should point out that Vrev_tot = 2∙V1 = 2∙V2 = 2∙V3 in the steady state because two electrons are transferred to one succinate molecule. Here, V1, V2, and V3 are the rates of reactions 1, 2, and 3, respectively.
Figure 2A shows that when a decrease in constants Keq10 and Keq12 occurs due to a decrease in kon rate constants, k10 and k12, a tunnel-diode behavior is observed, but only at very high negative threshold values of the electrode potential Eout (about −200 mV), which is significantly higher than the experimentally observed values (about −80 mV [2]). If a decrease in constants Keq10 and Keq12 occurs due to only an increase in koff rate constants, k-10 and k-12 (Figure 2B), then tunnel-diode behavior is completely absent.
On the contrary, Figure 2C,D shows a decrease in the rate of dissociation of succinate from the active center at reduced FAD forms, that is, a decrease in equilibrium constants Keq14 and Keq16 due to a decrease in the rate constants k14 and k16 (Figure 2C) or an increase in the rate constants k−14 and k−16 (Figure 2D) upon FAD reduction results in a strong tunnel-diode behavior. Moreover, the threshold potential may be close to the experimentally observed values of about −60 [7] or −80 [2] mV at k14 = k16 = 10−2 s−1, Keq13 = 0.24 µM−1, Keq14 = Keq16 = 0.25 µM (curve 3 in Figure 2C).
It is important to note here that a decrease in Keq14 and Keq16 is accompanied by a simultaneous increase in Keq13 according to the “detailed balance” relations [8], i.e., Keq13 = Keq8 ∙ Keq9/Keq14. This is surprisingly consistent with the experimentally observed [9] strong increase in the midpoint redox potential of the FAD/FADH· pair when succinate binds to SDH. The midpoint potential of the cluster [2Fe-2S] also increases with succinate binding, but to a much lesser extent [9], so that leads to an increase in the constant equilibrium Keq13.

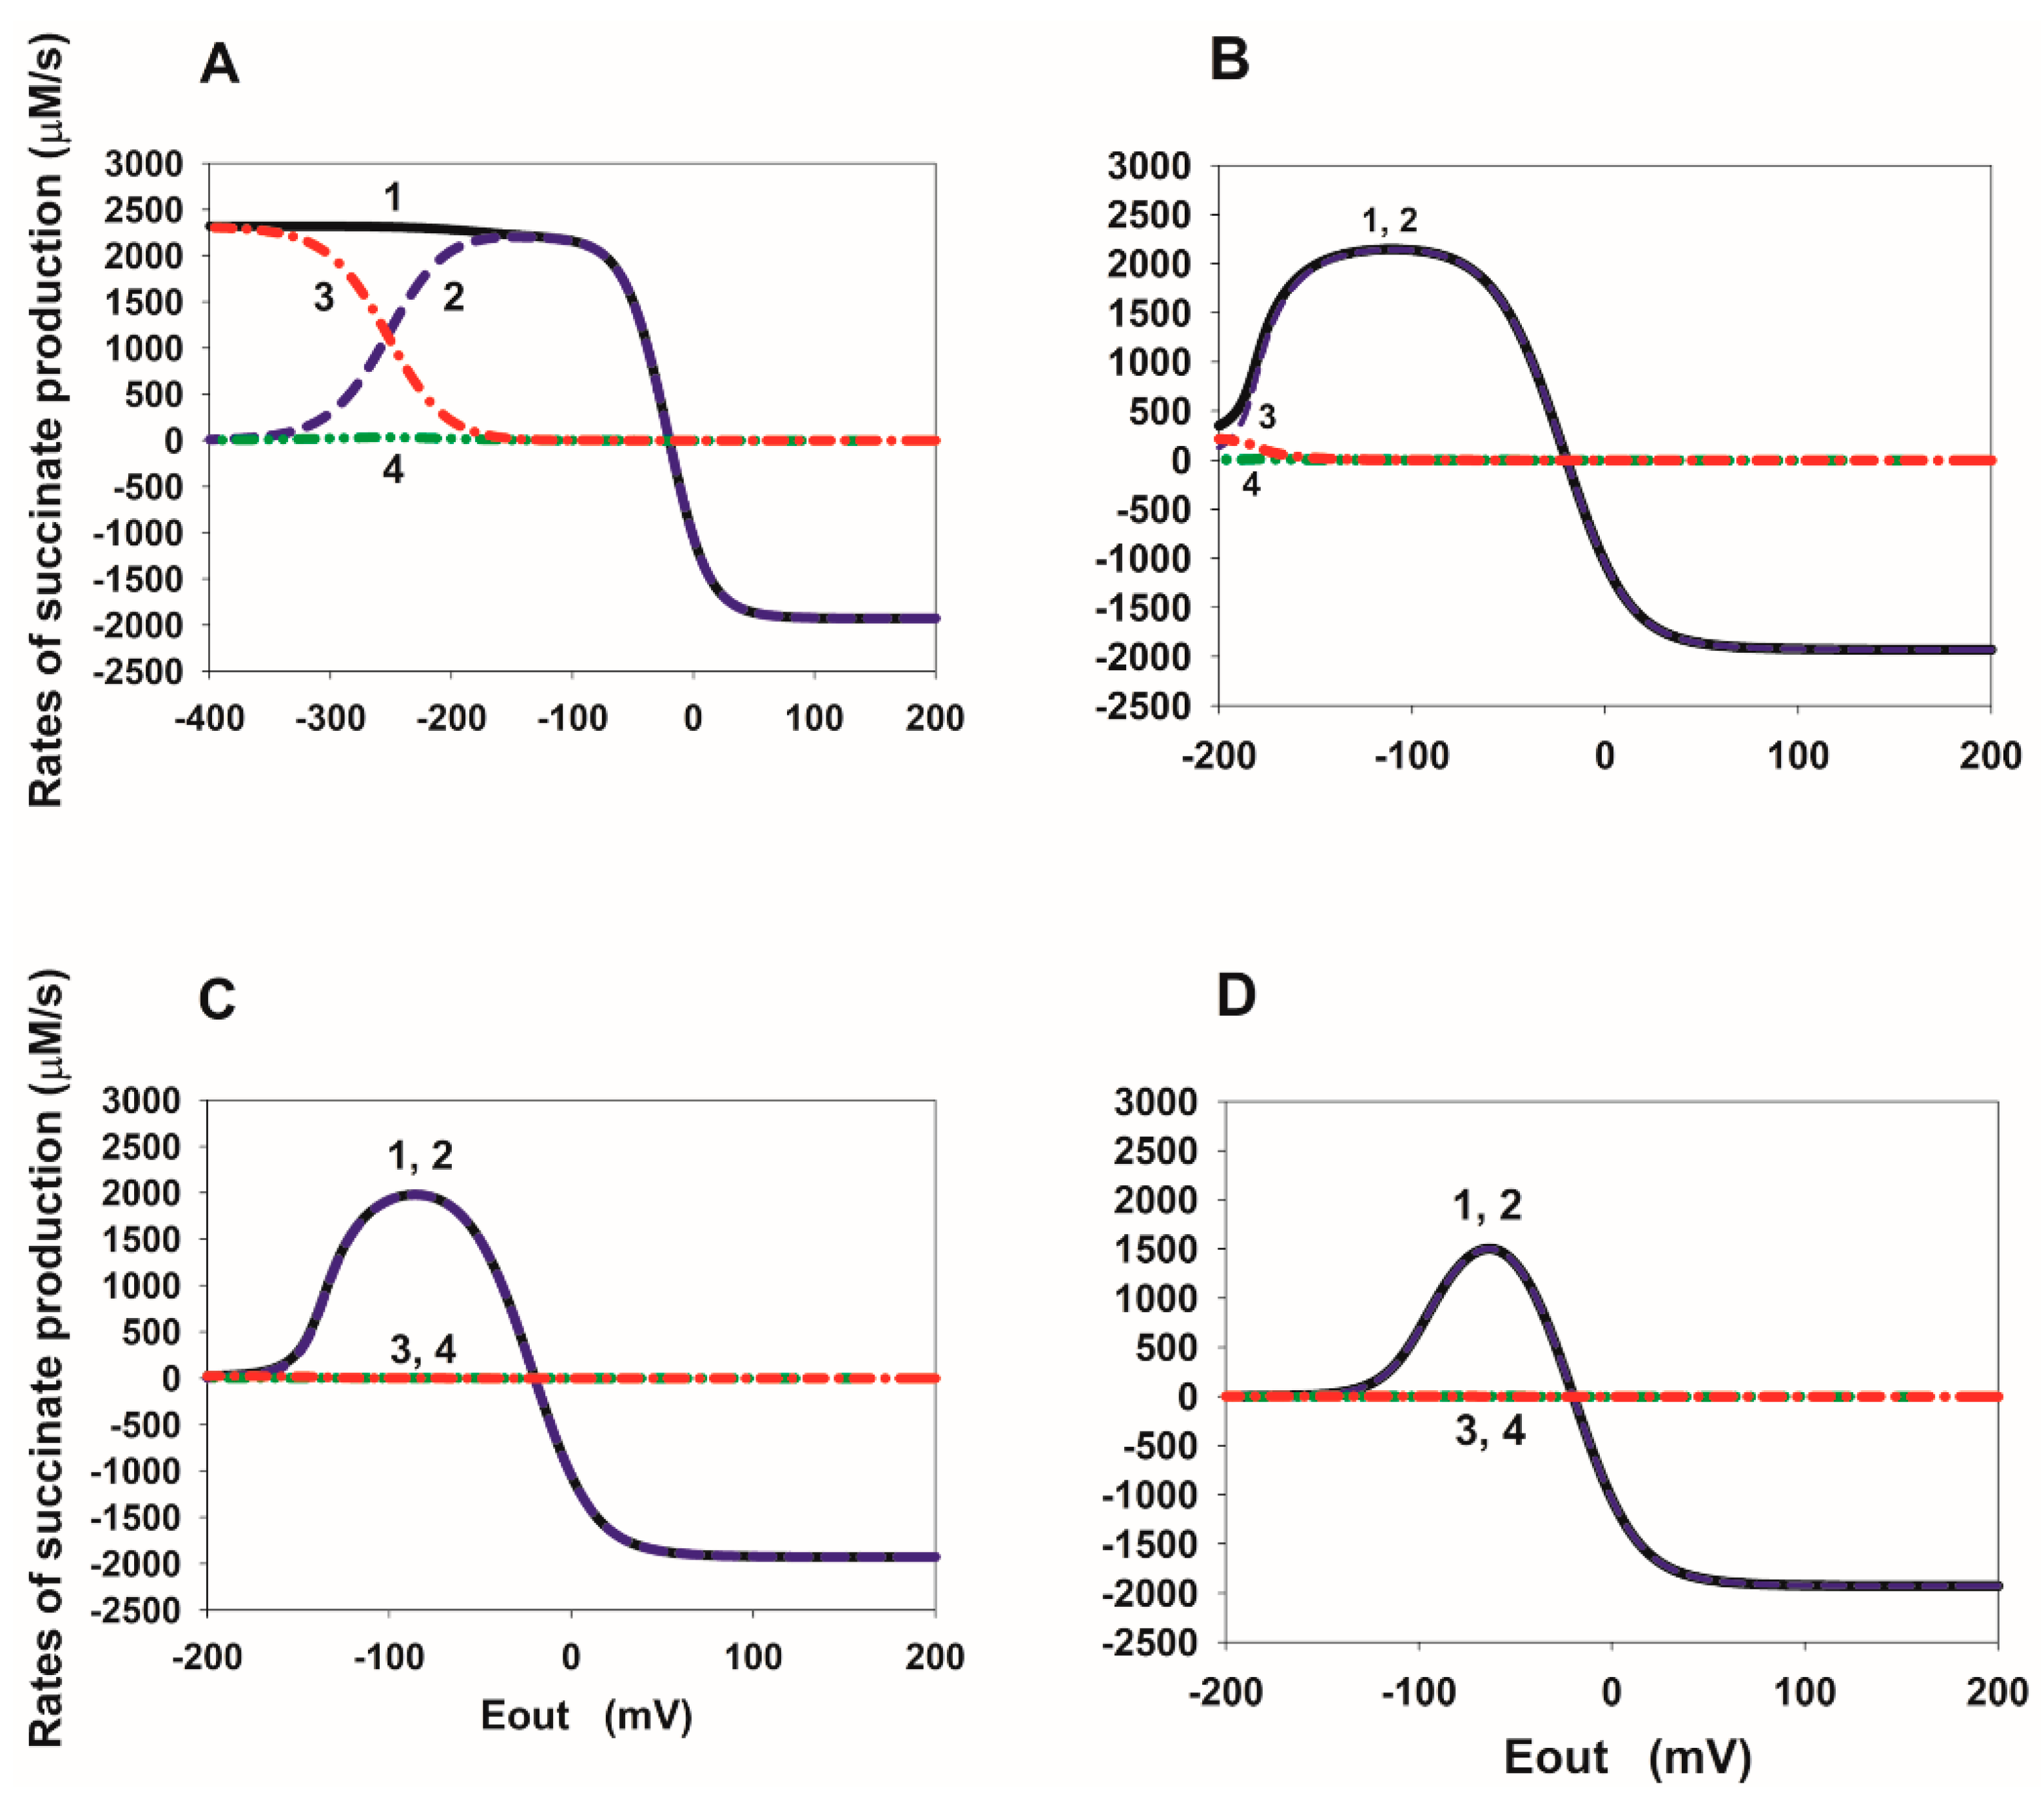
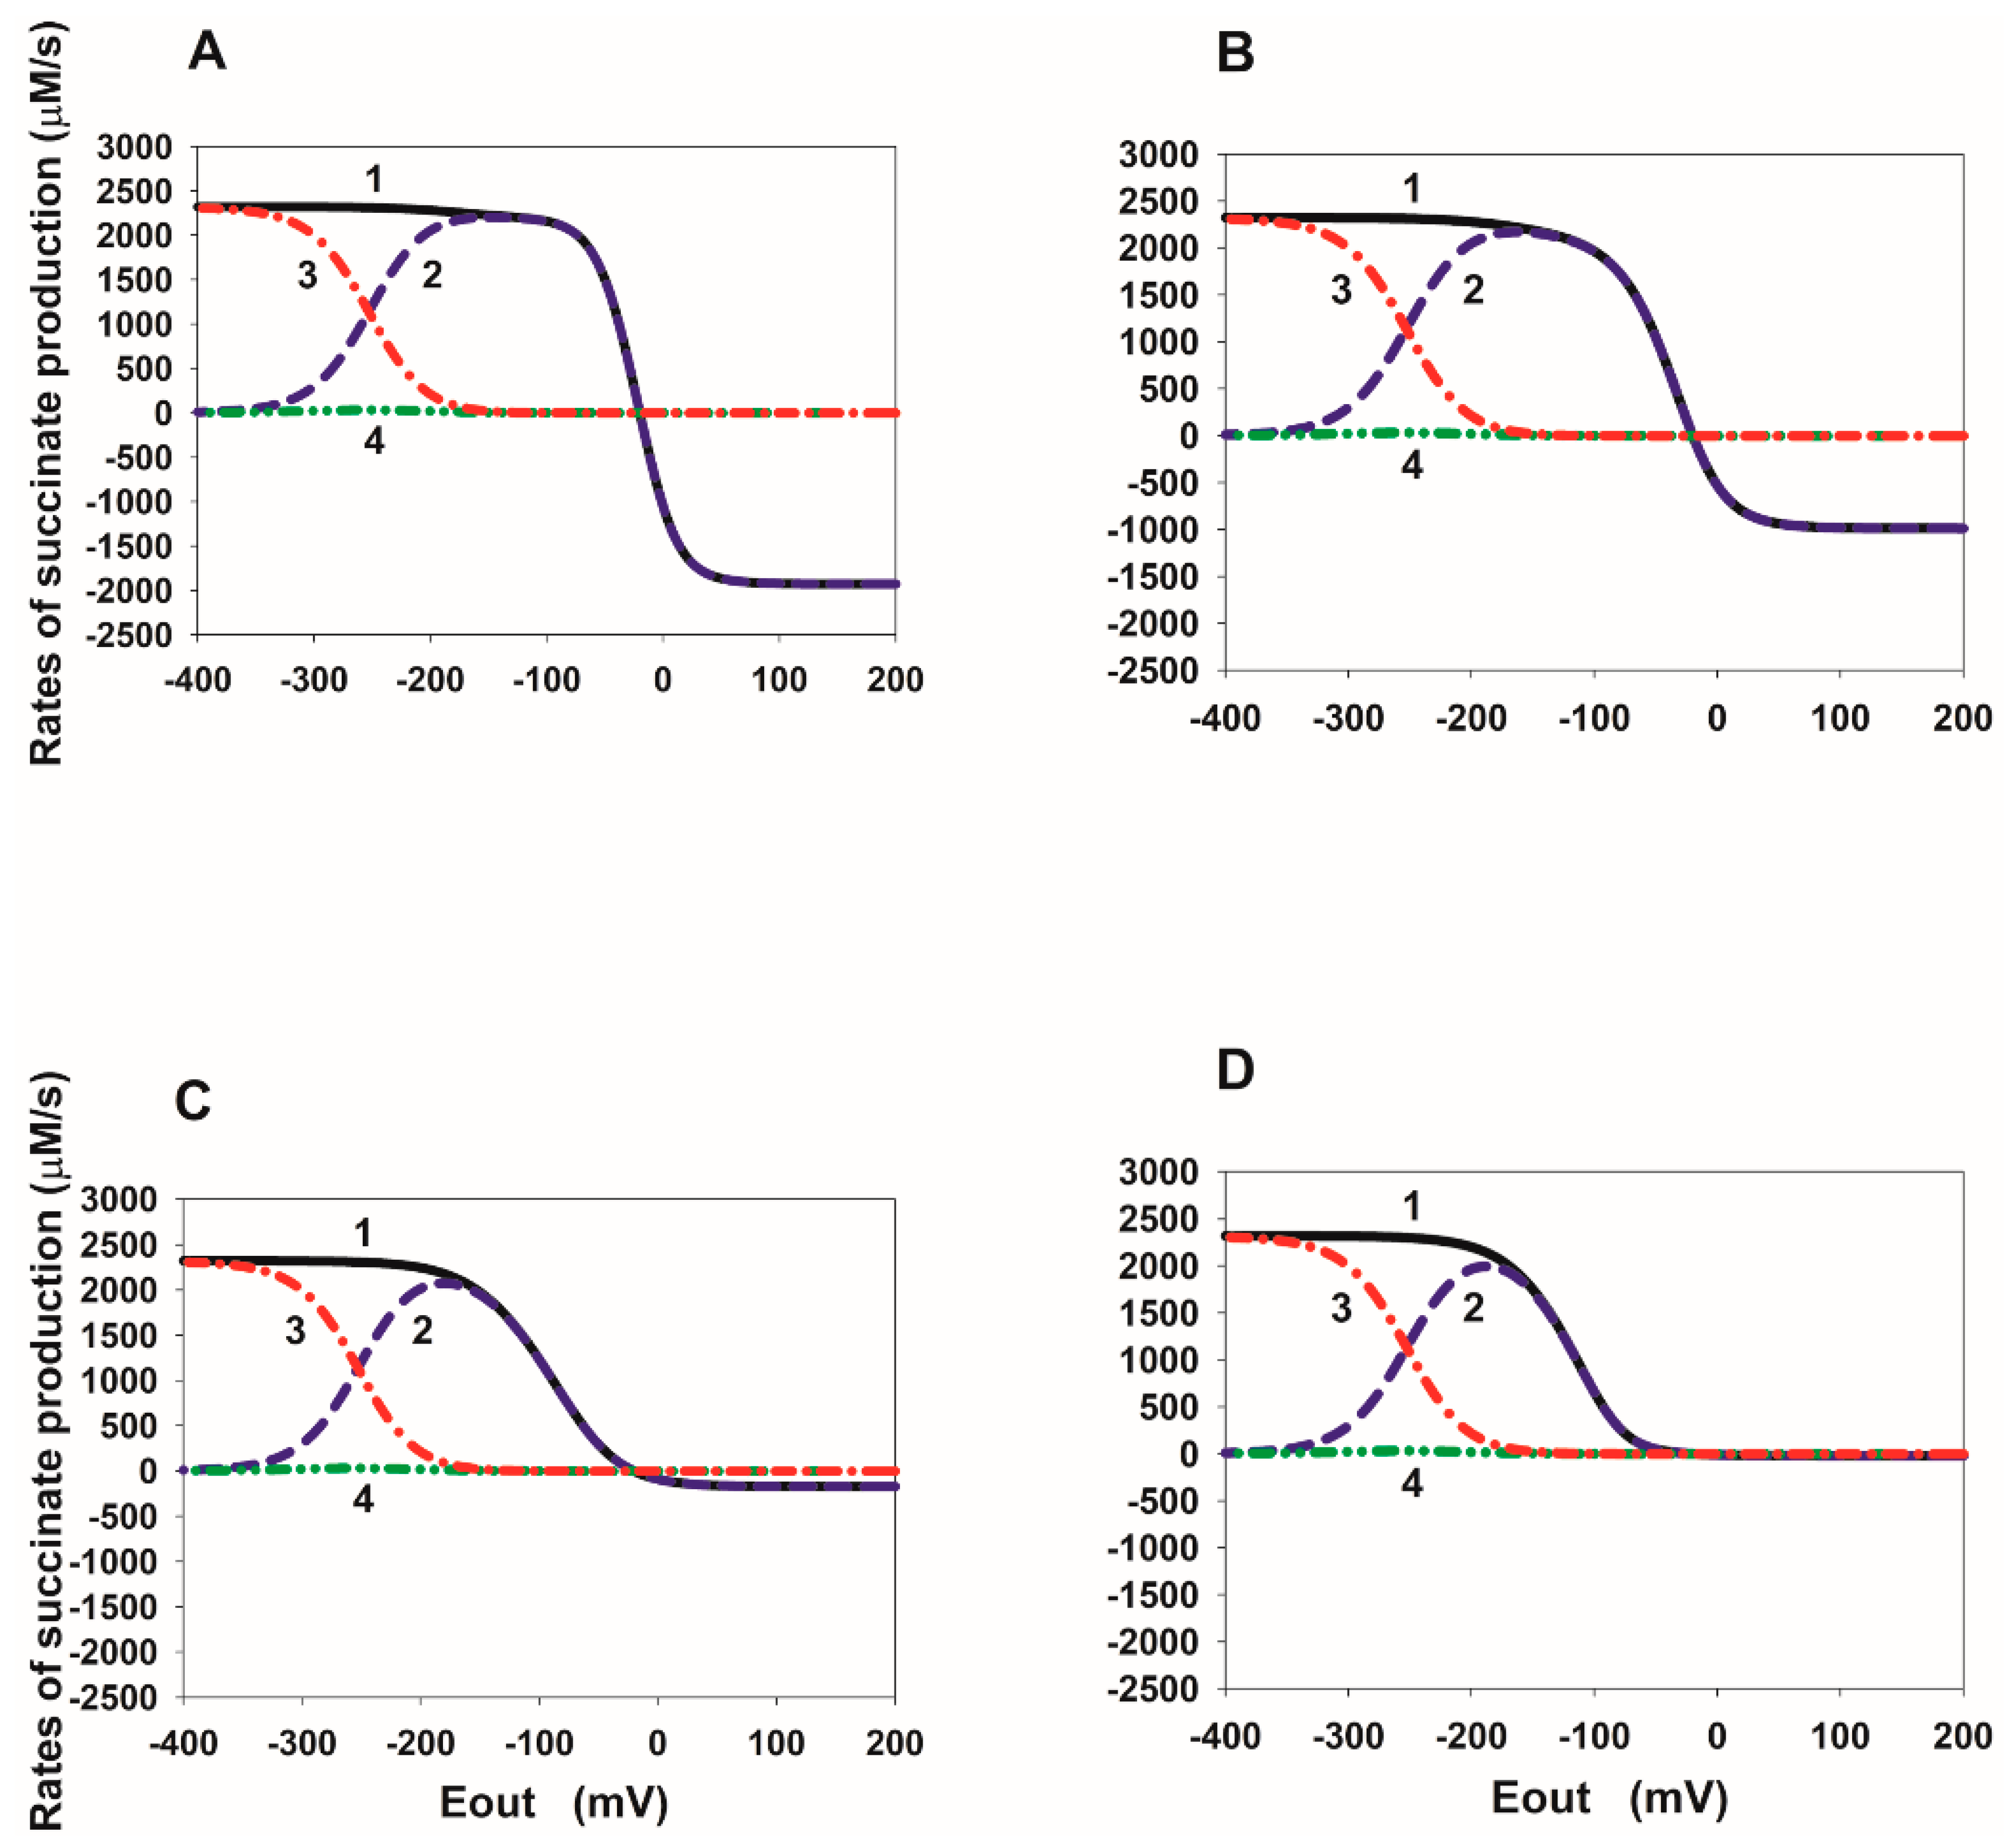
2.2. Eout Dependency of the Rate of Succinate Production in SDH

In order to better understand the mechanism of the tunnel behavior in SDH in the reverse direction, it is convenient to analyze the steady-state Eout dependence of the rates V8, V14, and V16 at different values of the binding/release constants of fumarate/succinate with the active center of SDH. These dependencies are presented in Figure 3, Figure 4, Figure 5 and Figure 6.
It should be noted that the total current in the SDH in the reverse direction is exactly equal to twice the total rate of free succinate production because two electrons are transferred during the formation of one succinate molecule, which is Vrev_tot = 2∙Vsuc_tot, where Vsuc_tot = V8 + V14 + V16.
The steady-state Eout dependencies of the rates V8, V14, and V16 at different values of the succinate release constants from the active center of SDH are presented in Figure 3. First of all, it should be emphasized that the electron transfer rate constants from the cluster [2Fe-2S] to FAD are several orders of magnitude higher than the dissociation constants of succinate. Therefore, electron transfer rates, V13 and V15, significantly prevail over the V8 and V14 rates, respectively, at the branching points with succinate dissociation, such as FAD.suc and FADH·.suc. This means that an increase in the rates of reactions 13 and 15 inhibits the succinate dissociation in reactions 8 and 14, respectively.
Figure 3A shows that the Eout dependence of the succinate dissociation rate V8 (curve 2) has a nonmonotonic behavior at the basal values of all equilibrium constants. That is, it decreases when the electrode potential Eout decreases below a certain threshold value. This drop is due to the strong predominance of the electron transfer rate from the cluster [2Fe-2S] to FAD, V13, over the rate V8 at very low Eout values. However, the total succinate production rate Vsuc_tot (curve 1) increases monotonically with a decrease in Eout due to a strong increase in the dissociation rate V16 (curve 3). The rate V14 (curve 4) always remains low due to the high rate V15.
The 10-fold decrease in succinate dissociation constants k14 and k16 from 10 to 1 s−1 (Figure 3B) results in a strong nonmonotonic (a tunnel-diode behavior) in the Eout dependence of the rate Vsuc_tot (curve 1). This happens because the succinate dissociation rate V16 becomes very low (curve 3) and cannot compensate for the drop in the rate V8 (curve 2) when Eout decreases below the threshold value. The rate V14 (curve 4) remains very low. With a further decrease in the constants k14 and k16 from 10 to 0.1 (Figure 3C) and 0.01 s−1 (Figure 3D), the qualitative behavior of the rates Vsuc_tot, V8, V14, and V16 is the same as in the previous case, only a drop in Vsuc_tot begins at more positive Eout values up to −60 mV observed in experiments [7]. Moreover, the total succinate production rate Vsuc_tot is completely determined only by the rate V8 (curves 1 and 2).
Thus, the results of computer simulation of a decrease in the rate constants of succinate dissociation k14 and k16 and, correspondingly, in Keq14 and Keq16, taking into account simultaneous increase in Keq13, can well quantitatively explain the experimentally observed tunnel-diode behaviour in the reverse transfer of electrons to SDH.
Quite different properties of the appearance of nonmonotonicity in the rate Vsuc_tot are observed when the equilibrium constants Keq14 and Keq16 decrease due to an increase in the constants k−14 and k−16 of the succinate binding to the active center of SDH (Figure 4). Figure 4A is identical to Figure 3A. First of all, k−14 and k−16 must be increased by 1000 times compared to the basal value of 0.04 µM−1 s−1, i.e., up to 40 µM−1 s−1 in order for nonmonotonicity to appear in the Eout dependence of the Vsuc_tot (Figure 4B). Just as in the previous case, the drop in the rate Vsuc_tot (curve 1) when Eout decreases below the threshold value occur due to a decrease in the rate V16 (curve 3), which is no longer able to compensate for the drop in the rate V8 (curve 2). There is a further decrease in the rates V8 (curve 2) and V16 (curve 3) to almost 0 with Eout less than the threshold value when k−14 and k−16 increase up to 400 (Figure 4C) and 4000 µM−1 s−1 (Figure 4D). In this case, the total rate of succinate release, Vsuc_tot, is determined only by the rate V14 (curves 1 and 4).
As can be seen from Figure 4D (see also curve 4 in Figure 2D), the Eout threshold values can approach the experimentally observed values of about −60 mV. However, the values of the equilibrium constant Keq13 satisfying the “detailed balance” relations have to be very high Keq13 = 24 µM−1 at very high rate constants k−14 and k−16 and do not correspond to the experimentally observed values of midpoint potentials Em(FAD.suc/FADH.suc) and Em([2Fe-2S]).
As for the change in the succinate generation rates with a decrease in the binding of fumarate to the active center of SDH during FAD reduction, which corresponds to the data on reverse electron transfer in Figure 2A,B, these data are presented in Figure 5 and Figure 6. Computer simulation analysis shows that if a decrease in the equilibrium constants Keq10 and Keq12 occurs only due to a decrease in the fumarate binding constants k10 and k12, then the nonmonotonicity in the Eout dependence of Vsuc_tot is explained as well as in previous cases by a strong drop in the rate V16 (Figure 5). However, the threshold potential, in this case, is about −200 mV and is very far from the experimentally observed values of about −60 [7] or −80 [2] mV.
If the equilibrium constants Keq10 and Keq12 decrease only by increasing the reverse fumarate release constants k-10 and k-12, then nonmonotonicity in total succinate production, i.e., the tunnel effect, is completely absent (Figure 6).

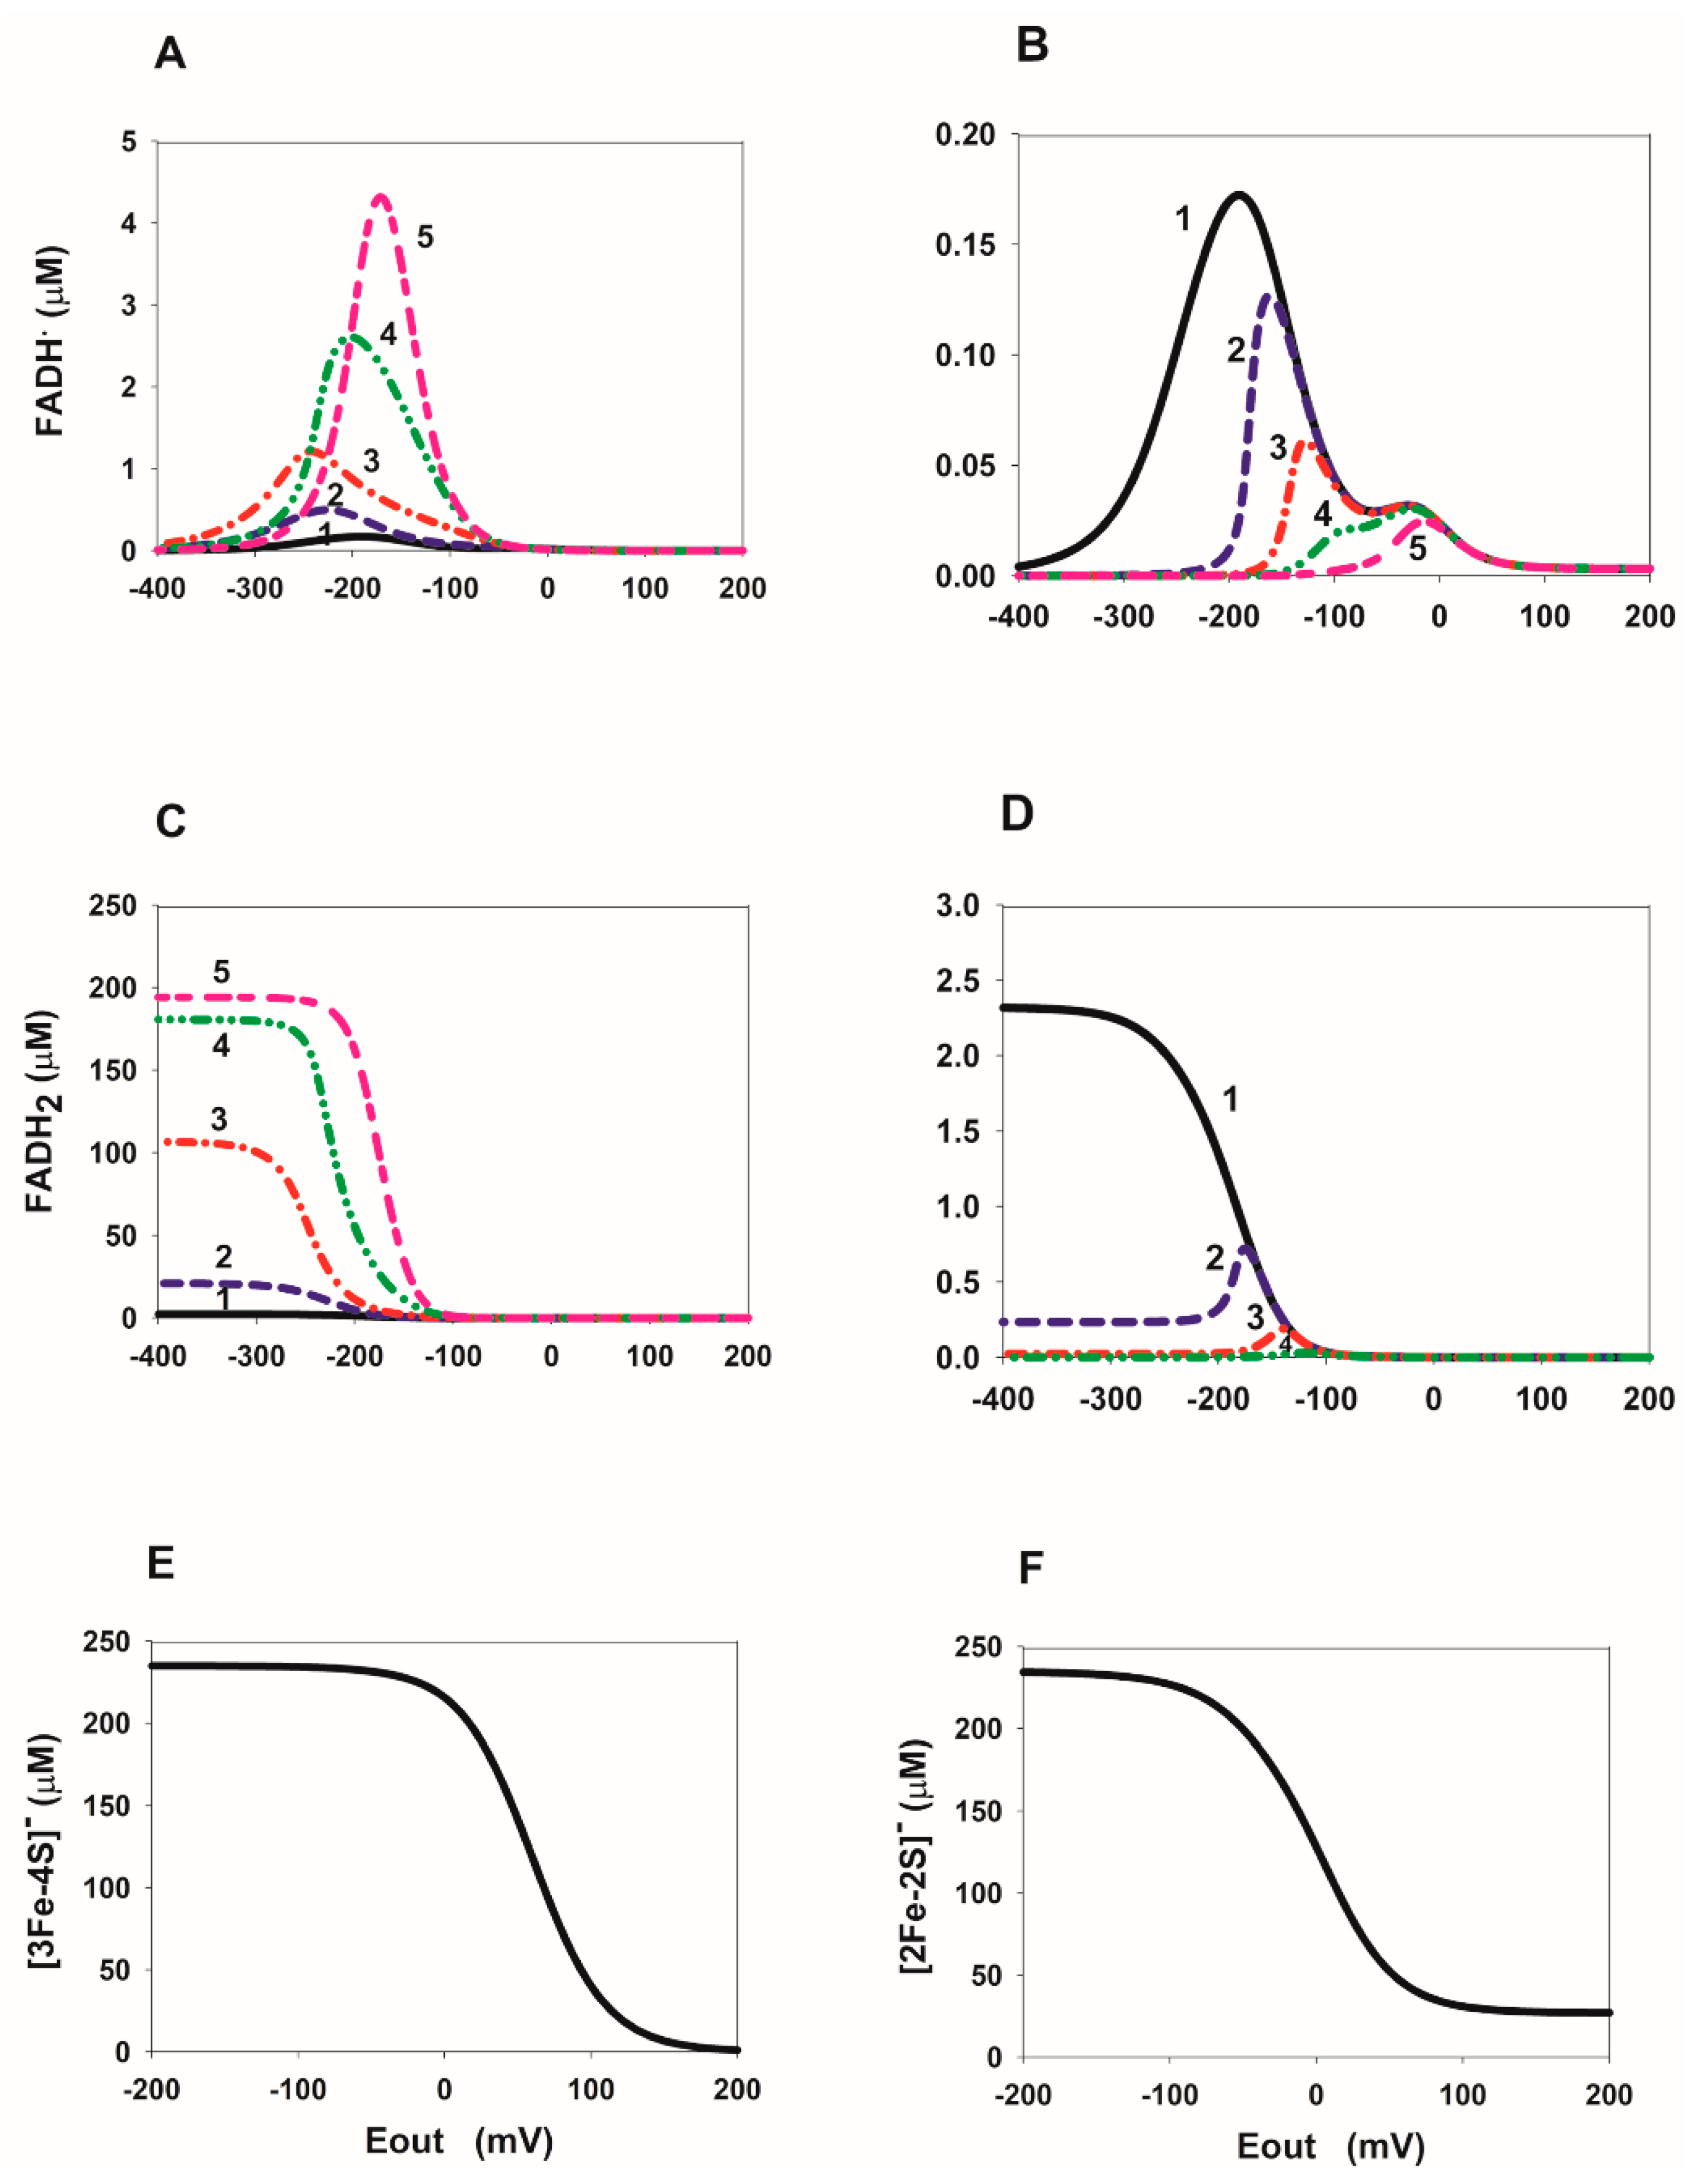
2.3. Computational Analysis of the ROS Production Rate in the SDHA/SDHB Subcomplex during Reverse Electron Transfer

Initially, it was analyzed dependence of the concentration of different redox centers of the SDHA/SDHB subcomplex in the reduced state on Eout. This is important for at least two reasons. First, we have to understand how the concentration of ROS-producing redox centers in the reduced state changes with a change in Eout. And secondly, it is necessary to know the interdependence of Eout and the concentration of the cluster [3Fe-4S] in the reduced state in order to extrapolate the Eout dependence of various rates shown in Figure 2, Figure 3, Figure 4, Figure 5 and Figure 6 on the dependence of the same rates on the concentration of the reduced cluster [3Fe-4S]. Then we will be able to predict the possibility of achieving a tunnel effect in real physiological conditions.
The Eout dependence of the concentration of FADH and FADH2, as well as the cluster [3Fe-4S] in the reduced state is shown in Figure 7. These redox centers were previously proposed [10,11,12] as the main ROS generators in the subcomplex SDHA/SDHB of SDH. As can be seen from the results presented in Figure 7, only changes in the concentration of FADH on Eout have nonmonotonic dependence (Figure 7A,B). Moreover, it is interesting that these nonmonotonic changes are only at a simultaneous decrease in the rate constants, k14 and k16, of succinate dissociation from reduced FAD forms (Figure 7B) can have the experimentally observed values of the threshold potential of about −60 [7] or −80 [2] mV. It is important to note that the concentration of FADH and FADH2 decreases with a decrease in the rate of release of succinate from the active center, that is, with a decrease in the equilibrium constants Keq14 and Keq16 (Figure 7B,D). It should also be noted an important property of the dependence of the concentration of the reduced cluster [3Fe-4S], [3Fe-4S], on Eout (Figure 7E). The concentration of [3Fe-4S] reaches values close to the maximal value of 235 µM already at Eout about −60 mV. This means that the “tunnel-diode” behavior in reverse quinol-fumarate reductase direction observed experimentally at −60 mV is possible only with maximal [3Fe-4S] cluster reduction, which is apparently difficult to achieve under physiological conditions. At the same time, the dependence of the concentration of the reduced cluster [2Fe-2S] on Eout (Figure 7F) is much weaker and reaches a maximum value of 235 µM at values of Eout about −200 mV. Net reversal of the mammalian SDH complex has been considered thermodynamically unfavorable because the standard reduction potential of ubiquinone (UQ) is slightly greater than that of fumarate [7]. However, because the reduction potential of UQ and fumarate are very close to each other (~10 mV apart), it was shown that UQH2 accumulation drives the net reversal of the SDH complex in mammalian cells upon suppression of O2 reduction [3].
The Eout dependence of the stationary rates of ROS production is presented in Figure 8. The total stationary rate of H2O2 production, VH2O2, was computed as the rate of H2O2 release from the mitochondrial matrix to the cytosol, V22, that equal to the summary rate of H2O2 production by FADH2, V17, and dismutation of O2, V21, in the matrix at the steady state (see Explicit functions in Mathematical model in Supplementary Materials). Values of the catalytic constants of ROS formation by different redox centers in the subcomplex SDHA/SDHB were taken from our previous computational model of CII in the forward succinate-quinone oxidoreductase (SQR) direction [13]. That model was calibrated by fitting the computer-simulated results to experimental data obtained on submitochondrial particles prepared from bovine [14] and rat heart [11] mitochondria upon inhibition of the Q-binding site by atpenin A5 and Complex III (CIII) by myxothiazol, respectively. It was shown [13] that only reduced flavin adenine dinucleotide (FADH2) in the unoccupied dicarboxylate state and flavin semiquinone radical (FADH) feature the experimentally observed bell-shaped dependence of the rate of ROS production on the succinate concentration upon inhibition of CIII or Q-binding site of CII, i.e., suppression of SQR activity. At the same time, the maximal rate of ROS production was about 1000 pmol/min/mg mitochondrial protein.
As we noted in Supplementary Materials in the section “Mathematical model. Dimension of local and whole mitochondrial concentration and rates. of this work, in order to compare computer-simulated rates of ROS production presented in Figure 8 in μM/s with experimentally observed rates expressed in pmol/min/mg protein the computer-simulated rates should be multiplied by a factor of 220, i.e., 1 μM/s = 220 pmol/min/mg mitochondrial protein. As the simulation results show, only a simultaneous decrease in equilibrium constants Keq10 and Keq12 of binding of fumarate to the dicarboxylate binding site upon FAD reduction due to a decrease in kon rate constants, k10 and k12, (Figure 8A) can result in very high rates of ROS production more than 1000 pmol/min/mg mitochondrial protein. That is clear because the decrease in the rate constants k10 and k12 results in an increase in the concentration of the major ROS-producing redox centers FADH and FADH2. However, our preliminary analysis shows that a decrease in the rate constants of fumarate binding to the dicarboxylate binding site upon FAD reduction, k10 and k12, is unlikely to account for experimentally observed values of the threshold potential during the “tunnel-diode” behavior and should not be considered as a possible high rate of ROS production at reverse SDH activity. All other changes in the rate constants of binding or release of succinate/fumarate have a small effect on the rate of ROS production by the subcomplex SDHA/SDHB in the reverse direction of SDH (Figure 8B–D). Thus, a decrease in the rate of succinate release from the active center during the reduction in FAD to FADH2 that quantitatively explains the experimentally observed tunnel-diode behavior in SDH from the beef heart [2] and Escherichia coli [7] mitochondria results in a very low rate of ROS production in the reverse direction of SDH (Figure 8C,D) when FADH and FADH2 are proposed as the major ROS producing redox centers.
However, it should be pointed out the recent work [12] in which it was shown that in the absence of respiratory chain inhibitors, the model analysis revealed the [3Fe-4S] iron-sulfur cluster as the primary O2 source. In this case, taking into account the very high concentration of [3Fe-4S] at relatively small values of Eout as shown in Figure 8E, it is very likely to expect a high rate of ROS production by this cluster [3Fe-4S] of SDH during a “tunnel-diode” behavior in reverse quinol-fumarate reductase direction in the absence of respiratory chain inhibitors. Thus, real changes in the rate of ROS production by the subcomplex SDHA/SDHB in the reverse direction of SDH during hypoxia/anoxia, that is, during ischemia, depends on the real experimental condition.

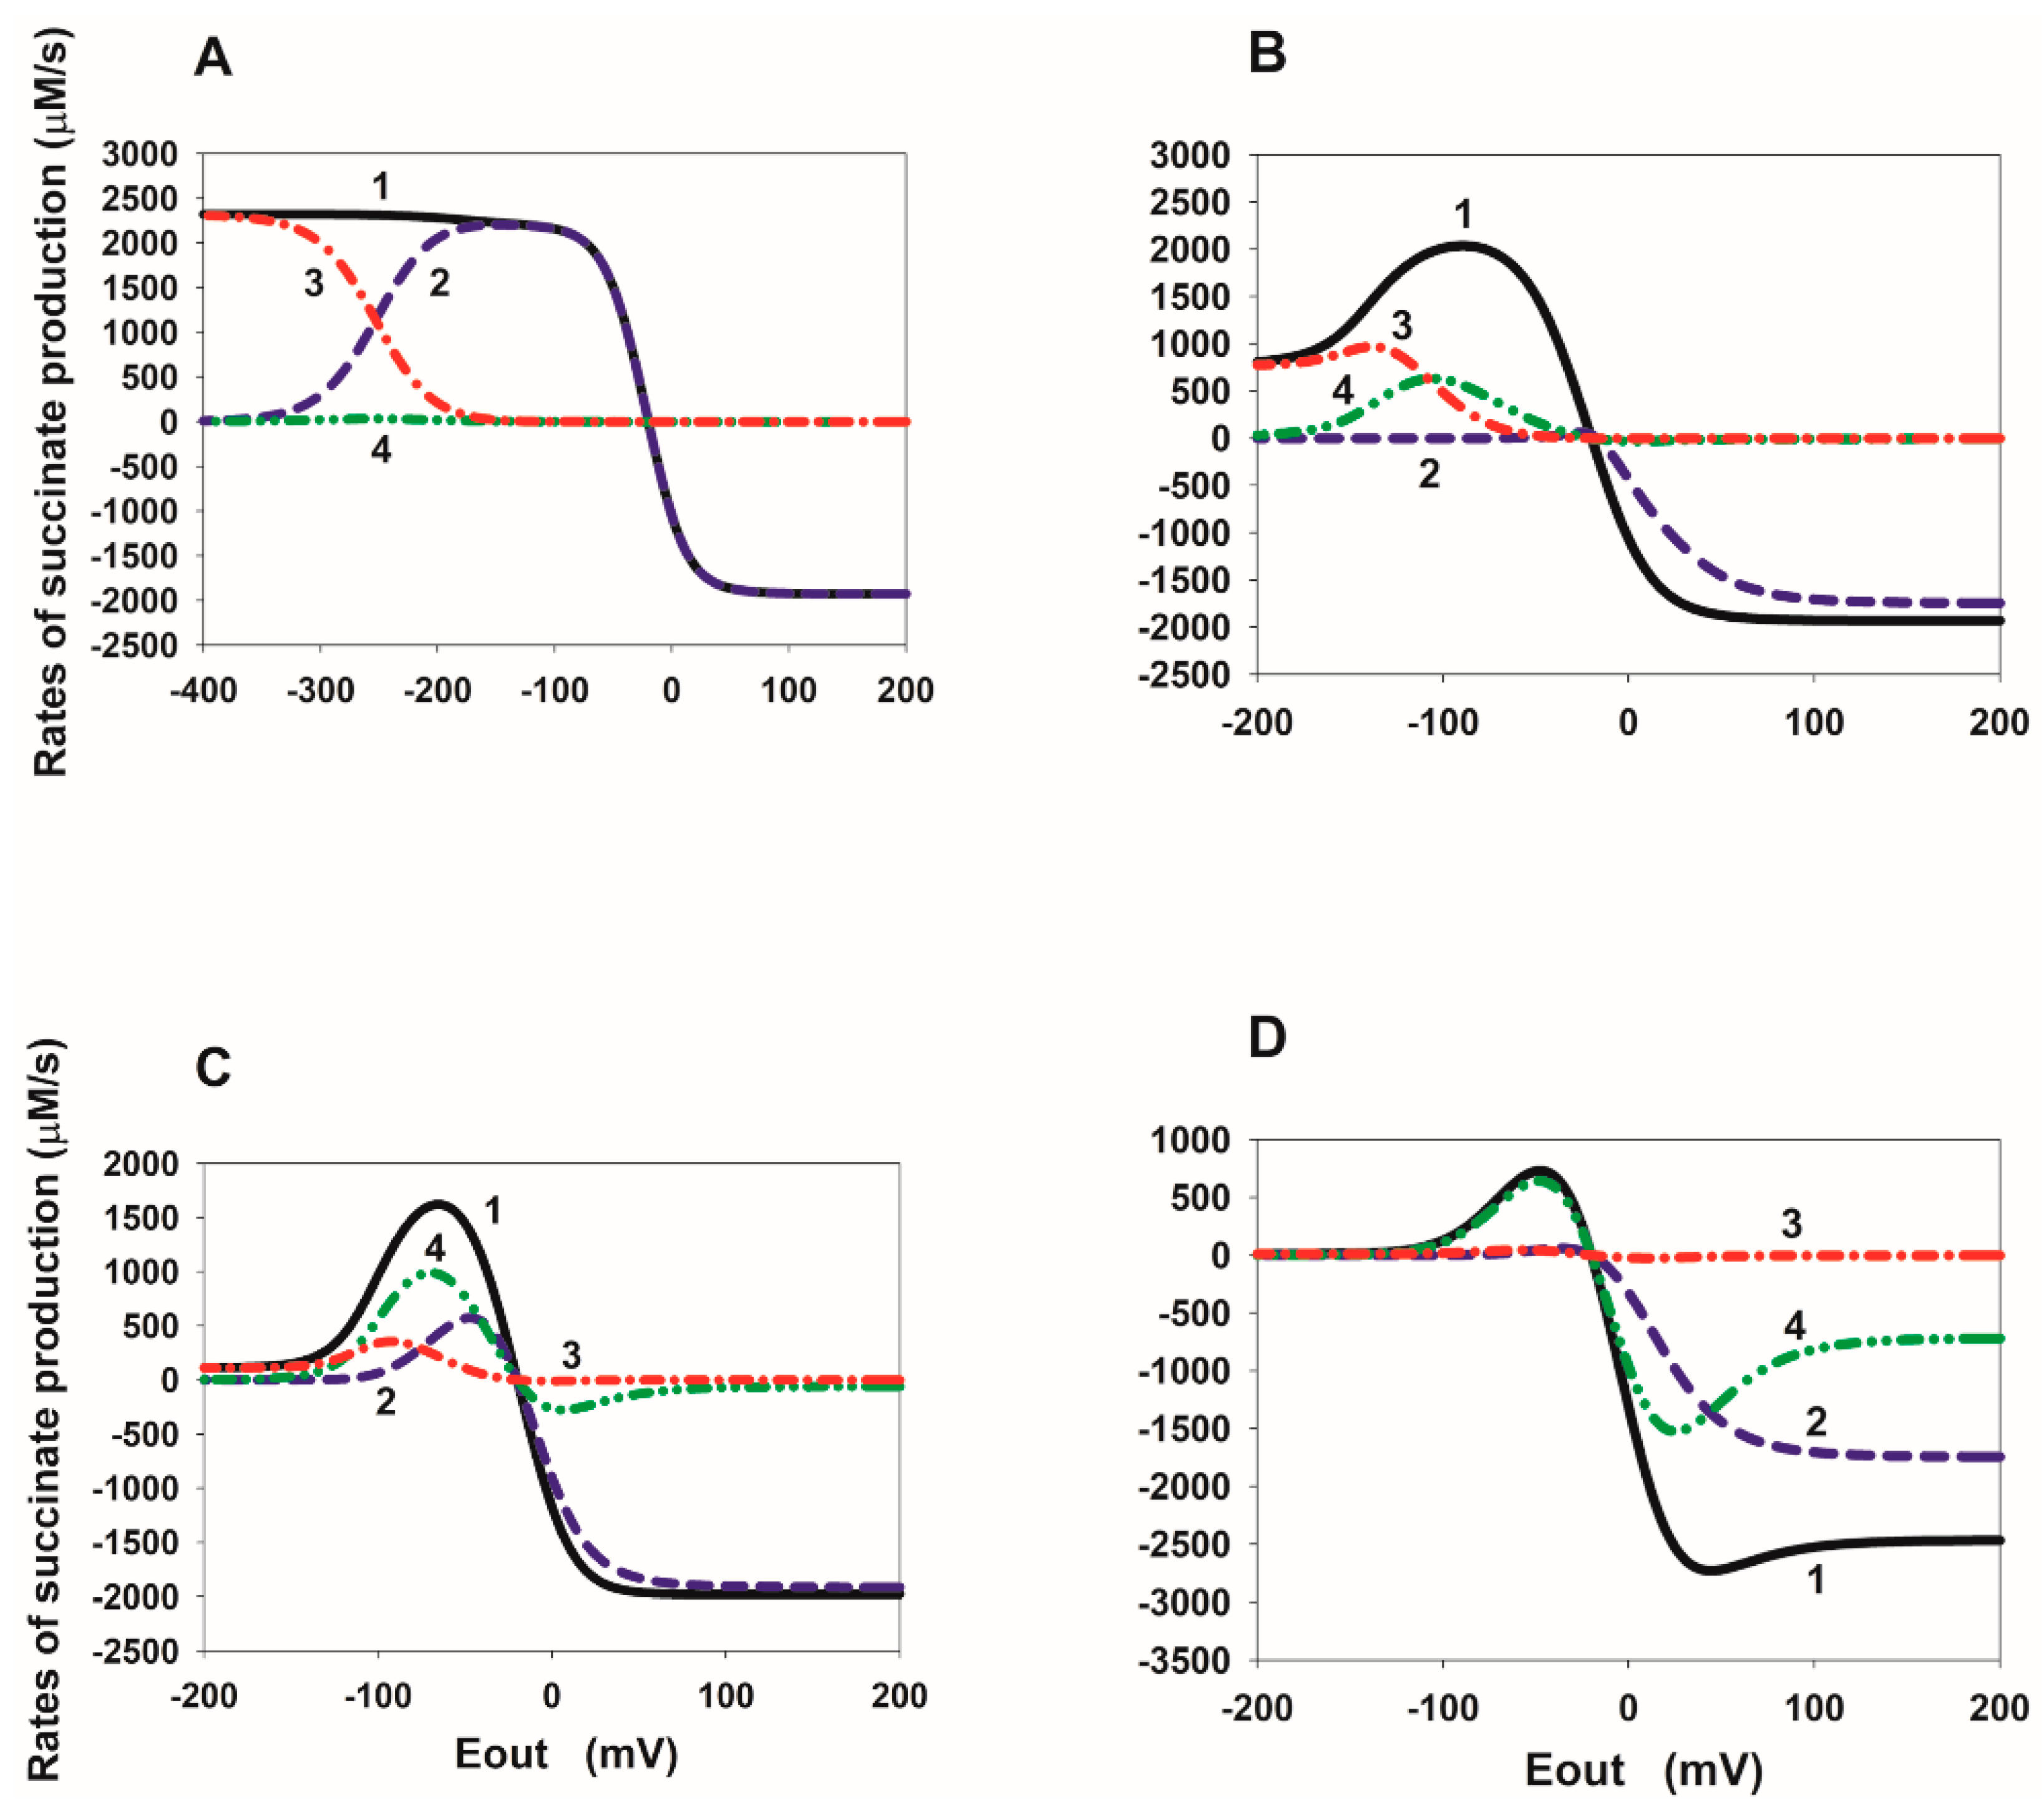
2.4. Dependence of the Rate of Succinate Production on the Fumarate Concentration in SDH

Computer-simulated dependencies of the stationary rates of succinate production in the reverse direction of SDH on the fumarate concentration at different values of the electrode potential Eout are presented in Figure 9A–D. Figures A–D differ in the values of the equilibrium constants Keq13, Keq14, and Keq16, which change due to a decrease in the rate constants of succinate release from the active center k14 and k16 from high control values (Figure 9A) to very small values (Figure 9D) when electron transfer is accelerated in the opposite direction. As can be seen from Figure 9, the dependence of the total succinate generation rate on the fumarate concentration has the usual hyperbolic character for any values of Eout and equilibrium constants Keq13, Keq14, and Keq16. At the same time, with a decrease in the values of the rate constants k14 and k16, the maximum rate of succinate production begins to decrease when the negative values of Eout exceed some threshold values (about −200 mV in Figure 9B), which the less in absolute value (about −150 and −100 mV), the less the rate constants of succinate release from the active center in Figure 9C,D, respectively.

3. Methods and Models

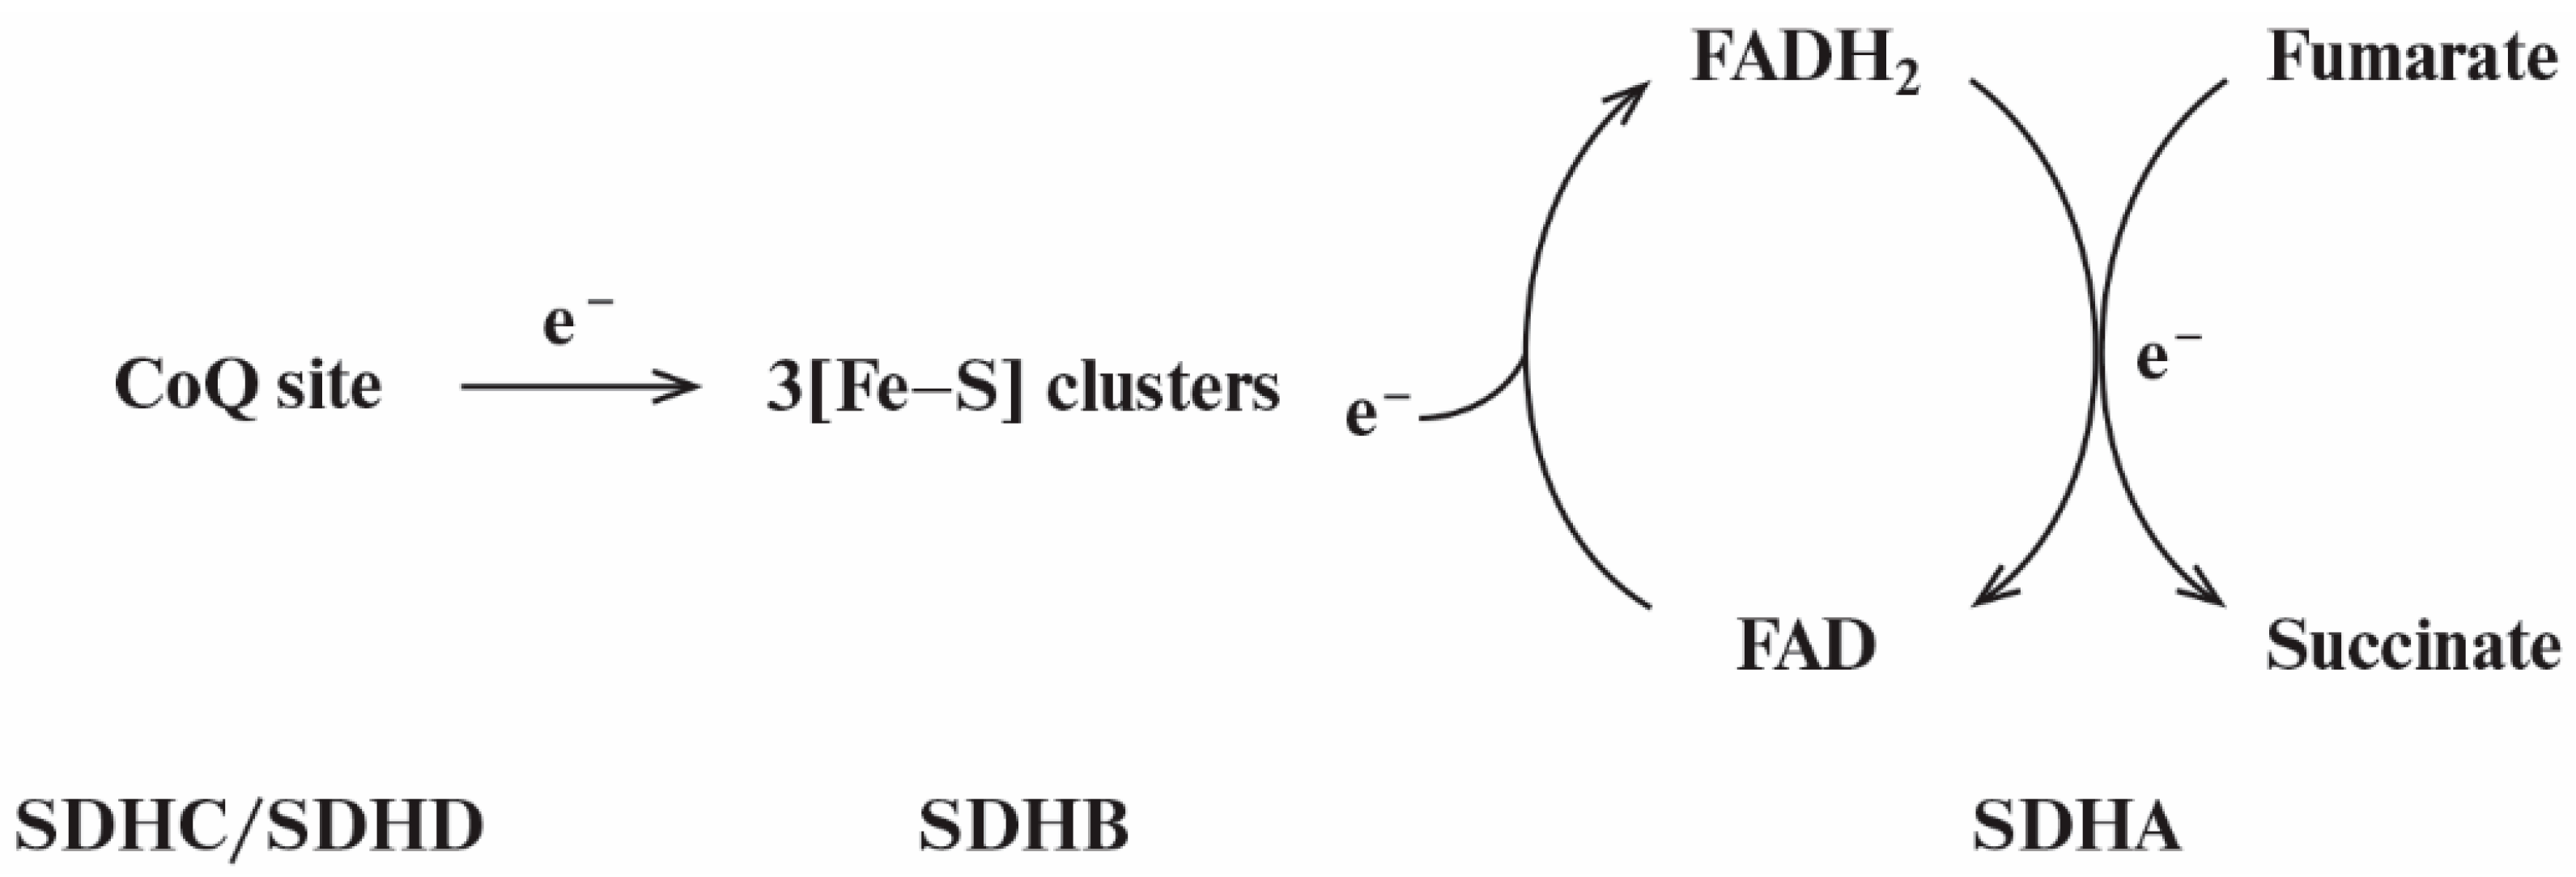
3.1. Kinetic Model of Reverse Electron Transfer in SDHA/SDHB Subunits of SDH

A kinetic scheme of reverse electron transfer and O2/H2O2 production underlying a mechanistic computational model of SDH activity in the reverse direction (fumarate reduction) in subunits SDHA and SDHB is presented in Figure 10. This kinetic scheme includes the following redox centers: (a) three iron-sulfur clusters: [2Fe-2S], [4Fe-4S], and [3Fe-4S]) located in SDHB subunit (Figure 10A) that transfer electrons one at a time to produce succinate in the SDHA subunit; (b) flavin adenine dinucleotide, FAD, located in SDHA subunit (Figure 10B).
Reverse electron transfer reactions in the SDHA/SDHB subunits of SDH include both the mainstream electron pathway from [3Fe-4S] cluster to fumarate and bypass reactions resulting in O2/H2O2 formation. These bypass reactions are marked in red in the kinetic scheme (Figure 10C).
This scheme is supported by the numerous literature data on electron transfer pathways between different redox centers of SDH [10,11,15,16].
The entire reaction network of electron transfer and O2/H2O2 production corresponding to this kinetic scheme in Figure 10 consists of 22 reactions that are described in detail in Table 1. Midpoint redox potentials, rate constants, and concentrations are taken from the experimental data (see Table 2 and references therein).
The reverse electron transfer in the soluble subcomplex SDHA/SDHB begins with the reduction in the cluster [3Fe-4S] (reaction 1) in the SDHB subunit with subsequent single electron transfer from the [3Fe-4S] cluster through [4Fe-4S] iron-sulfur center (reaction 2) to the cluster [2Fe-2S] (reaction 3) as shown in Figure 10A. The initial reduction in the cluster [3Fe-4S] (reaction 1) can be carried out by various electron donors, the nature of which depends on experimental conditions. In physiological conditions, electrons in reaction 1 are exchanged with the quinone pool. A detailed kinetic scheme of the exchange of the first and second electrons between the [3Fe-4S] cluster and the quinone pool in CII is presented in work [1]. In voltammetry experiments [2,7], electrons are exchanged directly between SDH and a graphite electrode. The rate of this exchange is controlled by the electrode potential (Eout) and is considered in detail in Table 1 and Table 2.
Figure 10B presents a kinetic scheme of chemical reactions of the reversible oxidoreduction of succinate, fumarate, and FAD, catalyzed by the SDH flavoprotein subunit A (SDHA). These reactions involve binding/dissociation of fumarate/succinate to/from the dicarboxylate binding site of the SDHA subunit as well as a single electron transfer from the iron-sulfur cluster [2Fe-2S] of the hydrophilic SDHB subunit to FAD in the SDHA subunit. Reactions of the reactive oxygen species formation in the soluble subcomplex SDHA/SDHB of SDH are presented in Figure 10C.
The reduction in fumarate to succinate in the flavoprotein subunit SDHA shown in Figure 10B, can occur via various alternative pathways. Fumarate can first bind to the dicarboxylate binding site of SDH when FAD is oxidized (reaction 4), followed by the transfer of the first (reaction 5) and second (reaction 6) electrons from the cluster [2Fe-2S] to FAD with the formation of the complexes FADH.fum and FADH2.fum, respectively. In reaction 7, fumarate is reduced to succinate with simultaneous oxidation of FADH2 to FAD. Then, in reaction 8, the FAD. suc complex dissociates with the release of succinate.
In another pathway of reducing fumarate to succinate, FAD in the unoccupied dicarboxylate state is sequentially reduced first to FADH in reaction 9 and then to FADH2 in reaction 11 receiving the first and second electrons, respectively, from the cluster [2Fe-2S]. In this case, fumarate can bind to the active site when FAD is in FADH (reaction 10) or FADH2 (reaction 12) state, respectively. After that, fumarate reduction to succinate and succinate release occur as well as in the previous pathway that is in reactions 6–8 or 7, 8.
In addition, reactions 13–16 represent the third pathway of two electrons transfer from the cluster [2Fe-2S] to the FAD and the release of succinate when succinate is initially bound to the active center of SDH.
These three pathways of formation of succinate from fumarate presented in Figure 2B include 4 thermodynamic cycles in which the initial and final states are identical (reactions 4–8; 6, 10–12; 8, 9, 13, 14; 7, 12, 13, 15, 16). Therefore, the equilibrium constants of the reactions along any cycle must satisfy so-called “detailed balance” relationships [8]. These detailed balance relations require the product of the equilibrium constants along a cycle to be equal to 1, as at equilibrium, the net flux through any cycle vanishes. Therefore, such relations decrease the number of independent rate constants in a kinetic model and imply that when any one of the equilibrium constants in any cycle changes, other constants in this cycle should automatically change.
The restrictions on the kinetic constants of the reactions presented in Figure 10B are the following
(1)
Keq4 ∙ Keq5 ∙ Keq6 ∙Keq7 ∙ Keq8 = 1;
(2)
Keq6 ∙ Keq10/(Keq11 ∙ Keq12) = 1;
(3)
Keq8 ∙ Keq9/(Keq13 ∙ Keq14) = 1;
(4)
Keq7 ∙ Keq12 ∙ Keq13 ∙Keq15 ∙ Keq16 = 1.
Potential redox centers of reactive oxygen species (ROS) generation in the soluble subcomplex SDHA/SDHB are FADH, FADH2, and [3Fe-4S] are presented in Figure 10C. These redox centers were previously proposed [10,11,12] as the main ROS generators in the subcomplex SDHA/SDHB of SDH.
FADH2 can generate either H2O2 in reaction 17 or superoxide O2· in reaction 18. The FADH radical can generate only superoxide O2· in reaction 19. The [3Fe-4S] cluster generates superoxide in reaction 20. In addition, intramitochondrial superoxide anion dismutation is represented by reaction 21.

3.2. Computational Model of Reverse Electron Transfer in SDHA/SDHB Subunits of SDH. Mathematical Model

A computational model consisting of 13 ordinary differential equations (ODEs) for the kinetic scheme presented in Figure 2, plus 4 moiety conservation equations, was derived from the reaction networks using the law of mass action and Michaelis (more exactly: Henri-Michaelis-Menten [25]) equation for all 22 kinetic processes. The models were implemented in DBSolve Optimum software available at the website http://insysbio.ru, accessed on 6 December 2022. The details of the mathematical model describing oxidized and reduced states of different carriers and electron flow through SDHA/SDHB subunits of SDH are presented in Supplementary Materials. Values of model parameters, rate constants, and concentration of different electron carriers were taken from experimental data in the literature on thermodynamics and kinetics of electron transfer in CII of the respiratory chain (Table 1 and Table 2). Additionally, the model is presented in SBML format in a separate file: Markevich_Final Reverse Scheme SDHA-B.xml (Supporting information).

4. Conclusions

A mechanistic computational model of reverse electron transfer in the subcomplex SDHA/SDHB of SDH was developed to account for a “tunnel-diode” behavior in reverse quinol-fumarate reductase direction in the SDHA/SDHB subcomplex detected in the voltammetry studies about three decades ago [2]. The model consists of a system of 13 ordinary differential equations that describe the dependence of the rates of electron flows and succinate production in SDH on the electrode potential Eout. It was found that the “tunnel-diode” behavior in the SDHA/SDHB subcomplex of SDH, that is, a strong drop in the rate of fumarate reduction as the driving force is increased, is accounted for by a decrease in succinate release from the active site of SDH during reduction in flavin adenine dinucleotide, FAD, to FADH2. In particular, the model simulation predicts that experimentally observed threshold values of the electrode potential of about −60 [7] or −80 [2] mV can be explained quantitatively by a decrease in the rate constants of succinate release, k14, and k16, from the control value of 10 s−1 (curve 1 in Figure 2C) to k14 = k16 = 10−2 s−1 (curve 4 in Figure 2C).
It is important to emphasize that a decrease in dissociation constants of succinate from the active site is accompanied by a simultaneous shift of equilibrium from FAD to FADH· according to the “detailed balance” relations [8] in thermodynamic cycles of succinate formation and release as we noted in Section 3.1. “Eout dependency of the total rate of reverse electron transfer in SDH.” This is surprisingly consistent with the experimentally observed [9] strong increase in the midpoint redox potential of the FAD/FADH· pair when succinate binds to SDH.
Computational analysis of ROS production in the SDHA/SDHB subcomplex of SDH during the reverse quinol-fumarate reductase activity predicts that the rate of ROS production decreases at a decrease in the rate of succinate release from the active site of SDH when FADH and FADH2 are proposed as the major ROS producing redox centers. The concentration of FADH and FADH2 decreases with a decrease in the equilibrium constants Keq14 and Keq16 as shown in Figure 7B,D. However, the concentration of the reduced cluster [3Fe-4S] of SDH is maximal during a “tunnel-diode” behavior in reverse quinol-fumarate reductase direction, so it is very likely to expect a high rate of ROS production by this cluster if [3Fe-4S] is the primary O2 source redox center in the absence of respiratory chain inhibitors as proposed in [12].
As to the participation of reverse electron transfer in SDH in ischemic succinate accumulation, it seems that it depends on real physiological conditions since SDH can be a major succinate source in ischemic in some cases [4]. However, sometimes ischemic succinate is generated by canonical Krebs cycle activity mostly from α-ketoglutarate and upstream metabolites rather than by mitochondrial CII reversal [6]. Our computational analysis predicts that a “tunnel-diode” behavior in the reverse quinol-fumarate reductase direction is observed only at the maximal reduction in the [3Fe-4S] cluster. So, it is unlikely that a tunnel effect can block ischemic succinate accumulation, as proposed in the review [5]. It seems more likely, that complex I and dihydroorotate dehydrogenase can support reverse electron transfer in SDH when oxygen is not available as the terminal electron acceptor of the respiratory chain, as shown in [3].

Supplementary Materials

The following supporting information can be downloaded at: https://www.mdpi.com/article/10.3390/ijms232415596/s1, References [26,27,28,29] are cited in the supplementary materials.

Author Contributions

N.I.M. conceived and supervised the study. L.N.M. and N.I.M. performed computations. N.I.M. wrote this report. All authors have read and agreed to the published version of the manuscript.

Funding

This research did not receive any specific grant from funding agencies in the public, commercial, or not-for-profit sectors. The work was carried out with budget funding under the State assignment of the Institute of Theoretical and Experimental Biophysics of the Russian Academy of Sciences (ITEB RAS) No. 075-01027-22-00.

Institutional Review Board Statement

Not applicable.

Informed Consent Statement

Not applicable.

Data Availability Statement

Not applicable.

Acknowledgments

We thank M. N. Chernyaeva for preprocessing the computational results.

Conflicts of Interest

The authors declare no conflict of interest.

Abbreviations

SDH: succinate dehydrogenase; ROS, reactive oxygen species; CII, respiratory Complex II; ETC, electron transport chain; FAD, flavin adenine dinucleotide; SQR, suc-cinate CoQ oxidoreductase; QFR, quinol-fumarate reductase.

References

  1. Markevich, N.I.; Galimova, M.H.; Markevich, L.N. Hysteresis and bistability in the succinate-CoQ reductase activity and reactive oxygen species production in the mitochondrial respiratory complex II. Redox Biol. 2020, 37, 101630. [Google Scholar] [CrossRef] [PubMed]
  2. Sucheta, A.; Ackrell, B.A.; Cochran, B.; Armstrong, F.A. Diode-like behaviour of a mitochondrial electron-transport enzyme. Nature 1992, 356, 361–362. [Google Scholar] [CrossRef] [PubMed]
  3. Spinelli, J.B.; Rosen, P.C.; Sprenger, H.G.; Puszynska, A.M.; Mann, J.L.; Roessler, J.M.; Cangelosi, A.L.; Henne, A.; Condon, K.J.; Zhang, T.; et al. Fumarate is a terminal electron acceptor in the mammalian electron transport chain. Science 2021, 374, 1227–1237. [Google Scholar] [CrossRef] [PubMed]
  4. Chouchani, E.T.; Pell, V.R.; Gaude, E.; Aksentijević, D.; Sundier, S.Y.; Robb, E.L.; Logan, A.; Nadtochiy, S.M.; Ord, E.N.J.; Smith, A.C.; et al. Ischaemic accumulation of succinate controls reperfusion injury through mitochondrial ROS. Nature 2014, 515, 431–435. [Google Scholar] [CrossRef] [Green Version]
  5. Chinopoulos, C. Succinate in ischemia: Where does it come from? Int. J. Biochem. Cell Biol. 2019, 115, 105580. [Google Scholar] [CrossRef]
  6. Zhang, J.; Wang, Y.T.; Miller, J.H.; Day, M.M.; Munger, J.C.; Brookes, P.S. Accumulation of Succinate in Cardiac Ischemia Primarily Occurs via Canonical Krebs Cycle Activity. Cell Rep. 2018, 23, 2617–2628. [Google Scholar] [CrossRef] [Green Version]
  7. Pershad, H.R.; Hirst, J.; Cochran, B.; Ackrell, B.A.; Armstrong, F.A. Voltammetric studies of bidirectional catalytic electron transport in Escherichia coli succinate dehydrogenase: Comparison with the enzyme from beef heart mitochondria. Biochim. Biophys. Acta 1999, 1412, 262–272. [Google Scholar] [CrossRef] [Green Version]
  8. Hearon, J.Z. The kinetics of linear systems with special reference to periodic Reactions. Bull. Math. Biophys. 1953, 15, 121–141. [Google Scholar] [CrossRef]
  9. Bonomi, F.; Pagani, S.; Cerletti, P.; Giori, C. Modification of the Thermodynamic Properties of the Electron-Transferring Groups in Mitochondrial Succinate Dehydrogenase upon Binding of Succinate. Eur. J. Biochem. 1983, 134, 439–445. [Google Scholar] [CrossRef]
  10. Quinlan, C.L.; Orr, A.L.; Perevoshchikova, I.V.; Treberg, J.R.; Ackrell, B.A.; Brand, M.D. Mitochondrial complex II can generate reactive oxygen species at high rates in both the forward and reverse reaction. J. Biol. Chem. 2012, 287, 27255–27264. [Google Scholar] [CrossRef]
  11. Grivennikova, V.G.; Kozlovsky, V.S.; Vinogradov, A.D. Respiratory complex II: ROS production and the kinetics of ubiquinone reduction. Biochim. Biophys. Acta 2017, 1858, 109–117. [Google Scholar] [CrossRef] [PubMed]
  12. Manhas, N.; Duong, Q.V.; Lee, P.; Richardson, J.; Robertson, J.D.; Moxley, M.A.; Bazil, J.N. Computationally modeling mammalian succinate dehydrogenase kinetics identifies the origins and primary determinants of ROS production. J. Biol. Chem. 2020, 295, 15262–15279. [Google Scholar] [CrossRef] [PubMed]
  13. Markevich, N.I.; Markevich, L.N.; Hoek, J.B. Computational Modeling Analysis of Generation of Reactive Oxygen Species by Mitochondrial Assembled and Disintegrated Complex II. Front. Physiol. 2020, 11, 557721. [Google Scholar] [CrossRef] [PubMed]
  14. Siebels, I.; Dröse, S. Q-site inhibitor induced ROS production of mitochondrial complex II is attenuated by TCA cycle dicarboxylates. Biochim. Biophys. Acta 2013, 1827, 1156–1164. [Google Scholar] [CrossRef] [PubMed] [Green Version]
  15. Kotlyar, A.B.; Vinogradov, A.D. Interaction of the membrane-bound succinate dehydrogenase with substrate and competitive inhibitors. Biochim. Biophys. Acta 1984, 784, 24–34. [Google Scholar] [CrossRef] [PubMed]
  16. Maklashina, E.; Cecchini, G.; Dikanov, S.A. Defining a Direction: Electron Transfer and Catalysis in Escherichia Coli Complex II Enzymes. Biochim. Biophys. Acta 2013, 1827, 668–678. [Google Scholar] [CrossRef] [PubMed] [Green Version]
  17. Ohnishi, T.; Lim, J.; Winter, D.B.; King, T.E. Thermodynamic and EPR characteristics of a HiPIP-type iron–sulfur center in the succinate dehydrogenase of the respiratory chain. J. Biol. Chem. 1976, 251, 2105–2109. [Google Scholar] [CrossRef]
  18. Ohnishi, T.; Salerno, J.C. Thermodynamic and EPR characteristics of two ferredoxin-type iron-sulfur centers in the succinate-ubiquinone reductase segment of the respiratory chain. J. Biol. Chem. 1976, 251, 2094–2104. [Google Scholar] [CrossRef]
  19. Ohnishi, T.; King, T.E.; Salerno, J.C.; Blum, H.; Bowyer, J.R.; Maida, T. Thermodynamic and electron paramagnetic resonance characterization of flavin in succinate dehydrogenase. J. Biol. Chem. 1981, 256, 5577–5582. [Google Scholar] [CrossRef]
  20. Murphy, M.P. How mitochondria produce reactive oxygen species. Biochem. J. 2009, 417, 1–13. [Google Scholar] [CrossRef]
  21. Markevich, N.I.; Hoek, J.B. Computational modeling analysis of mitochondrial superoxide production under varying substrate conditions and upon inhibition of different segments of the electron transport chain. Biochim. Biophys. Acta 2015, 1847, 656–679. [Google Scholar] [CrossRef] [PubMed] [Green Version]
  22. Markevich, N.I.; Hoek, J.B. Computational modeling analysis of acute and chronic ethanol- induced oxidative stress. Math. Biol. Bioinformat. 2014, 9, 63–88. [Google Scholar]
  23. Jin, Z.Q.; Zhou, H.Z.; Cecchini, G.; Gray, M.O.; Karliner, J.S. MnSOD in mouse heart:Acute responses ischemic preconditioning and ischemia–reperfusion injury. Am. J. Physiol. Heart Circ. Physiol. 2005, 288, H2986–H2994. [Google Scholar] [CrossRef] [PubMed] [Green Version]
  24. Wojtovich, A.P.; Nehrke, K.W.; Brookes, P.S. The mitochondrial complex II and ATP- sensitive potassium channel interaction: Quantitation of the channel in heart mitochondria. Acta Biochim. 2010, 57, 431–434. [Google Scholar] [CrossRef]
  25. Deichmann, U.; Schuster, S.; Mazat, J.P.; Cornish-Bowden, A. Commemorating the 1913 Michaelis-Menten paper Die Kinetik der Invertinwirkung: Three perspectives. FEBS J. 2014, 281, 435–463. [Google Scholar] [CrossRef]
  26. Vinnakota, K.C.; Bassingthwaighte, J.B. Myocardial density and composition: A basis for calculating intracellular metabolite concentrations. Am. J. Physiol. Heart Circ. Physiol. 2004, 286, H1742–H1749. [Google Scholar] [CrossRef] [Green Version]
  27. Hackenbrock, C.R.; Chazotte, B.; Gupte, S.S. The random collision model and a critical assessment of diffusion and collision in mitochondrial electron transport. J. Bioenerg. Biomembr. 1986, 18, 331–368. [Google Scholar] [CrossRef]
  28. Wu, F.; Yang, F.; Vinnakota, K.C.; Beard, D.A. Computer modeling of mitochondrial tricarboxylic acid cycle, oxidative phosphorylation, metabolite transport, and electrophysiology. J. Biol. Chem. 2007, 282, 24525–24537. [Google Scholar] [CrossRef] [Green Version]
  29. Schwerzmann, K.; Cruz-Orive, L.M.; Eggman, R.; Sanger, A.; Weibel, E.R. Molecular architecture of the inner membrane of mitochondria from rat liver: A combined biochemical and stereological study. J. Cell. Biol. 1986, 102, 97–103. [Google Scholar] [CrossRef]
Figure 1. Simplified general scheme of reverse electron transfer in complex II from the CoQ site to the three [Fe-S] clusters located in SDHB subunit and further to the flavoprotein subunit SDHA.
Ijms 23 15596 g001
Figure 2. Computer simulated dependence of the steady-state rate of reverse electron transfer in SDH on the electrode potential Eout at changes in the rate constants of fumarate and succinate binding to the dicarboxylate binding site upon FAD reduction. (A) Simultaneous changes in equilibrium constants Keq10 and Keq12 of binding of fumarate to the dicarboxylate binding site upon FAD reduction due to a decrease in kon rate constants, k10 and k12. The values of the reverse koff rate constants k-10 and k-12 are assumed unchanged and equal to 50 s−1. Black solid curve (1) corresponds to k10 = k12 = 1 µM−1 s−1, Keq10 = Keq12 = 2∙10−2 µM−1; blue dashed curve (2)—k10 = k12 = 10−1 µM−1 s−1, Keq10 = Keq12 = 2∙10−3 µM−1; red dash-dot curve (3)—k10 = k12 = 10−2 µM−1 s−1, Keq10 = Keq12 = 2∙10−4 µM−1; green dash-dot-dot curve (4)—k10 = k12 = 10−3 µM−1 s−1, Keq10 = Keq12 = 2∙10−5 µM−1; pink short-long curve (5)—k10 = k12 = 10−4 µM−1 s−1, Keq10 = Keq12 = 2∙10−6 µM−1. (B) Simultaneous changes in equilibrium constants Keq10 and Keq12 due to an increase in koff rate constants, k-10 and k-12. The values of kon rate constants, k10 and k12, are assumed unchanged and equal to 1 µM−1 s−1. Black solid curve (1) corresponds to k-10 = k-12 = 50 s−1, Keq10 = Keq12 = 2∙10−2 µM−1; blue dashed curve (2)—k-10 = k-12 = 500 s−1, Keq10 = Keq12 = 2∙10−3 µM−1; red dash-dot curve (3)—k-10 = k-12 = 5∙103 s−1, Keq10 = Keq12 = 2∙10−4 µM−1; green dash-dot-dot curve (4)—k-10 = k-12 = 5∙104 s−1, Keq10 = Keq12 = 2∙10−5 µM−1. (C) Simultaneous changes in equilibrium constants Keq13, Keq14, and Keq16 that describes a decrease in the rate of dissociation of succinate from reduced FAD forms due to a decrease in the rate constants, k14 and k16. The values of the rate constants, k−14 and k−16, are assumed unchanged and equal to 0.04 µM−1 s−1. Black solid curve (1) corresponds to k14 = k16 = 10 s−1, Keq13 = 2.4∙10−4 µM−1, Keq14 = Keq16 = 250 µM; blue dashed curve (2)—k14 = k16 = 1 s−1, Keq13 = 2.4∙10−3 µM−1, Keq14 = Keq16 = 25 µM; red dash-dot curve (3)—k14 = k16 = 10−1 s−1, Keq13 = 2.4∙10−2 µM−1, Keq14 = Keq16 = 2.5 µM; green dash-dot-dot curve (4)—k14 = k16 = 10−2 s−1, Keq13 = 0.24 µM−1, Keq14 = Keq16 = 0.25 µM; pink short-long curve (5)—k14 = k16 = 10−3 s−1, Keq13 = 2.4 µM−1, Keq14 = Keq16 = 0.025 µM. (D) Simultaneous changes in equilibrium constants Keq13, Keq14, and Keq16 due to an increase in the rate constants k−14 and k−16. The values of the rate constants, k14 and k16, are assumed unchanged and equal to 10 s−1. Black solid curve (1) corresponds to k−14 = k−16 = 0.04 µM−1 s−1, Keq13 = 2.4∙10−4 µM−1, Keq14 = Keq16 = 250 µM; blue dashed curve (2)—k−14 = k−16 = 40 µM−1 s−1, Keq13 = 0.24 µM−1, Keq14 = Keq16 = 0.25 µM; red dash-dot curve (3)—k−14 = k−16 = 400 µM−1 s−1, Keq13 = 2.4 µM−1, Keq14 = Keq16 = 25∙10−3 µM; green dash-dot-dot curve (4)—k−14 = k−16 = 4∙103 µM−1 s−1, Keq13 = 24 µM−1, Keq14 = Keq16 = 25∙10−4 µM; pink short-long curve (5)—k−14 = k−16 = 4∙104 µM−1 s−1, Keq13 = 240 µM−1, Keq14 = Keq16 = 25∙10−5 µM. The total rate of reverse electron transfer (Vrev_tot) in SDH is computed as the sum of rates of oxidation of the cluster [2Fe-2S] in reactions 5, 6, 9, 11, 13, 15 and equal to Vrev_tot = V5 + V6 + V9 + V11 + V13 + V15. The concentration of fumarate and succinate is equal to 1000 and 50 µM, respectively.
Ijms 23 15596 g002
Figure 3. Computer simulated dependence of the steady-state rate of succinate production in SDH on the electrode potential Eout at different values of the rate constants of succinate release from the dicarboxylate binding site. The rates of succinate production in reactions 8, 14, and 16 were calculated under simultaneous changes in the values of equilibrium constant Keq13 due to proposed succinate-dependent changes in midpoint potential Em(FAD.suc/FADH.suc) compared to Em(FAD/FADH), as well as equilibrium constants Keq14 and Keq16 of the release of succinate from the active site upon FAD reduction due to a decrease in the rate constants, k14 and k16. (AD) Black solid curve (1) corresponds to the total rate of succinate production Vsuc_tot = V8 + V14 + V16; blue dashed curve (2)—V8; red dash-dot curve (3)—V16; green dash-dot-dot curve (4)—V14. All the parameter values for results presented in (AD) are the same as for curves (1–4) in Figure 3C. That is, values of k14, k16, Keq13, Keq14, and Keq16 for the results in (AD) are the same as for curve (1), (2), (3), (4) in Figure 2C, respectively, and presented in the Figure 2C caption.
Ijms 23 15596 g003
Figure 4. Computer simulated dependence of the steady-state rate of succinate production in SDH on the electrode potential Eout at different values of the rate constants of succinate binding to the dicarboxylate binding site. The rates of succinate production in reactions 8, 14, and 16 were calculated under a simultaneous increase in the values of equilibrium constant Keq13, as well as a decrease in equilibrium constants Keq14 and Keq16 of the release of succinate from the active site upon FAD reduction due to an increase in the rate constants k−14 and k−16. (AD) Black solid curve (1) corresponds to the total rate of succinate production Vsuc_tot = V8 + V14 + V16; blue dashed curve (2)—V8; red dash-dot curve (3)—V16; green dash-dot-dot curve (4)—V14. All the parameter values for results presented in (AD) are the same as for curves (1–4) in Figure 2D. That is, values of k14, k16, Keq13, Keq14, and Keq16 for the results in (AD) are the same as for curve (1), (2), (3), (4) in Figure 2D, respectively, and presented in the Figure 2D caption in the main text.
Ijms 23 15596 g004
Figure 5. Computer simulated dependence of the stationary rate of succinate production in SDH on the electrode potential Eout at different values of the rate constants of fumarate binding to the dicarboxylate binding site. The rates of succinate production in reactions 8, 14, and 16 were calculated under simultaneous decrease in the values of equilibrium constants Keq10 and Keq12 of binding of fumarate to the active site upon FAD reduction due to a decrease in kon rate constants, k10 and k12. (AD) Black solid curve (1) corresponds to the total rate of succinate production Vsuc = V8 + V14 + V16; blue dashed curve (2)—V8; red dash-dot curve (3)—V16; green dash-dot-dot curve (4)—V14. All the parameter values for results presented in (AD) are the same as for curves (1, 3–5) in Figure 2A. That is, values of k10, k12, Keq10, and Keq12 for the results in (AD) are the same as for curves (1), (3), (4), (5) in Figure 2A, respectively, and presented in the Figure 2A caption.
Ijms 23 15596 g005
Figure 6. Computer simulated dependence of the stationary rate of succinate production in SDH on the electrode potential Eout at different values of the rate constants of fumarate release from the dicarboxylate binding site. The rates of succinate production in reactions 8, 14, and 16 were calculated under simultaneous decrease in the values of equilibrium constants Keq10 and Keq12 due to an increase in koff rate constants, k-10 and k-12. The values of kon rate constants, k10 and k12, are assumed unchanged and equal to 1 µM−1 s−1. (AD) Black solid curve (1) corresponds to the total rate of succinate production Vsuc = V8 + V14 + V16; blue dashed curve (2)—V8; red dash-dot curve (3)—V16; green dash-dot-dot curve (4)—V14. All the parameter values for results presented in (AD) are the same as for curves (1, 3–5) in Figure 2B in the main text. That is, values of k10, k12, Keq10, and Keq12 for the results in (AD) are the same as for curves (1), (3), (4), (5) in Figure 2B, respectively, and presented in the Figure 2B caption in the main text.
Ijms 23 15596 g006
Figure 7. Computer simulated dependence of the concentration of ROS generated redox centers FADH, FADH2, and clusters [3Fe-4S] and [2Fe-2S] in the reduced state in SDH on the electrode potential Eout at different values of the rate constants of fumarate and succinate binding to the dicarboxylate binding site upon FAD reduction. (A,C) A dependence of FADH (A) and FADH2 (C) concentration on Eout at a simultaneous decrease in kon rate constants, k10 and k12, binding of fumarate to the dicarboxylate binding site upon FAD reduction. In this case, the values of the reverse koff rate constants k-10 and k-12 are assumed unchanged and equal to 50 s−1. Black solid curve (1) corresponds to k10 = k12 = 1 µM−1 s−1, Keq10 = Keq12 = 2∙10−2 µM−1; blue dashed curve (2)—k10 = k12 = 10−1 µM−1 s−1, Keq10 = Keq12 = 2∙10−3 µM−1; red dash-dot curve (3)—k10 = k12 = 10−2 µM−1 s−1, Keq10 = Keq12 = 2∙10−4 µM−1; green dash-dot-dot curve (4)—k10 = k12 = 10−3 µM−1 s−1, Keq10 = Keq12 = 2∙10−5 µM−1; pink short-long curve (5)—k10 = k12 = 10−4 µM−1 s−1, Keq10 = Keq12 = 2∙10−6 µM−1. (B,D) A dependence of FADH (B) and FADH2 (D) concentration on Eout at a simultaneous decrease in the rate constants, k14 and k16, of succinate dissociation from reduced FAD forms. The values of the rate constants, k−14 and k−16 are assumed unchanged and equal to 0.04 µM−1 s−1. Black solid curve (1) corresponds to k14 = k16 = 10 s−1, Keq13 = 2.4∙10−4 µM−1, Keq14 = Keq16 = 250 µM; blue dashed curve (2)—k14 = k16 = 1 s−1, Keq13 = 2.4∙10−3 µM−1, Keq14 = Keq16 = 25 µM; red dash-dot curve (3)—k14 = k16 = 10−1 s−1, Keq13 = 2.4∙10−2 µM−1, Keq14 = Keq16 = 2.5 µM; green dash-dot-dot curve (4)—k14 = k16 = 10−2 s−1, Keq13 = 0.24 µM−1, Keq14 = Keq16 = 0.25 µM; pink short-long curve (5)—k14 = k16 = 10−3 s−1, Keq13 = 2.4 µM−1, Keq14 = Keq16 = 0.025 µM. (E,F) A dependence of the concentration of clusters [3Fe-4S] (E) and [2Fe-2S] (F) in the oxidized state in SDH on the electrode potential Eout.
Ijms 23 15596 g007
Figure 8. Computer simulated dependence of the total stationary rate of H2O2 production in SDH on the electrode potential Eout at different values of the rate constants of fumarate and succinate binding to the dicarboxylate binding site upon FAD reduction. All the parameter values for results presented in (AD) are the same as in Figure 2. That is, values of all parameters for the curves (1–5) in (AD) are the same as for curves with the same numbers presented in (AD) in Figure 2. (A) Simultaneous decrease in equilibrium constants Keq10 and Keq12 of binding of fumarate to the dicarboxylate binding site upon FAD reduction due to a decrease in kon rate constants, k10 and k12. In this case, the values of the reverse koff rate constants k-10 and k-12 are assumed unchanged and equal to 50 s−1. Parameter values for curves (1–5) are the same as for curves (1–5) in Figure 2A. (B) Simultaneous decrease in equilibrium constants Keq10 and Keq12 upon FAD reduction due to an increase in koff rate constants, k-10 and k-12. In this case, the values of kon rate constants, k10 and k12, are assumed unchanged and equal to 1 µM−1 s−1. Parameter values for curves (1–4) are the same as for curves (1–4) in Figure 2B. (C) Simultaneous changes in equilibrium constants Keq13, Keq14, and Keq16 describe a decrease in the rate of dissociation of succinate from reduced FAD forms due to a decrease in the rate constants, k14 and k16. The values of the rate constants, k−14 and k−16 are assumed unchanged and equal to 0.04 µM−1 s−1. Parameter values for curves (1–4) are the same as for curves (1–4) in Figure 2C. (D) Simultaneous changes in equilibrium constants Keq13, Keq14, and Keq16 due to an increase in the rate constants k−14 and k−16. The values of the rate constants, k14 and k16, are assumed unchanged and equal to 10 s−1. Parameter values for curves (1–5) are the same as for curves (1–5) in Figure 2D. The total rate of H2O2 production, VH2O2, was computed as the rate of H2O2 release from the mitochondrial matrix to the cytosol, V22, that equal to the summary rate of H2O2 production by FADH2, V17, and dismutation of O2, V21, in the matrix. The concentration of fumarate and succinate is equal to 1000 and 50 µM, respectively.
Ijms 23 15596 g008
Figure 9. Computer simulated dependence of the stationary rate of succinate production in SDH on the fumarate concentration at different values of the electrode potential Eout and rate constants of succinate release from the dicarboxylate binding site upon FAD reduction. (AD) Simultaneous changes in equilibrium constants Keq13, Keq14, and Keq16 describe a decrease in the rate of succinate dissociation from reduced FAD forms due to a decrease in the rate constants k14 and k16. The values of the rate constants, k−14 and k−16 are assumed unchanged and equal to 0.04 µM−1 s−1. Eout values for black solid curve curves (1) in all figures correspond to 0 mV; blue dashed curves (2) to −50 mV; red dash-dot curves (3) to −100 mV; green dash-dot-dot curves (4) to −150 mV; pink short-long curves (5) to −200 mV. Values of equilibrium constants Keq13, Keq14 and Keq16 and the rate constants, k14 and k16 are different for Figures (AD) and have the following values: (A) k14 = k16 = 10 s−1, Keq13 = 2.4∙10−4 µM−1, Keq14 = Keq16 = 250 µM; (B) k14 = k16 = 1 s−1, Keq13 = 2.4∙10−3 µM−1, Keq14 = Keq16 = 25 µM; (C) k14 = k16 = 10−1 s−1, Keq13 = 2.4∙10−2 µM−1, Keq14 = Keq16 = 2.5 µM; (D) k14 = k16 = 10−2 s−1, Keq13 = 0.24 µM−1, Keq14 = Keq16 = 0.25 µM. The succinate concentration is equal to 50 µM.
Ijms 23 15596 g009
Figure 10. Kinetic schemes of reverse electron transfer and formation of superoxide anion, O2, and hydrogen peroxide, H2O2, in the SDHA/SDHB subunits of succinate dehydrogenase (SDH). (A) Electron transfer through the three [Fe–S] clusters located in the SDHB subunit. (B) Electron transfer and the interconversion of succinate and fumarate in the flavoprotein subunit SDHA. (C) Reactions of O2 and H2O2 formation in the SDHA/SDHB subunits. The detailed reaction network is presented in Table 1 and Table 2.
Ijms 23 15596 g010aIjms 23 15596 g010b
Table 1. Reactions and rate equations in reverse electron transfer in SDHA/B subunits of SDH.
NoReactionRate Equation
1e + [3Fe-4S] = [3Fe-4S]V1 = k1 ∙ ([3Fe-4S] ∙ exp(-α ∙ F ∙ Eout/RT) − [3Fe-4S] ∙ exp((1-α) ∙ F ∙ Eout/RT)/Keq1)
2[4Fe-4S] + [3Fe-4S] = [4Fe-4S] + [3Fe-4S] V2 = k2 ∙ ([4Fe-4S] ∙ [3Fe-4S] − [4Fe-4S] ∙ [3Fe-4S]/Keq2)
3[2Fe-2S] + [4Fe-4S] = [2Fe-2S] + [4Fe-4S] V3 = k3 ∙ ([2Fe-2S] ∙ [4Fe-4S] − [2Fe-2S] ∙ [4Fe-4S]/Keq3)
4FAD + fum = FAD.fumV4 = k4 ∙ (FAD ∙ fum − FAD.fum/Keq4)
5FAD.fum + [2Fe-2S] + H + = FADH.fum + [2Fe-2S]V5 = k5 ∙ (FAD.fum ∙ [2Fe-2S] ∙ H + − FADH.fum ∙ [2Fe-2S]/Keq5)
6FADH.fum + [2Fe-2S] + H + = FADH2.fum + [2Fe-2S] V6 = k6 ∙ (FADH.fum ∙ [2Fe-2S] ∙ H + − FADH2.fum ∙ [2Fe-2S]/Keq6)
7FADH2.fum = FAD.suc V7 = k7 ∙ (FADH2.fum − FAD.suc/Keq7)
8FAD.suc = FAD + sucV8 = k9 ∙ (FAD.suc − FAD ∙ suc/Keq8)
9FAD + [2Fe-2S] + H + = FADH + [2Fe-2S] V9 = k9 ∙ (FAD ∙ [2Fe-2S] ∙ H + − FADH ∙ [2Fe-2S]/Keq9)
10FADH + fum = FADH.fumV10 = k10 ∙ (FADH ∙ fum − FADH.fum/Keq10)
11FADH + [2Fe-2S] + H + = FADH2 + [2Fe-2S] V11 = k11 ∙ (FADH ∙ [2Fe-2S] ∙ H + − FADH2 ∙ [2Fe-2S]/Keq11)
12FADH2 + fum = FADH2.fumV12 = k12 ∙ (FADH2 ∙ fum − FADH2.fum/Keq12)
13FAD.suc + [2Fe-2S] + H + = FADH.suc + [2Fe-2S] V13 = k13 ∙ (FAD.suc ∙ [2Fe-2S] ∙ H + − FADH.suc ∙ [2Fe-2S]/Keq13)
14FADH.suc = suc + FADHV14 = k14 ∙ (FADH.suc − FADH ∙ suc/Keq14)
15FADH.suc + [2Fe-2S] + H + = FADH2.suc + [2Fe-2S] V15 = k15 ∙ (FADH.suc ∙ [2Fe-2S] ∙ H + − FADH2.suc ∙ [2Fe-2S]/Keq15)
16FADH2.suc = suc + FADH2V16 = k16 ∙ (FADH2.suc − FADH2 ∙ suc/Keq16)
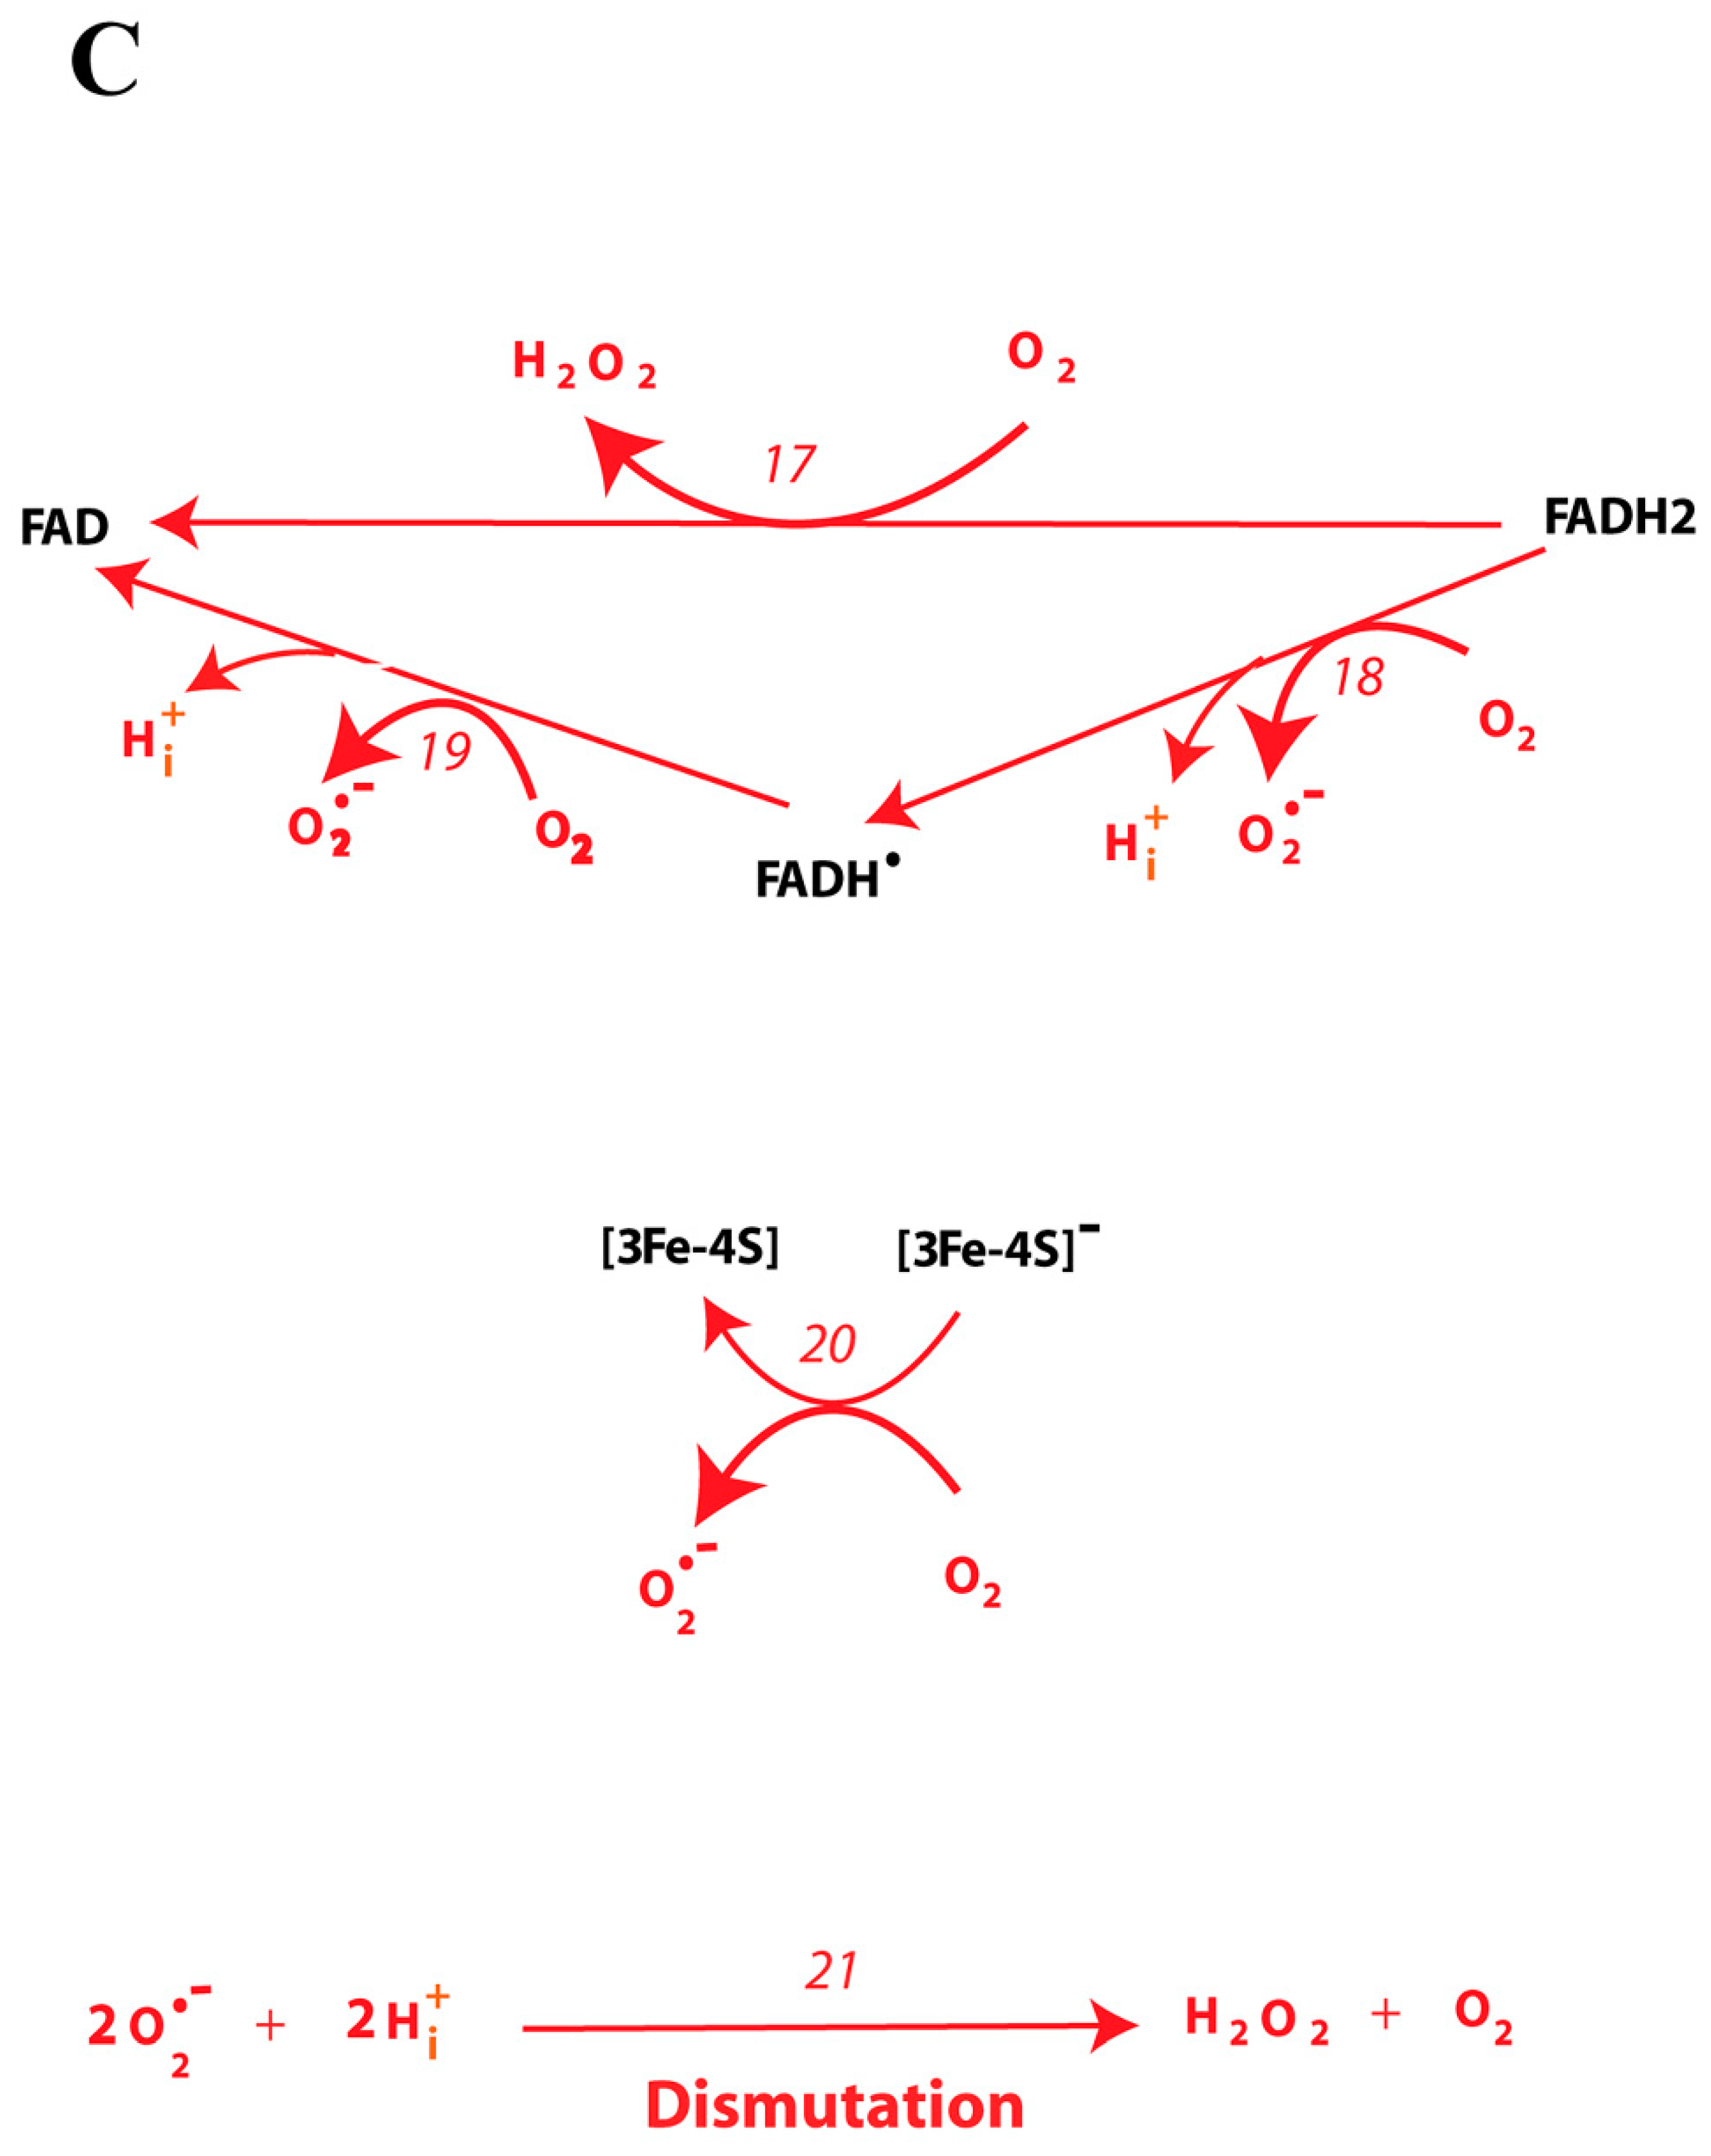
Hydrogen peroxide (H2O2) production by SDH
17FADH2 + O2 = FAD + H2O2V17 = k17 ∙ (FADH2 ∙ O2 − FAD ∙ H2O2/Keq17)
Superoxide anion (O2) production by the subcomplex SDHA/SDHB of SDH
18FADH2 + O2 = FADH + O2 + H +V18 = k18 ∙ (FADH2 ∙ O2 − FADH ∙ O2 ∙ H + /Keq18)
19FADH + O2 = FAD + O2 + H +V19 = k19 ∙ (FADH ∙ O2 − FAD ∙ O2 ∙ H + /Keq19)
20[3Fe-4S] + O2 = [3Fe-4S] + O2V20 = k20 ∙ ([3Fe-4S] ∙ O2 − [3Fe-4S] ∙ O2/Keq20)
Superoxide anion dismutation in the mitochondrial matrix
212 O2 + 2H + → O2 + H2O2V21 = Vmax21 ∙ O2/(Km21 + O2)
Release of hydrogen peroxide (H2O2) from the mitochondrial matrix to cytosol
22H2O2V22 = k22 ∙ H2O2
Table 2. Parameter values for the model.
Reaction
No
Midpoint Potential
Em = E, (mV)
Equilibrium Constant
Keq
kforwardOther ParametersReference
1E([3Fe-4S]) = 6011.0231∙103 s−1α = 0.5
α is a certain coefficient that varies from 0 to 1.
Eout—electrode potential.
F, R and T have a usual meaning.
[17] a
2E([4Fe-4S]) = −260
E([3Fe-4S]) = 60
2.78∙10−61∙104 µM−1·s−1pH = 7.4[17,18] a
3 E([2Fe-2S]) = 0
E([4Fe-4S]) = −260
3.29∙1041∙104 µM−1·s−1pH = 7.4[18] a
4 4.17∙10−3 µM−11 s−1 [15] b
5E(FAD/FADH) = −127
E([2Fe-2S]) = 0
0.03 e µM−11∙103 µM−2·s−1pH = 7
pH = 7.4
[18,19] a
6E(FADH/FADH2) = −31
E([2Fe-2S]) = 0
0.289 e µM−11∙103 µM−2·s−1pH = 7
pH = 7.4
[18,19] a
7 2778 d2.78∙106 s−1
8 10 µM0.5 s−1 [19] b
9E(FAD/FADH) = −127
E([2Fe-2S]) = 0
0.0061∙103 µM−2·s−1pH = 7
pH = 7.4
[18,19] a
10 0.02 µM−1103 s−1 [15] b
11E(FADH/FADH2) = −31
E([2Fe-2S]) = 0
0.289 µM−11∙103 µM−2·s−1pH = 7
pH = 7.4
[18,19] a
12 0.02 µM−1103 s−1 [15] b
13 E(FAD/FADH) = −127
E([2Fe-2S]) = 0
2.4∙10−4 e µM−11∙103 µM−2·s−1pH = 7
pH = 7.4
[18,19] a
14 250 µM10 s−1 [15] b
15E(FADH/FADH2) = −31
E([2Fe-2S]) = 0
0.289 e µM−11∙103 µM−2·s−1pH = 7
pH = 7.4
[18,19] a
16 250 µM10 s−1 [15] b
Hydrogen peroxide (H2O2) production by Complex II
17E(O2/H2O2) = 690
E(FAD/FADH2) = −79
5.2∙10260.01 µM−1·s−1pH = 7[19] a
Superoxide anion (O2) production by the subcomplex SDHA/SDHB of SDH
18E(O2/O2) = −160
E(FADH/FADH2) = −31
6∙10−30.01 µM−1·s−1pH = 7[20] a
[19] a
19E(O2/O2) = −160
E(FAD/FADH) = −127
0.2670.1 µM−1·s−1pH = 7
pH = 7.4
[20] a
[19] a
20E(O2/O2) = −160
E([3Fe-4S]) = 60
1.5∙10−41·10−3 µM−1·s−1pH = 7
pH = 7.4
[20] a
[17] a
Accompanying reactions in the matrix and inner membrane
Superoxide anion dismutation in the mitochondrial matrix
21 Vmax21 = 5.6∙104 µM·s−1 f
Km21 = 50 µM
[21] d
Efflux of hydrogen peroxide (H2O2) from the mitochondrial matrix to cytoplasm
22 30 s−1 [22] c
a The reference for the midpoint redox potential EM. b The reference for the equilibrium constant Keq. c The reference for the rate constant of direct reaction kforward. d The used value of Keq7 = 2778 is calculated from the relation Keq7 ∙ Keq8 ∙ Keq12 = exp (2 ∙ F ∙ (E (fum/suc) − E (FAD/FADH2))/R ∙ T) = 555.6, where midpoint redox potentials E (FAD/FADH2) = −79 mV (pH 7.0) and E (fum/suc) = 0 mV (pH 7.0) [22], respectively, and F, R, and T have the usual meaning. In the general case, when the values of the Keq8 and Keq12 can vary, Keq7 = 555.6/Keq8 ∙ Keq12. e Relations between equilibrium constants according to 4 thermodynamic cycles in the kinetic scheme: (1) Keq5 = 1/Keq4 ∙ Keq6 ∙Keq7 ∙ Keq8; (2) Keq6 = Keq11 ∙ Keq12/Keq10; (3) Keq13 = Keq8 ∙ Keq9/Keq14; (4) Keq15 = 1/Keq7 ∙ Keq12 ∙ Keq13 ∙ Keq16; f The used value was taken from [21], which was calculated from experimental data on Mn–SOD activity in mitochondria of cardiac cells [23]. Conserved moieties (in µM). The pool of electron carriers. In this work, we assumed that the concentration of the SDHA/SDHB subunits of SDH is equal to the concentration of Complex II. According to [24], the content of Complex II in cardiac mitochondria is 0.209 nmol Complex II/mg of mitochondrial protein. Translation of whole membrane concentration expressed in nmol/mg mit.prot. to local protein concentration expressed in μM presented in [21]. We have shown earlier [21] that 1 nmol/mg of protein corresponds to 273 μM when normalized to the mitochondrial volume (Vmit). If the concentration is normalized to the inner mitochondrial membrane volume (Vimb) it should be additionally taken into account that the ratio Wimb = Vimb/Vmit = 0.24 [21]. Therefore 0.209 nmol complex II/mg of mitochondrial protein corresponds approximately to 235 μM if it is recalculated to the concentration in the inner MM (0.209 ∙ 273/0.24 = 237). So, we suggested in the present study that the total concentration of all redox centers localized in Complex II, that is, [FAD], [2Fe-2S], [4Fe-4S], and [3Fe-4S], equal to 235 μM.
Publisher’s Note: MDPI stays neutral with regard to jurisdictional claims in published maps and institutional affiliations.

