Article

Genome-Wide Analysis of Multiple Organellar RNA Editing Factor Family in Poplar Reveals Evolution and Roles in Drought Stress

1
Beijing Advanced Innovation Center for Tree Breeding by Molecular Design, National Engineering Laboratory for Tree Breeding, College of Biological Sciences and Technology, Beijing Forestry University, Beijing 100083, China
2
State Key Laboratory of Tree Genetics and Breeding, Research Institute of Tropical Forestry, Chinese Academy of Forestry, Guangzhou 510520, China
*
Authors to whom correspondence should be addressed.
These authors contributed equally to this work.
Int. J. Mol. Sci. 2019, 20(6), 1425; https://doi.org/10.3390/ijms20061425
Submission received: 22 January 2019 / Revised: 14 March 2019 / Accepted: 18 March 2019 / Published: 21 March 2019
(This article belongs to the Special Issue Plant Genomics 2019)

Abstract

:
Poplar (Populus) is one of the most important woody plants worldwide. Drought, a primary abiotic stress, seriously affects poplar growth and development. Multiple organellar RNA editing factor (MORF) genes—pivotal factors in the RNA editosome in Arabidopsis thaliana—are indispensable for the regulation of various physiological processes, including organelle C-to-U RNA editing and plasmid development, as well as in the response to stresses. Although the poplar genome sequence has been released, little is known about MORF genes in poplar, especially those involved in the response to drought stress at the genome-wide level. In this study, we identified nine MORF genes in the Populus genome. Based on the structural features of MORF proteins and the topology of the phylogenetic tree, the P. trichocarpa (Ptr) MORF family members were classified into six groups (Groups I–VI). A microsynteny analysis indicated that two (22.2%) PtrMORF genes were tandemly duplicated and seven genes (77.8%) were segmentally duplicated. Based on the dN/dS ratios, purifying selection likely played a major role in the evolution of this family and contributed to functional divergence among PtrMORF genes. Moreover, analysis of qRT-PCR data revealed that PtrMORFs exhibited tissue- and treatment-specific expression patterns. PtrMORF genes in all group were involved in the stress response. These results provide a solid foundation for further analyses of the functions and molecular evolution of MORF genes in poplar, and, in particular, for improving the drought resistance of poplar by genetics manipulation.

1. Introduction

Poplar (Populus) has enormous economic and ecological benefits. It has a relatively small genome (485 ± 10 Mb; 2n = 38) and is the model forest species for genomic and genetic studies of woody plants owing to the relative ease of experimental manipulation and range of available genetic tools [1,2]. It is characterized by its height, thickness, and rapid growth, but biotic and abiotic stresses have limited its growth [3,4]. Among these stresses, drought is commonly pervasive with the characteristics of repressing stomata, photosynthesis, respiration, altering gene expression, and reducing biomass [5,6]. Drought is destructive and economically damaging for poplar, with important research and economic values [1,2,7,8]. Accordingly, investigating the stress resistance mechanisms of poplar has research and practical implications.
RNA editing primarily occurs in mitochondria and plastids of land plants and plays an important role in transcript maturation by insertions/deletions and conversion editing [9,10,11]. Conversion editing includes C-to-U, U-to-C, and A-to-I editing. U-to-C and A-to-I editing are likely less than C-to-U, which account for the vast majority of RNA editing events [12,13]. The cis-regulatory region, between nucleotide positions −40 and −5 of upstream of the edited site, interacts with trans-regulatory elements involved in identifying the site and catalyzing the conversion, from cytidine to uridine [14]. The organelle RNA recognition motif-containing protein (ORRM), organelle zinc finger (OZ), protoporphyrinogen IX oxidase (PPO), pentatricopeptide repeat (PPR), and RNA editing factor interacting protein (RIP)/multiple organellar RNA editing factor (MORF) families are key trans-acting elements for RNA editing [11,15,16]. The ORRM genes are required for RNA editing; the family contains six genes named ORRM1 to ORRM6. Plastid and mitochondrial editing sites are impaired in almost all orrm-mutants [16,17,18,19,20]. OZ1 and PPO1 have also recently been implicated in RNA editing and are all located in plastids [21,22]. PPR proteins include many family members and have been studied extensively [23]. Several PPR functions are in a broad range of events, including developmental and physiological processes and response to various biotic and abiotic stresses [24]. For instance, a PPR96 deficiency in A. thaliana is associated with insensitivity to ABA and oxidative stress [23]. Mutations in SLO2 of the E+ subclass of the P-L-S subfamily of PPRs retard leaf emergence, restrict root growth, and result in late flowering, and these parameters are enhanced in the absence of sucrose. Additionally, four RNA editing defects and reduced editing at three sites in slo2 mutants have been identified [25]. The conversion of nucleotides can not succeed without protein–protein interactions between certain PPRs and MORFs. (PLS)3PPR and LPA66—two PPR genes—are associated with increased RNA-binding activity based on the presence of MORF9 binding in A. thaliana [26]. MORF proteins interact with specific PPR proteins based on pull down in vivo and yeast two-hybrid assays [15].
MORFs are a small protein family in land plants (nine members in A. thaliana and seven members in maize) [27,28]. The name of DAG-like (DAL) gene family in maize was previously adopted based on the first identified member (DAG) of the gene family in Antirrhinum majus [27,28]. In A. thaliana, MORF proteins were also named RNA editing factor interacting proteins (RIP). There are nine members, defined as MORF1–9, while there are ten RIPs. RIPs or MORFs have been used interchangeably, except for RIP1, which corresponds to MORF8, and RIP8, which has been referred to MORF1. Only one gene, RIP10 (At1g53260), was specially not defined as belonging to the MORF family [9]. In A. thaliana, all MORF proteins have no annotated domains but shared a similarly conserved domain. MORF2 and MORF9 are targeted to plastids, and MORF8 is located in chloroplasts and mitochondria, and the others are located in mitochondria. Some MORF genes work together and influence each other during some RNA editing events, i.e., they exhibit homo- and heteromeric interactions. For example, both mitochondrial MORF1 and plastid MORF2 proteins can interact with the dual-targeted MORF8 protein. MORF2 and MORF9 are both required for editing at several sites. The presence or absence of MORF8 influences edited sites targeted by MORF2 and/or MORF9 [27,29].
Several members of the RNA editosome interacted with MORF family genes towards their important roles in plant growth, development, and RNA editing efficiency [30,31]. Plant development would be negatively affected without MORF proteins. In rice, owing to impaired chloroplast development, the wsp1 mutant has the variegated phenotype and reduced chlorophyll content. Further, photosynthetic efficiency, CO2 gas conductance, and transpiration rate of wsp1 plants are lower than those of the wild type [32]. In A. thaliana, morf2 and morf9 mutants show a lack of chlorophyll in leaves, and the T-DNA insertional rip1 (RIP1 also named as MORF8) mutant demonstrates dwarfism [27,33].
In poplar, functional studies of MORF proteins focused on biotic and abiotic stresses are sparse. In this study, we predicted nine putative MORF genes in the P. trichocarpa genome. A comprehensive analyses of the poplar MORF family, including phylogenetic, gene structure, chromosomal distribution, and synteny analyses, were performed. The expression profiles of PtrMORF genes under drought were determined using public microarray and quantitative RT-PCR data. Our results provide insight into the fascinating properties and biological functions of MORF genes in response to drought stress in poplar.

2. Results

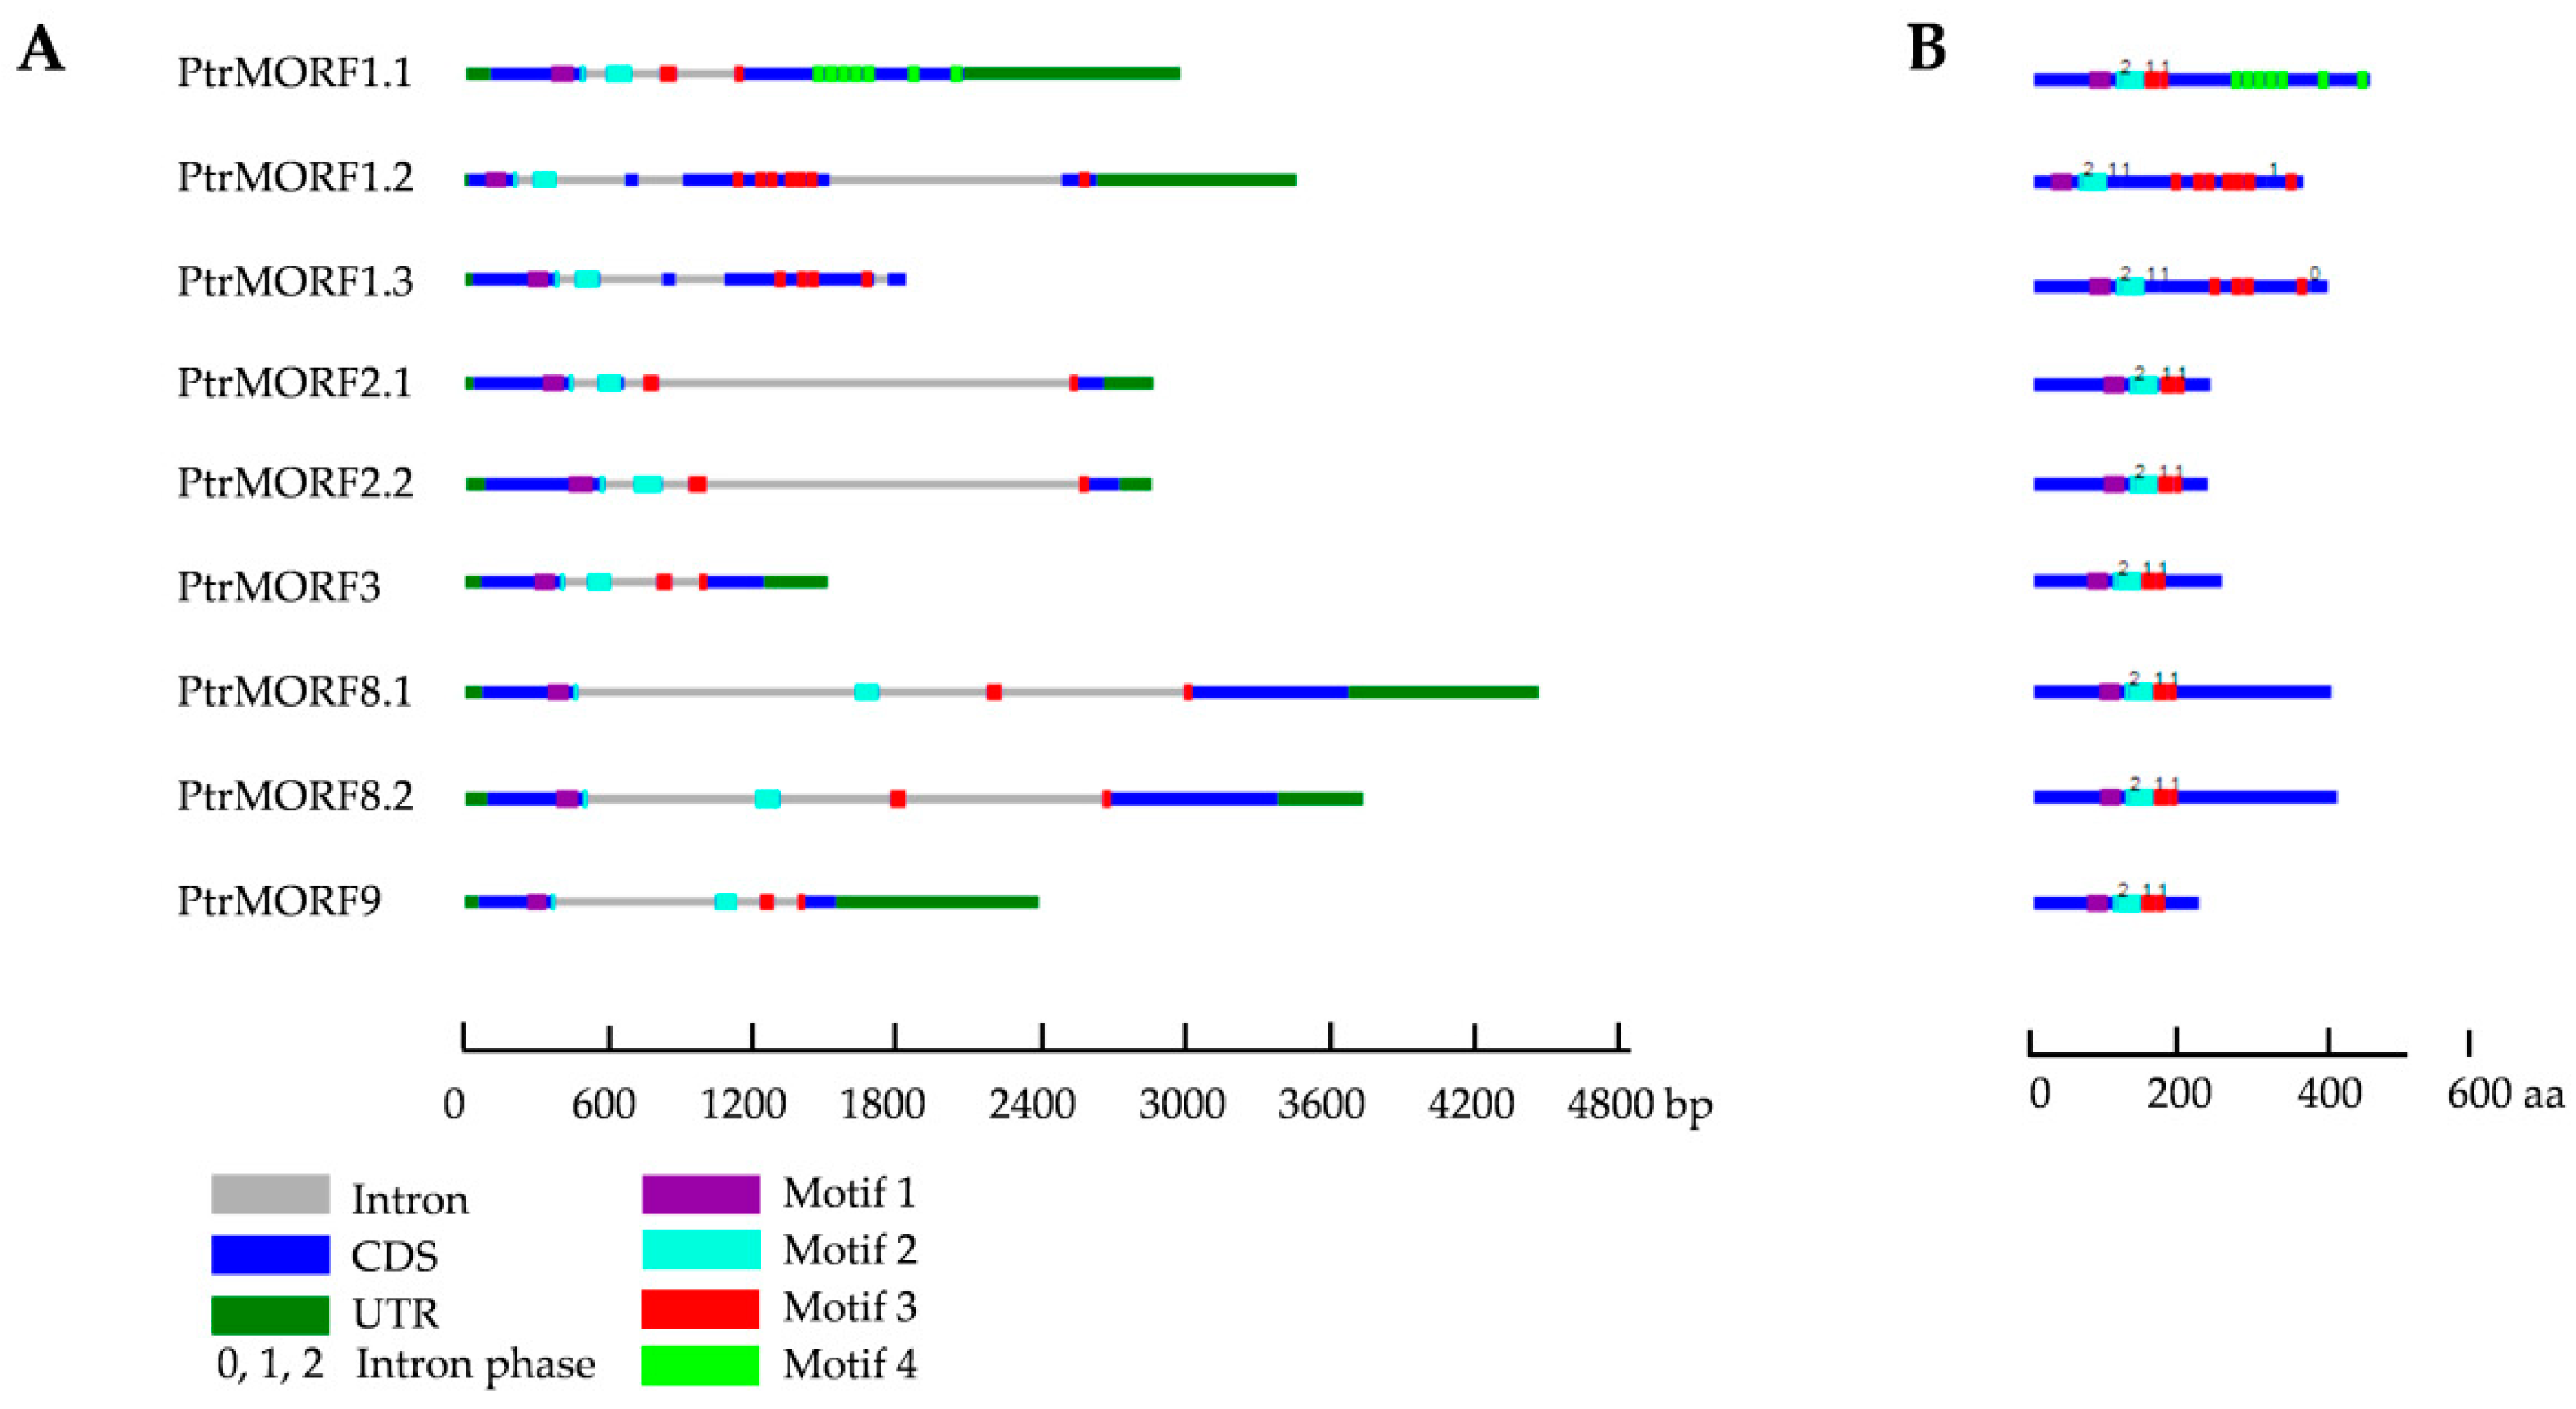
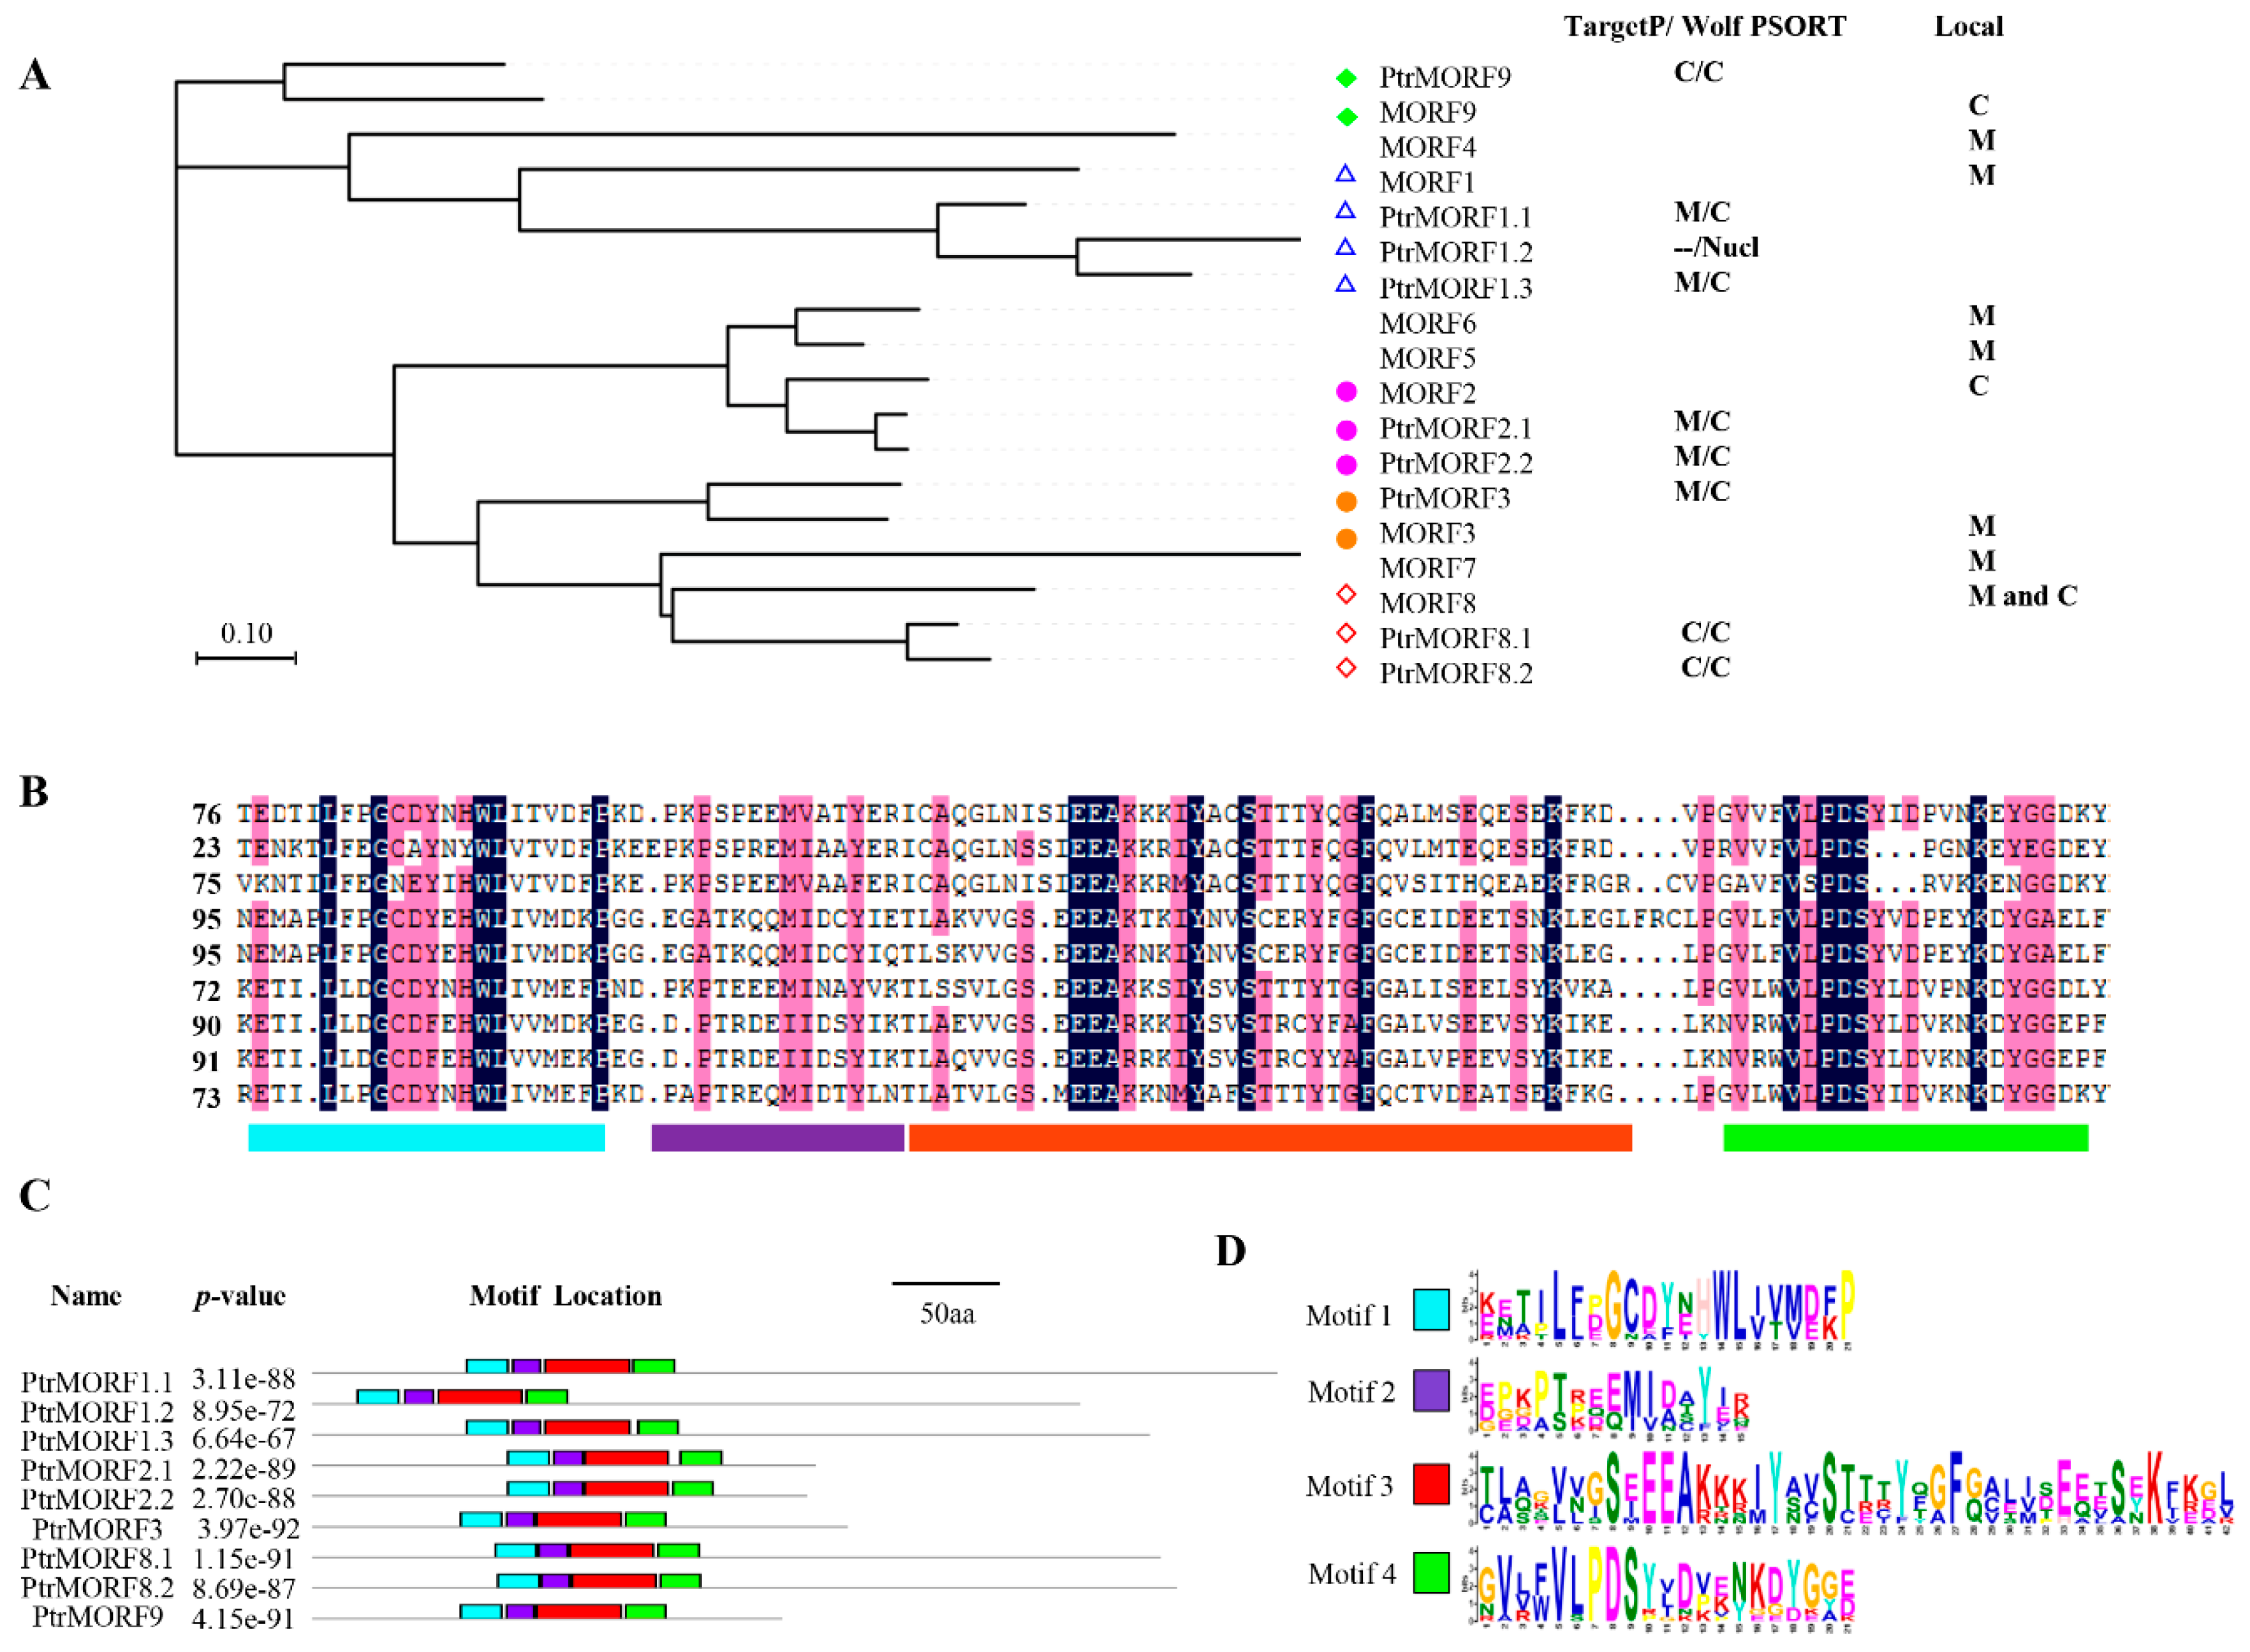
2.1. Identification and Sequence Analysis of the PtrMORF Gene Family

We searched the poplar genome with known A. thaliana MORF proteins as queries. Initially, nine putative PtrMORF genes were obtained—PtrMORF1.1, PtrMORF1.2, PtrMORF1.3, PtrMORF2.1, PtrMORF2.2, PtrMORF3, PtrMORF8.1, PtrMORF8.2, and PtrMORF9 based on a phylogenetic analysis using the amino acid sequences of all MORFs of P. trichocarpa as well as those of A. thaliana (Figure 1A). Poplar MORF proteins were predicted using TargetP and Wolf PSORT to enter mitochondria, chloroplasts, or nuclei, like their homologs in A. thaliana (Figure 1A). No known motif in poplar MORF proteins was found in the PFAM and INTERPRO databases, but the MORF box was identified, as in previous studies [27,28,33]. Novel putative motifs were explored using the MEME server. By selecting a motif length of between 15 and 50 aa, we identified four conserved motifs located in the MORF domain (Figure 1B–D).
We further analyzed the sequence structures of the nine PtrMORF genes. An alignment of the genomic sequences to predicted CDS sequences of PtrMORF genes, showed that PtrMORF genes had a conserved gene structure. The PtrMORF genes had three introns with intron phases 0, 1, and 2. In all PtrMORF genes, motif 1 was encoded by exon 1, motif 2 was encoded by exon1 and exon 2, and motif 3 was encoded by exons 3 and 4, but motif 4 was only located in exon 4 of PtrMORF1.1 (Figure 2A,B). The nine PtrMORF genes ranged from 1515 to 4441 bp and contained four or five exons (Figure 2A). All identified poplar MORF genes encoded proteins ranging from 229 to 470 amino acids, and their sequences contained zero to two transmembrane domains (TMDs). The molecular weight (MW) of the nine putative proteins ranged from 26.0 to 51.7 kDa. The GRAVY values of putative MORFs were negative and ranged from −1.382 to −0.602 (Table S1).

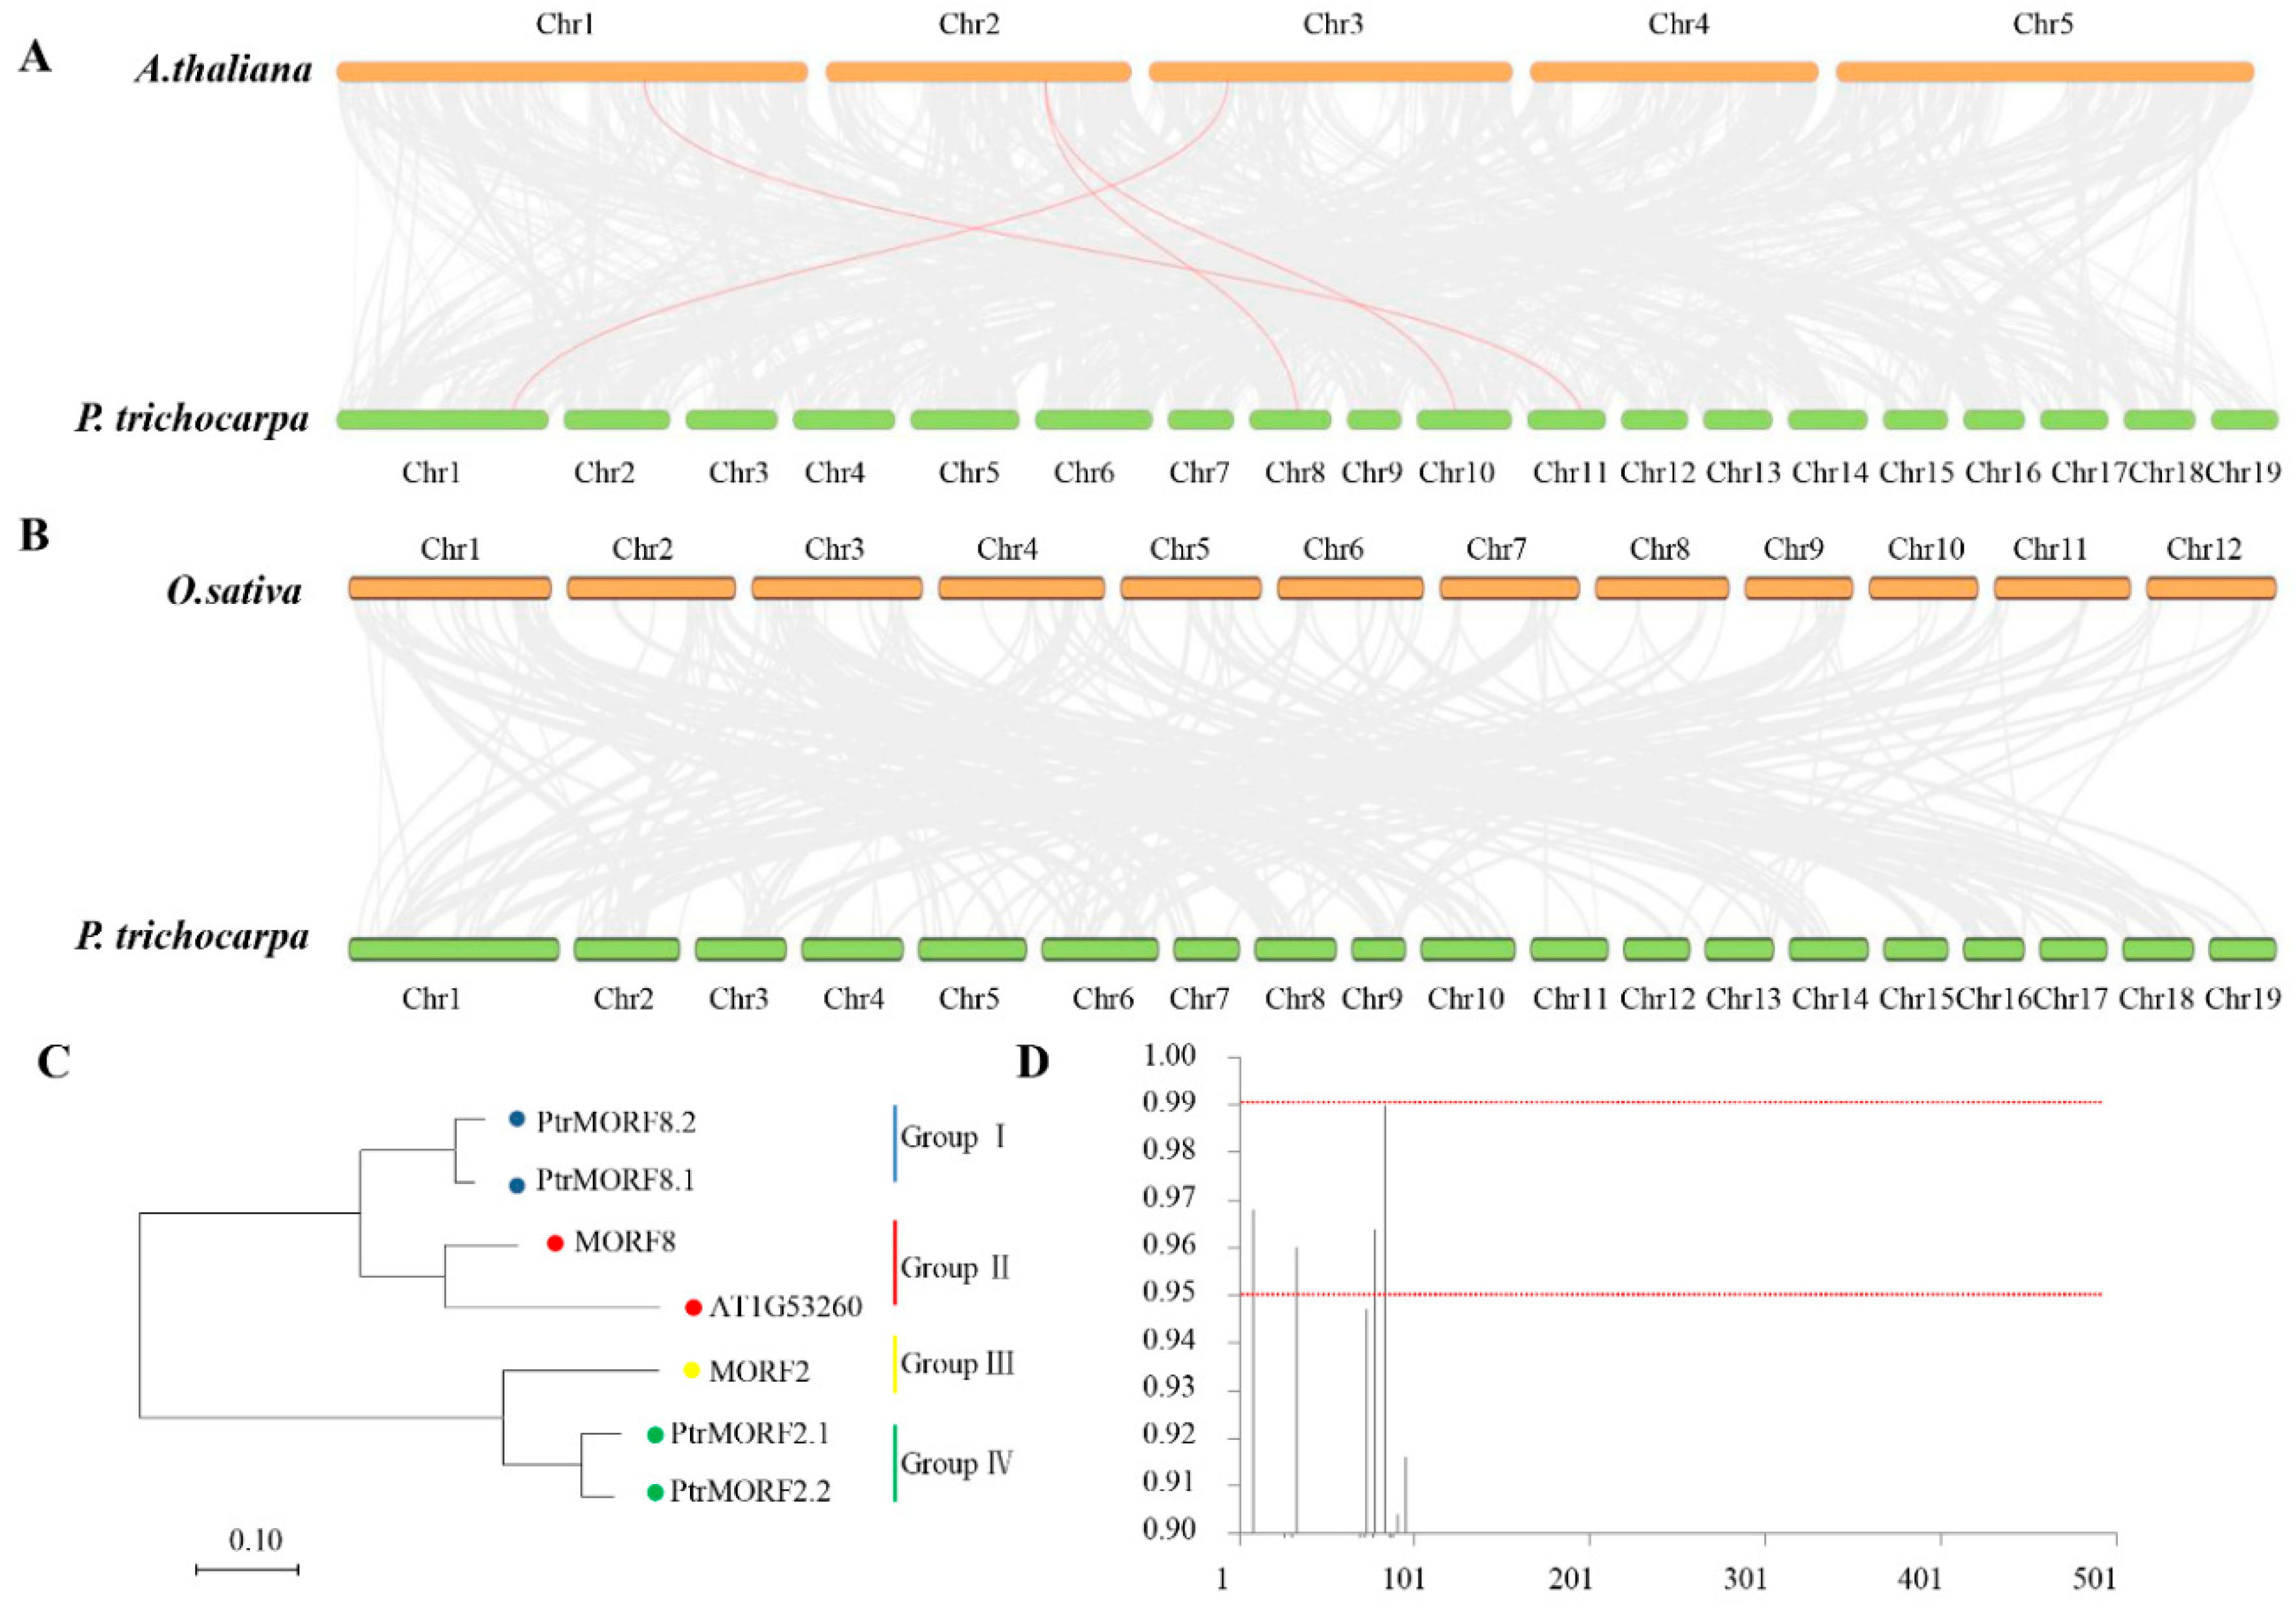
2.2. Phylogenetic Comparison of the MORF from Different Species

To investigate their molecular evolution and functions in poplar, a phylogenetic analysis of MORF proteins was performed. We used the HMMER 3.0 package to build a Hidden Markov Model (HMM) file (morf.hmm) with 19 MORF domain sequences of MORF proteins from A. majus, P. trichocarpa, and A. thaliana (Table S2). To mine additional MORF domain-encoding genes in other plants, we used the morf.hmm algorithm to query the genomes of six species, representing major evolutionary lineages, including Arabidopsis lyrata, Brachypodium distachyon, Glycine max, Oryza sativa Japonica, Prunus persica, and Vitis vinifera. The numbers of MORF genes in eight species were comparable, ranging from six (in P. persica) to 11 (in A. lyrata and G. max).
In total, 69 MORF genes were identified in eight plant genomes to build an unrooted tree using MEGA7.0 by employing the neighbor-joining (NJ) method. As shown in Figure 3, sequences were classified into six groups (I, II, III, IV, V, and VI). Each group included MORF genes from diverse plant taxa. Among these, classes III and VI were larger than the others, containing 30 members and accounting for 42.5% of all predicted MORF genes. PtrMORF genes were found in all classes other than group III.

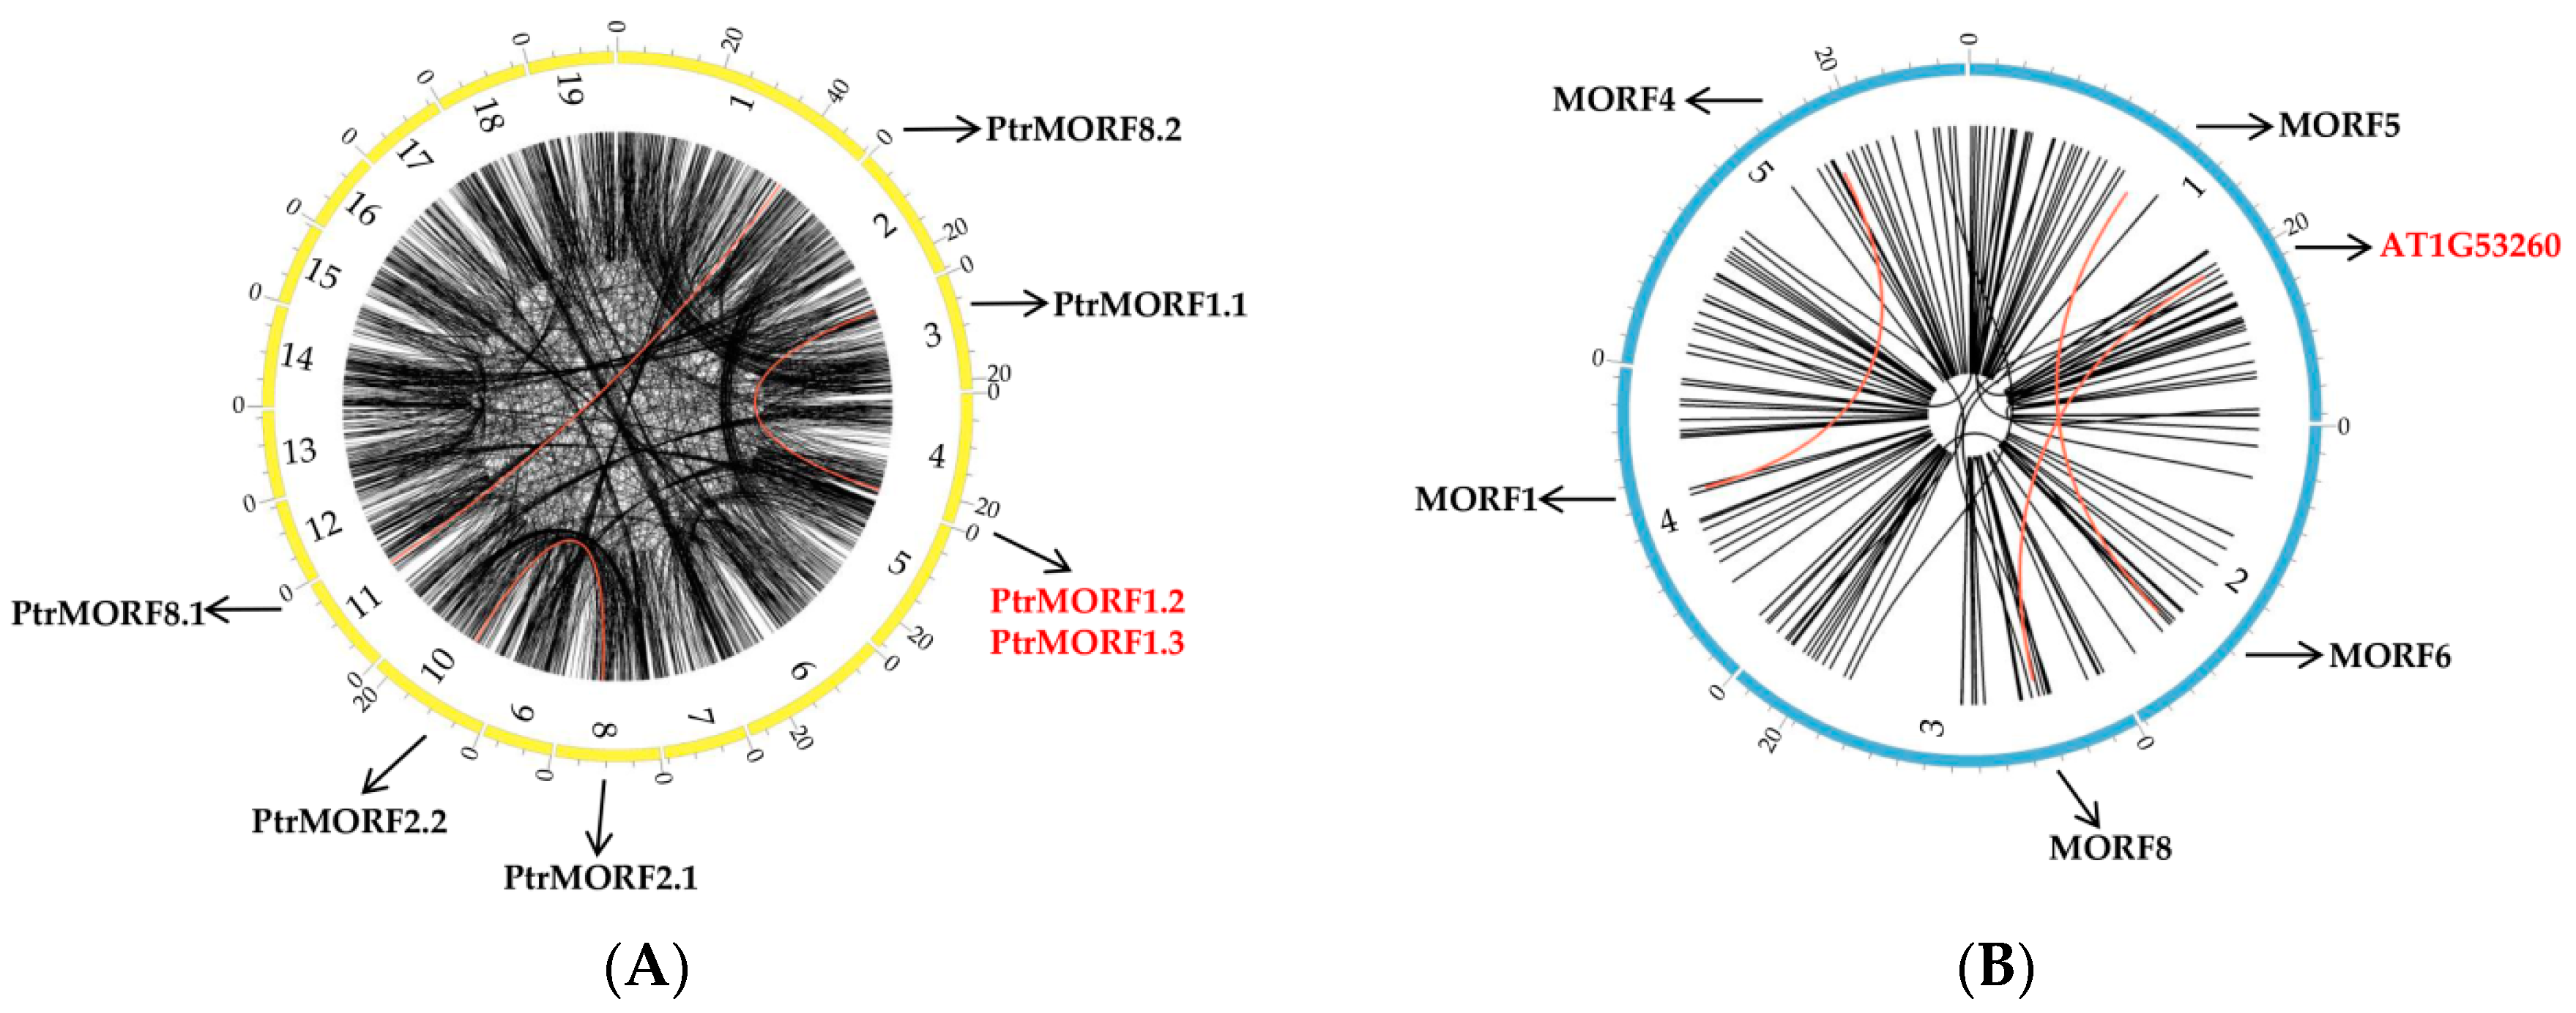
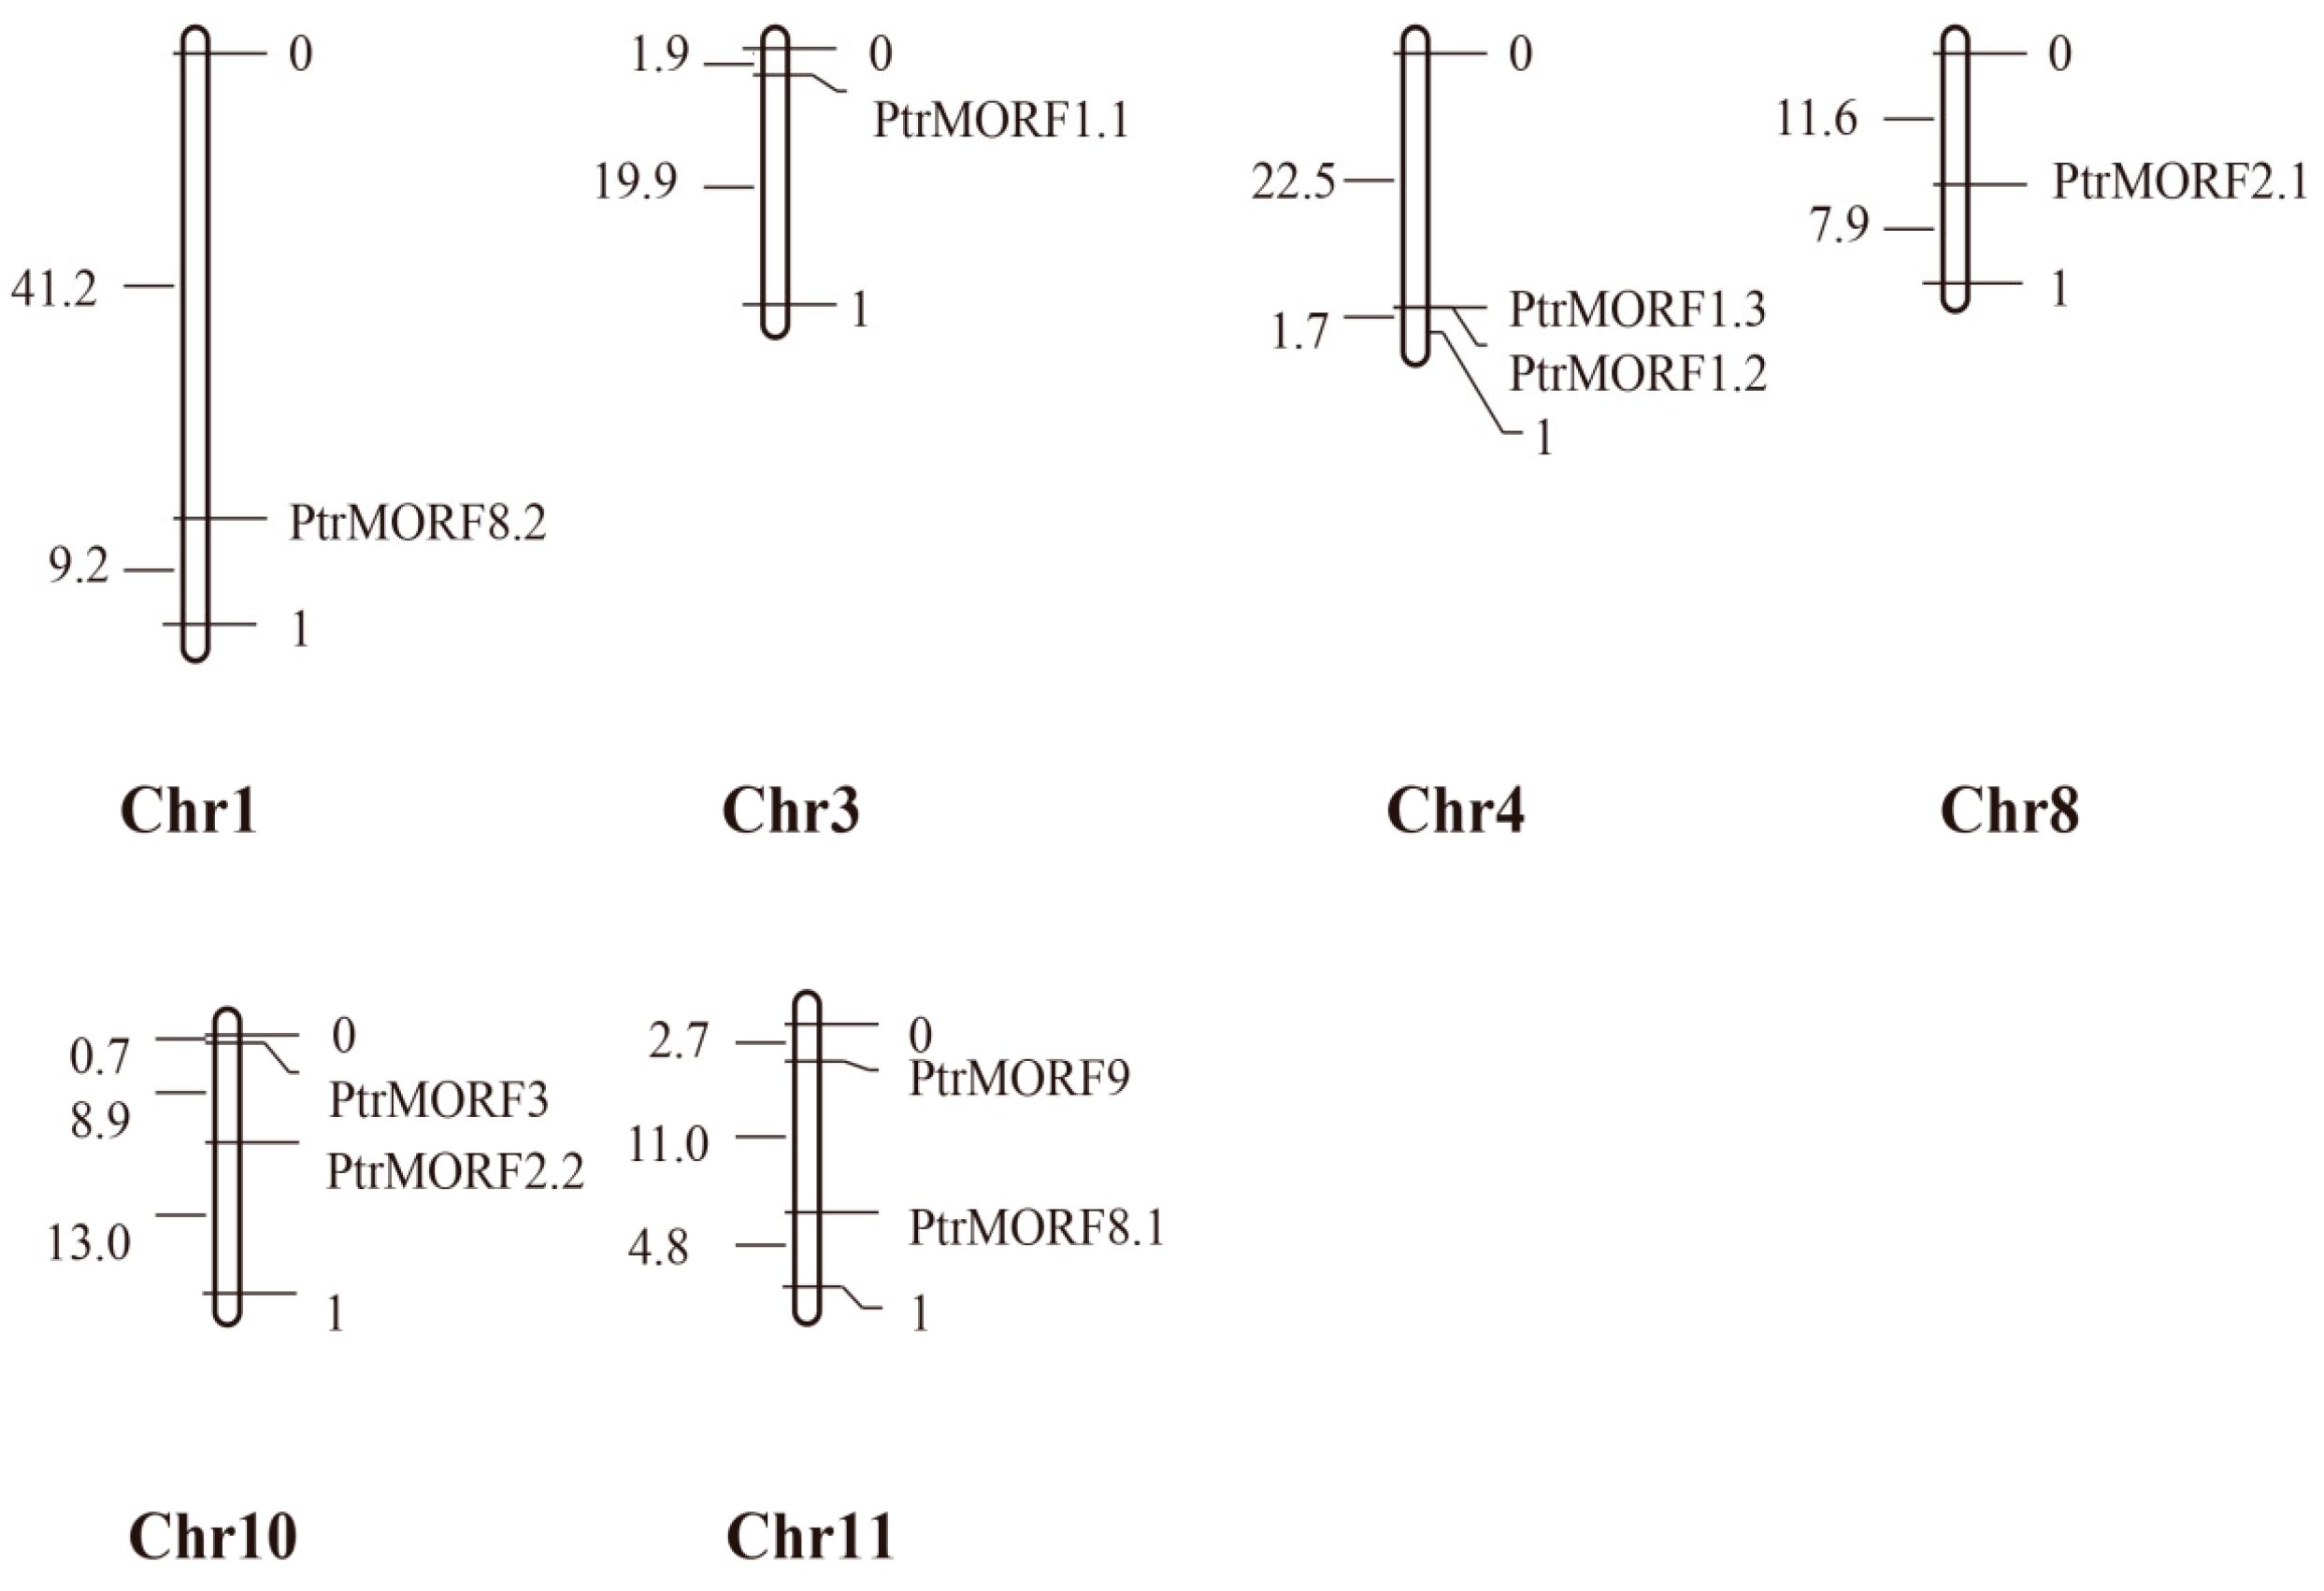
2.3. Chromosomal Distribution, Synteny, and Evolution of PtrMORF Genes

Figure 4 showed that the genes were distributed on six poplar chromosomes, including chromosomes 1, 3, 4, 8, 10, and 11. Half of the chromosomes had two PtrMORF members and the other half had a single MORF. Tandem duplication was defined as different members of the gene family occurring within the same or neighboring intergenic region [34]. One tandem duplication event involving two MORF genes (PtrMORF1.2/PtrMORF1.3) was identified by BLASTP and MCScanX methods. In addition to the tandem duplication, seven PtrMORF genes were assigned to three segmental duplication events (PtrMORF1.1/PtrMORF1.2/PtrMORF1.3, PtrMORF2.1/PtrMORF2.2, and PtrMORF8.1/PtrMORF8.2) in Populus linkage groups 1, 3, 4, 8, 10, and 11. Notably, PtrMORF1.2 and PtrMORF1.3 occurred in both tandem and segmental duplications. A cross-matching event was also found in three doubling blocks of PtrMORF genes; the chromosomal fragment in which a gene was located was identical to more than one nonself chromosomal segment. PtrMORF1.1, PtrMORF1.2, and PtrMORF1.3 synteny blocks corresponded to the third, fourth, and fourth chromosomes, respectively (Figure 5A and Table S3). Figure 5B showed five of the nine MORF genes were involved in three segmental duplication events (MORF1/MORF4, MORF5/MORF6, and MORF8/AT1G53260) in A. thaliana. It was worth noting that the gene, AT1G53260, was not included in the scope of MORF genes because of partial MORF box in our research [27]. The MORF gene of A. thaliana was also shown to be highly segmental duplicated, which was similar to that in poplar.
We further inferred the phylogenetic relationships of PtrMORFs, based on the diverse roles of DYW-PPR protein binding to MORFs on RNA editing sites in A. thaliana [9]. We constructed two syntenic maps of poplar with A. thaliana and rice. A total of four PtrMORF genes showed syntenic relationships with MORFs in A. thaliana (Figure 6A,C and Table S3). However, no synteny was in rice (Figure 6B). We performed phylogenetic analyses of these MORF proteins in Populus and A. thaliana. The ratio of nonsynonymous/synonymous substitution rates of PtrMORFs and MORFs in A. thaliana was determined to evaluate the selection pressure on amino acid substitutions (ω = dN/dS) and the role of Darwinian positive selection in driving gene divergence after duplication [35,36,37]. Generally, ω > 1 indicates positive selection, ω < 1 provides evidence for negative or purifying selection, and ω = 1 supports neutral evolution.
Using the maximum likelihood method and codon substitution models implemented in PAML, the selection pressure in the four groups of MORF genes was evaluated by likelihood ratio tests (LRTs). The estimated ω value for all MORF genes was 0.055 using a one-ratio model (M0). We then detected the positive selection acting on particular groups using a branch model in which each clade had its own ω value. The LRT statistic suggested that the ω values for groups II, III, and IV were significantly different from that of group I, and the ω estimates for all groups other than group I still suggested purifying selection (Table 1).
Thus, we estimated the evolutionary forces acting on individual codon sites using site-specific likelihood models of codon substitution because positive selection was unlikely to affect all sites over prolonged time periods. Three pairs of models—M1 (neutral) and M2 (selection), M0 (one ratio) and M3 (discrete), and M7 (beta) and M8 (beta & ω)—formed three LRTs. As shown in Table 2, model M1 was not significantly worse than M2, although it suggested that 6.6% of sites were nearly neutral with ω = 1. Model M3 with K = 8 suggested that 0.7% of sites were under positive selection, and model M3 was significantly better than the one rate model. Model M8, in which an additional ω ratio was estimated from the data, was not significantly better than M7, indicating that no sites were under positive selection.
To better detect positive selection, the branch-site model was also applied to evaluate selection on all amino acids of MORF proteins in specific groups (Table 3). LRT showed that model A fitted the data significantly better than the site-specific model M1 (p < 0.01) in group II, implying positive selection on 29.7% of sites in group II. At the posterior probability (p) > 95%, four sites were likely to be under positive selection in group II. Referring to first sequence in group II, MORF8, these positively selected sites were 8T, 33R, 78D, and 83V (Figure 6D). However, no positive selection was found in the branch including PtrMORFs.

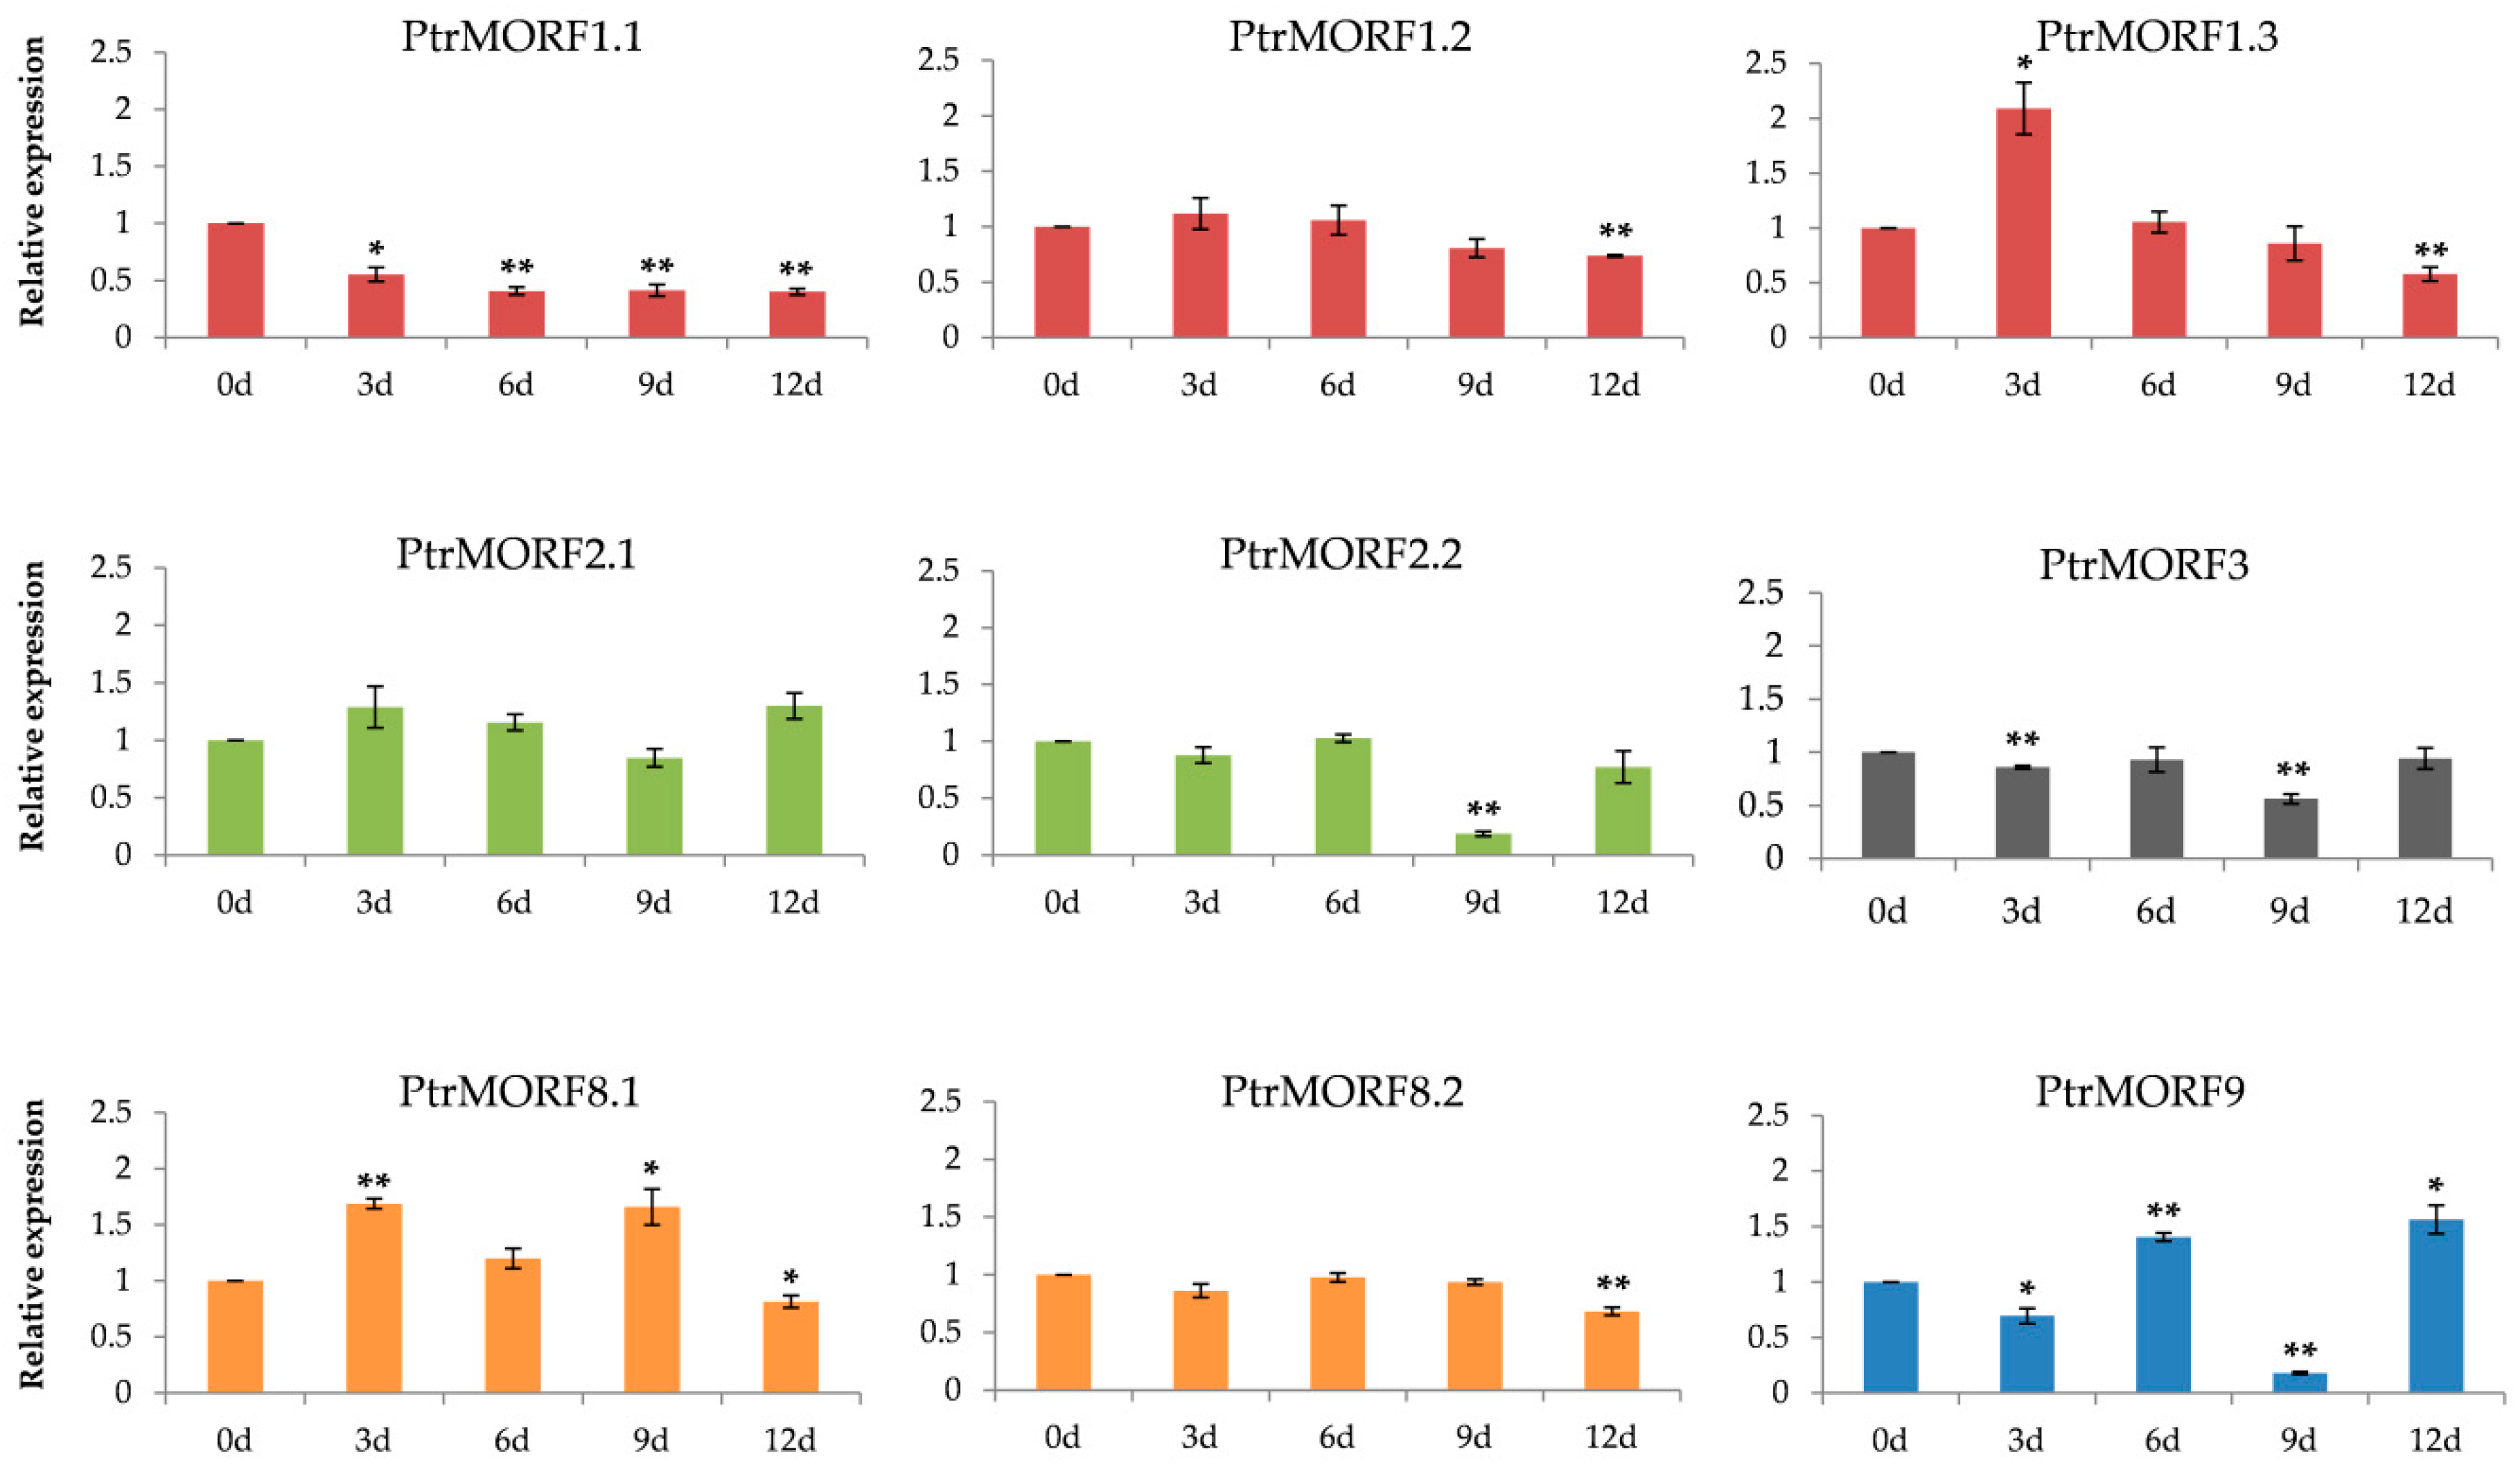
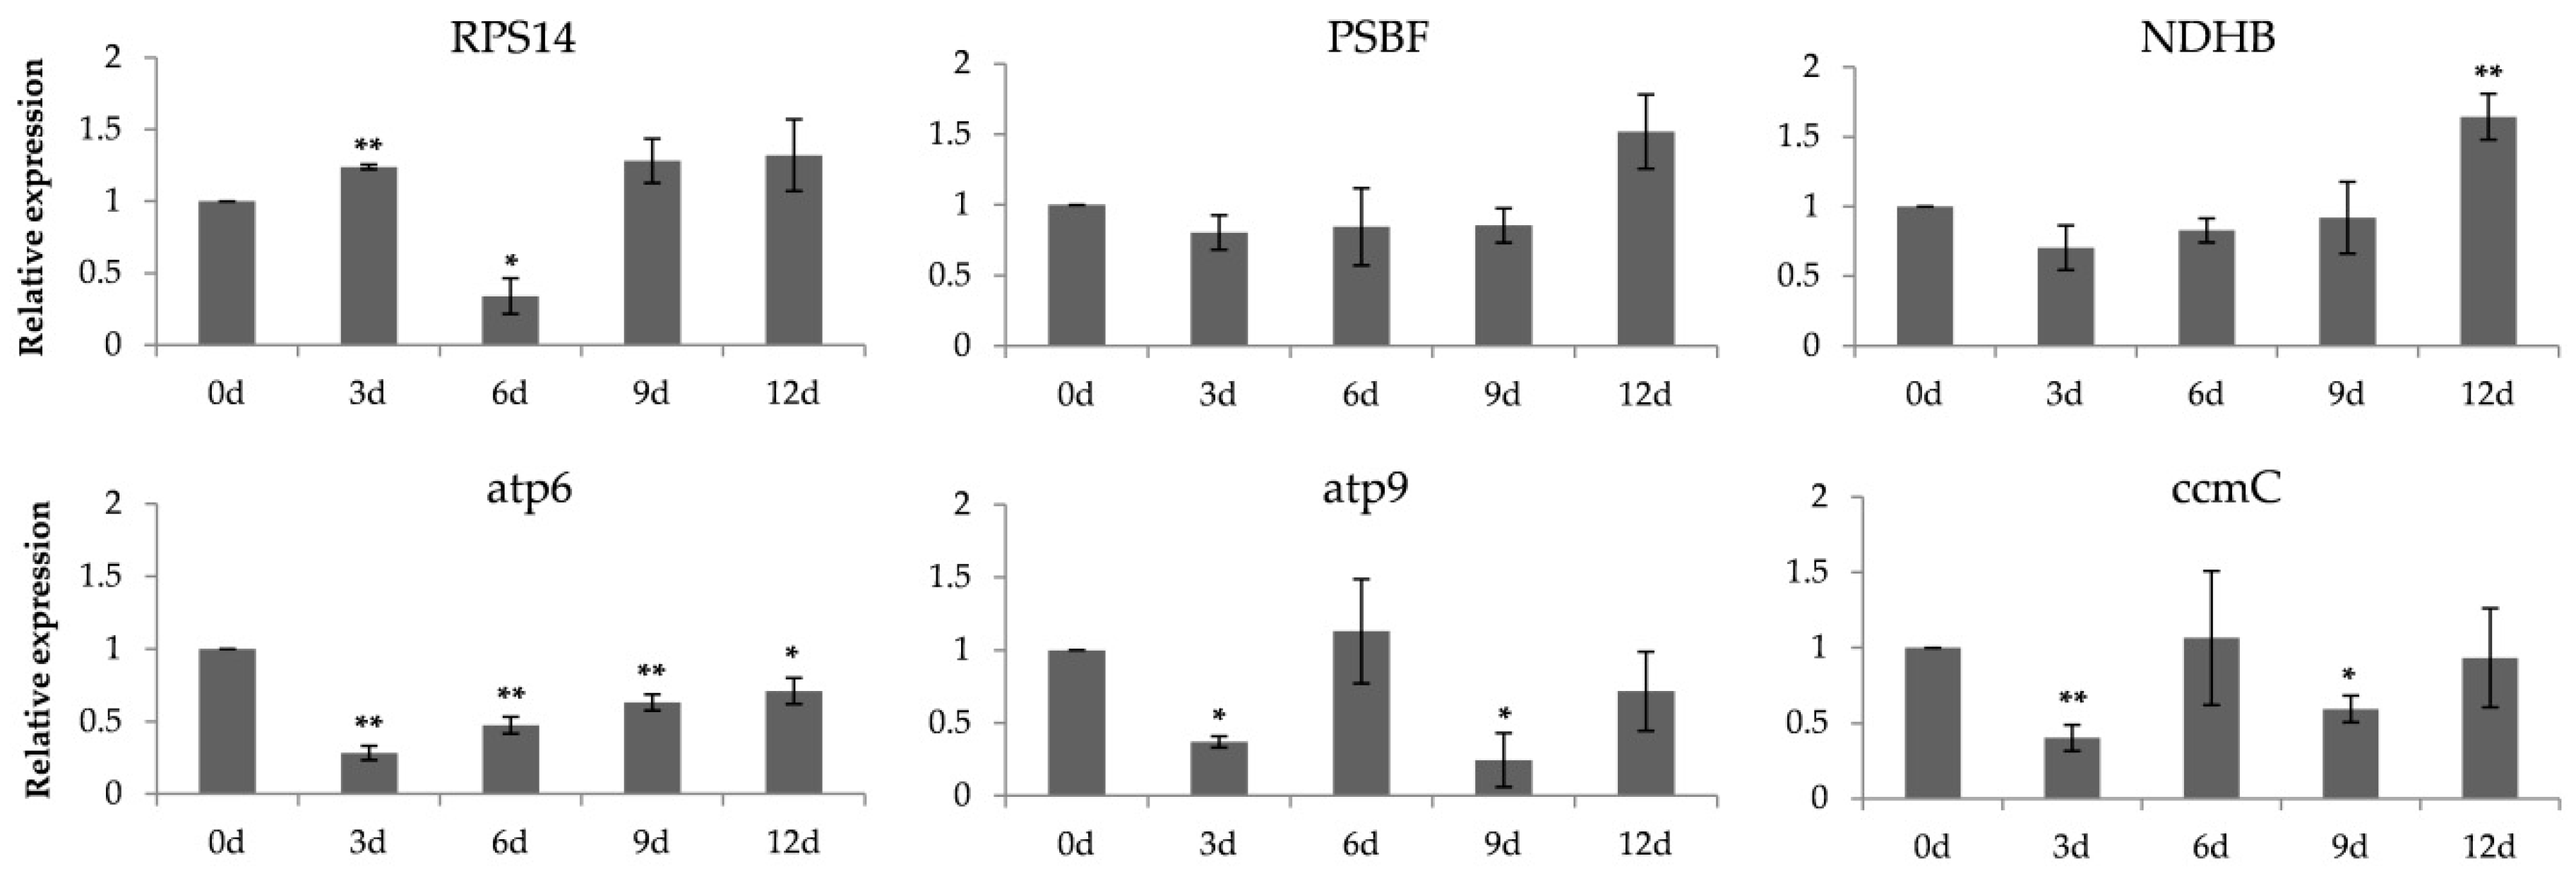
2.4. Expression of PtrMORF Genes and Six Genes from Chloroplasts and Mitochondria under Drought Stress

Although the role of MORF proteins in plastid development and RNA editing in A. thaliana and rice have been studied, little is known about how MORFs respond to abiotic stimuli, such as drought stress, particularly in poplar [27,32].
Quantitative real-time reverse transcription-PCR (qRT–PCR) for long-term water deficiency stress in black poplar (Populus × euramericana cv. ‘Neva’) was further performed to evaluate the differential expression of each PtrMORF gene. Nine genes exhibited significantly different expression under limited water stress except PtrMORF2.1, and these could be preliminarily considered as drought-responsive genes. Among them, the two PtrMORF genes PtrMORF1.3 and PtrMORF8.1 were highly expressed followed by low expression. The expression levels of PtrMORF1.1 and PtrMORF1.2, PtrMORF2.2, PtrMORF3, and PtrMORF8.2 under drought conditions were significantly lower than those in control conditions. The mRNA accumulation of MORF9 fluctuated obviously, exhibiting decreased expression after 3-day and 9-day drought, but increased approximately 1.5-fold after 6-day and 12-day drought. However, the pattern of the response to drought was not consistent. For example, the expression level of PtrMORF1.1 had downregulated after 3-day drought stress. At the same time, PtrMORF1.2 and PtrMORF8.2 were significantly downregulated until 12 days of limited water stress. Furthermore, PtrMORF genes that belonged to the same group in the phylogenetic tree had different expression patterns under stress treatment. For instance, PtrMORF1.1 and PtrMORF1.3 were downregulated and upregulated in 3-day drought treatments, while PtrMORF1.2, also orthologous to group I members and MORF1 in A. thaliana, was not affected by limiting water until 12 days post-treatment (Figure 7).
In order to further explore the possible relationship between RNA editing and plant stress, we selected a total of six genes from chloroplasts and mitochondria to evaluate their expression, based on previous studies [27,38,39]. The RPS14 gene represented important chloroplast proteins, and the fluctuant editing efficiency and gene expression of RPS14 were associated with cytokinins against stress [39,40]. Under salt stress, PSBF and NDHB likely showed an elevated editing percentage, linked to PSII repair and increase in NDHB gene translation [39]. In rice, atp6, atp9, and ccmC were related to mitochondrial electron transport chain and had been selected to test RNA editing during stress exposure [38]. In our study, these reported genes in poplar were obtained from National Center for Biotechnology information and showed different expression owing to drought. Six genes, except PSBF, were significantly upregulated or downregulated after drought stress (Figure 8). The three mitochondrial genes—atp6, atp9, and ccmC—were significantly downregulated after 3-day drought. The level of RPS14 was highly expressed on 3-day drought followed by a low expression on 6-day drought, and the expression of poplar NDHB was significantly increased under 12-day drought.

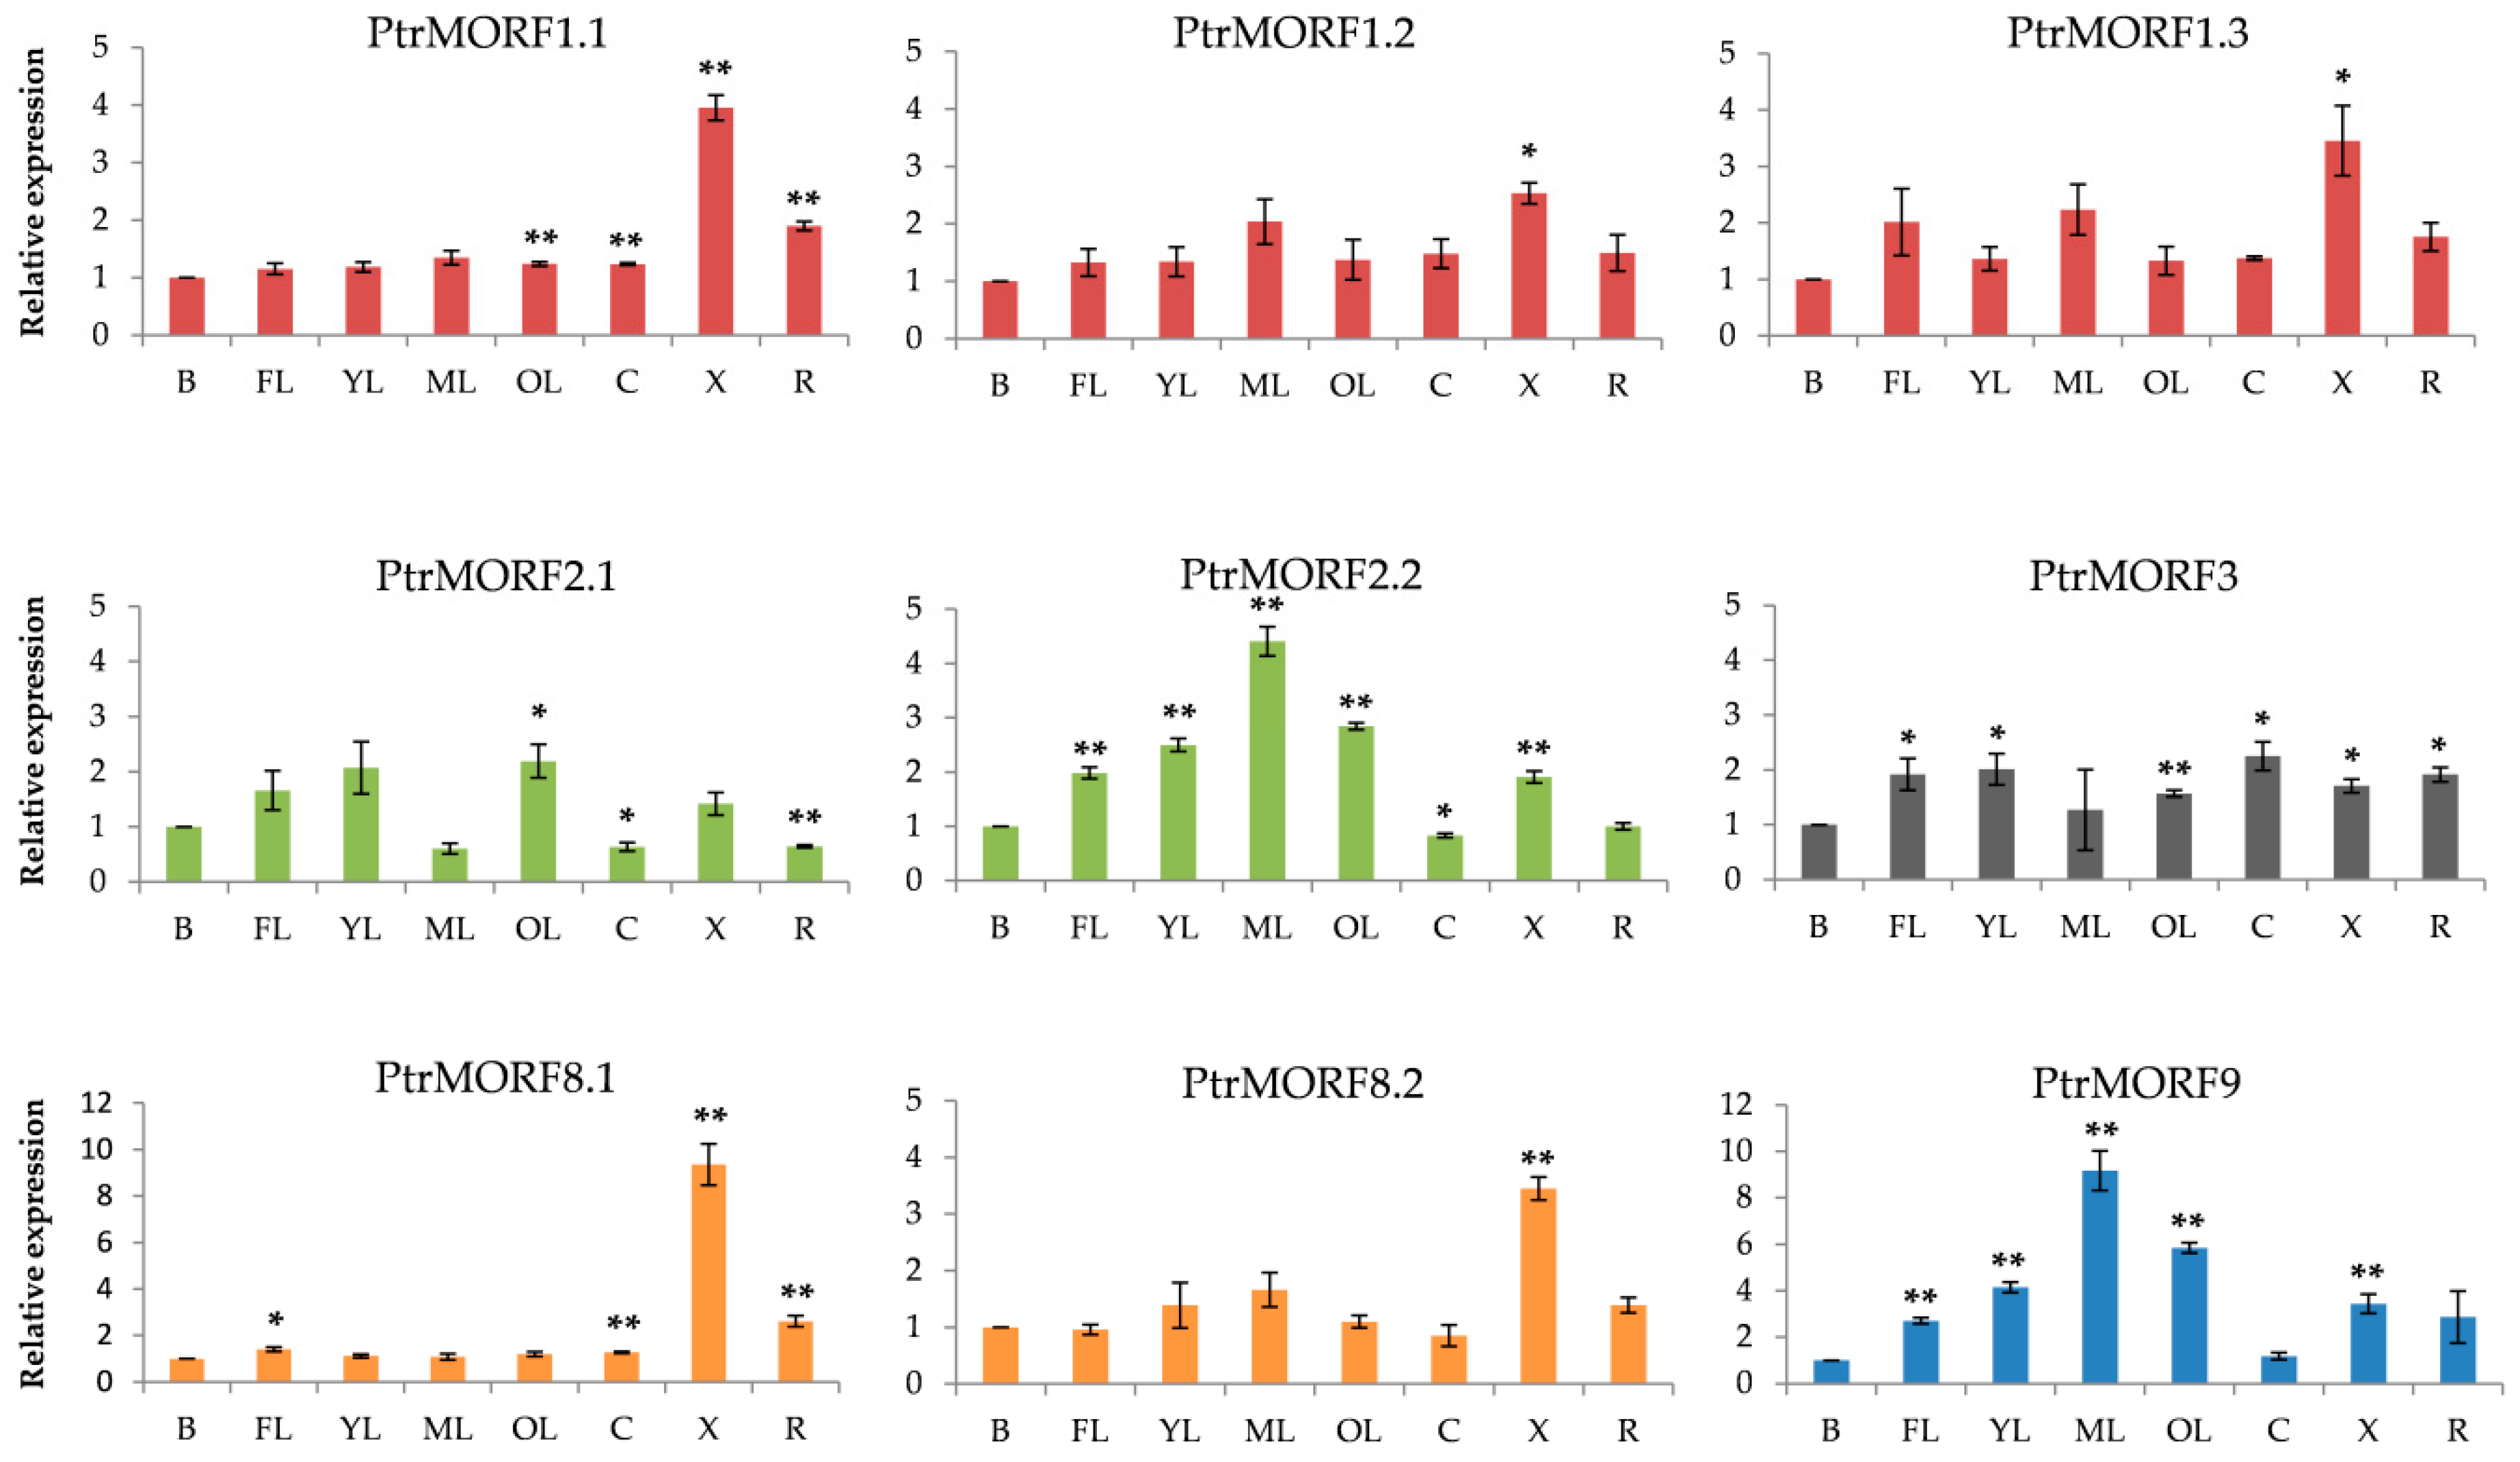
2.5. Expression Profiles of Populus MORF Gene

We then examined the tissue-specific expression of nine Populus MORF genes by qRT-PCR: we evaluated various tissue types, including buds, freshly expanded leaves, expanding young leaves, mature leaves, old leaves, cortex, xylem, and roots. The expression levels of PtrMORFs in these tissues were comparable to those in buds. Some PtrMORF genes exhibited clear tissue-specific expression (Figure 9). Five PtrMORF genes—PtrMORF1.1, PtrMORF8.1, PtrMORF2.2, PtrMORF3, and PtrMORF9—were higher or weakly expressed in over four tissues significantly. Among them, the latter three genes were highly expressed level in almost all leaves types, and PtrMORF8.1 and PtrMORF1.1 had higher expression levels in freshly expanded leaves and old leaves, respectively. All but one gene—PtrMORF2.1—had higher expression in xylem. PtrMORF1.2, PtrMORF1.3, and PtrMORF8.2 had no significant difference in their expression in leaves and merely higher expressed in xylem compared to buds. Additionally, The PtrMORF genes with closest evolutionary relationship had different expression patterns. PtrMORF1.1, PtrMORF1.2, and PtrMORF1.3 had the closest homology relationship with MORF1 of A. thaliana. Among them, PtrMORF1.1 had high expression levels in old leaves, cortex, xylem, and roots, while PtrMORF1.2 and PtrMORF1.3 only in xylem. With respect to PtrMORF2.1 and PtrMORF2.2, which were orthologous to MORF2 of A. thaliana, the latter had high expression level in four leaves types and the former exhibited high expression only in old leaves. A similar inconsistency in expression was observed between PtrMORF8.1 and PtrMORF8.2.

3. Discussion

RNA editing plays an irreplaceable role in plant growth and development and C-to-U RNA editing events occur frequently in vascular plants. Trans-acting factors (RNA editosome) are required to recognize nucleotides to be edited, including OZ1, PPR, ORRM, and others. MORF proteins that interact with these factors have been found in A. thaliana and O. sativa [22,26,32]. MORF genes, which are important subunits of the RNA editosome, play a vital role in the regulation of RNA editing [11]. It is worth noting that the functions of most MORF proteins in response to stress, especially drought, remain unclear in woody plant. In this study, we identified the whole MORF gene family in poplar and examined the expression patterns of these genes in different plant tissues and in response to drought. The structure of the MORF family, evolutionary events, transcriptional changes responded to drought, and tissue-specific expression pattern are discussed below.
Members of the MORF family have been identified and characterized in many taxa. For example, 10 MORF genes have been identified in A. thaliana, but At1g53260 (RIP10) may exhibit a partial lack of partial functionality owing to incomplete MORF box. We focus on nine MORF genes in A. thaliana in this study [9,27]. In maize, seven putative the DAG-like (DAL) genes have also have been identified. It is worth noting that DAL, MORF, and RIP genes are the same [28]. We screened the P. trichocarpa genome for putative MORF genes using a tailor-made HMM file derived from multiple MORF domain alignments. We identified nine PtrMORF genes consistent with the findings of previous report [28]. Compared with MORF genes in A. thaliana and in maize (Zea mays), the family has not been extensively studied in poplar, indicating that P. trichocarpa MORF proteins might perform functions similar to those preformed by their homologs in herbaceous plants.
In our study, to better understand the evolution of the MORF gene family in poplar, the structure, conserved motifs, phylogenetic relationships, and collinearity of PtrMORF genes were characterized. Four conserved motifs were located in the MORF domain, suggesting that the MORF domain is conserved among A. thaliana and Populus proteins. Most of the PtrMORF genes exhibited similar numbers of exons. A phylogenetic analysis revealed that PtrMORF genes and putative MORF genes from other species could be classified into six subgroups. The distribution of genes among the subclasses indicated that the expansion of the MORF family occurred before the divergence of the species. Most of PtrMORF genes were grouped with MORF genes from A. thaliana and P. persica genomes, indicating a close relationship among MORF genes from these species. Gene duplication is a major mechanism underlying the evolution of novel protein functions. We detected 2 (22.2%) PtrMORF genes that were tandemly duplicated and seven genes (77.8%) that were segmentally duplicated, implying low tandem and high segmental duplication rates in PtrMORF genes. Three homologous pairs of chromosomes included seven of the nine PtrMORF genes, with segmental duplication in the poplar genome. For example, homologous chromosomes 8 and 10 both contained one MORF gene each; similar findings were obtained for homologous chromosomes 1 and 11, as well as 3 and 4. Two MORF genes—Potri.010G007200 and Potri.011G032900—were detected on chromosomes 10 and 11, but their homologous chromosomes 8 and 1 lacked PtrMORF genes. Tandem duplication was detected (Table S3). Furthermore, the synteny block including PtrMORF1.1, PtrMORF1.2, and PtrMORF1.3 was attributed to multiple copies of the chromosome. These results indicated that some PtrMORF genes were possibly generated by gene duplication and segmental duplication events likely served as driving force in PtrMORF evolution.
Additionally, synteny maps between two representative species and poplar were constructed to better understand the phylogenetic relationships. Four pairs were detected in A. thaliana and none was detected in rice indicating a weak homology relationship between poplar and rice. The ω values for duplicated gene pairs between PtrMORF genes and MORFs in A. thaliana were calculated to explore selective pressures (Table 1, Table 2 and Table 3). In general, the MORF genes in the two plants were under strong purifying selection using the branch model. The ω values for four groups were less than 1, except for group II, MORF8 (At3G15000) and At1G53260 (RIP10), indicating that purifying selective pressure was strong. Positively selected sites might cause adaptive changes after gene duplication and during the evolution of MORFs in A. thaliana.
RNA editing could potentially contribute to plant resistance to abiotic tolerance on the basis of previous studies [38,41,42]. And some genes closely related to RNA editing, such as PPR genes in A. thaliana or rice, their mutants changed morphological characteristics due to environmental forces [32,43]. Additionally, MORF genes were interacted with PPR genes to establish complex editosomes in plant [26,27]. Therefore, we made an attempt to confirm whether the PtrMORF genes responded to stress. The eight PtrMORF genes distributed in all groups were upregulated or downregulated significantly under drought treatment. It was indicated that they may respond to drought stress. Additionally, the sensitivity of PtrMORF genes responding to drought stress was different. The expressions of PtrMORF1.2, PtrMORF2.2, and PtrMORF8.2 changed significantly after nine or even 12 days of drought, while the other five genes had lower or higher expression only in three-day drought restriction. This might implied that the former three genes are less sensitive to drought than the latter five. However, not all the genes, which were responded to drought on day three, had consistent response as drought stress increases. This was similar to the response of rice some PPR genes to drought stress [44]. Additionally, five of the six genes from poplar chloroplasts and mitochondria showed obviously higher or lower expression compared with no drought treatment, and the edited site efficiency of these genes were affected when the MORF genes were mutated out in A. thaliana [27], suggesting that the PtrMORF gene family, as important component of RNA editing, might be involved in the response to drought stress. However, many questions were worth exploring: (1) How would RNA editing perform under stress? (2) What were the deeper mechanisms of MORF genes, as important editosome members of RNA editing?
The functional divergence of MORF genes was speculated depended on their tissue-specific expression. Firstly identified member in A. majus, the DAG gene is essential for chloroplast development in the leaves and etioplast formation of cotyledons [45]. In A. thaliana, the DAG-like gene is involved in early chloroplast differentiation [46]. Our study showed that six PtrMORF genes are expressed highly in the leaves of black poplar (Populus × euramericana cv. ‘Neva’), suggesting that PtrMORFs might play an important role in chloroplast differentiation and development. Some genes that were highly expressed highly in both the leaves and other tissues, such as the cortex, xylem, and roots, indicating the expanded function of PtrMORFs. The expression of three genes, merely higher expressed in xylem compared to buds. There are homologous genes in A. thaliana; MORF1 was located in both mitochondria and MORF8 in both mitochondria and chloroplasts and possessed an extended C-terminus with unknown function. In previous reports, glycine-rich regions were observed in the C-termini of MORF1 and MORF8 in A. thaliana [16]. The genes exhibited glycine-rich regions may play key roles in the biotic and abiotic stresses [47]. In addition, the firstly discovered glycine-rich protein—GRP-1—was highly expressed in buds and vascular tissue in the petunia [48]. Taken together, these reports suggested this hypothesis that glycine-rich regions observed in MORFs might support them in responding to adversity and be highly expressed in xylem in poplar. Xylem was important for water transportation in plants and PtrMORF genes expressed highly in xylem might be closely related to water regulation, making the MORF genes likely respond to drought [49]. However, we had to point out that the exact roles within PtrMORFs need further experiments. Additionally, there were still living parenchyma cells in the xylem and the activity of parenchyma cells provided a critical metabolic and energetic role in woody stem [49]. They played a major role in editing implying that the three MORF genes in poplar may play unlikely similar roles in annual plants and were probably required in other critical functions in perennial woody plants.
Therefore, this research preliminarily provided insight into the roles of PtrMORFs in stress response and investigations of functions for these genes required further experimental validation in future studies.

4. Materials and Methods

4.1. Plant Materials and Treatments

Black poplar (Populus × euramericana cv. ‘Neva’) were grown in a greenhouse at 25 °C under a 16/8 h light/dark cycle. The 3.5-month-old plants were subjected to drought stress. Twelve plants were encountered water-limited treatment, ranging from 3 to 12 days of drought in which the soil RWC was reduced from 70%; the other three plants were provided abundant water, with a the soil RWC of greater than 30% [50]. Three biological replicates were performed.
Total RNA was isolated from poplar mature leaves (sixth to twelfth) after drought stress. Different organs and tissues of 3.5-month-old plants, including buds, freshly expanded leaves (second to third), expanding young leaves (fourth to fifth), mature leaves (sixth to twelfth), old leaves (leaves below the mature leaves), cortex, xylem (the stem without cortex), and roots, were collected at the same time and immediately immersed in liquid nitrogen.

4.2. Genome-Wide Identification and Sequence Analysis of MORF Genes in P. trichocarpa

The potential MORF genes in P. trichocarpa were queried using a local BLASTP search with an E-value threshold of <10−10 and a bit score of >100 in poplar genome annotation data (Ptrichocarpa_210_v3.0.protein.fa.gz downloaded from https://phytozome.jgi.doe.gov/pz/portal.html) based on preexisting MORF/RIP genes, including At1g11430, At1g32580, At1g72530, At2g33430, At2g35240, At3g06790, At3g15000, At4g20020, and At5g44780 from A. thaliana, which was then confirmed in previous studies [27,28]. Multiple sequence alignments of PtrMORF proteins and the known MORF proteins were generated using DNAMAN. The alignment results were used to build protein Hidden Markov Models (HMMs) to mine the conserved domain; the file was named morf.hmm and was generated using the hmmbuild program in the HMMER 3.0 package (version 3.1b2). No known motifs in PtrMORF proteins and MORF proteins of other plants were detected by screening the PFAM (http://pfam.sanger.ac.uk/) and INTERPRO (http://www.ebi.ac.uk/interpro/) databases [51,52]. The HMM file was used as a probe to search genome files of representative species downloaded from Phytozome V11.0, including A. lyrata, B. distachyon, G. max, O. sativa Japonica, P. persica, and V. vinifera [53]. Protein hits with an E-value of <10−10 and sequence score of “best 1 domain” >100 were collected.
MEME (http://meme.nbcr.net/meme/cgi-bin/meme.cgi) was used to investigate the putative conserved motifs among PtrMORF proteins with the following parameters: length between 15 and 50 aa, maximum number of motifs = 4, and one per sequence. To obtain the intact conserved MORF domain, different limits for the length of each motif were used between 100 and 120 aa [54]. In addition, TargetP, and Wolf PSORT were used to predict the putative organelle localization of PtrMORF proteins [55,56].

4.3. Phylogenetic Analysis

A multiple sequence alignment of 69 MORF proteins from P. trichocarpa and other species including A. lyrata, A. thaliana, B. distachyon, G. max, O. sativa Japonica, P. persica, and V. vinifera was generated using the MUSCLE method. A phylogenetic tree was constructed by using the NJ method implemented in MEGA V7.0 [57]. The parameters for tree construction were as follows. Phylogeny test and options: bootstrap (1000 replicates); gaps/missing data: pairwise deletion; model: Dayhoff model; pattern among lineages: same (homogeneous); and rates among sites: uniform rates. Finally, the phylogenetic tree was visualized using itol (http://itol.embl.de/) [58].

4.4. Chromosome Location and Gene Structure Analysis

Positional information and gene structures of PtrMORF genes on chromosomes of P. trichocarpa were obtained from the PopGenIE database [59]. The chromosomal locations were displayed with MapDraw program [60]. The numbers and organization of introns and exons and gene structures were drawn and displayed using the online PIECE2 server of GSDraw [61].

4.5. Colinearity of PtrMORF Gene

The chromosomal locations of PtrMORF genes were obtained from PopGenIE. Multiple Collinearity Scan Toolkit (MCScanX) was used to analyze gene duplication events with the default parameters and the colinearity information was showed by Circos [62,63]. Using Dual Systeny Plotter software (https://github.com/CJ-Chen/TBtools), the synteny relationships of orthologous MORF genes among poplar, A. thaliana, and rice were evaluated [64]. Nonsynonymous (dN) and synonymous (dS) substitutions, as well as dN/dS ratio (ω) for duplicated MORF genes, were calculated, using branch-specific, site-specific (one, neutral, selection, discrete, beta, and beta & ω > 1), and branch-site (Model A) of codon substitution models, as implemented in PAML version 4 [65,66,67]. Likelihood ratio tests (LRTs) were used to compare model fits. The sites under positive selection were identified using Bayesian methods [68].

4.6. RT-PCR and qRT-PCR Analyses

Total RNA was extracted using a Plant RNA EASYspin Plus Kit (Aidlab, Beijing, China) and first-strand cDNA synthesis was performed using approximately 2 μg of RNA using the FastQuant RT Kit (with gDNase) (TIANGEN, Beijing, China) following the manufacturer’s protocols. qRT-PCR was conducted on the ABI StepOnePlus Real-Time PCR System (ABI, Foster City, CA, USA) based on the SYBR Green II method. Twenty microliters of cDNA was diluted 1:10 with nuclease-free water. Each reaction contained 10 µL of SYBR Green qPCR Mix (Aidlab), 0.2 µL of ROX Reference Dye (Aidlab), 1 µL of cDNA (corresponding to 10 ng of total RNA), 7.8 µL of nuclease-free water, and 0.25 µM each primer. The thermal profile for qRT-PCR: 3 min at 94 °C, 40 cycles of 10 s at 94 °C, 20 s at 60 °C, and 72 °C for 30 s. Primers were designed using Primer3 (http://bioinfo.ut.ee/primer3-0.4.0/) [69]. A list of primers used was given (Table S4). Each experiment was performed in three biological replicates. The poplar housekeeping gene, UBQ, was used as an internal control. Relative expression was calculated by the 2−ΔΔCt method [70]. A Student’s t-test was used to generate every p-value for statistical analyses, and R project was used to identify significant variance (R version 3.5.1, one sample and two sample t-test: * p < 0.05; ** p < 0.01).

5. Conclusions

Genome-wide identification and evolutionary, gene structure, and expression analyses under drought stress of poplar MORF genes provide a deep insight into the gene family. Moreover, analyses of MORF genes based on qRT-PCR validation of poplar tissues provide functional information. Our results provide an important resource for advancing our understanding of the roles of MORF genes in poplar.

Supplementary Materials

Supplementary materials can be found at https://www.mdpi.com/1422-0067/20/6/1425/s1.

Author Contributions

D.W. and S.M. designed and conducted all of the experiments. X.X., C.L. and W.Y. conceived the project. W.S., Y.B. and Y.L. helped perform the experiments. D.W. contributed to analyze the experimental results. D.W., S.M., C.L. and X.X. wrote the paper.

Funding

This research was sponsored by grants from the National Key Program on Transgenic Research (2018ZX08021001) and the National Natural Science Foundation of China (31770649, 31570308, and 31600484).

Acknowledgments

We thank Jinbu Jia for bioinformatics analysis, experimental design, and useful discussion.

Conflicts of Interest

The authors declare no conflict of interest.

References

  1. Tuskan, G.A.; DiFazio, S.; Jansson, S.; Bohlmann, J.; Grigoriev, I.; Hellsten, U.; Putnam, N.; Ralph, S.; Rombauts, S.; Salamov, A.; et al. The genome of black cottonwood, Populus trichocarpa (Torr. & Gray). Science 2006, 313, 1596–1604. [Google Scholar] [CrossRef]
  2. Tuskan, G.A.; Difazio, S.P.; Teichmann, T. Poplar Genomics is Getting Popular: The Impact of the Poplar Genome Project on Tree Research. Plant Biol. 2004, 6, 2–4. [Google Scholar] [CrossRef] [PubMed]
  3. Bradshaw, H.D.; Ceulemans, R.; Davis, J.; Stettler, R. Emerging Model Systems in Plant Biology: Poplar (Populus) as A Model Forest Tree. J. Plant Growth Regul. 2000, 19, 306–313. [Google Scholar] [CrossRef]
  4. Suzuki, N.; Rivero, R.M.; Shulaev, V.; Blumwald, E.; Mittler, R. Abiotic and biotic stress combinations. New Phytol. 2014, 203, 32–43. [Google Scholar] [CrossRef] [PubMed] [Green Version]
  5. Zhao, Z.; Zhang, C.; Meng, S.; Li, M. Transcriptomic insight into nitrogen uptake and metabolism of Populus simonii in response to drought and low nitrogen stresses. Tree Physiol. 2018, 38, 1672–1684. [Google Scholar] [CrossRef]
  6. Shinozaki, K.; Yamaguchi-Shinozaki, K. Gene networks involved in drought stress response and tolerance. J. Exp. Bot. 2006, 58, 221–227. [Google Scholar] [CrossRef] [PubMed] [Green Version]
  7. Zhu, J.K. Salt and drought stress signal transduction in plants. Annu. Rev. Plant Biol. 2002, 53, 247–273. [Google Scholar] [CrossRef] [PubMed]
  8. Zhu, J.-K. Abiotic Stress Signaling and Responses in Plants. Cell 2016, 167, 313–324. [Google Scholar] [CrossRef]
  9. Bentolila, S.; Oh, J.; Hanson, M.R.; Bukowski, R. Comprehensive high-resolution analysis of the role of an Arabidopsis gene family in RNA editing. PLoS Genet. 2013, 9, e1003584. [Google Scholar] [CrossRef]
  10. Oldenkott, B.; Yamaguchi, K.; Tsuji-Tsukinoki, S.; Knie, N.; Knoop, V. Chloroplast RNA editing going extreme: More than 3400 events of C-to-U editing in the chloroplast transcriptome of the lycophyte Selaginella uncinata. RNA 2014, 20, 1499–1506. [Google Scholar] [CrossRef]
  11. Sun, T.; Bentolila, S.; Hanson, M.R. The Unexpected Diversity of Plant Organelle RNA Editosomes. Trends Plant. Sci. 2016, 21, 962–973. [Google Scholar] [CrossRef] [PubMed]
  12. Chateignerboutin, A.L.; Small, I. Plant RNA editing. RNA Biol. 2010, 7, 213–219. [Google Scholar] [CrossRef] [Green Version]
  13. Freyer, R.; Kiefermeyer, M.C.; Kössel, H. Occurrence of plastid RNA editing in all major lineages of land plants. Proc. Natl. Acad. Sci. USA 1997, 94, 6285–6290. [Google Scholar] [CrossRef] [PubMed] [Green Version]
  14. Takenaka, M.; Neuwirt, J.; Brennicke, A. Complex cis-elements determine an RNA editing site in pea mitochondria. Nucleic Acids Res. 2004, 32, 4137–4144. [Google Scholar] [CrossRef] [PubMed] [Green Version]
  15. Yan, J.; Zhang, Q.; Yin, P. RNA editing machinery in plant organelles. Sci. China Life Sci. 2018, 1–8. [Google Scholar] [CrossRef]
  16. Bayer-Csaszar, E.; Haag, S.; Jorg, A.; Glass, F.; Hartel, B.; Obata, T.; Meyer, E.H.; Brennicke, A.; Takenaka, M. The conserved domain in MORF proteins has distinct affinities to the PPR and E elements in PPR RNA editing factors. Biochim. Biophys. Acta Gene Regul. Mech. 2017, 1860, 813–828. [Google Scholar] [CrossRef]
  17. Shi, X.; Castandet, B.; Germain, A. ORRM5, an RNA recognition motif-containing protein, has a unique effect on mitochondrial RNA editing. J. Exp. Bot. 2017, 68, 2833–2847. [Google Scholar] [CrossRef] [Green Version]
  18. Hackett, J.B.; Shi, X.; Kobylarz, A.T.; Lucas, M.K.; Wessendorf, R.L.; Hines, K.M.; Bentolila, S.; Hanson, M.R.; Lu, Y. An Organelle RNA Recognition Motif Protein is Required for Photosynthetic Subunit psbF Transcript Editing. Plant. Physiol. 2017, 173, 2278–2293. [Google Scholar] [CrossRef]
  19. Shi, X.; Bentolila, S.; Hanson, M.R. Organelle RNA recognition motif-containing (ORRM) proteins are plastid and mitochondrial editing factors in Arabidopsis. Plant Signal. Behav. 2016, 11, 294–309. [Google Scholar] [CrossRef]
  20. Shi, X.; Hanson, M.R.; Bentolila, S. Two RNA recognition motif-containing proteins are plant mitochondrial editing factors. Nucleic Acids Res. 2015, 43, 3814–3825. [Google Scholar] [CrossRef] [Green Version]
  21. Zhang, F.; Tang, W.; Hedtke, B.; Zhong, L.; Liu, L.; Peng, L.; Lu, C.; Grimm, B.; Lin, R. Tetrapyrrole biosynthetic enzyme protoporphyrinogen IX oxidase 1 is required for plastid RNA editing. Proc. Natl. Acad. Sci. USA 2014, 111, 2023–2028. [Google Scholar] [CrossRef] [PubMed] [Green Version]
  22. Sun, T.; Shi, X.; Friso, G.; Van Wijk, K.; Bentolila, S.; Hanson, M.R. A zinc finger motif-containing protein is essential for chloroplast RNA editing. PLoS Genet. 2015, 11, e1005028. [Google Scholar] [CrossRef] [PubMed]
  23. Liu, J.M.; Zhao, J.Y.; Lu, P.P.; Chen, M.; Guo, C.H.; Xu, Z.S.; Ma, Y.Z. The E-Subgroup Pentatricopeptide Repeat Protein Family in Arabidopsis thaliana and Confirmation of the Responsiveness PPR96 to Abiotic Stresses. Front. Plant Sci. 2016, 7, 1825. [Google Scholar] [CrossRef] [PubMed]
  24. Xing, H.; Fu, X.; Yang, C.; Tang, X.; Guo, L.; Li, C.; Xu, C.; Luo, K. Genome-wide investigation of pentatricopeptide repeat gene family in poplar and their expression analysis in response to biotic and abiotic stresses. Sci. Rep. 2018, 8, 2817. [Google Scholar] [CrossRef] [PubMed]
  25. Zhu, Q.; Dugardeyn, J.; Zhang, C.; Takenaka, M.; Kuhn, K.; Craddock, C.; Smalle, J.; Karampelias, M.; Denecke, J.; Peters, J.; et al. SLO2, a mitochondrial pentatricopeptide repeat protein affecting several RNA editing sites, is required for energy metabolism. Plant. J. 2012, 71, 836–849. [Google Scholar] [CrossRef] [Green Version]
  26. Yan, J.; Zhang, Q.; Guan, Z.; Wang, Q.; Li, L.; Ruan, F.; Lin, R.; Zou, T.; Yin, P. MORF9 increases the RNA-binding activity of PLS-type pentatricopeptide repeat protein in plastid RNA editing. Nat. Plants 2017, 3, 17037. [Google Scholar] [CrossRef]
  27. Takenaka, M.; Zehrmann, A.; Verbitskiy, D.; Kugelmann, M.; Hartel, B.; Brennicke, A. Multiple organellar RNA editing factor (MORF) family proteins are required for RNA editing in mitochondria and plastids of plants. Proc. Natl. Acad. Sci. USA 2012, 109, 5104–5109. [Google Scholar] [CrossRef] [Green Version]
  28. Luo, M.; Cai, M.; Zhang, J.; Li, Y.; Zhang, R.; Song, W.; Zhang, K.; Xiao, H.; Yue, B.; Zheng, Y.; et al. Functional divergencse and origin of the DAG-like gene family in plants. Sci. Rep. 2017, 7, 5688. [Google Scholar] [CrossRef]
  29. Zehrmann, A.; Hartel, B.; Glass, F.; Bayer-Csaszar, E.; Obata, T.; Meyer, E.; Brennicke, A.; Takenaka, M. Selective homo- and heteromer interactions between the multiple organellar RNA editing factor (MORF) proteins in Arabidopsis thaliana. J. Biol. Chem. 2015, 290, 6445–6456. [Google Scholar] [CrossRef]
  30. Du, L.; Zhang, J.; Qu, S.; Zhao, Y.; Su, B.; Lv, X.; Li, R.; Wan, Y.; Xiao, J. The Pentratricopeptide Repeat Protein Pigment-Defective Mutant2 is Involved in the Regulation of Chloroplast Development and Chloroplast Gene Expression in Arabidopsis. Plant Cell Physiol. 2017, 58, 747–759. [Google Scholar] [CrossRef]
  31. Xiao, H.; Xu, Y.; Ni, C.; Zhang, Q.; Zhong, F.; Huang, J.; Liu, W.; Peng, L.; Zhu, Y.; Hu, J. A rice dual-localized pentatricopeptide repeat protein is involved in organellar RNA editing together with OsMORFs. J. Exp. Bot. 2018, 69, 2923–2936. [Google Scholar] [CrossRef] [PubMed]
  32. Zhang, Z.; Cui, X.; Wang, Y.; Wu, J.; Gu, X.; Lu, T. The RNA Editing Factor WSP1 Is Essential for A Chloroplast Development in Rice. Mol. Plant 2017, 10, 86–98. [Google Scholar] [CrossRef] [PubMed]
  33. Bentolila, S.; Heller, W.P.; Sun, T.; Babina, A.M.; Friso, G.; Wijk, K.J.V.; Hanson, M.R. RIP1, a member of an Arabidopsis protein family, interacts with the protein RARE1 and broadly affects RNA editing. Proc. Natl. Acad. Sci. USA 2012, 109, 8372–8373. [Google Scholar] [CrossRef]
  34. Cannon, S.B.; Mitra, A.; Baumgarten, A.; Young, N.D.; May, G. The roles of segmental and tandem gene duplication in the evolution of large gene families in Arabidopsis thaliana. BMC Plant Biol. 2004, 4, 10. [Google Scholar] [CrossRef] [PubMed]
  35. Xu, Y.; Wang, Y.; Mattson, N.; Yang, L.; Jin, Q. Genome-wide analysis of the Solanum tuberosum (potato) trehalose-6-phosphate synthase (TPS) gene family: Evolution and differential expression during development and stress. BMC Genom. 2017, 18, 926. [Google Scholar] [CrossRef] [PubMed]
  36. Yang, H.-L.; Liu, Y.-J.; Wang, C.-L.; Zeng, Q.-Y. Molecular evolution of trehalose-6-phosphate synthase (TPS) gene family in Populus, Arabidopsis and rice. PLoS ONE 2012, 7, e42438. [Google Scholar] [CrossRef] [PubMed]
  37. Ma, B.; Yuan, Y.; Gao, M.; Xing, L.; Li, C.; Li, M.; Ma, F. Genome-wide Identification, Classification, Molecular Evolution and Expression Analysis of Malate Dehydrogenases in Apple. Int. J. Mol. Sci. 2018, 19, 3312. [Google Scholar] [CrossRef]
  38. Xiong, J.; Tao, T.; Luo, Z.; Yan, S.; Liu, Y.; Yu, X.; Liu, G.; Xia, H.; Luo, L. RNA Editing Responses to Oxidative Stress between a Wild Abortive Type Male-Sterile Line and Its Maintainer Line. Front. Plant Sci. 2017, 8, 2023. [Google Scholar] [CrossRef]
  39. Rodrigues, N.F.; Fonseca, G.C.; Kulcheski, F.R.; Margis, R. Salt stress affects mRNA editing in soybean chloroplasts. Genet. Mol. Biol. 2017, 40, 200–208. [Google Scholar] [CrossRef] [Green Version]
  40. Yamburenko, M.V.; Zubo, Y.O.; Vanková, R.; Kusnetsov, V.V.; Kulaeva, O.N.; Börner, T. Abscisic acid represses the transcription of chloroplast genes. J. Exp. Bot. 2013, 64, 4491–4502. [Google Scholar] [CrossRef]
  41. Kurihara-Yonemoto, S.; Handa, H. Low temperature affects the processing pattern and RNA editing status of the mitochondrial cox2 transcripts in wheat. Curr. Genet. 2001, 40, 203–208. [Google Scholar] [CrossRef]
  42. Nakajima, Y.; Mulligan, R.M. Heat stress results in incomplete C-to-U editing of maize chloroplast mRNAs and correlates with changes in chloroplast transcription rate. Curr. Genet. 2001, 40, 209–213. [Google Scholar] [CrossRef] [PubMed]
  43. Tan, J.; Tan, Z.; Wu, F.; Sheng, P.; Heng, Y.; Wang, X.; Ren, Y.; Wang, J.; Guo, X.; Zhang, X.; et al. A novel chloroplast-localized pentatricopeptide repeat protein involved in splicing affects chloroplast development and abiotic stress response in rice. Mol. Plant 2014, 7, 1329–1349. [Google Scholar] [CrossRef] [PubMed]
  44. Chen, G.; Zou, Y.; Hu, J.; Ding, Y. Genome-wide analysis of the rice PPR gene family and their expression profiles under different stress treatments. BMC Genom. 2018, 19, 720. [Google Scholar] [CrossRef] [PubMed]
  45. Chatterjee, M.; Sparvoli, S.; Edmunds, C.; Garosi, P.; Findlay, K.; Martin, C. DAG, a gene required for chloroplast differentiation and palisade development in Antirrhinum majus. EMBO J. 1996, 15, 4194–4207. [Google Scholar] [CrossRef] [PubMed]
  46. Bisanz, C.; Begot, L.; Carol, P.; Perez, P.; Bligny, M.; Pesey, H.; Gallois, J.L.; Lerbs-Mache, S.; Mache, R. The Arabidopsis nuclear DAL gene encodes a chloroplast protein which is required for the maturation of the plastid ribosomal RNAs and is essential for chloroplast differentiation. Plant Mol. Biol. 2003, 51, 651–663. [Google Scholar] [CrossRef] [PubMed]
  47. Ciuzan, O.; Hancock, J.; Pamfil, D.; Wilson, I.; Ladomery, M. The evolutionarily conserved multifunctional glycine-rich RNA-binding proteins play key roles in development and stress adaptation. Physiol. Plant 2015, 153, 1–11. [Google Scholar] [CrossRef] [PubMed]
  48. Condit, C.M.; McLean, B.G.; Meagher, R.B. Characterization of the expression of the petunia glycine-rich protein-1 gene product. Plant Physiol. 1990, 93, 596–602. [Google Scholar] [CrossRef]
  49. Spicer, R. Symplasmic networks in secondary vascular tissues: Parenchyma distribution and activity supporting long-distance transport. J. Exp. Bot. 2014, 65, 1829–1848. [Google Scholar] [CrossRef]
  50. Wang, C.; Liu, S.; Dong, Y.; Zhao, Y.; Geng, A.; Xia, X.; Yin, W. PdEPF1 regulates water-use efficiency and drought tolerance by modulating stomatal density in poplar. Plant Biotechnol. J. 2016, 14, 849–860. [Google Scholar] [CrossRef]
  51. Hunter, S.; Apweiler, R.; Attwood, T.K.; Bairoch, A.; Bateman, A.; Binns, D.; Bork, P.; Das, U.; Daugherty, L.; Duquenne, L. InterPro: The integrative protein signature database. Nucleic Acids Res. 2009, 37, D211–D215. [Google Scholar] [CrossRef] [PubMed]
  52. Finn, R.D.; Bateman, A.; Clements, J.; Coggill, P.; Eberhardt, R.Y.; Eddy, S.R.; Heger, A.; Hetherington, K.; Holm, L.; Mistry, J.; et al. Pfam: The protein families database. Nucleic Acids Res. 2014, 42, D222–D230. [Google Scholar] [CrossRef]
  53. Goodstein, D.M.; Shu, S.; Howson, R.; Neupane, R.; Hayes, R.D.; Fazo, J.; Mitros, T.; Dirks, W.; Hellsten, U.; Putnam, N. Phytozome: A comparative platform for green plant genomics. Nucleic Acids Res. 2012, 40, D1178–D1186. [Google Scholar] [CrossRef] [PubMed]
  54. Bailey, T.L.; Williams, N.; Misleh, C.; Li, W.W. MEME: Discovering and analyzing DNA and protein sequence motifs. Nucleic Acids Res. 2006, 34, W369. [Google Scholar] [CrossRef] [PubMed]
  55. Emanuelsson, O.; Brunak, S.; Von, H.G.; Nielsen, H. Locating proteins in the cell using TargetP, SignalP and related tools. Nat. Protoc. 2007, 2, 953–971. [Google Scholar] [CrossRef] [PubMed]
  56. Horton, P.; Park, K.J.; Obayashi, T.; Fujita, N.; Harada, H.; Adamscollier, C.J.; Nakai, K. WoLF PSORT: Protein localization predictor. Nucleic Acids Res. 2007, 35, 585–587. [Google Scholar] [CrossRef]
  57. Kumar, S.; Stecher, G.; Tamura, K. MEGA7: Molecular Evolutionary Genetics Analysis Version 7.0 for Bigger Datasets. Mol. Biol. Evol. 2016, 33, 1870–1874. [Google Scholar] [CrossRef] [PubMed]
  58. Letunic, I.; Bork, P. Interactive tree of life (iTOL) v3: An online tool for the display and annotation of phylogenetic and other trees. Nucleic Acids Res. 2016, 44, W242–W245. [Google Scholar] [CrossRef]
  59. Sandberg, G. The Populus Genome Integrative Explorer (PopGenIE): A new resource for exploring the Populus genome. New Phytol. 2009, 182, 1013–1025. [Google Scholar] [CrossRef]
  60. Liu, R.H.; Meng, J.L. MapDraw: A microsoft excel macro for drawing genetic linkage maps based on given genetic linkage data. Yi Chuan 2003, 25, 317–321. [Google Scholar]
  61. Wang, Y.; Xu, L.; Thilmony, R.; You, F.M.; Gu, Y.Q.; Colemanderr, D. PIECE 2.0: An update for the plant gene structure comparison and evolution database. Nucleic Acids Res. 2017, 45, 1015–1020. [Google Scholar] [CrossRef] [PubMed]
  62. Wang, Y.; Tang, H.; Debarry, J.D.; Tan, X.; Li, J.; Wang, X.; Lee, T.H.; Jin, H.; Marler, B.; Guo, H.; et al. MCScanX: A toolkit for detection and evolutionary analysis of gene synteny and collinearity. Nucleic Acids Res. 2012, 40, e49. [Google Scholar] [CrossRef] [PubMed]
  63. Krzywinski, M.; Schein, J.; Birol, I.; Connors, J.; Gascoyne, R.; Horsman, D.; Jones, S.J.; Marra, M.A. Circos: An information aesthetic for comparative genomics. Genome Res. 2009, 19, 1639–1645. [Google Scholar] [CrossRef] [PubMed] [Green Version]
  64. Liu, C.; Xie, T.; Chen, C.; Luan, A.; Long, J.; Li, C.; Ding, Y.; He, Y. Genome-wide organization and expression profiling of the R2R3-MYB transcription factor family in pineapple (Ananas comosus). BMC Genom. 2017, 18, 503. [Google Scholar] [CrossRef]
  65. Yang, Z.; Nielsen, R. Codon-substitution models for detecting molecular adaptation at individual sites along specific lineages. Mol. Biol. Evol. 2002, 19, 908–917. [Google Scholar] [CrossRef] [PubMed]
  66. Yang, Z.; Nielsen, R. Synonymous and nonsynonymous rate variation in nuclear genes of mammals. J. Mol. Evol. 1998, 46, 409–418. [Google Scholar] [CrossRef] [PubMed] [Green Version]
  67. Yang, Z. PAML 4: Phylogenetic analysis by maximum likelihood. Mol. Biol. Evol. 2007, 24, 1586–1591. [Google Scholar] [CrossRef]
  68. Yang, Z.; Wong, W.S.; Nielsen, R. Bayes empirical bayes inference of amino acid sites under positive selection. Mol. Biol. Evol. 2005, 22, 1107–1118. [Google Scholar] [CrossRef]
  69. Untergasser, A.; Cutcutache, I.; Koressaar, T.; Ye, J.; Faircloth, B.C.; Remm, M.; Rozen, S.G. Primer3—New capabilities and interfaces. Nucleic Acids Res. 2012, 40, e115. [Google Scholar] [CrossRef]
  70. Livak, K.J.; Schmittgen, T.D. Analysis of Relative Gene Expression Data Using Real-Time Quantitative PCR and the 2(-Delta Delta C(T)) Method. Methods 2001, 25, 402–408. [Google Scholar] [CrossRef]
Figure 1. Poplar multiple organellar RNA editing factor (MORF) proteins and their conserved motifs. (A) Multiple sequences alignment of A. thaliana and P. trichocarpa MORF proteins was carried out using MUSCLE, and the Neighbor-Joining (NJ) tree was built using MEGA v7.0. And the chloroplast, mitochondrial or nuclei transit peptides of poplar MORF proteins were predicted using TargetP (http://www.cbs.dtu.dk/services/TargetP/) and Wolf PSORT (http://wolfpsort.org/). M, mitochondria; C, chloroplast; Nucl, nuclei. Green diamond, MORF9 and PtrMORF9; Blue triangle, MORF1, PtrMORF1.1, PtrMORF1.2 and PtrMORF1.3; Red circle, MORF2, PtrMORF2.1 and PtrMORF2.2; Orange circle, MORF3 and PtrMORF3; Orange diamond, MORF8, PtrMORF8.1 and PtrMORF8.2. Local meant the gene where was located in (B). Alignment of conserved MORF domains in poplar MORF proteins was conducted using DNAMAN (https://www.lynnon.com/). Lake blue, Motif1; purple, Motif2; red, Motif3; green, Motif4. (C,D) Putative motifs were explored using the MEME server with the parameters of between 15 and 50 aa in length and sharing of each motif among all PtrMORF proteins.
Ijms 20 01425 g001
Figure 2. Gene structures of poplar MORF genes. (A,B) The gene structures of PtrMORF genes were built using GSDraw (http://wheat.pw.usda.gov/piece/GSDraw.php) by submitting both genomic sequences obtained from PopGenIE (http://popgenie.org/) and coding sequences (CDS) of PtrMORF genes.
Ijms 20 01425 g002
Figure 3. Phylogenetic relationships of the MORF gene family members from poplar (PtrMORFs) Arabidopsis lyrata, Arabidopsis thaliana, Brachypodium distachyon, Glycine max, Oryza sativa Japonica, Prunus persica, and Vitis vinifera. The phylogenetic tree was constructed with MEGA 7.0 (http://www.megasofware.net/mega.html/) program by the neighbor-joining method.
Ijms 20 01425 g003
Figure 4. Chromosomal locations of Populus MORF family members. The chromosomal locations of the MORF genes were mapped with MapDraw program. The number to the left of each chromosome represented the size of the chromosome in Mbp.
Ijms 20 01425 g004
Figure 5. Interchromosomal relationships of MORF genes. (A) Interchromosomal relationships of MORF genes in poplar. (B) Interchromosomal relationships of MORF genes in A. thaliana. Black lines indicated all synteny blocks in the Populus or A. thaliana genome and the red indicated synteny blocks where MORF duplicated gene pairs were. The chromosome number was indicated at the bottom of each chromosome and each cell on the outside of chromosomes represented 5 Mbp in Populus and 1.5 Mbp in A. thaliana.
Ijms 20 01425 g005
Figure 6. Synteny analysis of MORF genes between poplar and two representative plant species. (A,B) Gray lines in the background indicate the collinear blocks within poplar and other plant genomes, while the red lines highlight the syntenic MORF gene pairs. (C) The phylogenetic relationship of 7 members of four pairs. (D) The Bayes Empirical Bayes (BEB) probabilities for sites in the positively selected class (ω > 1). The x-axis denotes position in the amino acid alignment.
Ijms 20 01425 g006
Figure 7. Quantitative RT-PCR analysis of PtrMORF genes expression in response to drought stress. 0d, 3d, 6d, 9d, and 12d, drought for 0, 3, 6, 9, and 12 days in a greenhouse environment, respectively. Data were normalized to UBQ gene. The sample without drought treatment was defined as 1 in the figure. The data were presented as the mean ± SE of three separate measurements. Asterisks denote significant differences: * p < 0.05; ** p < 0.01.
Ijms 20 01425 g007
Figure 8. Expressions of three plastid (RPS14, PSBF, and NDHB) and three mitochondrial genes (atp6, atp9, and ccmC) in poplar on the 0, 3rd, 6th, 9th, and twelfth day after drought tolerance. Data were normalized to UBQ gene. The sample without drought treatment was defined as 1 in the figure. The data were presented as the mean ± SE of three separate measurements. Asterisks denote significant differences: * p < 0.05; ** p < 0.01.
Ijms 20 01425 g008
Figure 9. Expression analysis of 9 MORF genes in eight representative samples by qRT-PCR. Eight various tissues including buds (B), freshly expanded leaves (FL), expanding young leaves (YL), mature leaves (ML), old leaves (OL), cortex (C), xylem (X), and roots (R). Data were normalized to UBQ gene. The buds were defined as 1 in the figure. The data were presented as the mean ± SE of three separate measurements. Asterisks denote significant differences: * p < 0.05; ** p < 0.01.
Ijms 20 01425 g009
Table 1. Parameter estimates and likelihood ratio tests for the branch model.
ModelP aLnL bEstimates of ParametersΔLRT cdfpPositively Selected Sites
M0 (one ratio model)1−1366.204ω = 0.055---None
Branch-specific model (Model 2: two ratios)
Estimate ω for I2−1366.136ωI1 = 0.067, ω0 = 0.051Model 2 vs. M0: 0.13610.712-
Estimate ω for II2−1357.726ωII1 = 0.177, ω0 = 0.028Model 2 vs. M0: 16.95610.000-
Estimate ω for III2−1361.616ωIII1 = 0.018, ω0 = 0.079Model 2 vs. M0: 9.17610.002-
Estimate ω for IV2−1363.519ωIV1 = 0.010, ω0 = 0.083Model 2 vs. M0: 5.37010.002-
a: The number of free parameters for the ω ratios; b: lnL value; c: likelihood ratio test.
Table 2. Parameter estimates and likelihood ratio tests for the site model.
ModelP aLnL bEstimates of ParametersΔLRT cdfpPositively Selected Sites
M0 (one ratio model)1−1366.204ω = 0.0546---None
Site-specific models
M1 (K = 2)1−1363.770p0 = 0.926, (p1 = 0.074)---Not allowed
M2 (K = 3)4−1363.770p0 = 0.926, p1 = 0.008, (p2 = 0.066), ω2 = 1.000M2 vs. M1: 0.00021.000None
M3 (K = 8)5−1346.619p0 = 0.485, p1 = 0.001, p2 = 0.192, p3 = 0.174, p4 = 0.029, p5 = 0.040, p6 = 0.074, p7 = 0.007; ω0 = 0.006,
ω1 = 0.062, ω2 = 0.062, ω3 = 0.062, ω4 = 0.266,
ω5 = 0.266, ω6 = 0.266, ω7 = 0.266
M3 vs. M0: 39.170140.000None
M72−1347.154p = 0.441, q = 6.096---Not allowed
M84−1347.154p0 = 0.999, p = 0.441, q = 6.096, (p1 = 0.000), ω = 1.000M8 vs. M7: 0.00021.000None
a: The number of free parameters for the ω ratios; b: lnL value; c: likelihood ratio test.
Table 3. Parameter estimates and likelihood ratio tests for the branch-site model.
ModelP aLnL bEstimates of ParametersΔLRT cdfpPositively Selected Sites
M1: Neutral1−1363.770p0 = 0.926, (p1 = 0.074)----
Branch-site models
Model A (I)3−1361.803p0 = 0.929, p1 = 0.000, (p2a + p2b = 0.071), ω2 = 1.706Model A vs M1: 3.93421.40 × 10−1-
Model A (II)3−1346.578p0 = 0.684, p1 = 0.018, (p2a + p2b = 0.297), ω2 = 1.053Model A vs M1: 34.38423.40 × 10−8Site for foreground lineage: 4 (at p > 0.95)
Model A (III)3−1363.521p0 = 0.927, p1 = 0.057, (p2a + p2b = 0.015), ω2 = 17.935Model A vs M1: 0.50027.78 × 10−1-
Model A (IV)3−1363.522p0 = 0.925, p1 = 0.064, (p2a + p2b = 0.012), ω2 = 2.630Model A vs M1: 0.49627.81 × 10−1-
a: The number of free parameters for the ω ratios; b: lnL value; c: likelihood ratio test.

