Differences of the Structure of Immune Regulatory Cell Populations between Cellular Material from Sonographically Detected Focal Thyroid Lesions and Peripheral Blood in Humans


 , and
, and
Abstract
:1. Introduction
2. Results
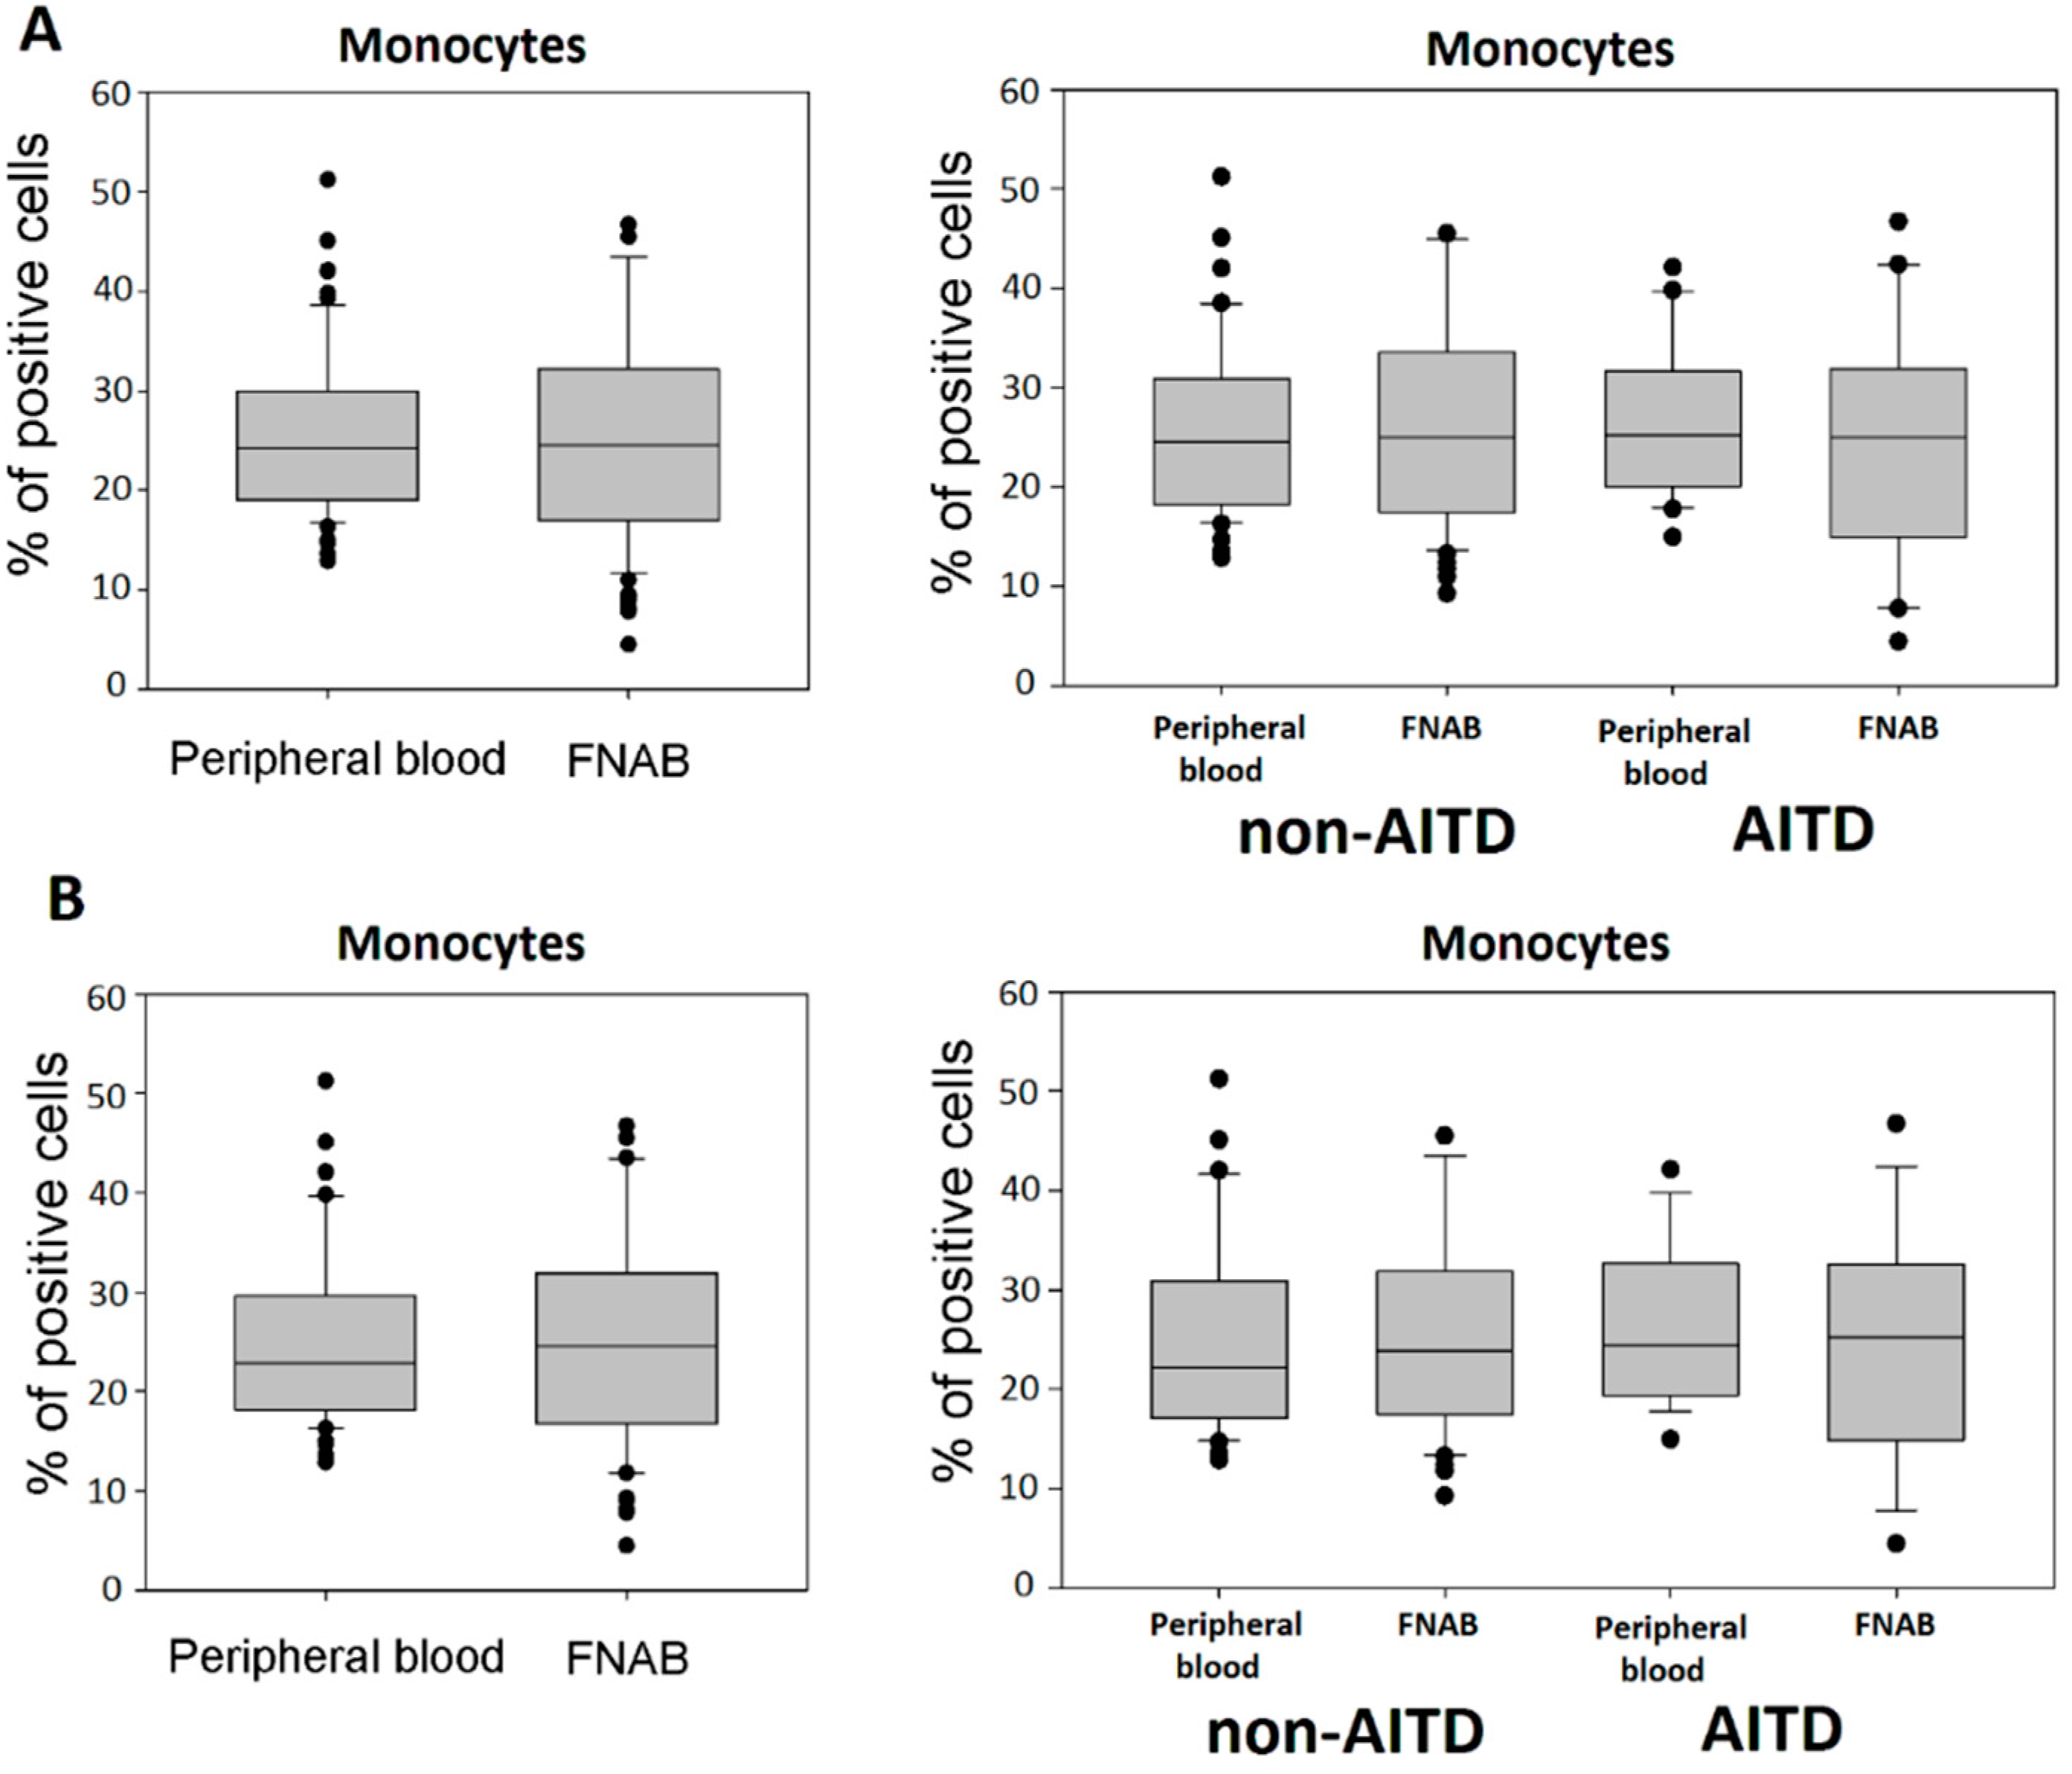
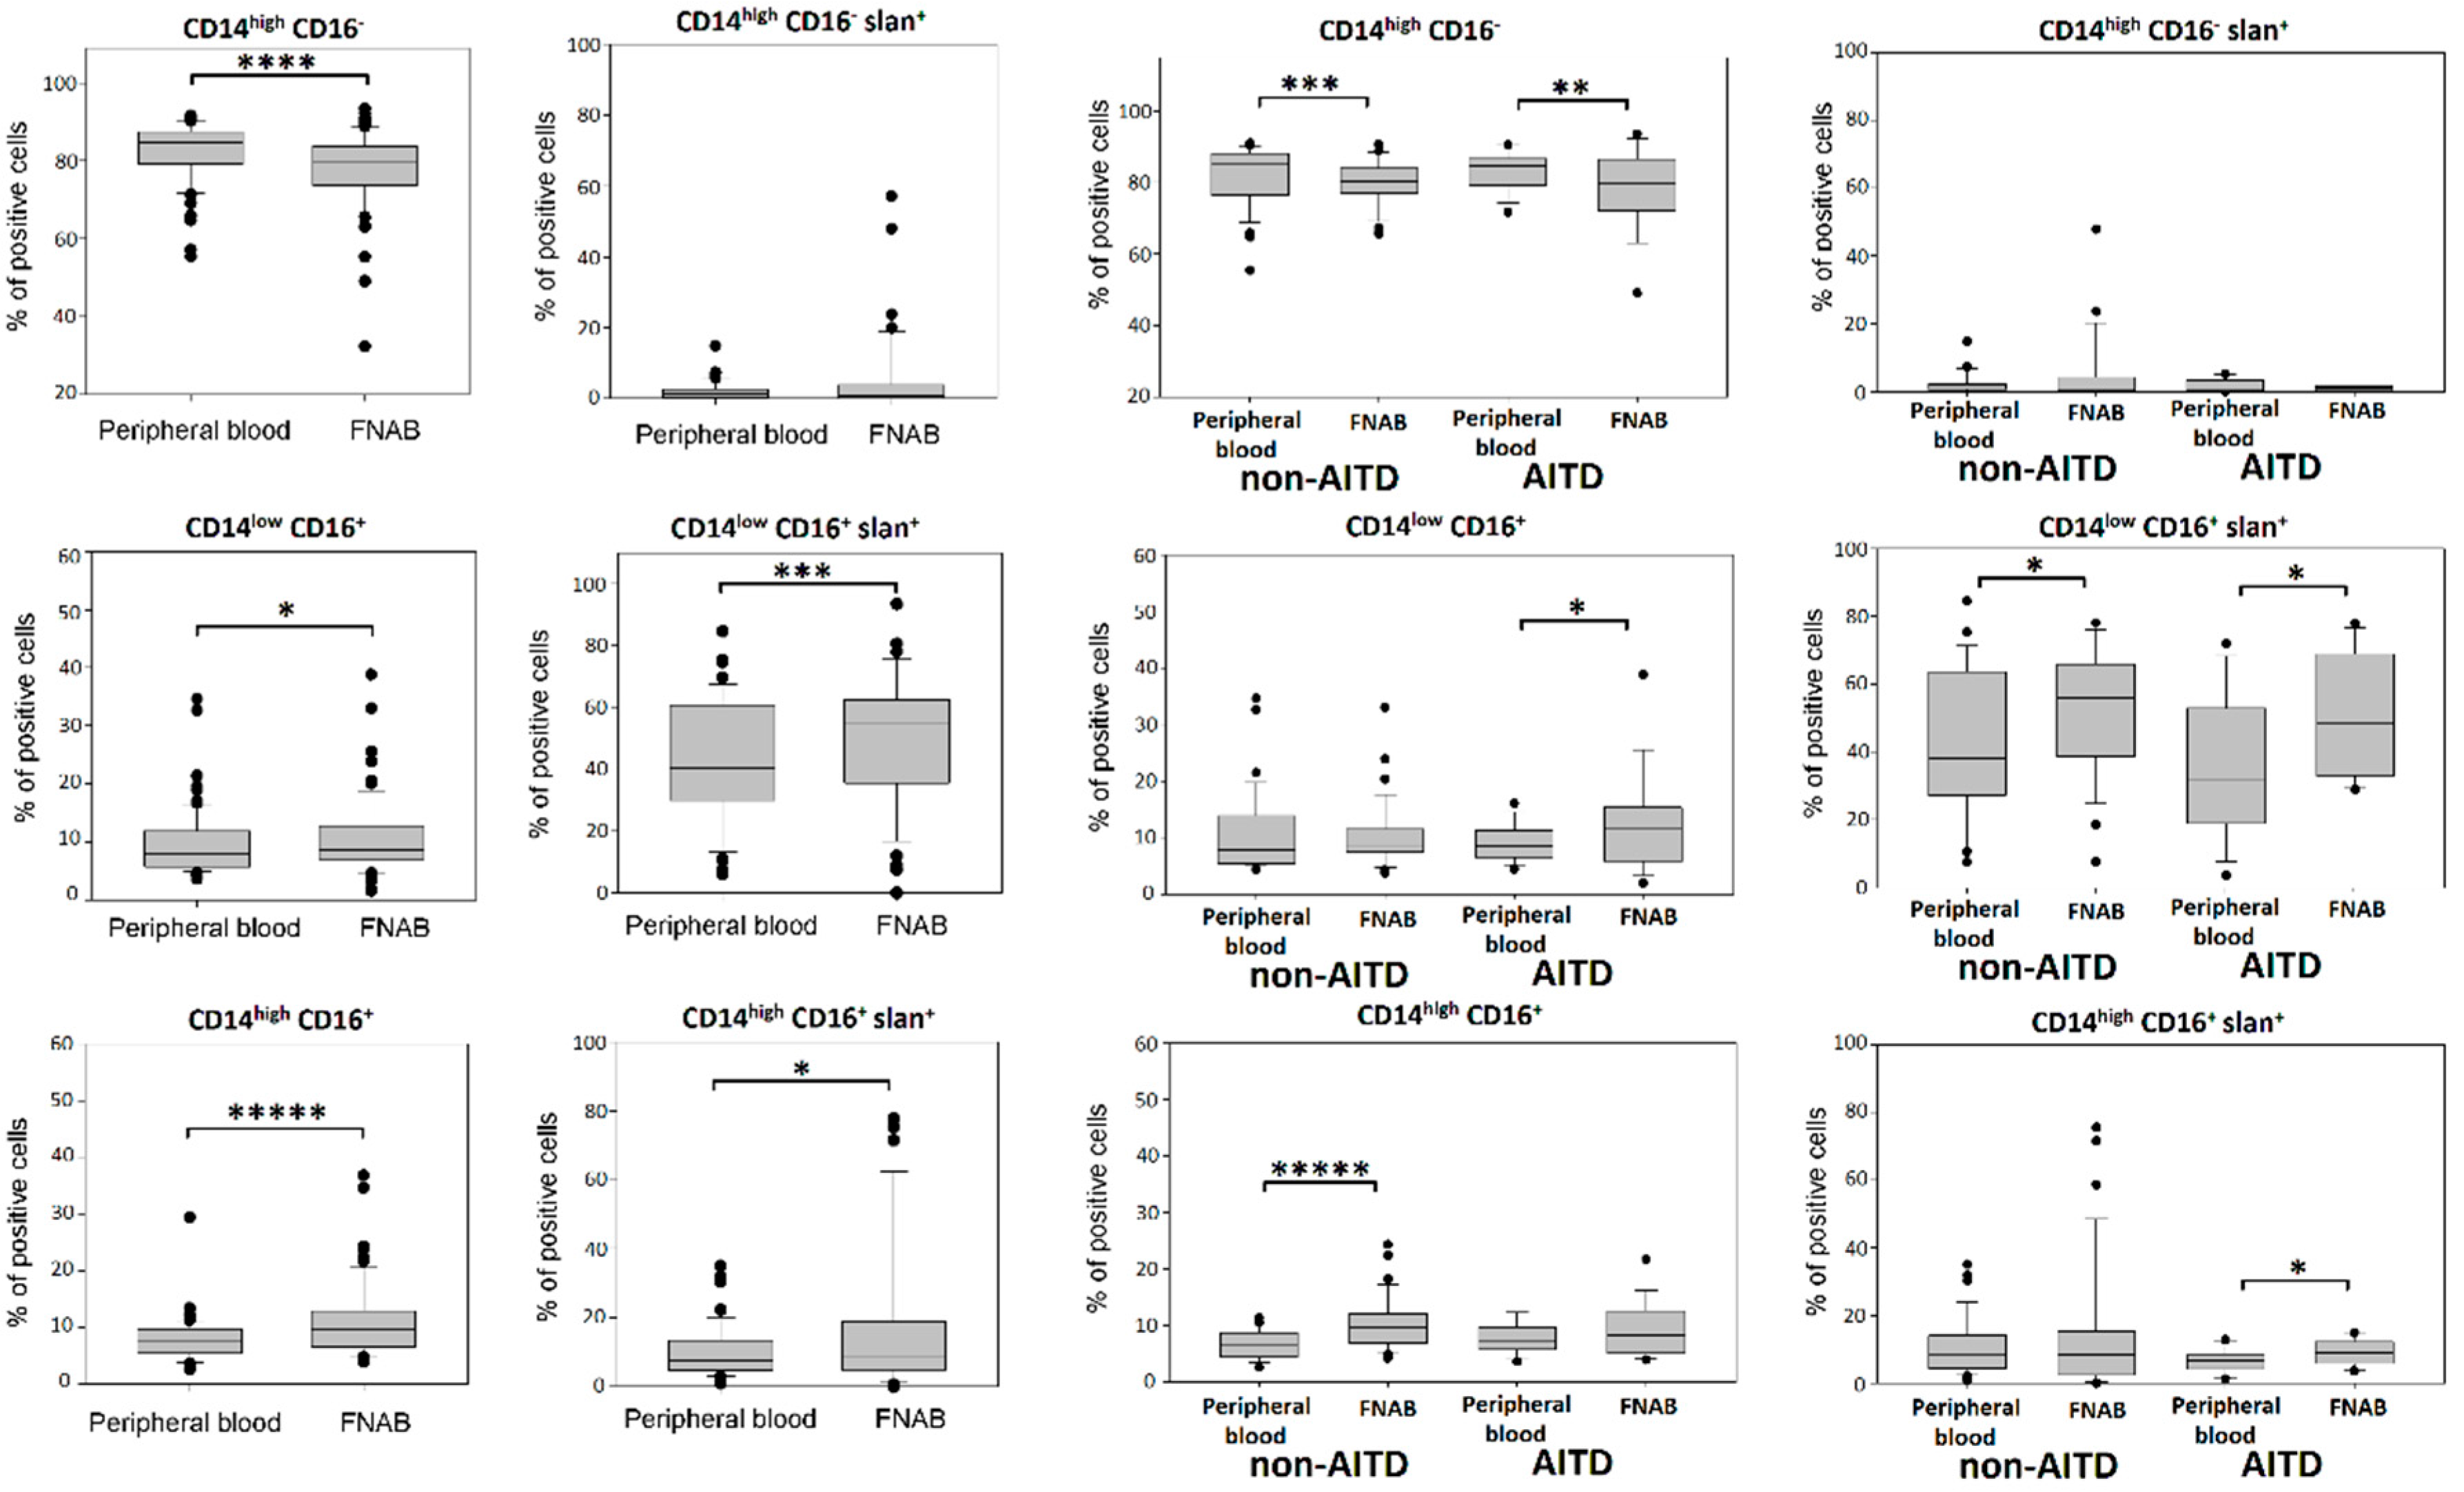
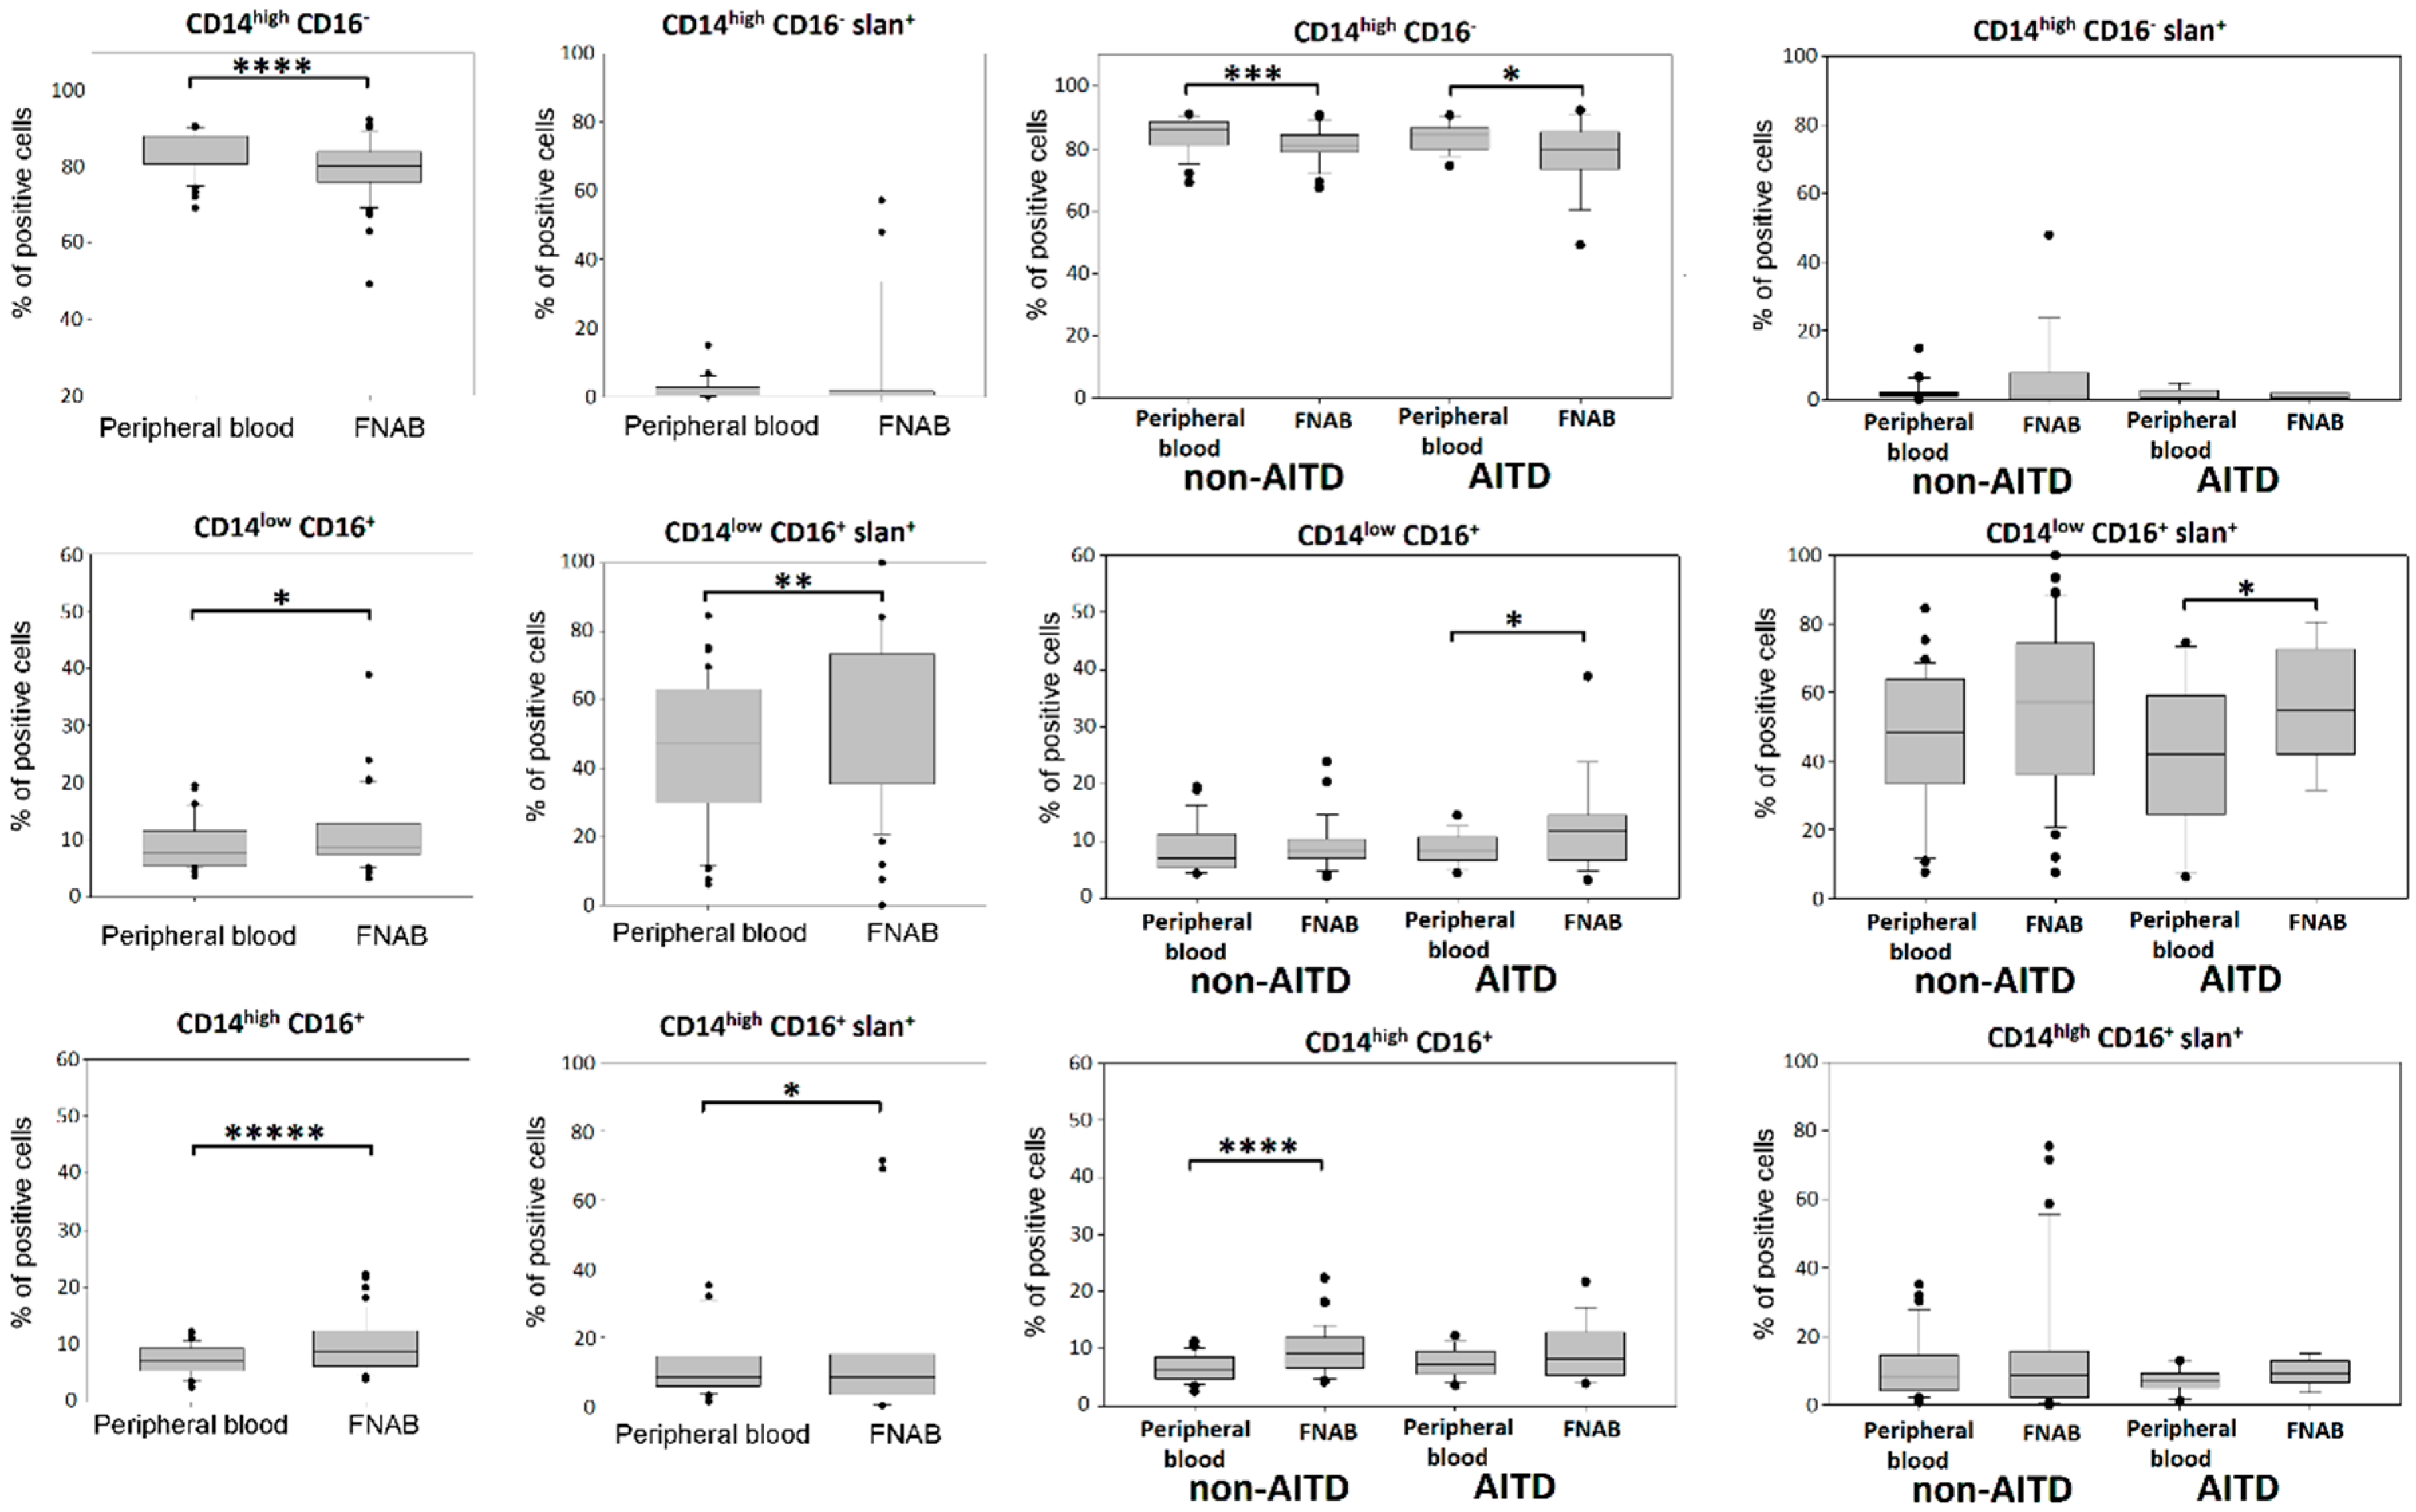
2.1. Monocytes
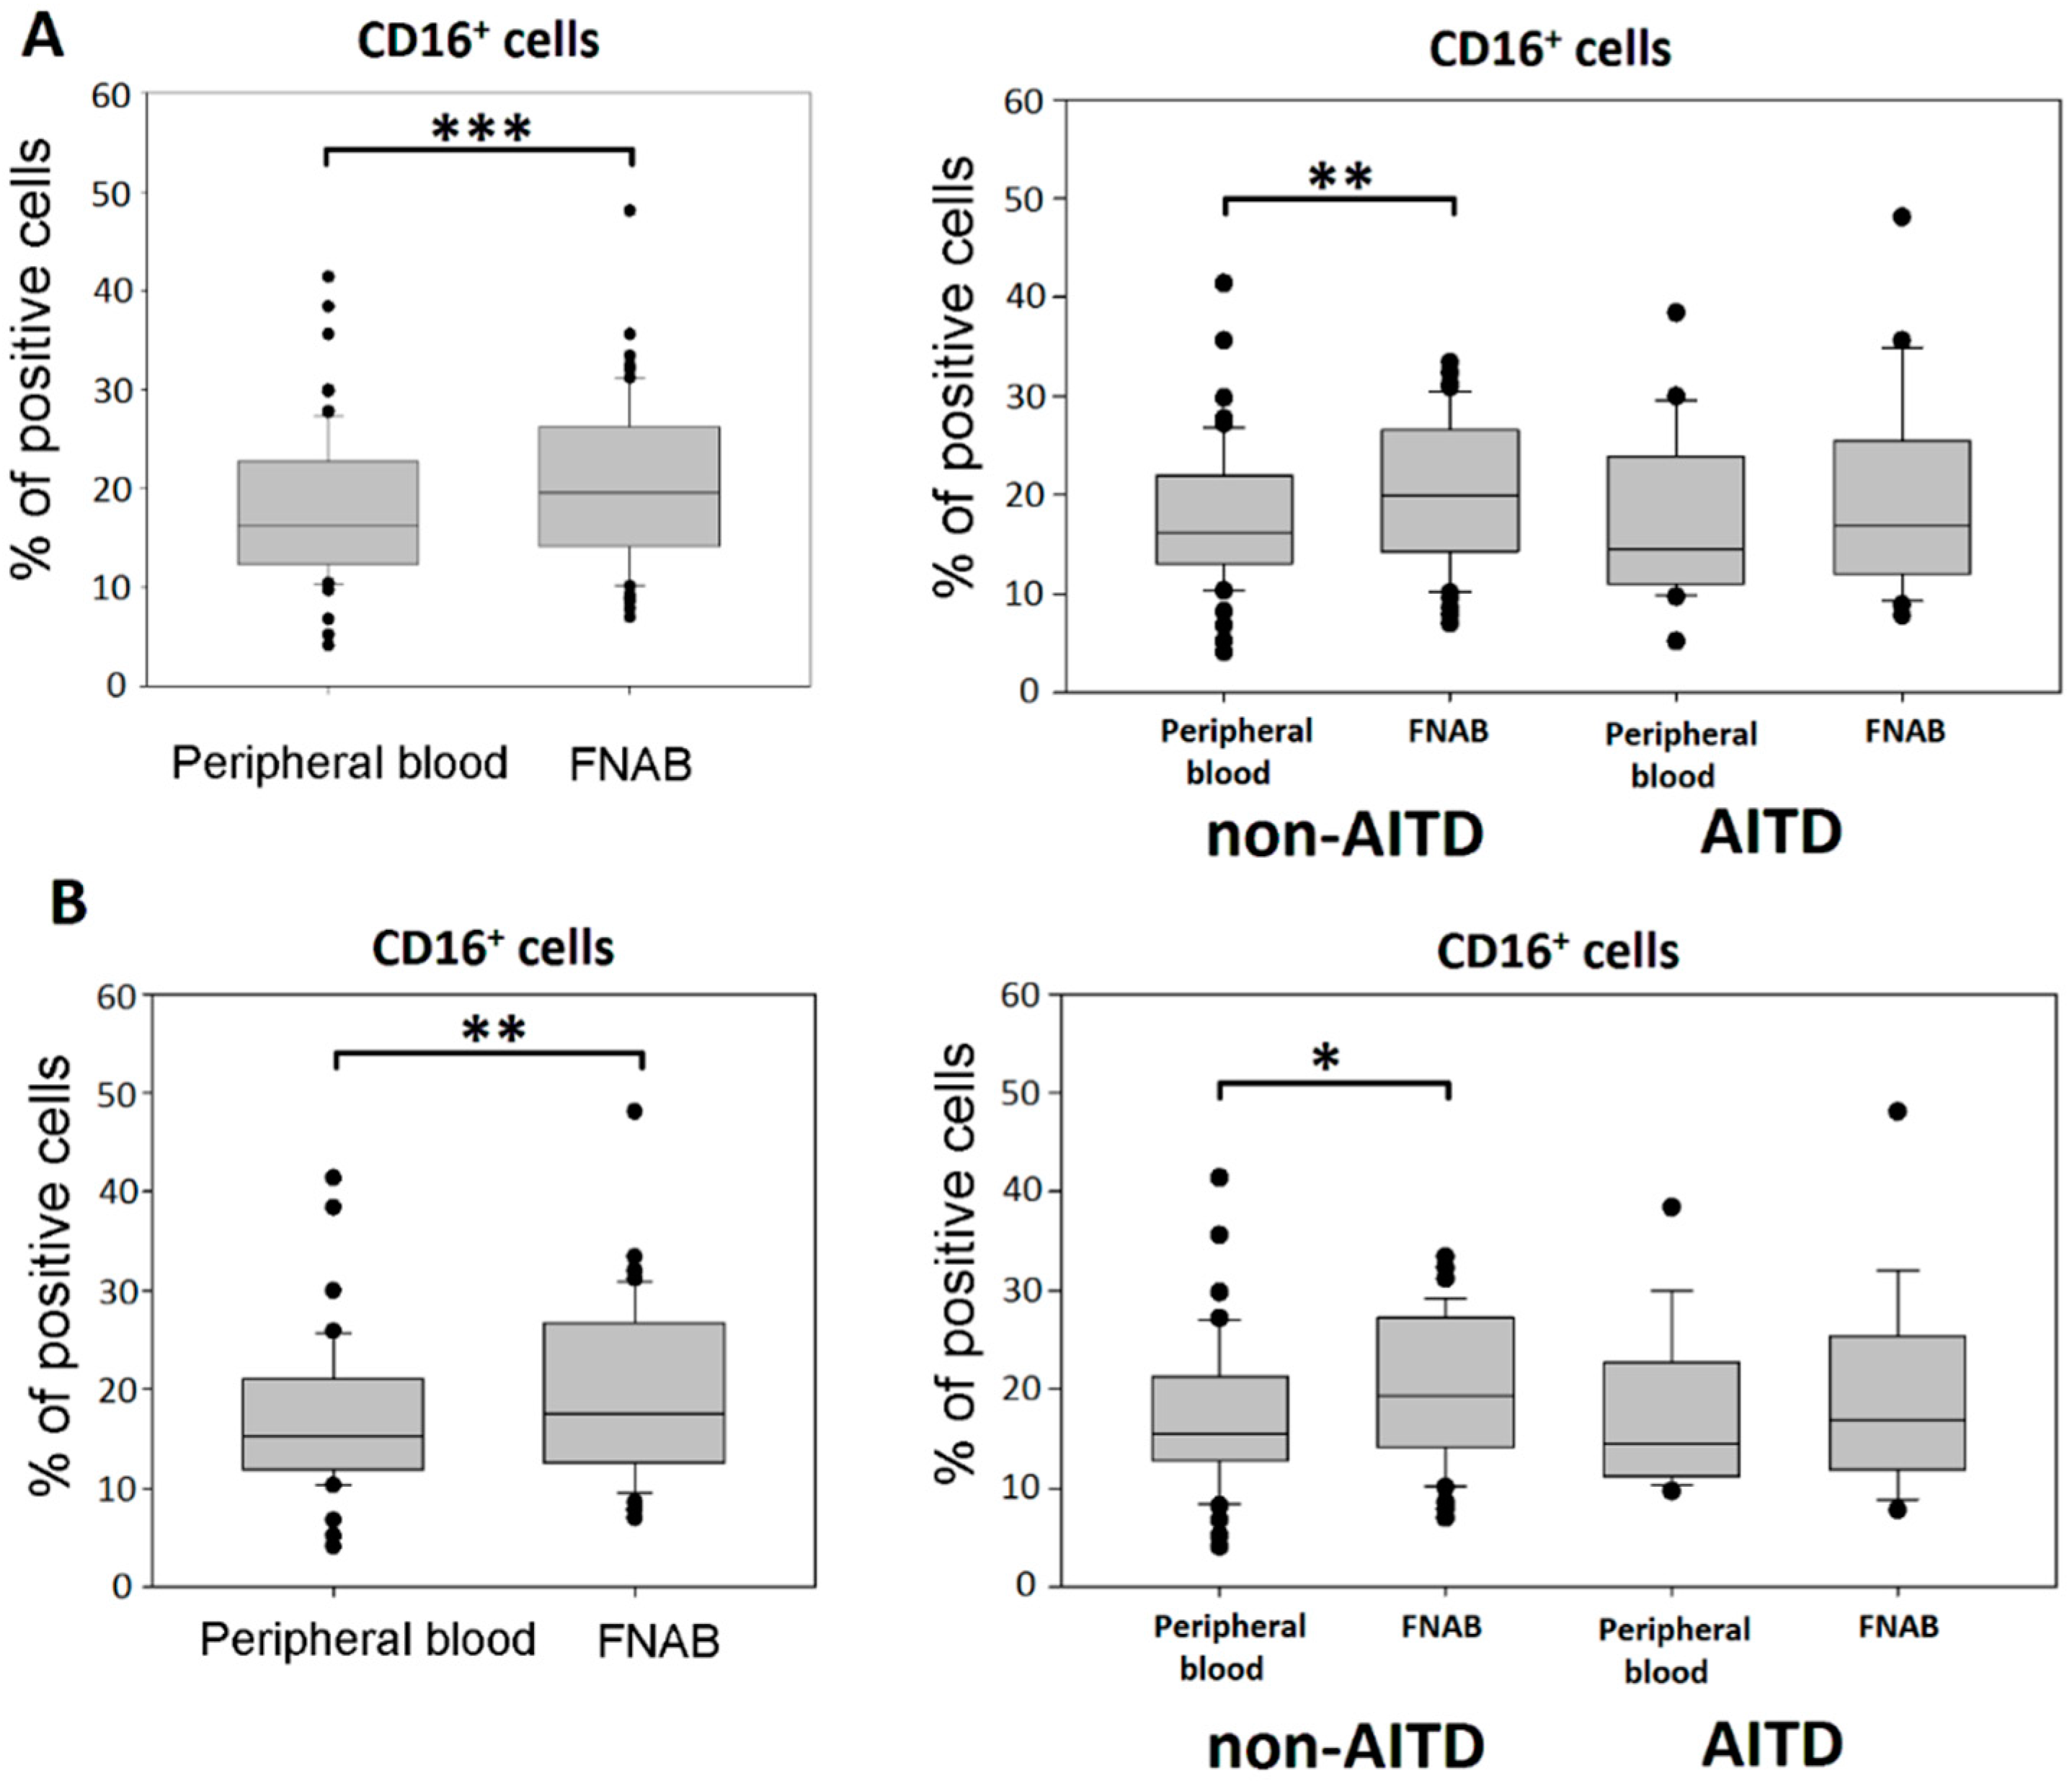
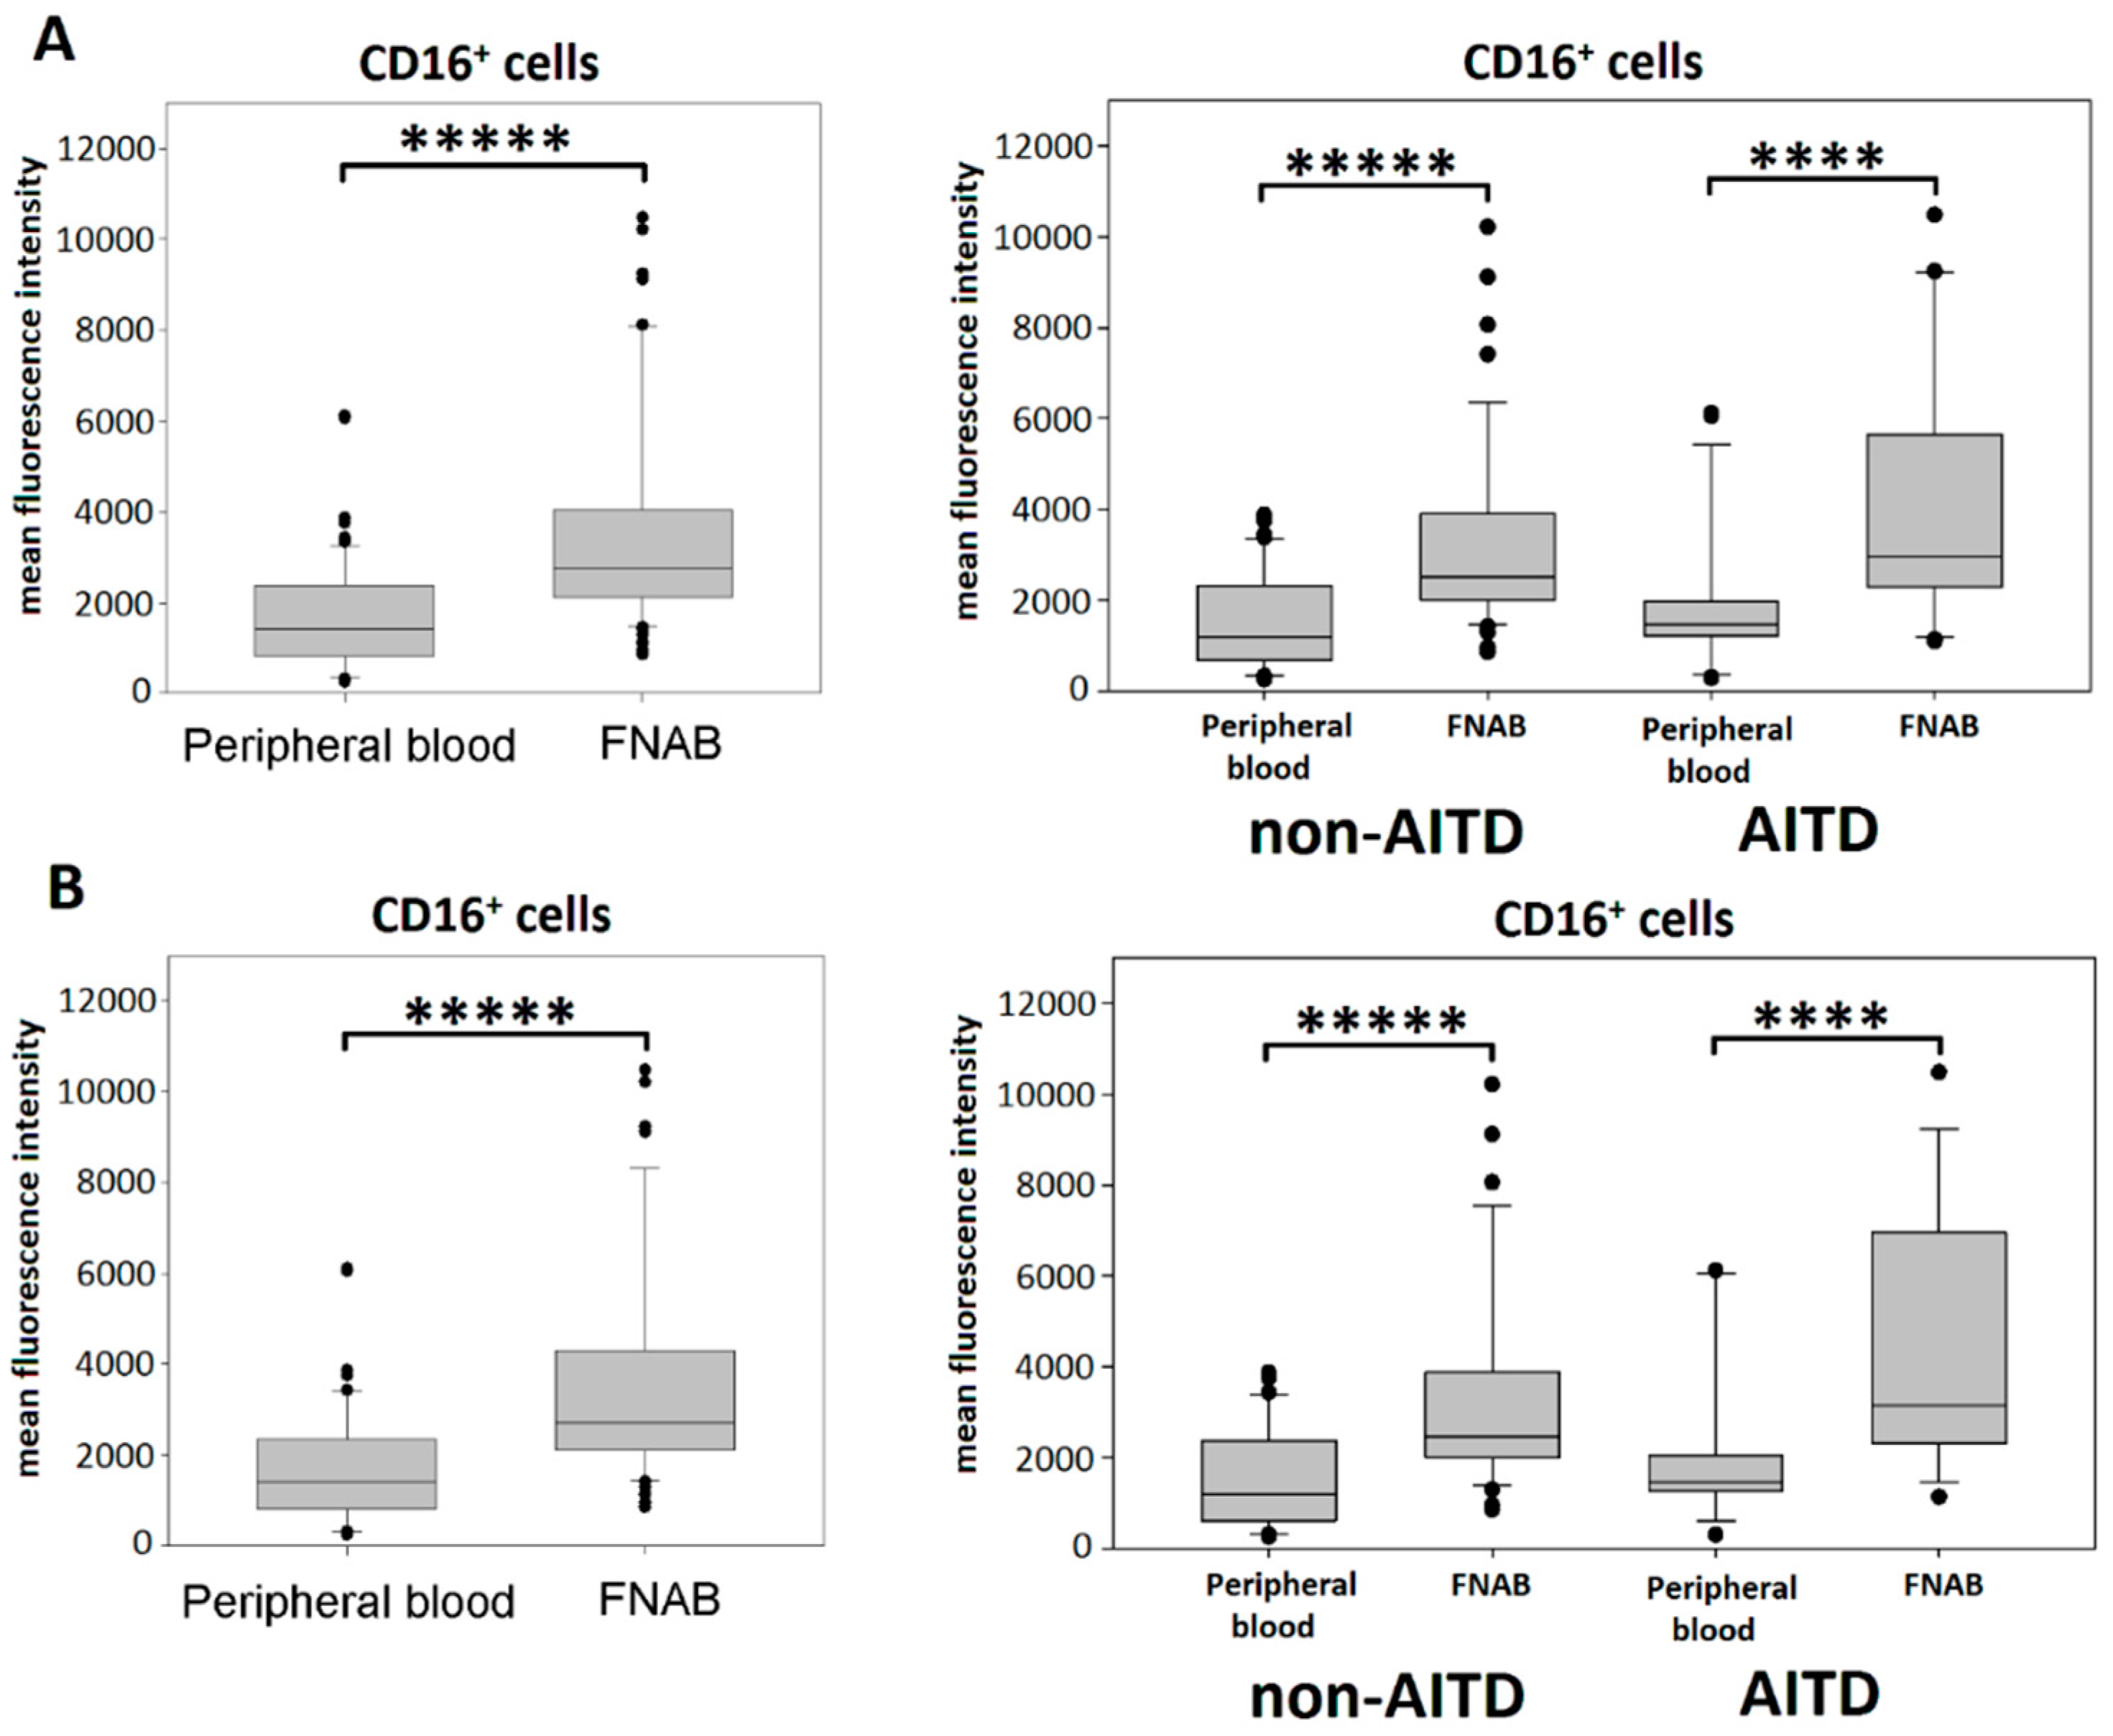
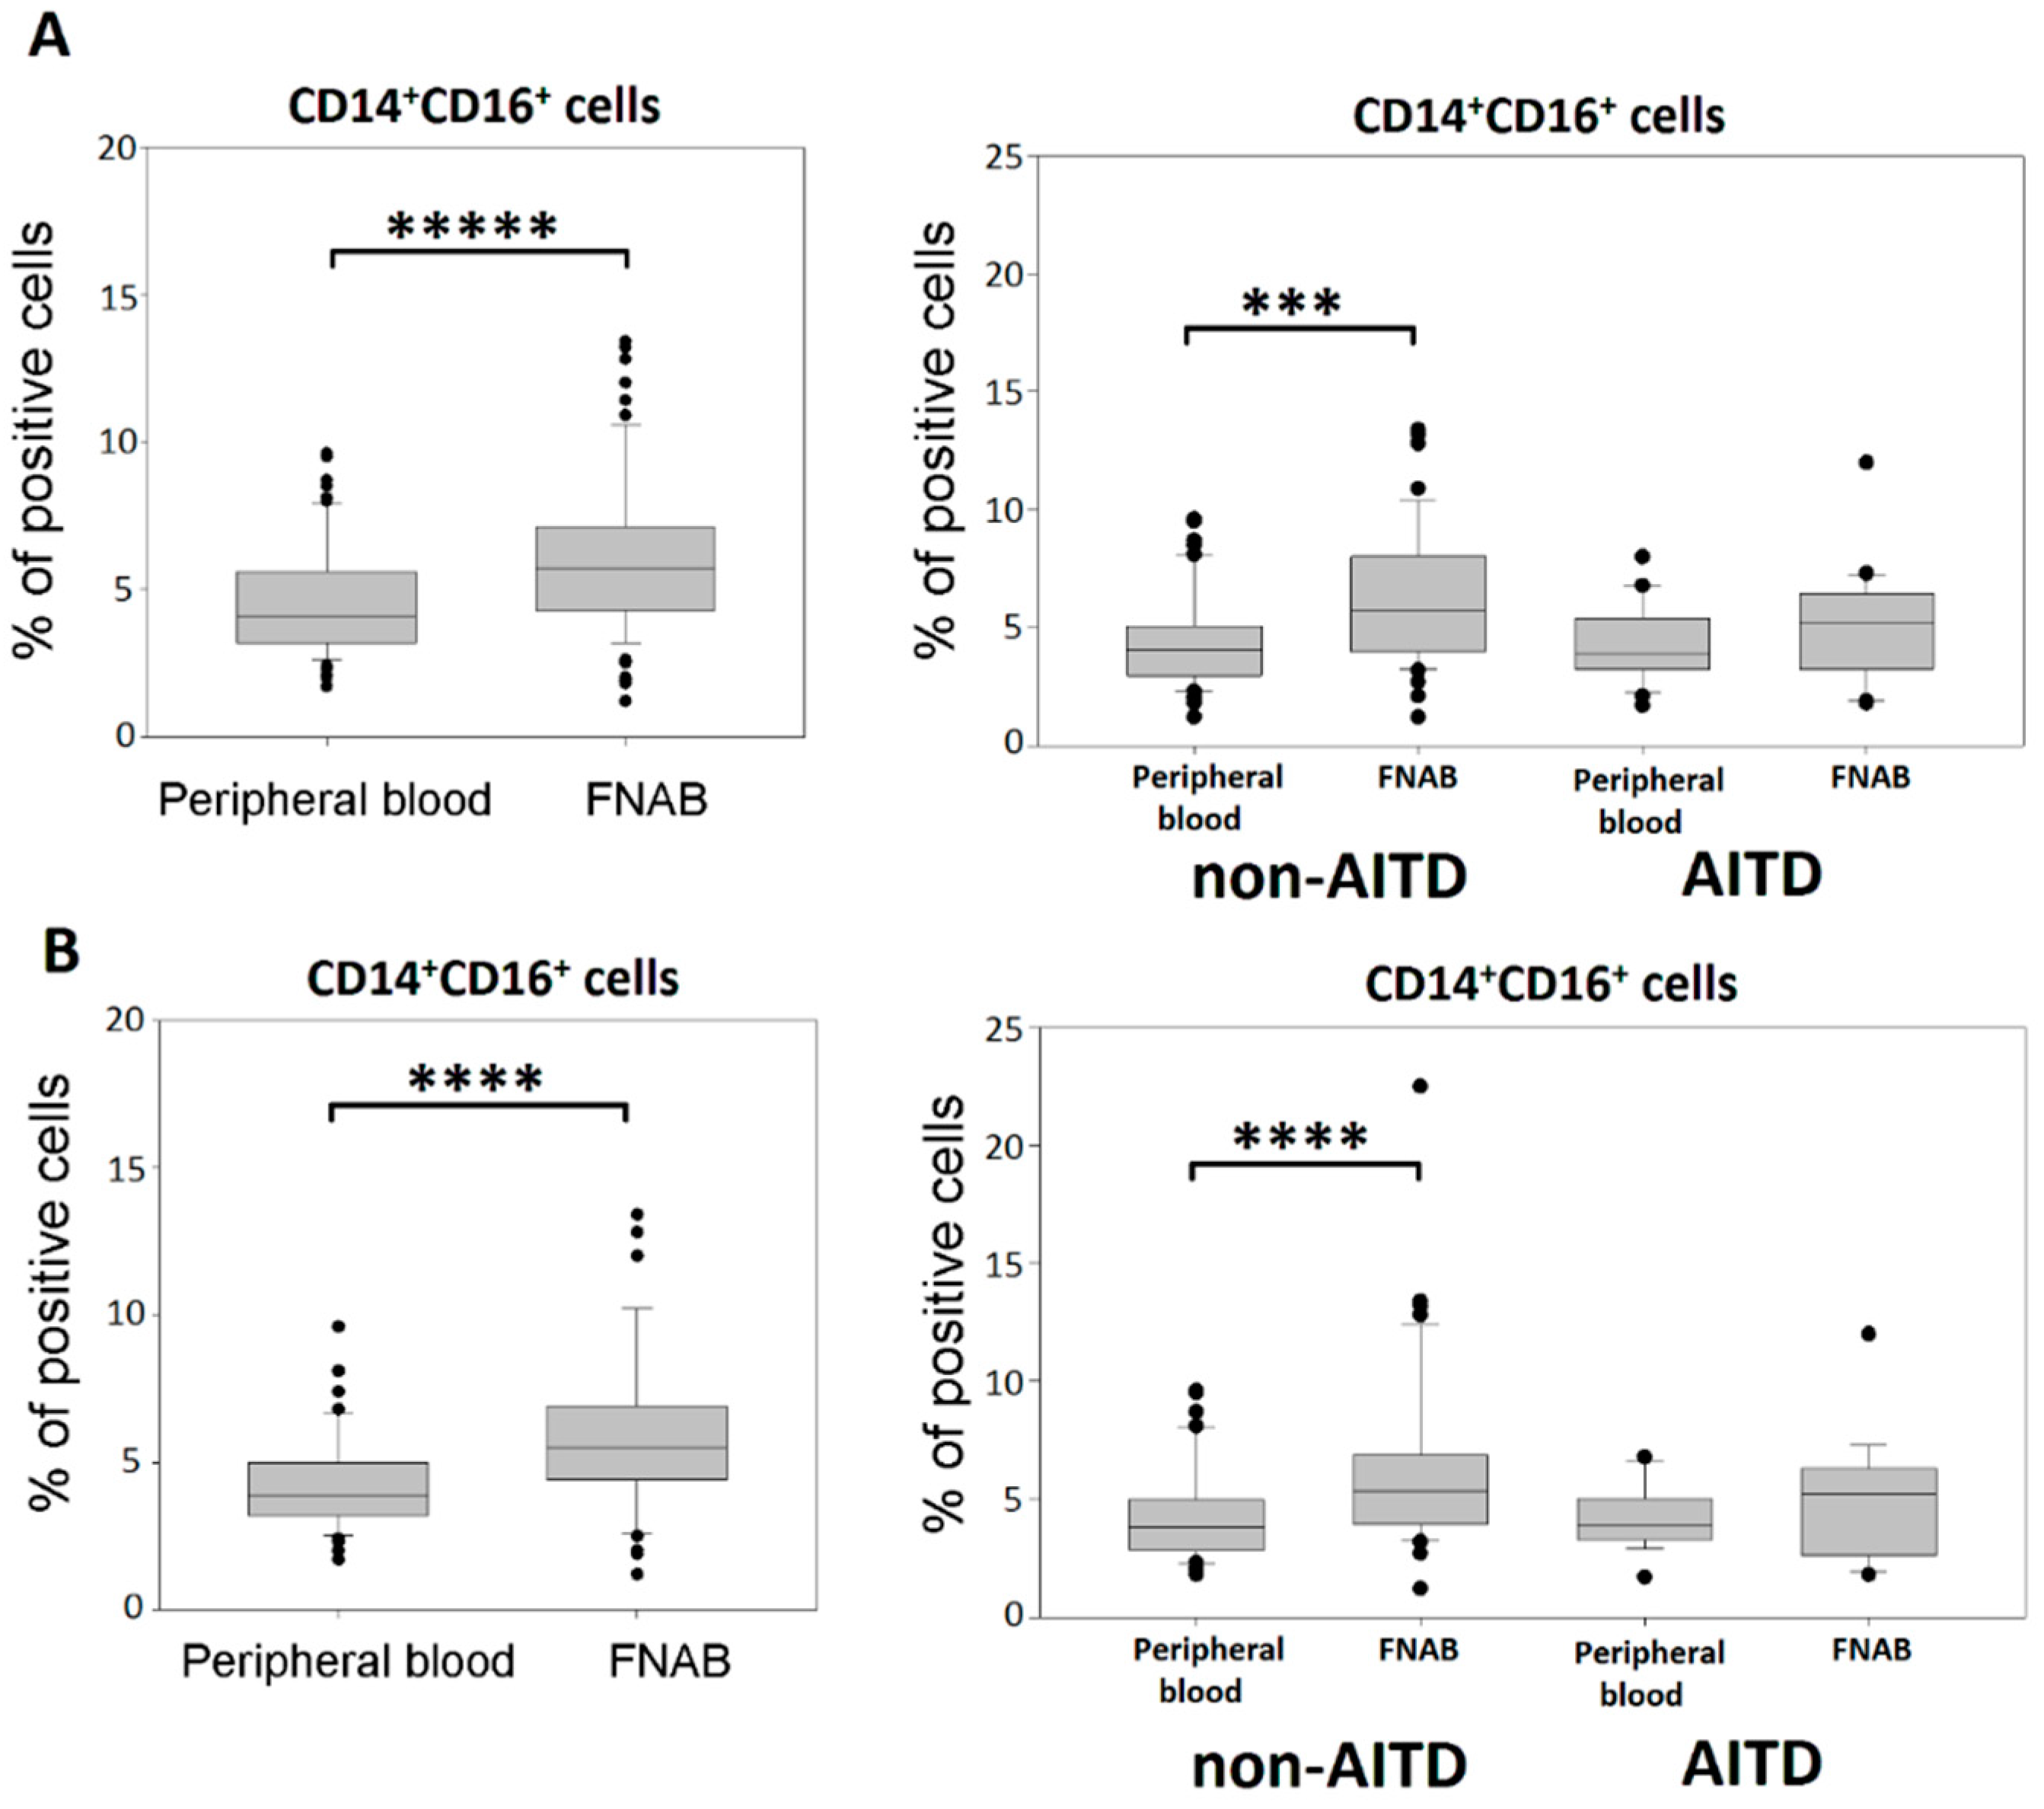
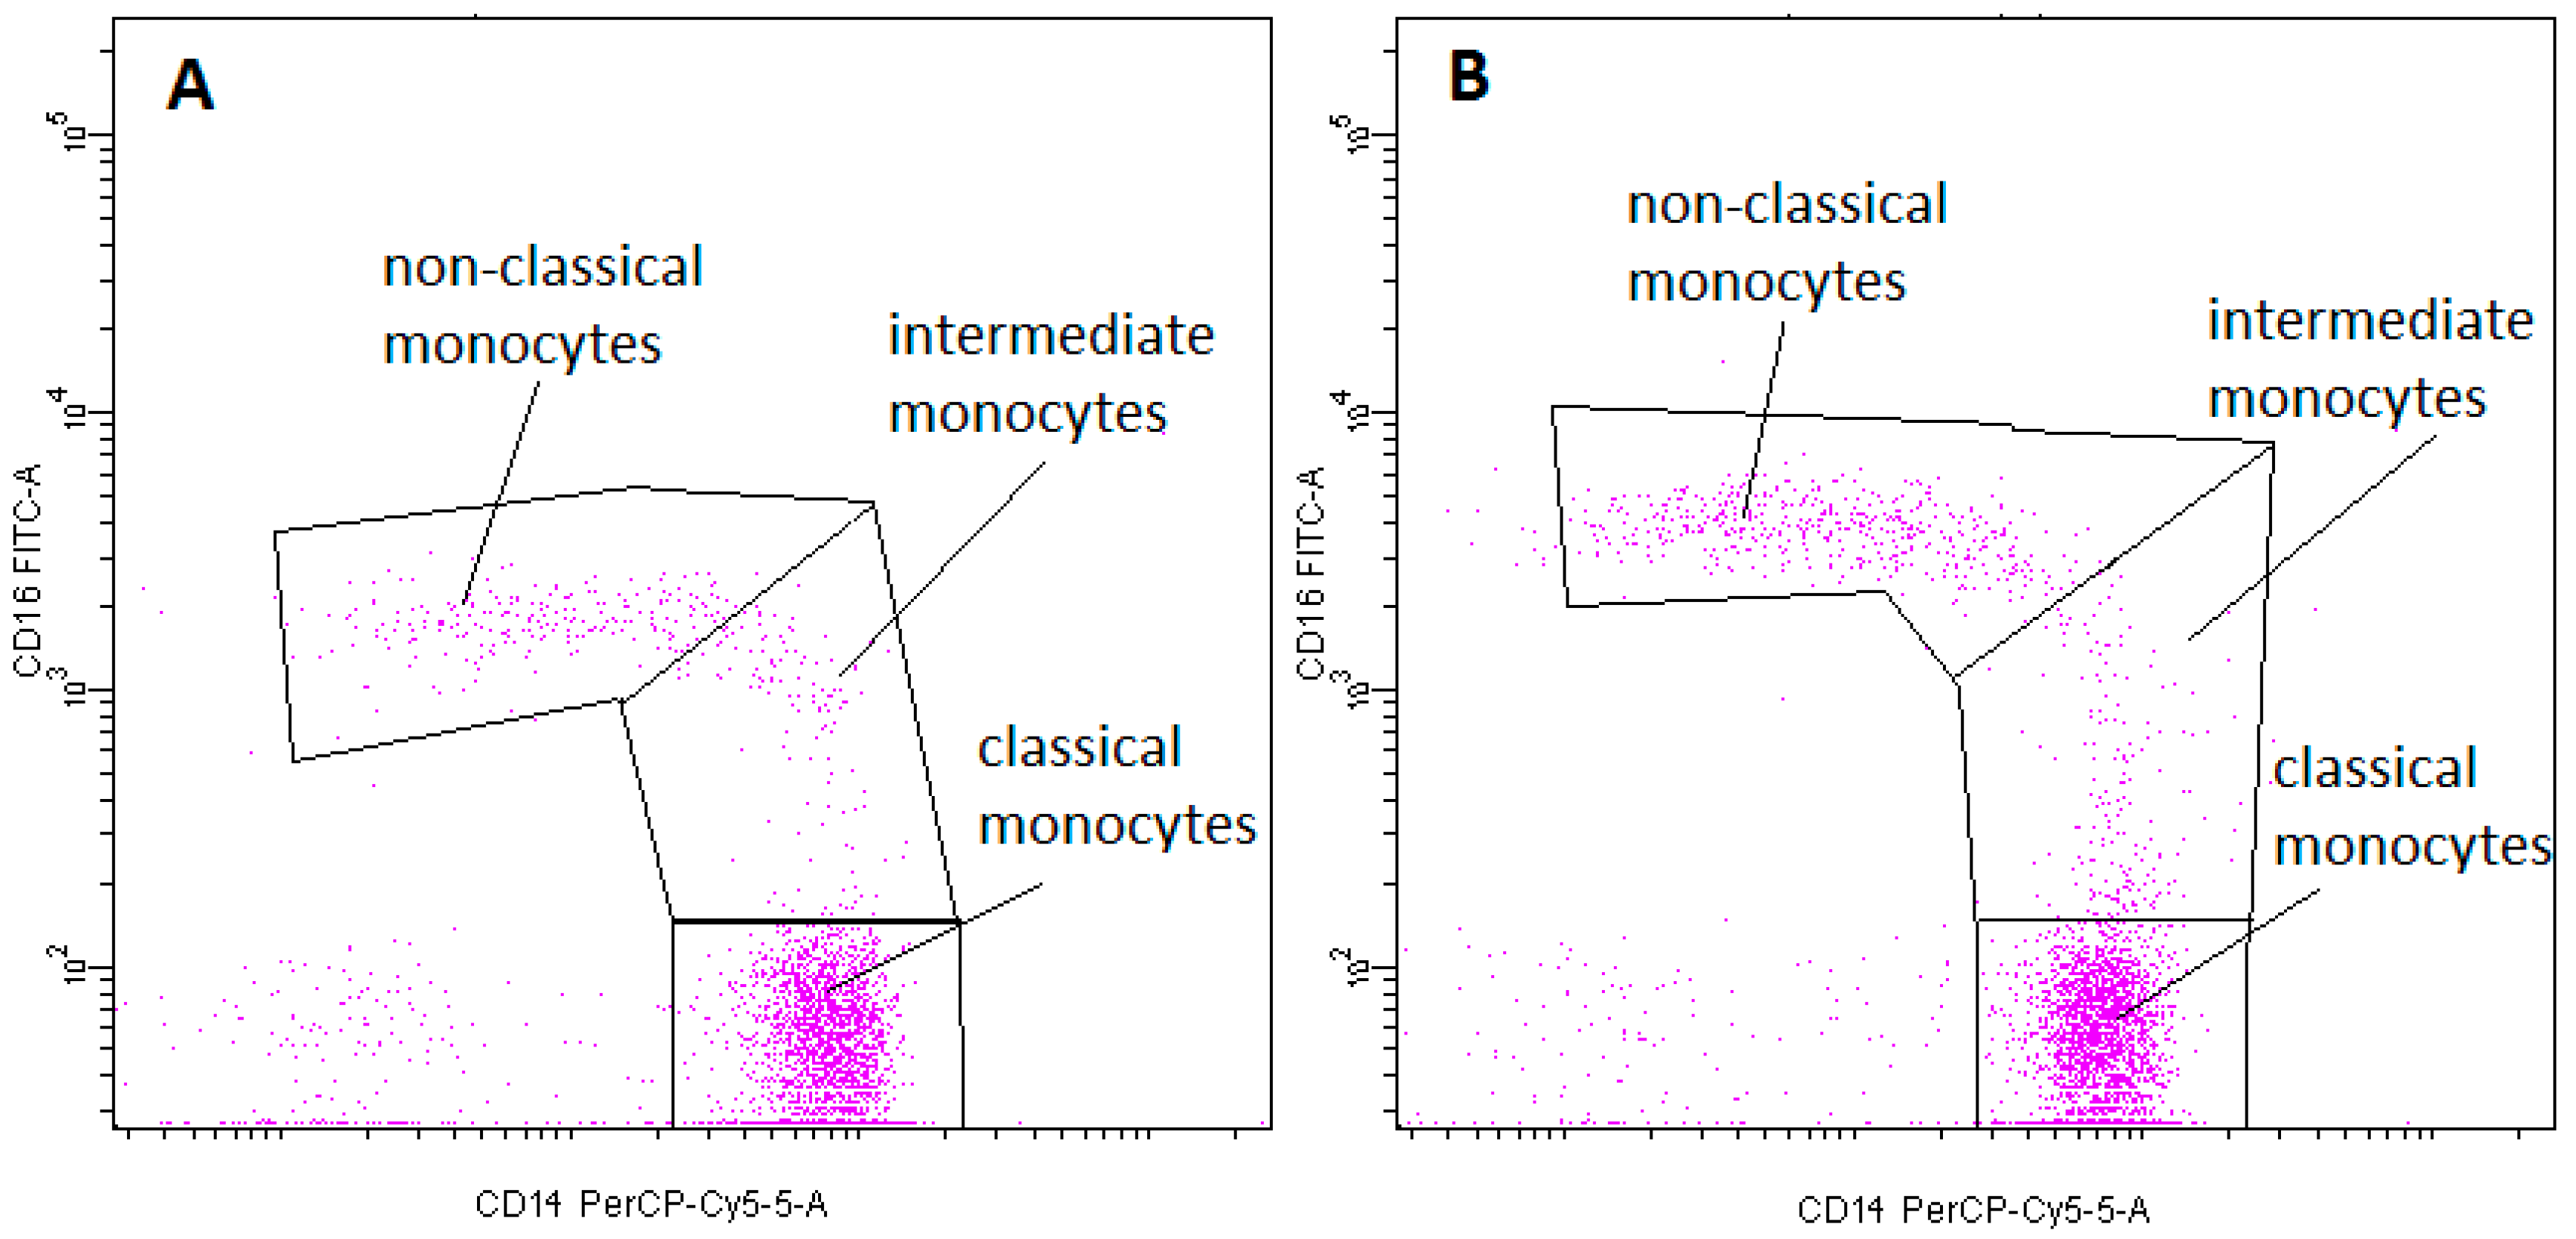
2.2. Monocyte Subsets
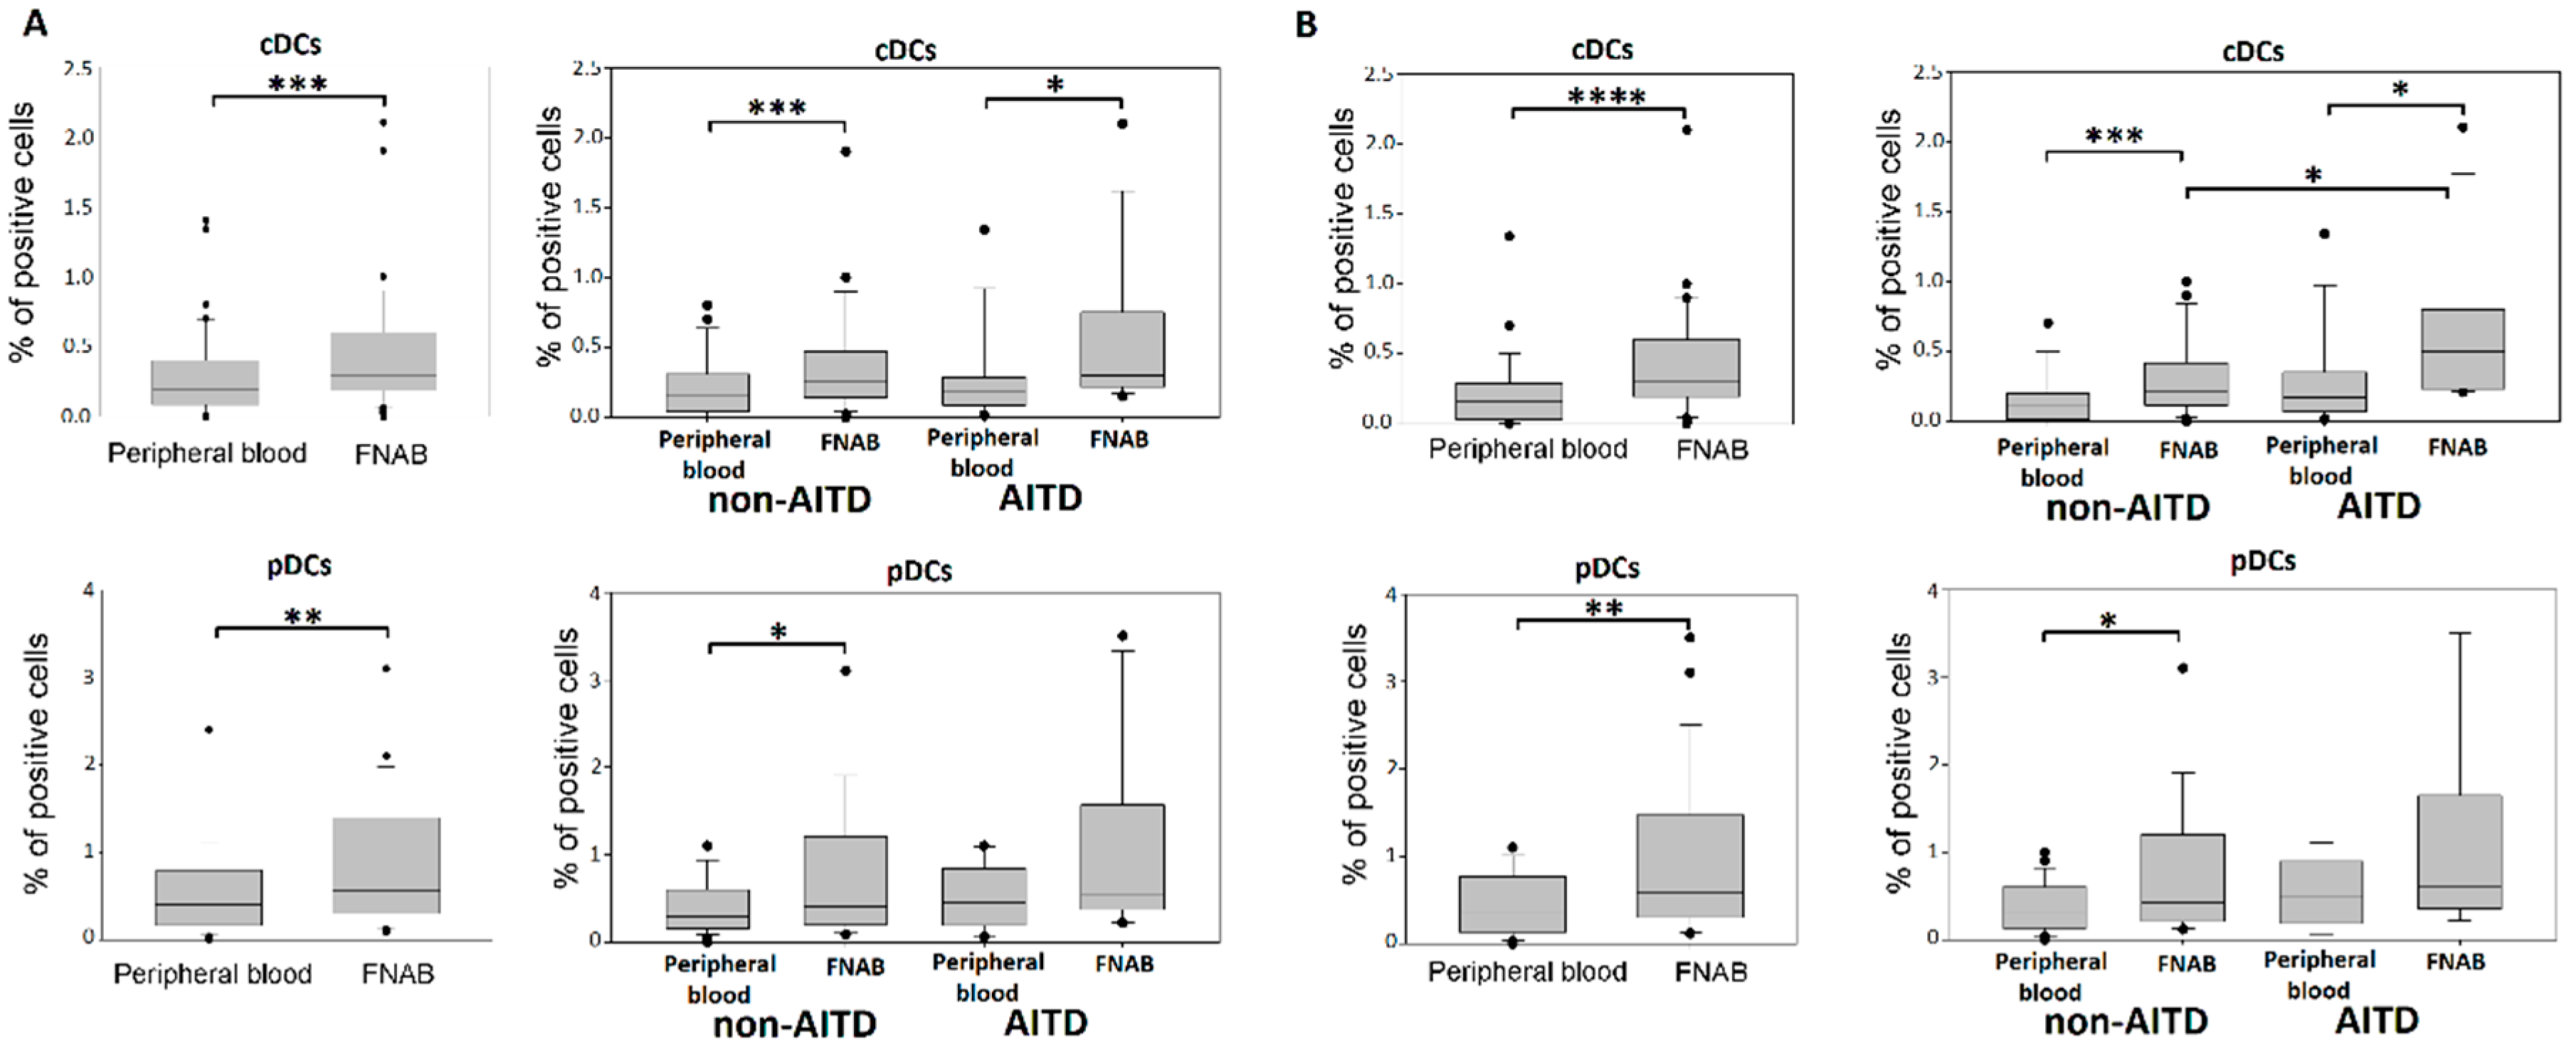
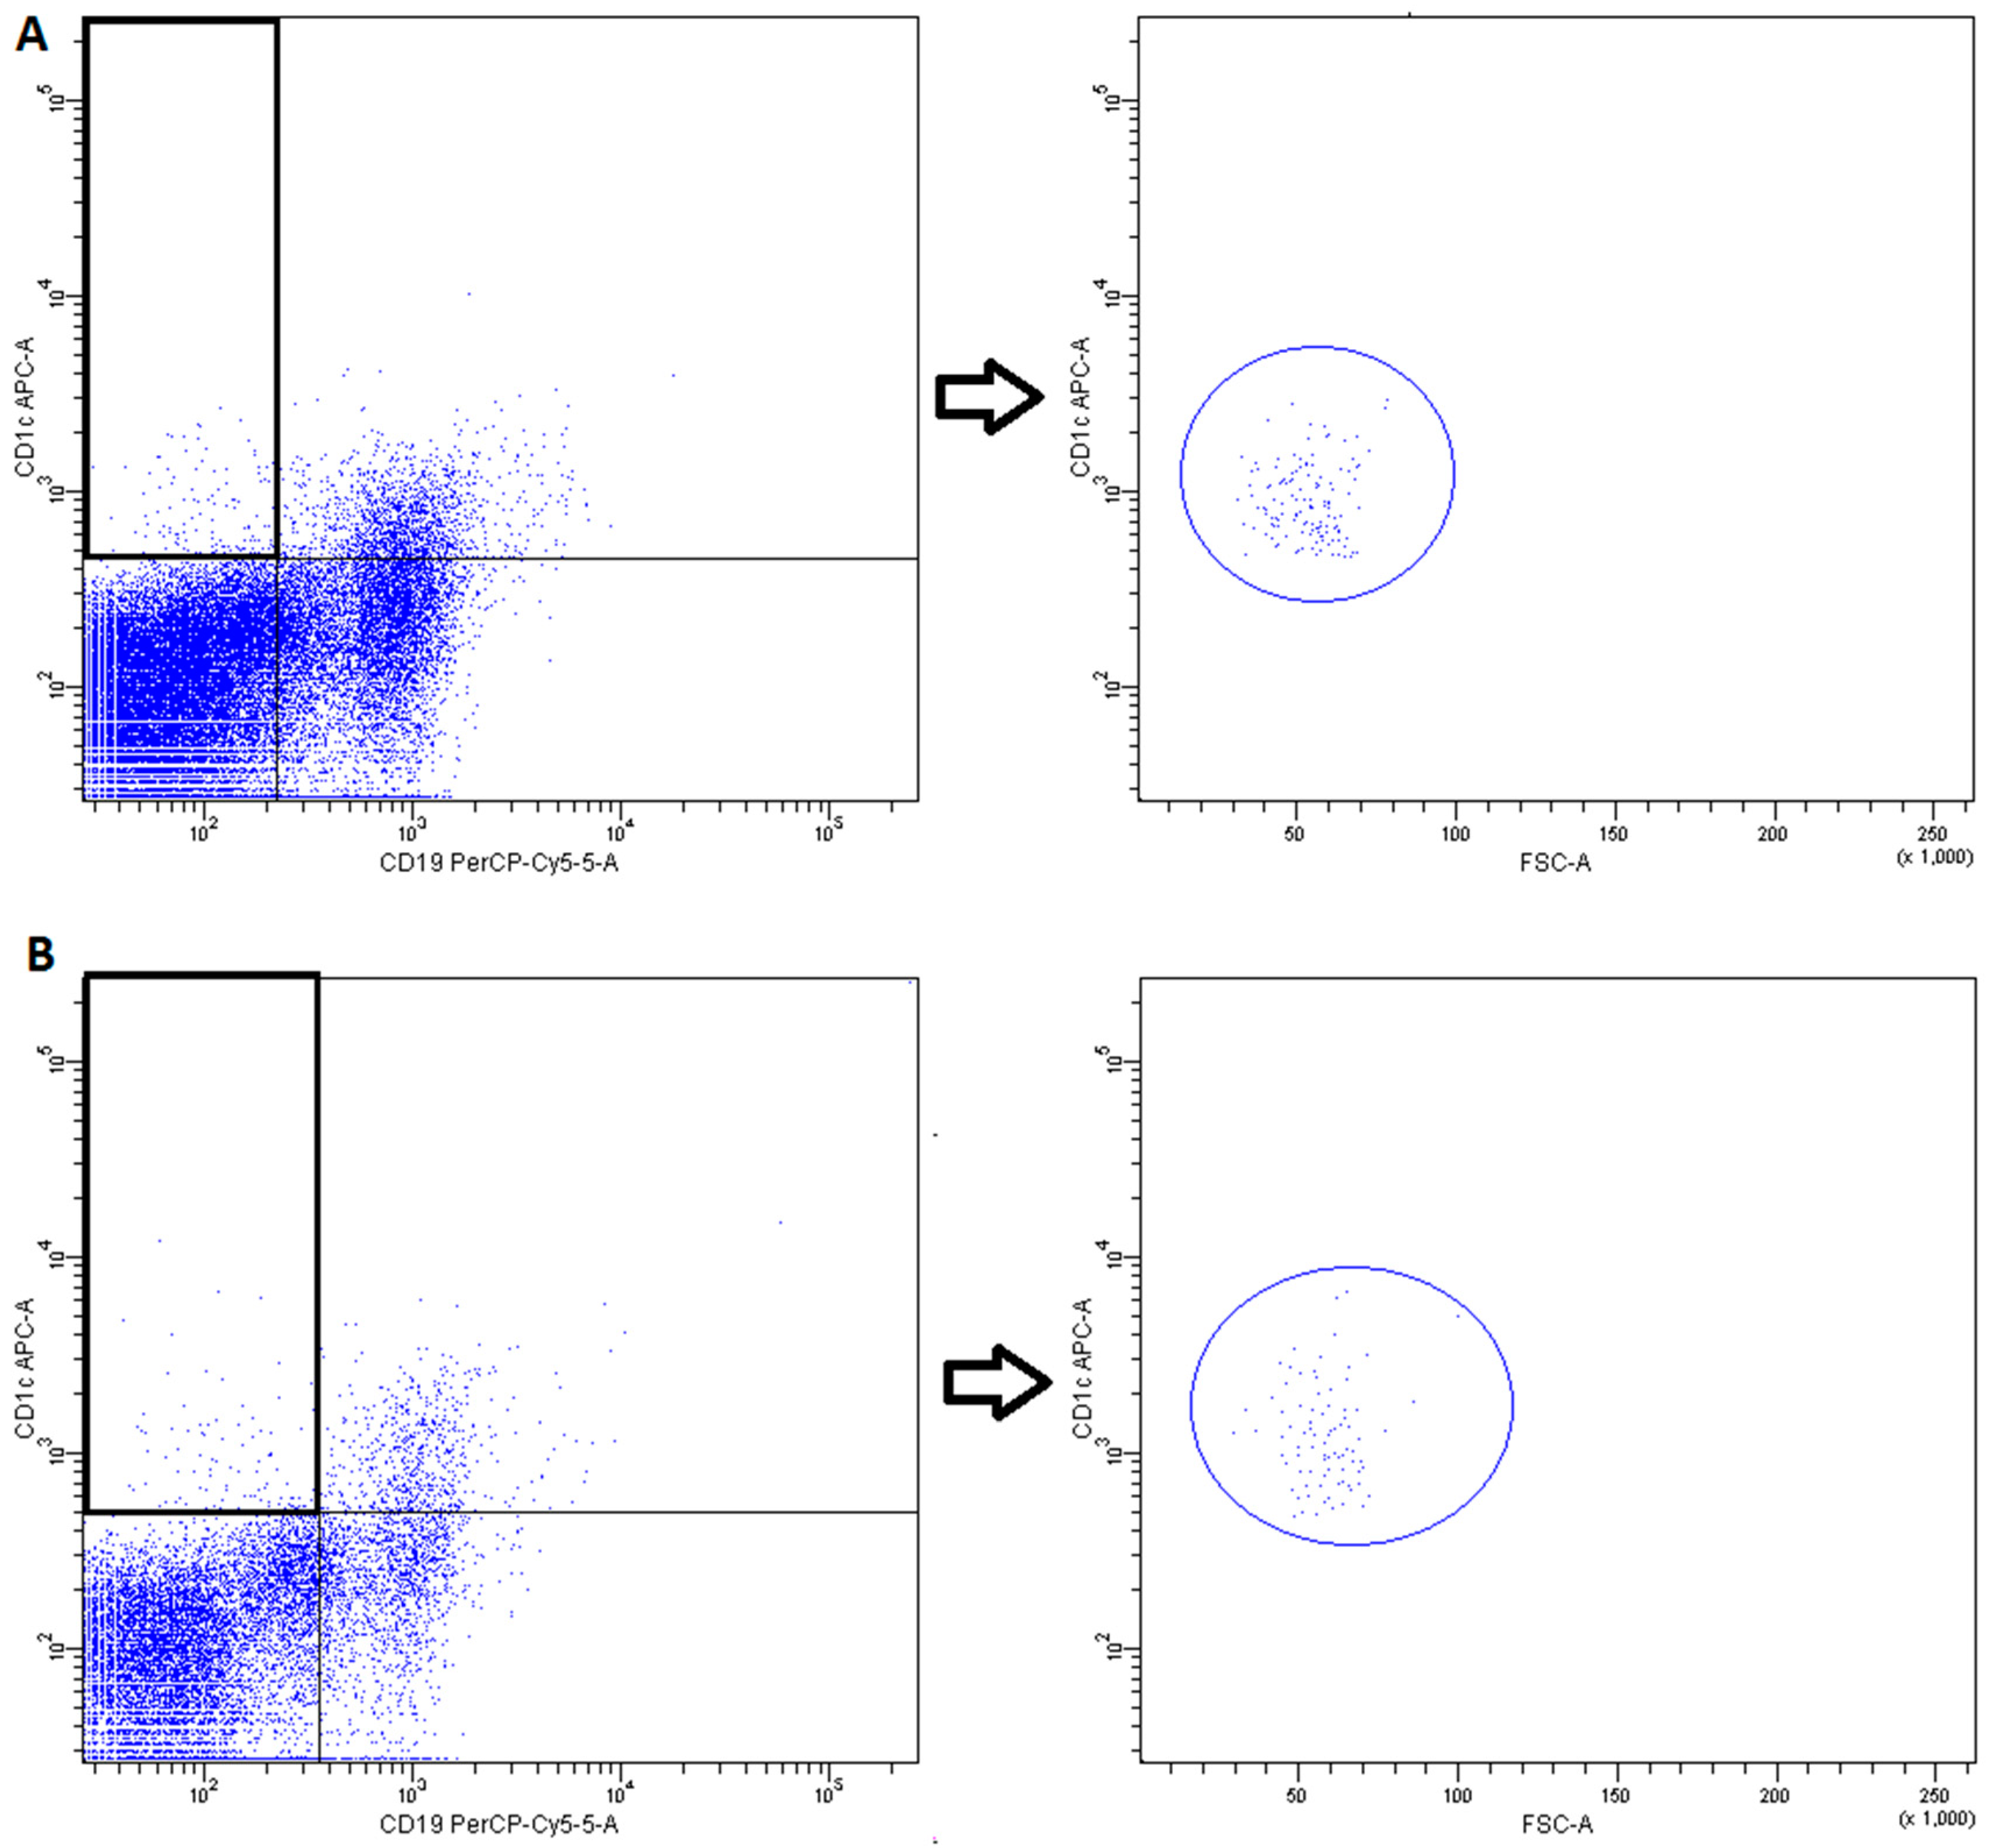
2.3. Conventional DCs
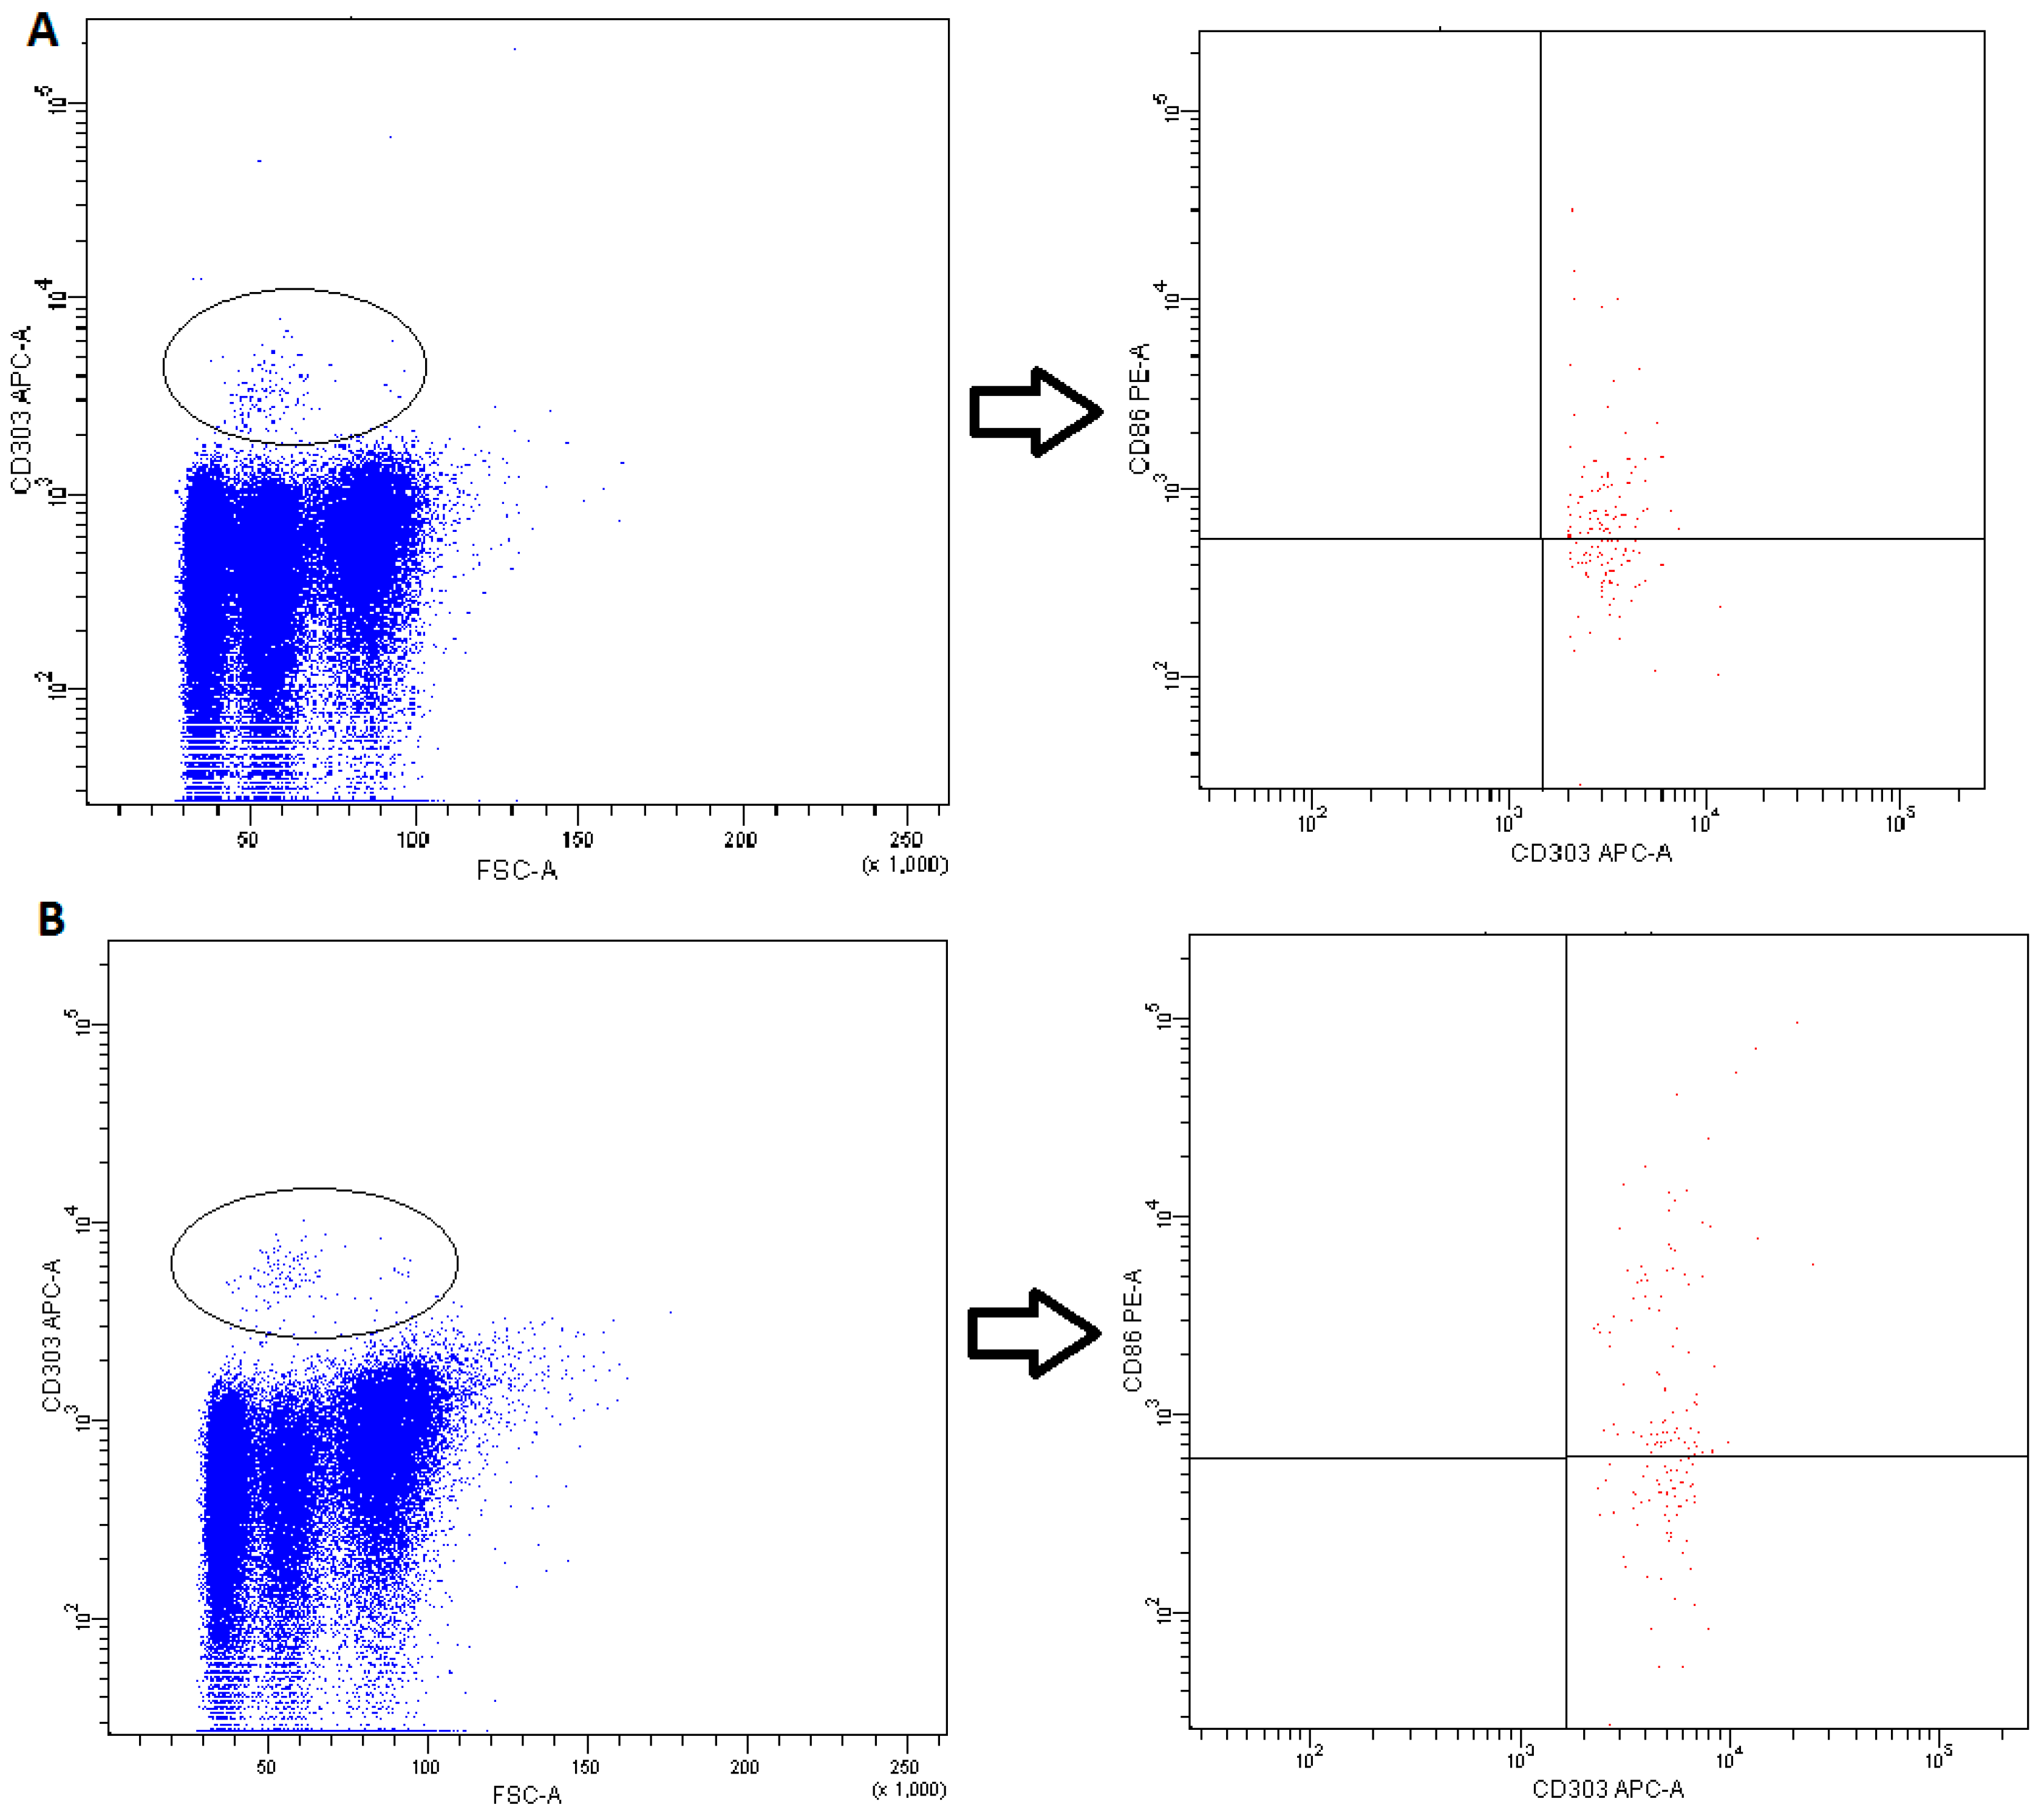
2.4. Plasmacytoid DCs
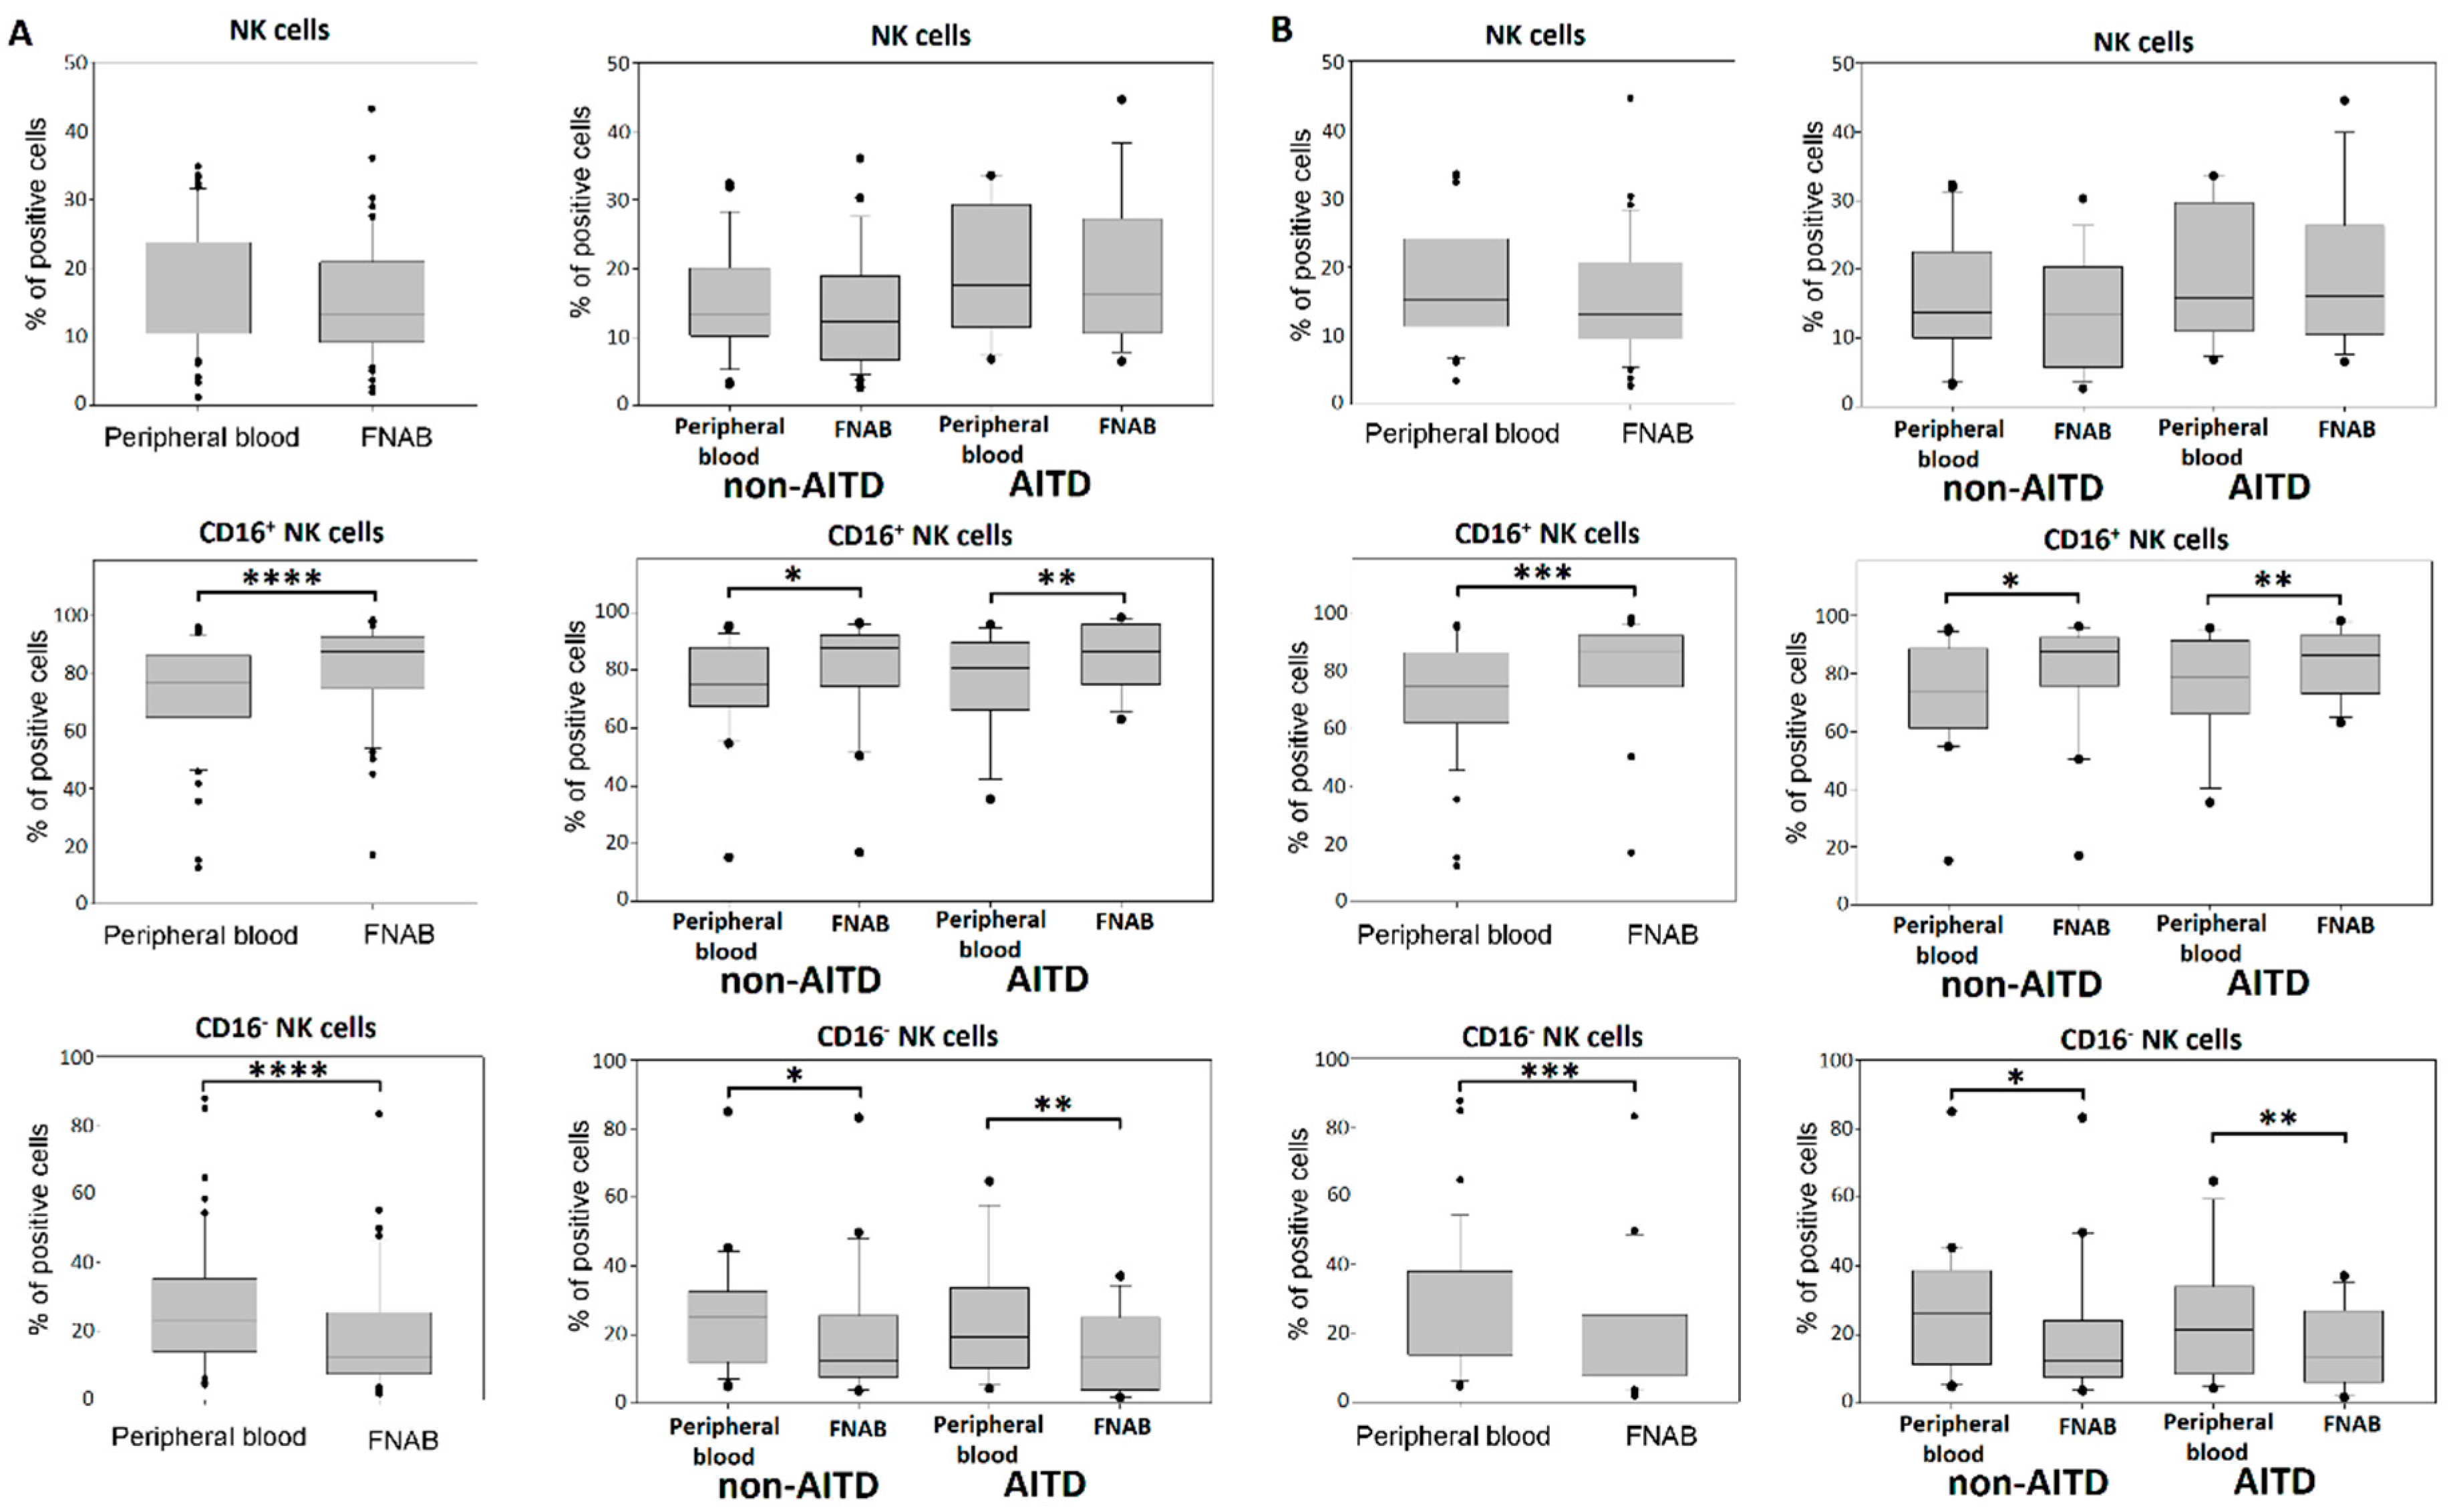
2.5. NK Cells
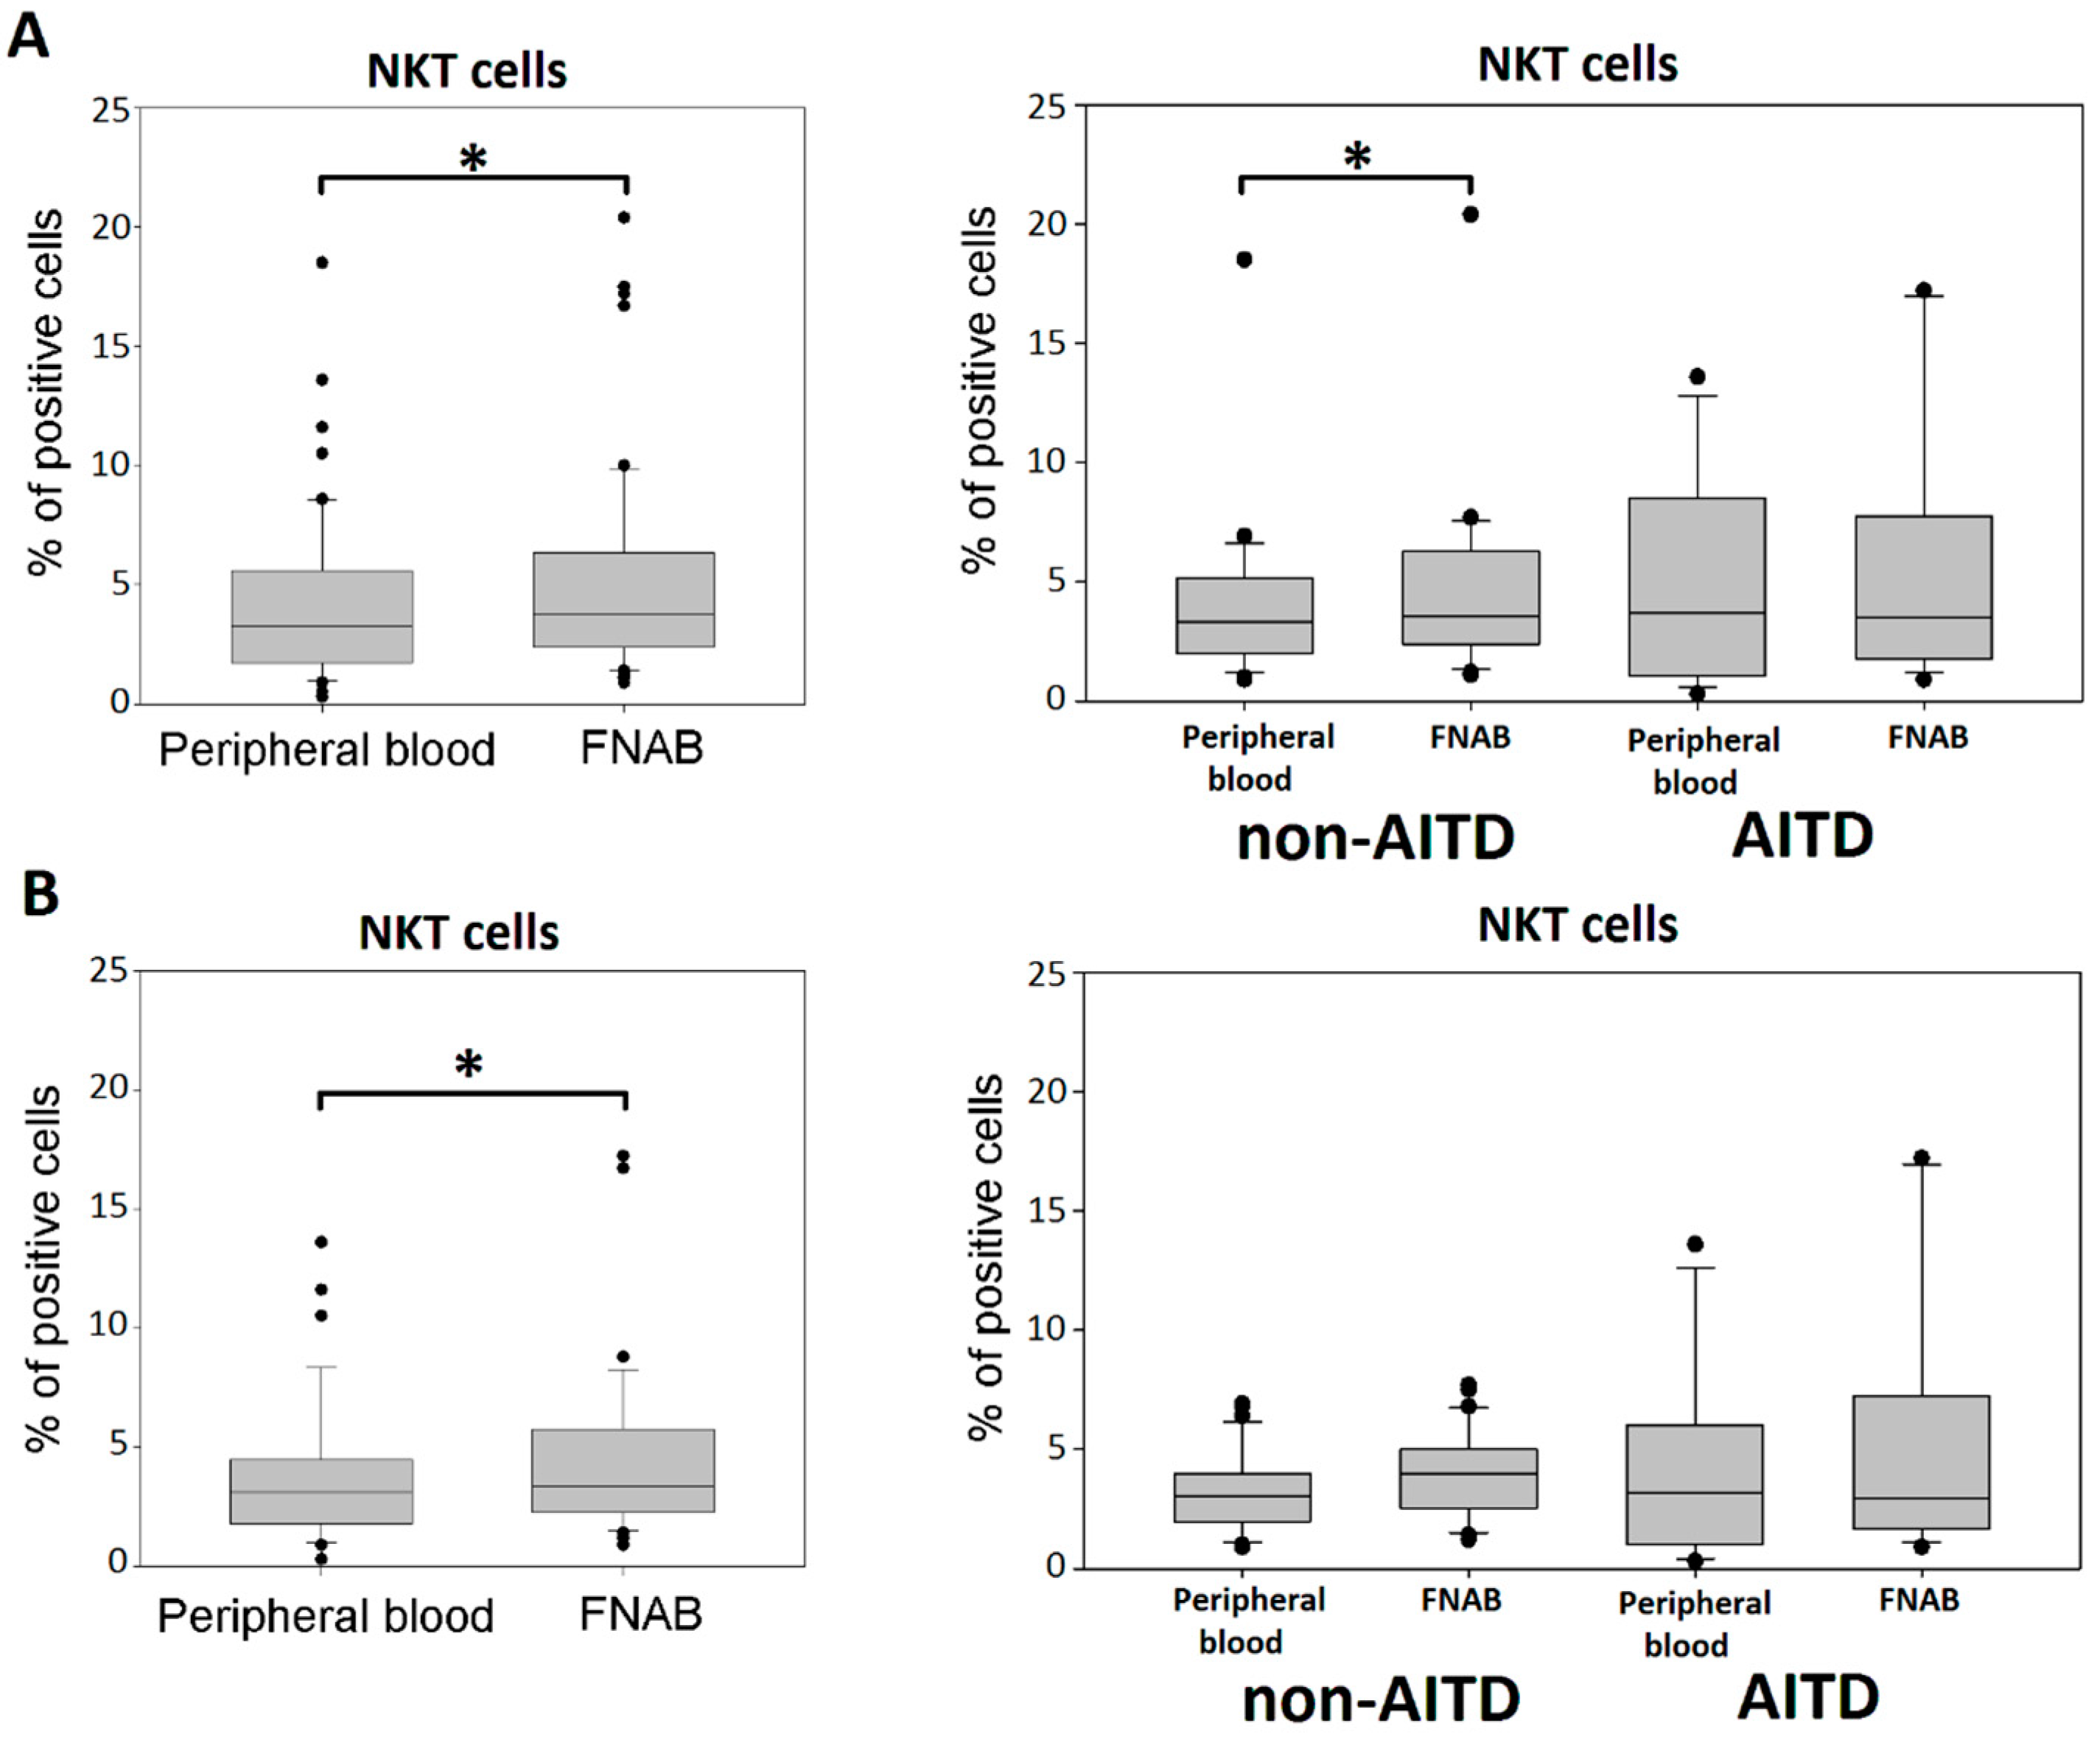
2.6. NKT Cells
3. Discussion
4. Materials and Methods
4.1. Patients
4.2. Ultrasound Guided FNAB Procedure and Peripheral Blood Collection
4.3. Fluorescence-Activated Cell Sorting (FACS) Analysis
- Fluorescein isothiocyanate (FITC) conjugated mAb: anti-CD16 (3G8, Mouse IgG1) (BD Biosciences Pharmingen, San Jose, CA, USA),
- Phycoerythrin (PE) conjugated mAb: anti-SLAN (M-DC8, Mouse IgG1) (Miltenyi Biotec, Bergisch Gladbach, Niemcy), anti-CD86 (2331 (FUN-1), Mouse IgG1) (BD Biosciences), anti-CD11c (B-ly6, Mouse IgG1) (BD Biosciences),
- Peridinin-chlorophyll-protein complex (PerCP) conjugated mAb: anti-CD14 (M5E2, Mouse IgG2a) (BD Biosciences), anti-CD19 (4G7, Mouse IgG1) (BD Biosciences),
- Allophycocyanin conjugated mAb: anti-CD3 (UCHT1, Mouse IgG1) (BD Biosciences), anti-BDCA1-(CD1c) (AD5-8E7, Mouse IgG2a) (Miltenyi Biotec), anti-BDCA2-(CD303) (AC144, Mouse IgG1) (Miltenyi Biotec), anti-BDCA3-(CD141) (AD5-14H12, Mouse IgG1) (Miltenyi Biotec),
- Phycoerythrin-cyanin conjugate 7 (PE-Cy7) conjugated mAb: anti-CD56 (B159, Mouse IgG1) (BD Biosciences).
- DCs subsets were recognized on the basis of expression of a panel of surface molecules known as Blood Dendritic Cell Antigens (BDCA) and CD19 [52].
- Monocyte subsets were recognized on the basis of the surface expression level of CD14 and CD16 molecules (Figure 13).
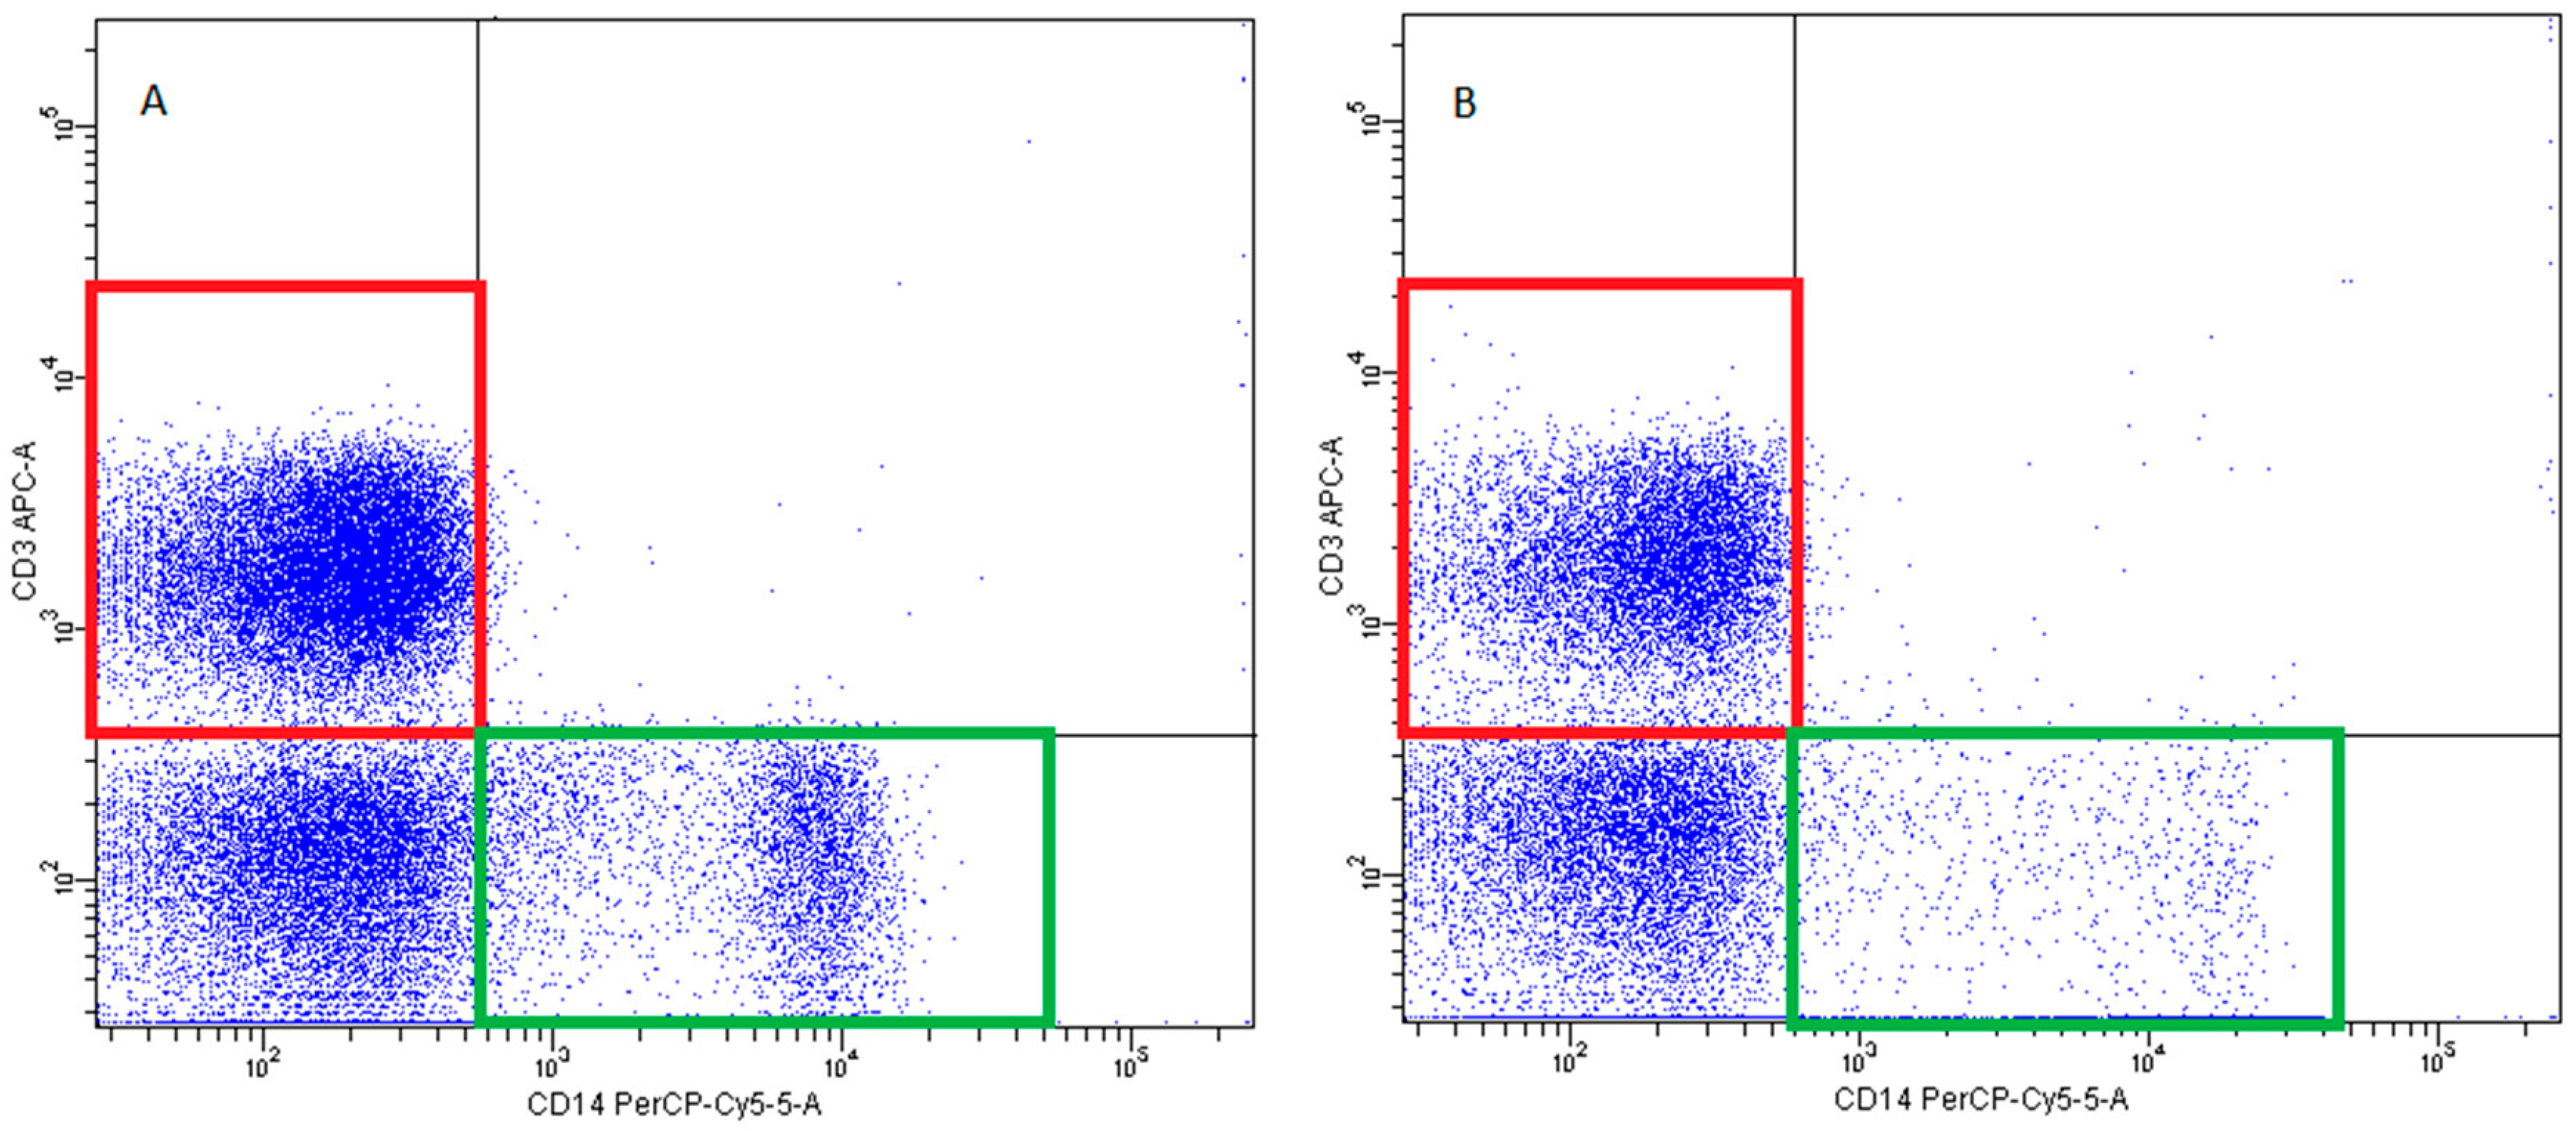
- T lymphocytes—CD3+ (Figure 14)
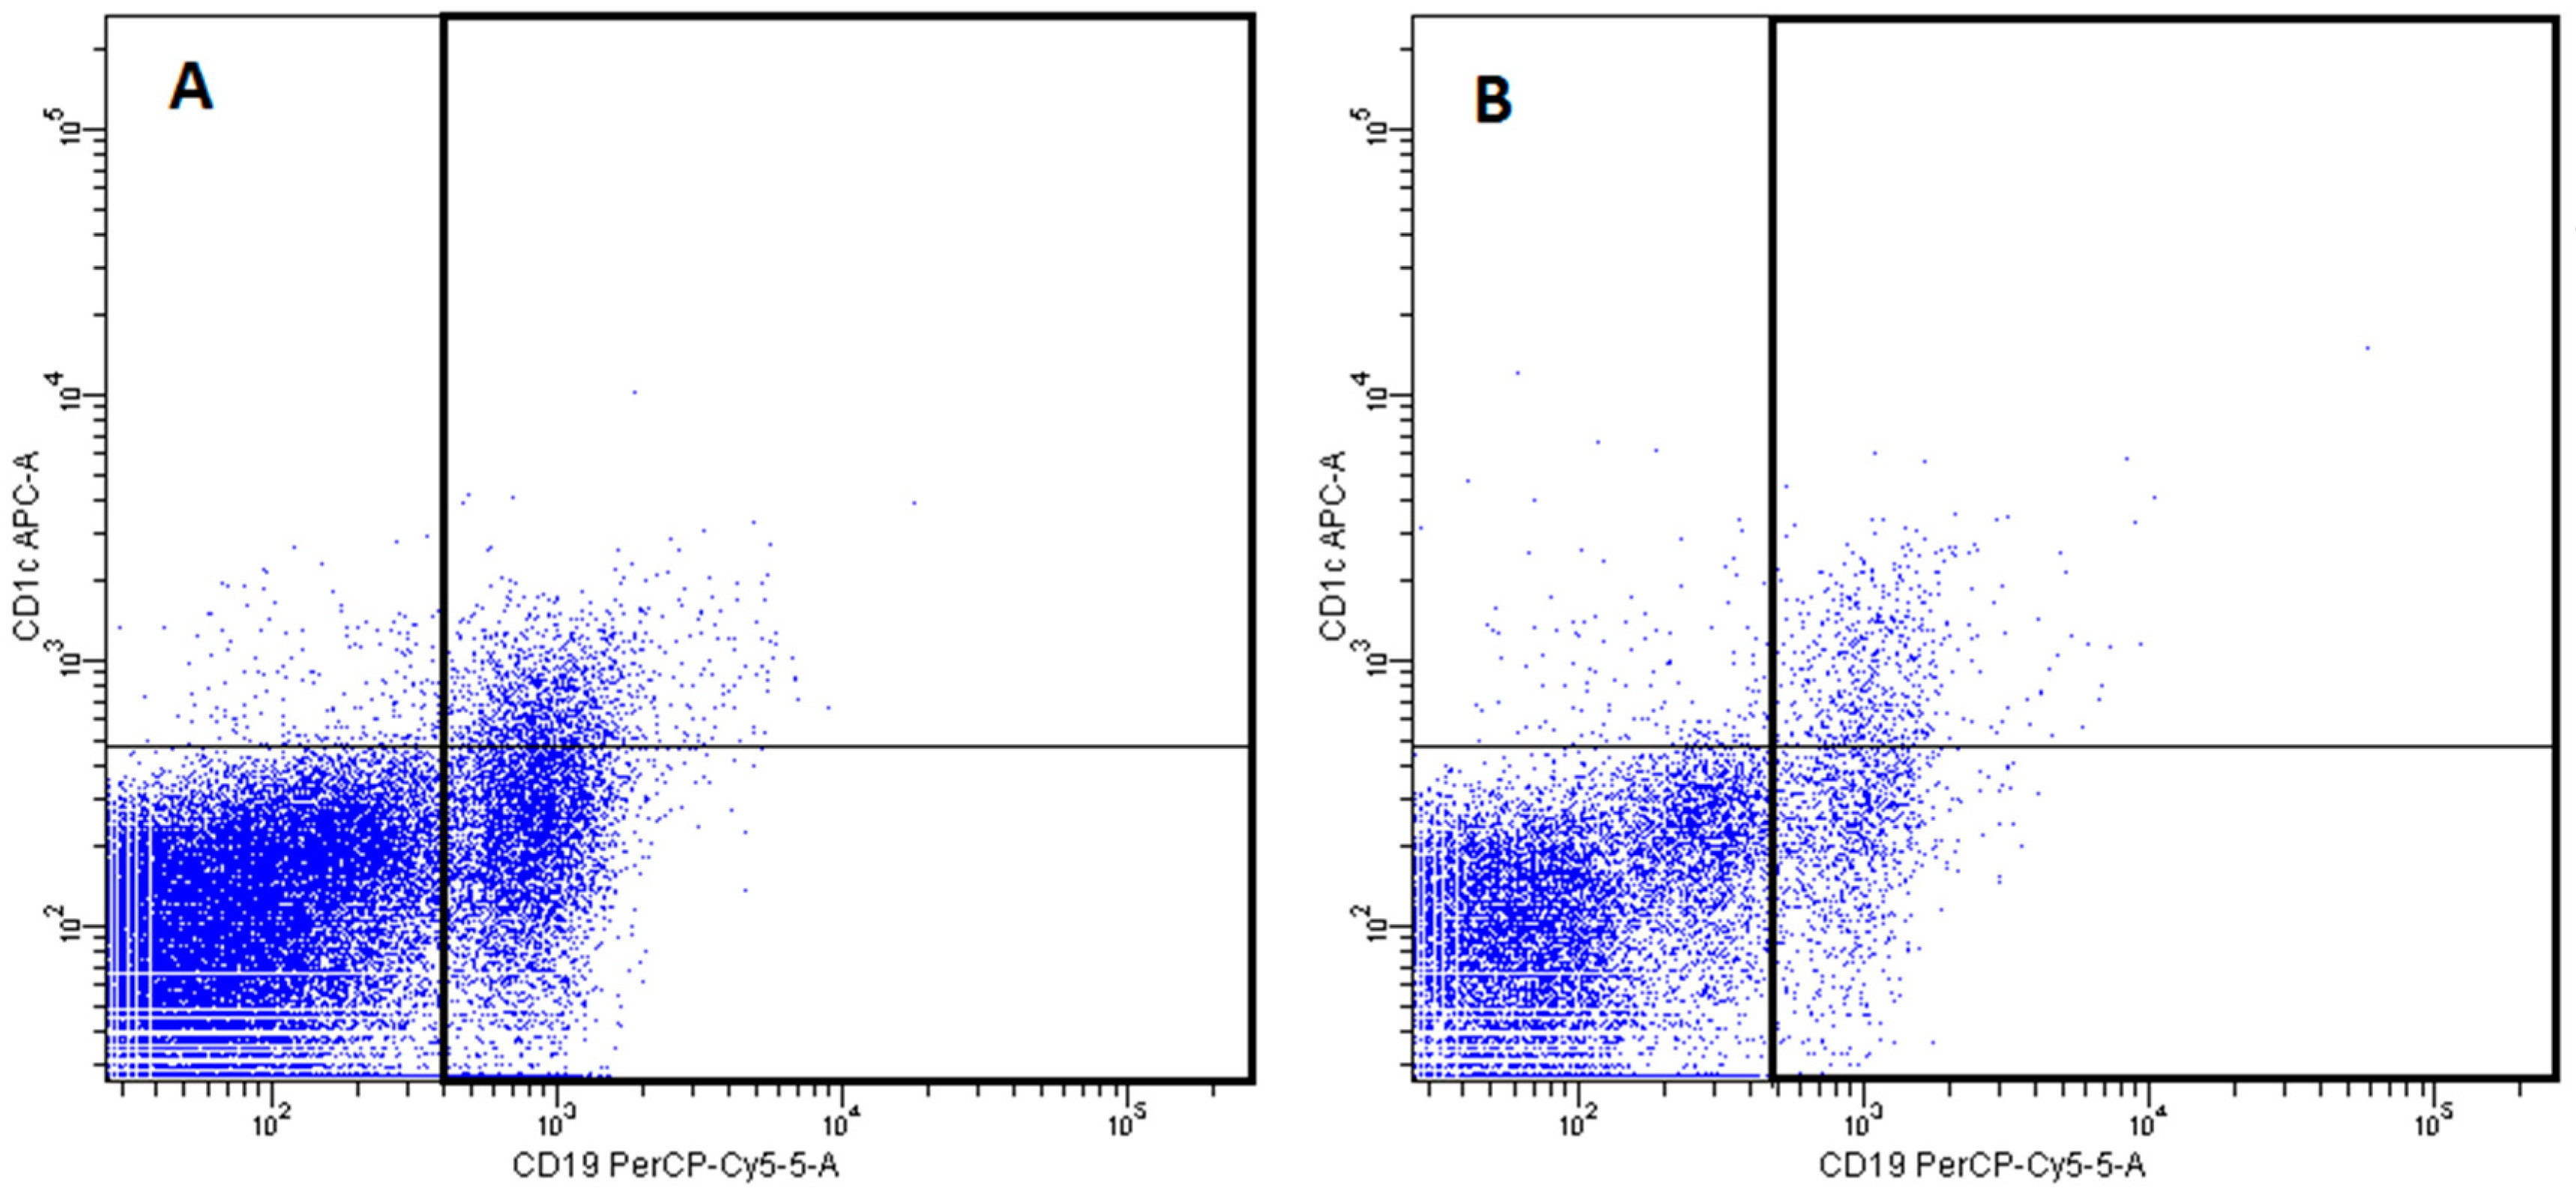
- B Lymphocyte—CD19+ (Figure 15)
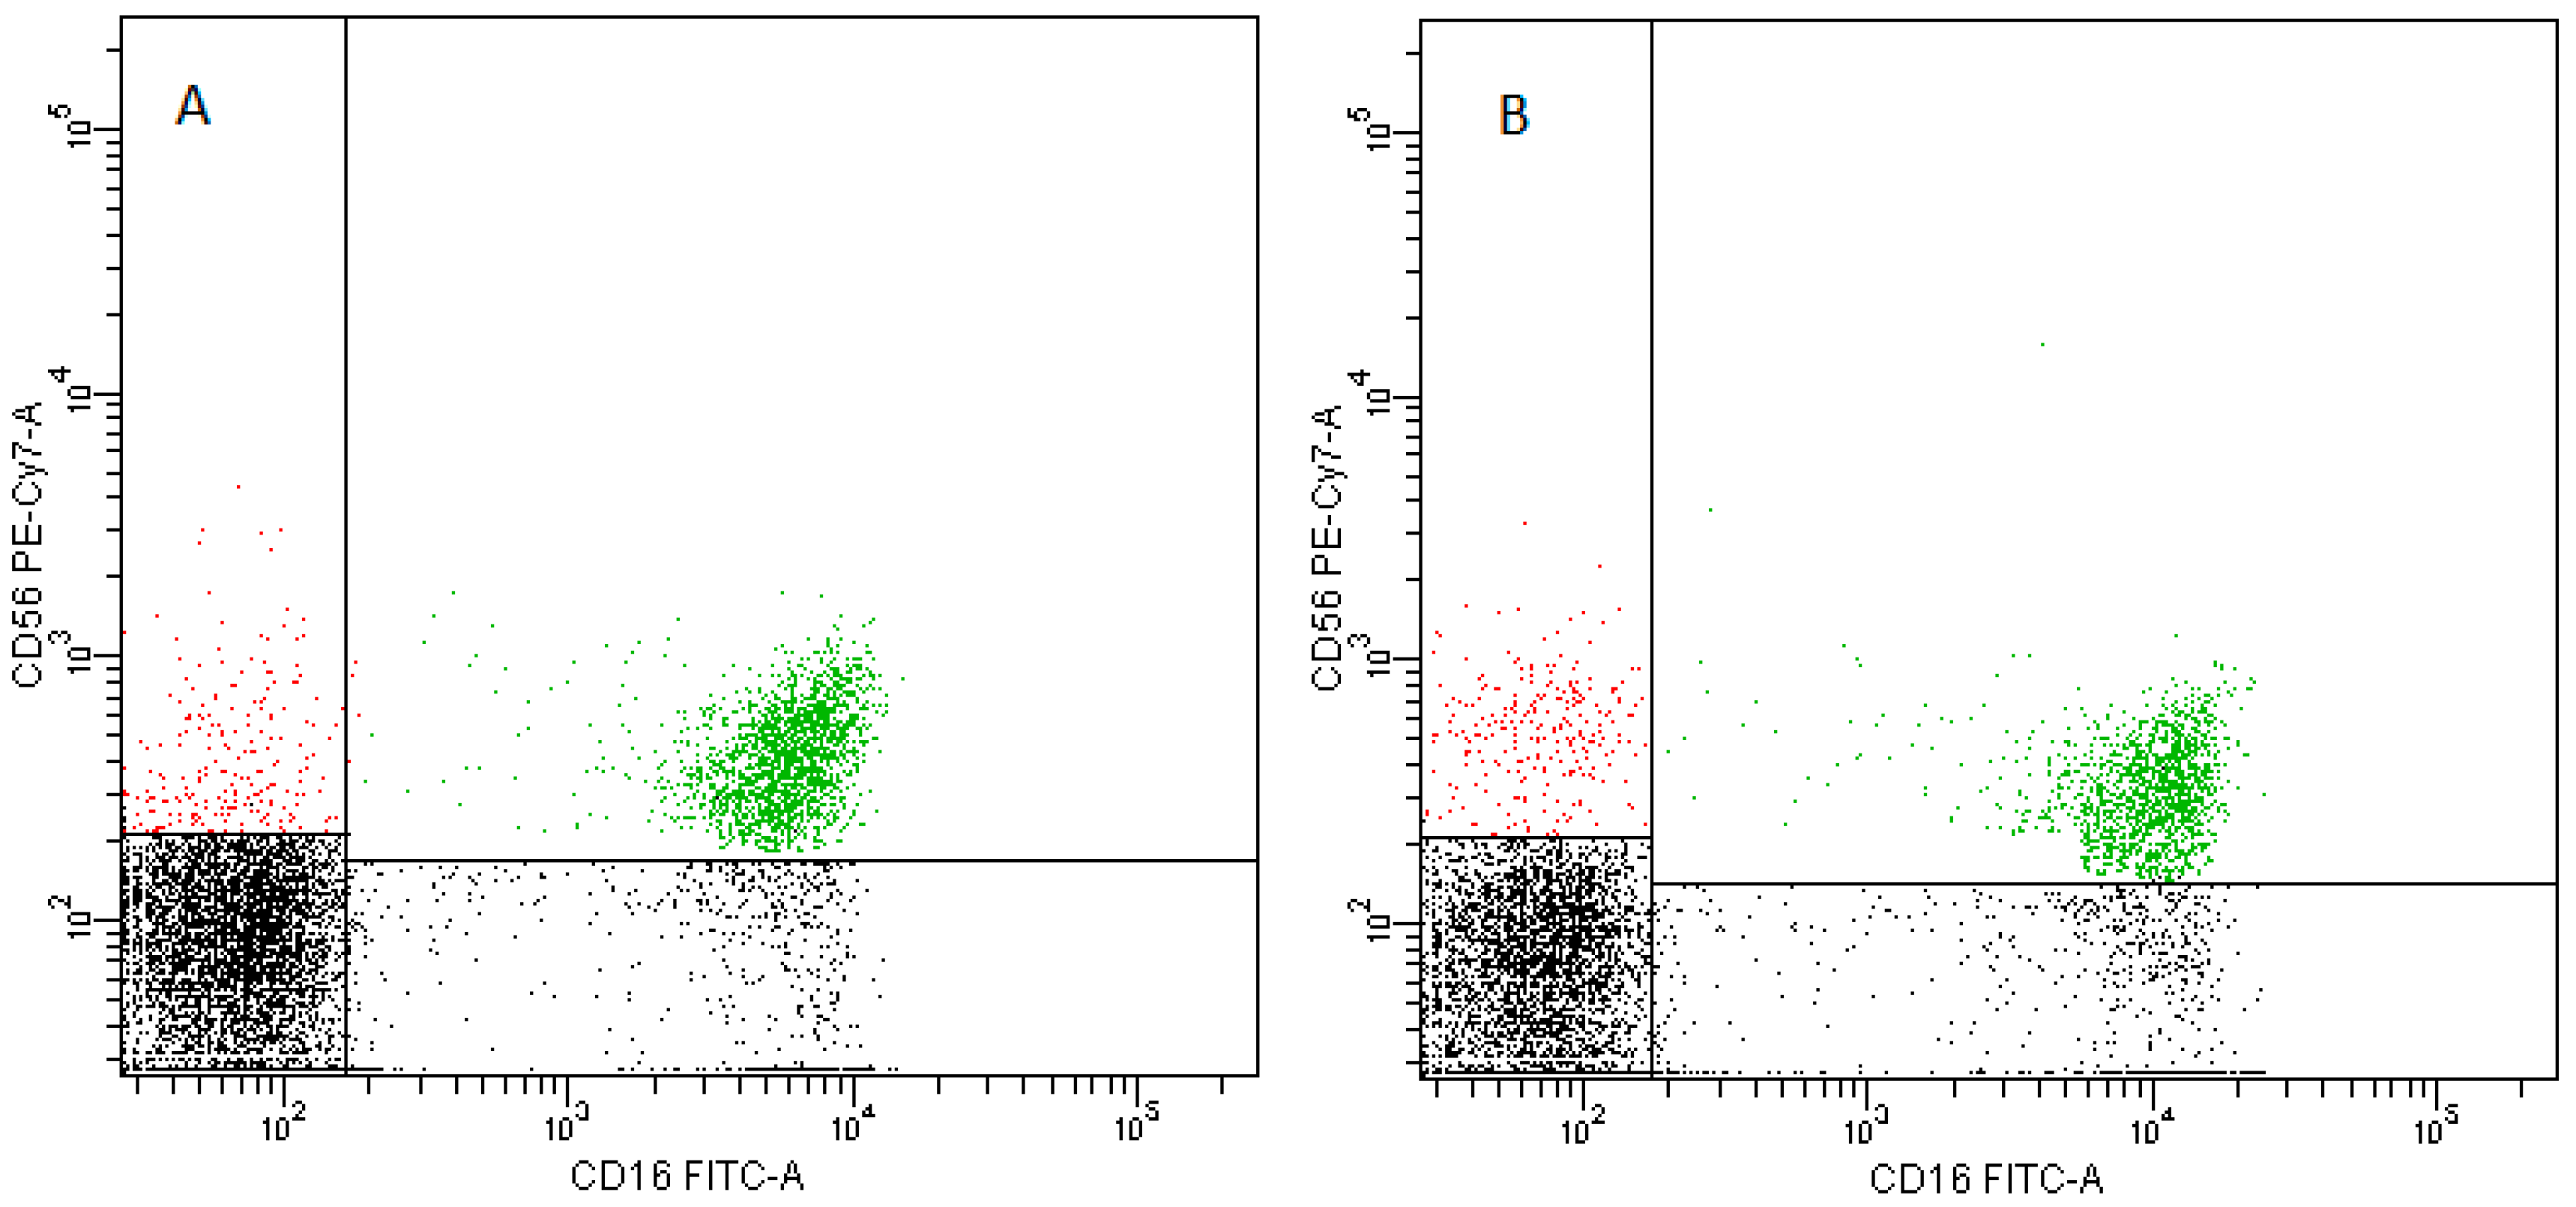
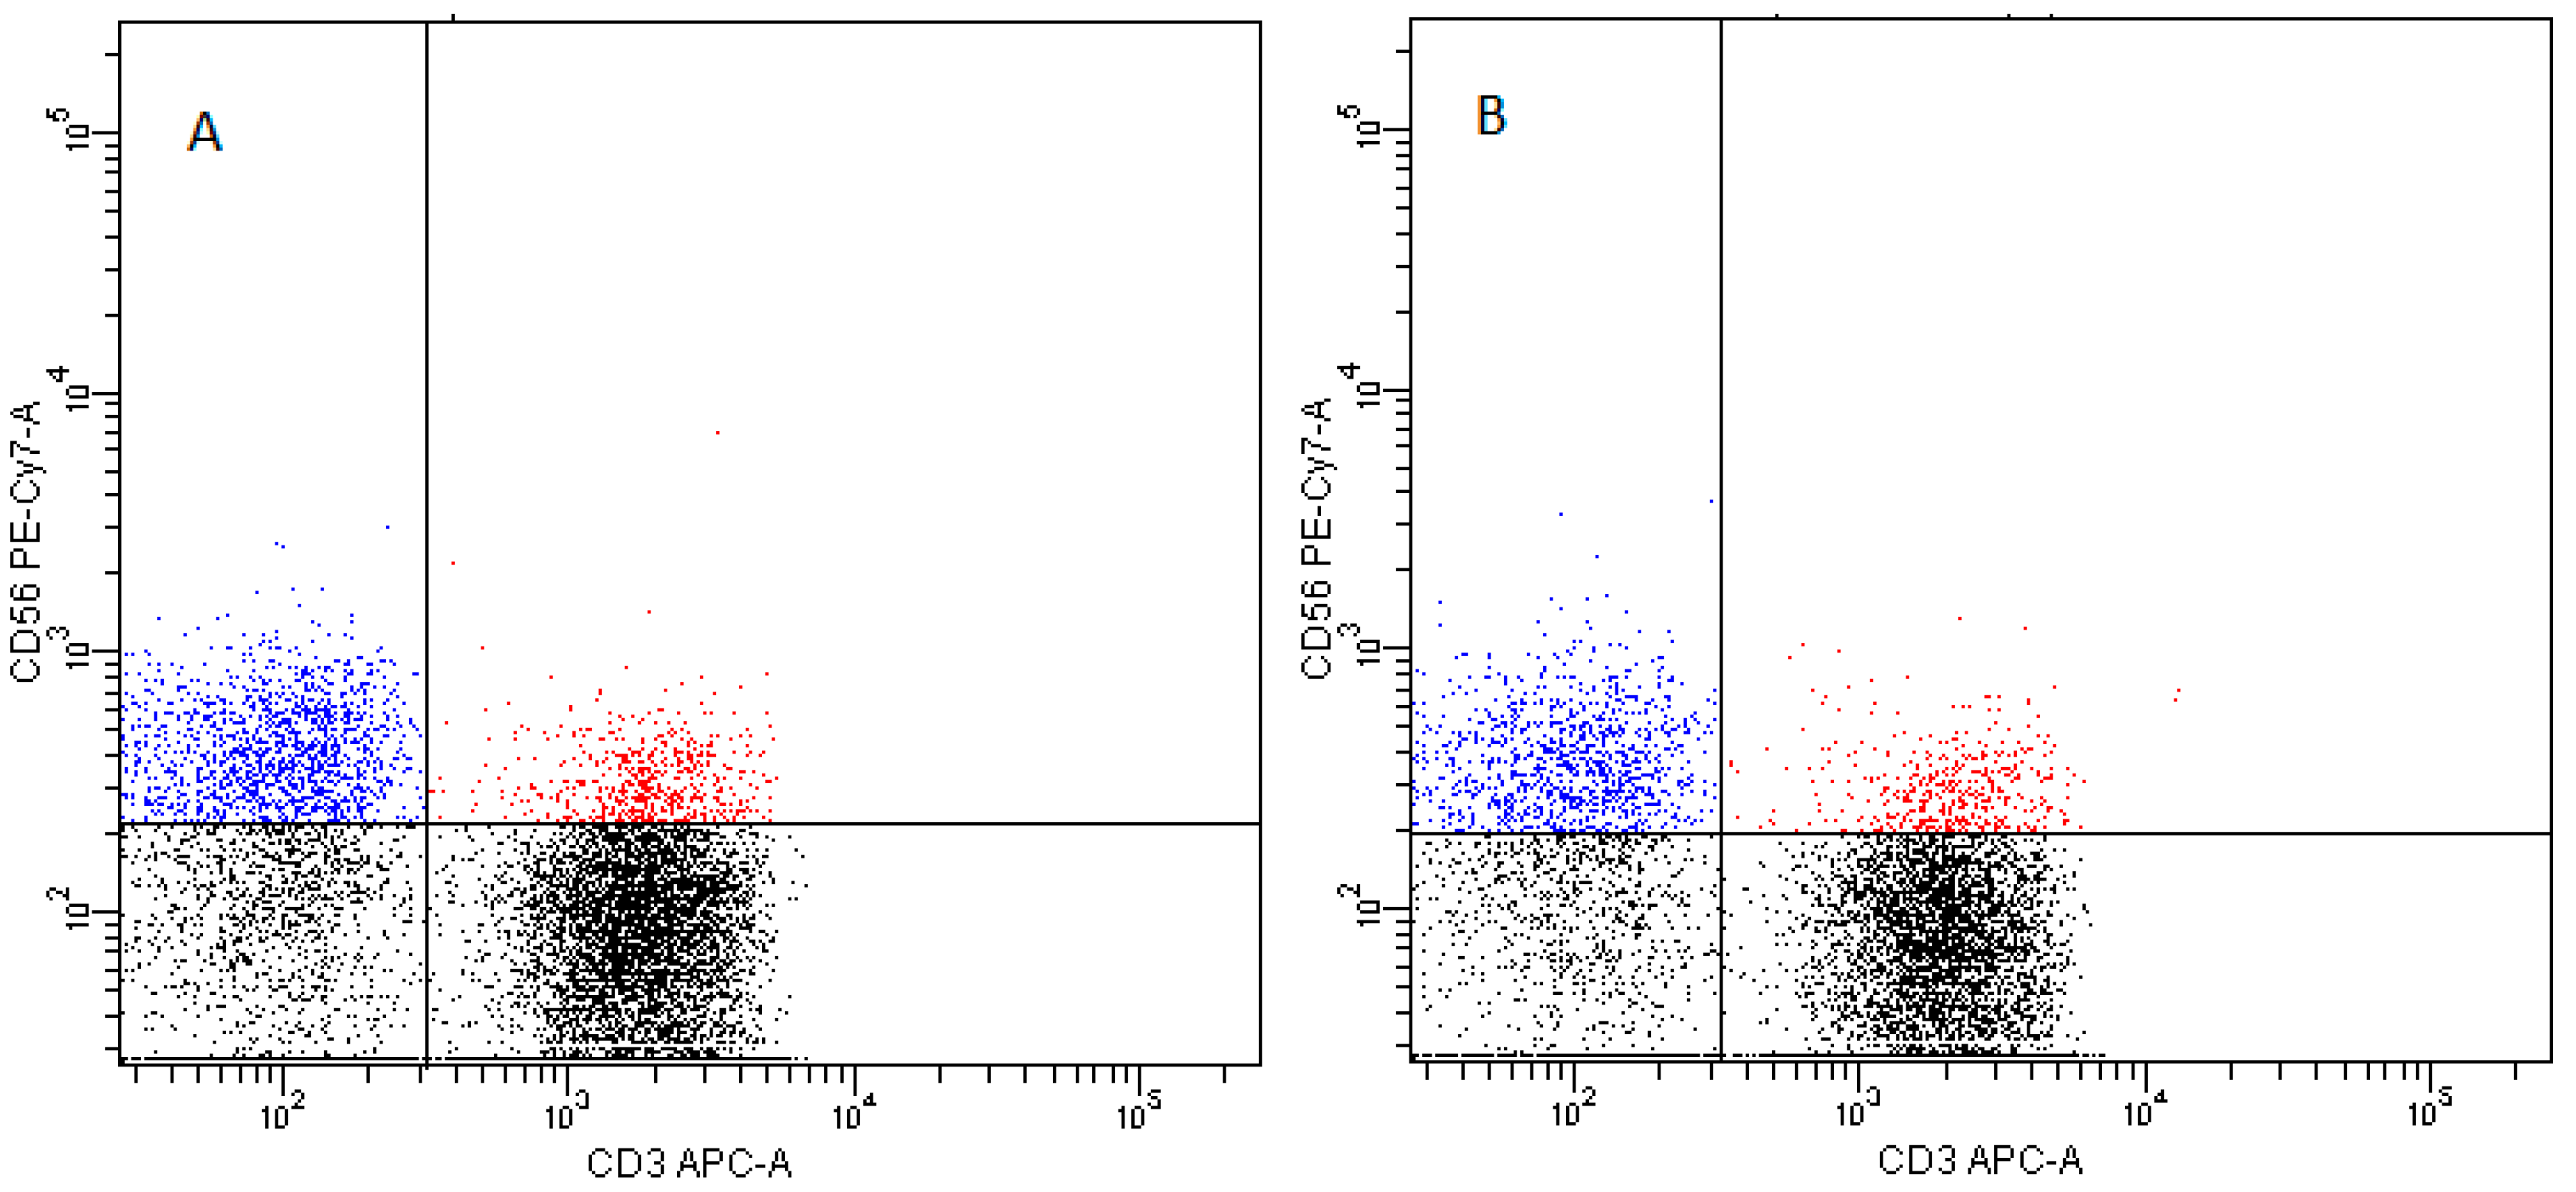
- NK cells—CD3−CD56+ cells—subpopulations of NK cells were recognized on the basis of the surface expression level of CD16 molecule (Figure 16)
- NKT cells—CD3+CD56+ cells (Figure 17)
4.4. Statistical Analysis
5. Conclusions
Author Contributions
Funding
Conflicts of Interest
Abbreviations
| AITD | Autoimmune thyroid diseases |
| anti-Tg | Thyroglobulin antibodies |
| anti-TPO | Thyroid peroxidase antybodies |
| anti-TSHR | TSH receptor antibodies |
| APC | Antigen presenting cells |
| cDCs | Conventional DCs |
| DCs | Dendritic cells |
| FACS | Fluorescence-activated cell sorting |
| FcγRIII | Fc type G immunoglobin receptor |
| FITC | Fluorescein isothiocyanate |
| FNAB | Fine needle aspiration biopsy |
| FSC | Forward side scatter |
| fT3 | Free triiodothyronine |
| fT4 | Free thyroxine |
| GD | Graves’ disease |
| GM-CSF | Granulocyte/macrophage colony-stimulation factor |
| HT | Hashimoto’s thyroiditis |
| IFN | Interferon |
| Ig | Immunoglobulin |
| IL | Interleukin |
| LPS | Lipopolysaccharide |
| MHC | Major histocompatibility complex |
| NK | Natural killer (cells) |
| NKT | Natural killer T (cells) |
| PBMCs | Peripheral blood mononuclear cells |
| PBS | Phosphate buffered saline |
| pDCs | Plasmacytoid DCs |
| PE | Phycoerythrin |
| PerCP | Peridinin-chlorophyll-protein complex |
| PE-Cy7 | Phycoerythrin-cyanin conjugate 7 |
| PSGL-1 | P-selectin glycoprotein ligand-1 |
| slan | 6-Sulfo LacNAc |
| SSC | Side scatter |
| Tg | Thyroglobulin |
| TGF-β | Transcription growth factor-β |
| Th | T helper (cell) |
| TNF | Tumor necrosis factor |
| TPO | Thyroid peroxidase |
| TR | Thyroid hormone receptor |
| TSH | Thyroid stimulating hormone |
| US | Ultrasonography |
References
- Welker, M.J.; Orlov, D. Thyroid nodules. Am. Fam. Phys. 2003, 67, 559–566. [Google Scholar]
- Frates, M.C.; Benson, C.B.; Charboneau, J.W.; Cibas, E.S.; Clark, O.H.; Coleman, B.G.; Cronan, J.J.; Doubilet, P.M.; Evans, D.B.; Goellner, J.R.; et al. Management of thyroid nodules detected at US: Society of Radiologists in Ultrasound consensus conference statement. Ultrasound Q. 2006, 22, 231–240. [Google Scholar] [CrossRef] [PubMed]
- Kabel, P.J.; van Dinther, A.; De Haan-Meulman, M.; Berghout, A.; Voorbij, H.A.; Drexhage, H.A. A diminished adherence of blood lymphocytes of patients with thyroid autoimmune disease to high endothelial venules in the thyroid and the thyroid-draining lymph nodes. Autoimmunity 1990, 5, 247–256. [Google Scholar] [CrossRef]
- Lewiński, A.; Śliwka, P.W.; Stasiołek, M. Dendritic cells in autoimmune disorders and cancer of the thyroid. Folia. Histochem. Cytobiol. 2014, 52, 18–28. [Google Scholar] [CrossRef]
- Durczyński, A.; Stasiolek, M.; Lewiński, A.; Strzelczyk, J. Portal blood—A new source of dendritic cells for pancreatic cancer vaccine. Pancreatology 2014, 14, 409–410. [Google Scholar] [CrossRef] [PubMed]
- Savina, A.; Amigorena, S. Phagocytosis and antigen presentation in dendritic cells. Immunol. Rev. 2007, 219, 143–156. [Google Scholar] [CrossRef] [PubMed]
- Kabel, P.J.; Voorbij, H.A.; De Haan, M.; van der Gaag, R.D.; Drexhage, H.A. Intrathyroidal dendritic cells. J. Clin. Endocrinol. Metab. 1988, 66, 199–207. [Google Scholar] [CrossRef] [PubMed]
- Stasiołek, M. The role of selected immunoregulatory cell populations in autoimmune demyelination. Neuro Endocrinol. Lett. 2011, 32, 25–33. [Google Scholar]
- Vieira, P.L.; de Jong, E.C.; Wierenga, E.A.; Kapsenberg, M.L.; Kaliński, P. Development of Th1-inducing capacity in myeloid dendritic cells requires environmental instruction. J. Immunol. 2000, 164, 4507–4512. [Google Scholar] [CrossRef]
- Oppmann, B.; Lesley, R.; Blom, B.; Timans, J.C.; Xu, Y.; Hunte, B.; Vega, F.; Yu, N.; Wang, J.; Singh, K.; et al. Novel p19 protein engages IL-12p40 to form a cytokine, IL-23, with biological activities similar as well as distinct from IL-12. Immunity 2000, 13, 715–725. [Google Scholar] [CrossRef]
- Ganguly, D.; Chamilos, G.; Lande, R.; Gregorio, J.; Meller, S.; Facchinetti, V.; Homey, B.; Barrat, F.J.; Zal, T.; Gilliet, M. Self-RNA-antimicrobial peptide complexes activate human dendritic cells through TLR7 and TLR8. J. Exp. Med. 2009, 206, 1983–1994. [Google Scholar] [CrossRef] [PubMed] [Green Version]
- Rissoan, M.C.; Soumelis, V.; Kadowaki, N.; Grouard, G.; Briere, F.; de Waal Malefyt, R.; Liu, Y.J. Reciprocal control of T helper cell and dendritic cell differentiation. Science 1999, 283, 1183–1186. [Google Scholar] [CrossRef] [PubMed]
- Moseman, E.A.; Liang, X.; Dawson, A.J.; Panoskaltsis-Mortari, A.; Krieg, A.M.; Liu, Y.J.; Blazar, B.R.; Chen, W. Human plasmacytoid dendritic cells activated by CpG Oligodeoxynucleotides induce the generation of CD4+CD25+ regulatory T cells. J. Immunol. 2004, 173, 4433–4442. [Google Scholar] [CrossRef] [PubMed]
- Fogg, D.K.; Sibon, C.; Miled, C.; Jung, S.; Aucouturier, P.; Littman, D.R.; Cumano, A.; Geissmann, F. Clonogenic Bone Marrow Progenitor Specific for Macrophages and Dendritic Cells. Science 2006, 311, 83–87. [Google Scholar] [CrossRef] [PubMed]
- Danis, V.A.; Franic, G.M.; Rathjen, D.A.; Brooks, P.M. Effects of granulocyte-macrophage colony-stimulating factor (GM-CSF), IL-2, interferon-gamma (IFN-gamma), tumour necrosis factor-alpha (TNF-alpha) and IL-6 on the production of immunoreactive IL-1 and TNF-alpha by human monocytes. Clin. Exp. Immunol. 1991, 85, 143–150. [Google Scholar] [CrossRef]
- Hart, P.H.; Whitty, G.A.; Piccoli, D.S.; Hamilton, J.A. Control by IFN-gamma and PGE2 of TNF alpha and IL-1 production by human monocytes. Immunology 1989, 66, 376–383. [Google Scholar]
- Bailly, S.; Ferrua, B.; Fay, M.; Gougerot-Pocidalo, M.A. Differential regulation of IL 6, IL 1 A, IL 1 beta and TNF alpha production in LPS-stimulated human monocytes: Role of cyclic AMP. Cytokine 1990, 2, 205–210. [Google Scholar] [CrossRef]
- Ribbens, C.; Dayer, J.M.; Chizzolini, C. CD40-CD40 ligand (CD154) engagement is required but may not be sufficient for human T helper 1 cell induction of interleukin-2- or interleukin-15-driven, contact-dependent, interleukin-1beta production by monocytes. Immunology 2000, 99, 279–286. [Google Scholar] [CrossRef] [Green Version]
- Burger, D.; Dayer, J.M. The role of human T-lymphocyte-monocyte contact in inflammation and tissue destruction. Arthritis Res. 2004, 4 (Suppl. 3), S169–S176. [Google Scholar] [CrossRef]
- Ziegler-Heitbrock, L. Monocyte subsets in man and other species. Cell. Immunol. 2014, 289, 135–139. [Google Scholar] [CrossRef]
- Frankenberger, M.; Sternsdorf, T.; Pechumer, H.; Pforte, A.; Ziegler-Heitbrock, H.W. Differential cytokine expression in human blood monocyte subpopulations: A polymerase chain reaction analysis. Blood 1996, 87, 373–377. [Google Scholar] [PubMed]
- Belge, K.U.; Dayyani, F.; Horelt, A.; Siedlar, M.; Frankenberger, M.; Frankenberger, B.; Espevik, T.; Ziegler-Heitbrock, L. The proinflammatory CD14+CD16+DR++ monocytes are a major source of TNF. J. Immunol. 2002, 168, 3536–3542. [Google Scholar] [CrossRef]
- Wong, K.L.; Yeap, W.H.; Tai, J.J.; Ong, S.M.; Dang, T.M.; Wong, S.C. The three human monocyte subsets: Implications for health and disease. Immunol. Res. 2012, 53, 41–57. [Google Scholar] [CrossRef] [PubMed]
- Leskela, S.; Rodríguez-Munoz, A.; de la Fuente, H.; Figueroa-Vega, N.; Bonay, P.; Martín, P.; Serrano, A.; Sánchez-Madrid, F.; González-Amaro, R.; Marazuela, M. Plasmacytoid dendritic cells in patients with autoimmune thyroid disease. J. Clin. Endocrinol. Metab. 2013, 98, 2822–2833. [Google Scholar] [CrossRef] [PubMed]
- Wildgruber, M.; Aschenbrenner, T.; Wendorff, H.; Czubba, M.; Glinzer, A.; Haller, B.; Schiemann, M.; Zimmermann, A.; Berger, H.; Eckstein, H.H.; et al. The “Intermediate” CD14++CD16+ monocyte subset increases in severe peripheral artery disease in humans. Sci. Rep. 2016, 6, 39483. [Google Scholar] [CrossRef] [Green Version]
- Koch, S.; Kucharzik, T.; Heidemann, J.; Nusrat, A.; Luegering, A. Investigating the role of proinflammatory CD16+ monocytes in the pathogenesis of inflammatory bowel disease. Clin. Exp. Immunol. 2010, 161, 332–341. [Google Scholar] [CrossRef]
- Yano, R.; Yamamura, M.; Sunahori, K.; Takasugi, K.; Yamana, J.; Kawashima, M.; Makino, H. Recruitment of CD16+ monocytes into synovial tissues is mediated by fractalkine and CX3CR1 in rheumatoid arthritis patients. Acta Med. Okayama 2007, 61, 89–98. [Google Scholar] [CrossRef] [PubMed]
- Ziegler-Heitbrock, L. Blood Monocytes and Their Subsets: Established Features and Open Questions. Front. Immunol. 2015, 17, 423. [Google Scholar] [CrossRef]
- Skrzeczyńska-Moncznik, J.; Bzowska, M.; Loseke, S.; Grage-Griebenow, E.; Zembala, M.; Pryjma, J. Peripheral blood CD14high CD16+ monocytes are main producers of IL-10. Scand. J. Immunol. 2008, 67, 152–159. [Google Scholar] [CrossRef] [PubMed]
- Wong, K.L.; Tai, J.J.; Wong, W.C.; Han, H.; Sem, X.; Yeap, W.H.; Kourilsky, P.; Wong, S.C. Gene expression profiling reveals the defining features of the classical, intermediate, and nonclassical human monocyte subsets. Blood 2011, 118, e16–e31. [Google Scholar] [CrossRef] [Green Version]
- Zawada, A.M.; Rogacev, K.S.; Rotter, B.; Winter, P.; Marell, R.R.; Fliser, D.; Heine, G.H. SuperSAGE evidence for CD14++CD16+ monocytes as a third monocyte subset. Blood 2011, 118, e50–e61. [Google Scholar] [CrossRef] [PubMed] [Green Version]
- Collin, M.; McGovern, N.; Haniffa, M. Human dendritic cell subsets. Immunology 2013, 140, 22–30. [Google Scholar] [CrossRef] [PubMed]
- Dopheide, J.F.; Obst, V.; Doppler, C.; Radmacher, M.C.; Scheer, M.; Radsak, M.P.; Gori, T.; Warnholtz, A.; Fottner, C.; Daiber, A.; et al. Phenotypic characterisation of pro-inflammatory monocytes and dendritic cells in peripheral arterial disease. Thromb. Haemost. 2012, 108, 1198–1207. [Google Scholar] [CrossRef] [PubMed]
- Cros, J.; Cagnard, N.; Woollard, K.; Patey, N.; Zhang, S.Y.; Senechal, B.; Puel, A.; Biswas, S.K.; Moshous, D.; Picard, C.; et al. Human CD14dim monocytes patrol and sense nucleic acids and viruses via TLR7 and TLR8 receptors. Immunity 2010, 33, 375–386. [Google Scholar] [CrossRef] [PubMed]
- Nimmerjahn, F.; Ravetch, J.V. Fcgamma receptors as regulators of immune responses. Nat. Rev. Immunol. 2008, 8, 34–47. [Google Scholar] [CrossRef] [PubMed]
- Welch, G.R.; Wong, H.L.; Wahl, S.M. Selective induction of Fc gamma RIII on human monocytes by transforming growth factor-beta. J. Immunol. 1990, 144, 3444–3448. [Google Scholar] [PubMed]
- Kimura, E.T.; Kopp, P.; Zbaeren, J.; Asmis, L.M.; Ruchti, C.; Maciel, R.M.; Studer, H. Expression of transforming growth factor beta1, beta2, and beta3 in multinodular goiters and differentiated thyroid carcinomas: A comparative study. Thyroid 1999, 9, 119–125. [Google Scholar] [CrossRef]
- Kasai, K.; Banba, N.; Motohashi, S.; Fukuda, H.; Manaka, K.; Matsumura, M.; Sekiguchi, Y.; Hattori, Y. Production of granulocyte/macrophage and macrophage colony-stimulating factors by human thyrocytes in culture. Biochem. Biophys. Res. Commun. 1997, 238, 191–196. [Google Scholar] [CrossRef]
- Kruger, M.; Coorevits, L.; De Wit, T.P.; Casteels-Van Daele, M.; Van De Winkel, J.G.; Ceuppens, J.L. Granulocyte-macrophage colony-stimulating factor antagonizes the transforming growth factor-beta-induced expression of Fc gamma RIII (CD16) on human monocytes. Immunology 1996, 87, 162–167. [Google Scholar]
- Quast, I.; Cueni, F.; Nimmerjahn, F.; Tackenberg, B.; Lünemann, J.D. Deregulated Fcγ receptor expression in patients with CIDP. Neurol. Neuroimmunol. Neuroinflamm. 2015, 2, e148. [Google Scholar] [CrossRef]
- Teirlinck, A.C.; Roestenberg, M.; Bijker, E.M.; Hoffman, S.L.; Sauerwein, R.W.; Scholzen, A. Plasmodium falciparum Infection of Human Volunteers Activates Monocytes and CD16+ Dendritic Cells and Induces Upregulation of CD16 and CD1c Expression. Infect. Immun. 2015, 83, 3732–3739. [Google Scholar] [CrossRef] [PubMed]
- Liu, Y.; Liu, M.; Zhang, Y.; Qu, C.; Lu, G.; Huang, Y.; Zhang, H.; Yu, N.; Yuan, S.; Gao, Y.; et al. The expression of Fcγ receptors in Hashimoto’s thyroiditis. Cell. Immunol. 2015, 294, 33–38. [Google Scholar] [CrossRef] [PubMed]
- Dubaniewicz, A.; Typiak, M.; Wybieralska, M.; Szadurska, M.; Nowakowski, S.; Staniewicz-Panasik, A.; Rogoza, K.; Sternau, A.; Deeg, P.; Trzonkowski, P. Changed phagocytic activity and pattern of Fcγ and complement receptors on blood monocytes in sarcoidosis. Hum. Immunol. 2012, 73, 788–794. [Google Scholar] [CrossRef] [PubMed]
- Hepburn, A.L.; Mason, J.C.; Davies, K.A. Expression of Fcgamma and complement receptors on peripheral blood monocytes in systemic lupus erythematosus and rheumatoid arthritis. Rheumatology (Oxford) 2004, 43, 547–554. [Google Scholar] [CrossRef] [PubMed]
- Guéry, L.; Hugues, S. Tolerogenic and activatory plasmacytoid dendritic cells in autoimmunity. Front. Immunol. 2013, 6, 59. [Google Scholar] [CrossRef] [PubMed]
- Zhou, Z.; Li, W.; Song, Y.; Wang, L.; Zhang, K.; Yang, J.; Zhang, W.; Su, H.; Zhang, Y. Growth differentiation factor- 15 suppresses maturation and function of dendritic cells and inhibits tumor-specificimmune response. PLoS ONE 2013, 8, e78618. [Google Scholar]
- Mao, C.; Wang, S.; Xiao, Y.; Xu, J.; Jiang, Q.; Jin, M.; Jiang, X.; Guo, H.; Ning, G.; Zhang, Y. Impairment of Regulatory Capacity of CD4+CD25+ Regulatory T Cells Mediated by Dendritic Cell Polarization and Hyperthyroidism in Graves’ Disease. J. Immunol. 2011, 186, 4734–4743. [Google Scholar] [CrossRef]
- Piccioli, D.; Tavarini, S.; Borgogni, E.; Steri, V.; Nuti, S.; Sammicheli, C.; Bardelli, M.; Montagna, D.; Locatelli, F.; Wack, A. Functional specialization of human circulating CD16 and CD1c myeloid dendritic-cell subsets. Blood 2007, 109, 5371–5379. [Google Scholar] [CrossRef] [Green Version]
- Melsen, J.E.; Lugthart, G.; Lankester, A.C.; Schilham, M.W. Human Circulating and Tissue-Resident CD56(bright) Natural Killer Cell Populations. Front. Immunol. 2016, 7, 262. [Google Scholar] [CrossRef]
- Gogali, F.; Paterakis, G.; Rassidakis, G.Z.; Liakou, C.I.; Liapi, C. CD3(-)CD16(-)CD56(bright) immunoregulatory NK cells are increased in the tumor microenvironment and inversely correlate with advanced stages in patients with papillary thyroid cancer. Thyroid 2013, 23, 1561–1568. [Google Scholar] [CrossRef]
- Gogali, F.; Paterakis, G.; Rassidakis, G.Z.; Kaltsas, G.; Liakou, C.I.; Gousis, P.; Neonakis, E.; Manoussakis, M.N.; Liapi, C. Phenotypical analysis of lymphocytes with suppressive and regulatory properties (Tregs) and NK cells in the papillary carcinoma of thyroid. J. Clin. Endocrinol. Metab. 2012, 97, 1474–1482. [Google Scholar] [CrossRef] [PubMed]
- Dzionek, A.; Fuchs, A.; Schmidt, P.; Cremer, S.; Zysk, M.; Miltenyi, S.; Buck, D.W.; Schmitz, J. BDCA-2, BDCA-3, and BDCA-4: Three markers for distinct subsets of dendritic cells in human peripheral blood. J. Immunol. 2000, 165, 6037–6046. [Google Scholar] [CrossRef] [PubMed]


| Parameters | All Patients | Non-AITD Patients | AITD Patients | |||||||||
|---|---|---|---|---|---|---|---|---|---|---|---|---|
| Min. | Med. | Max. | Mean | Min. | Med. | Max. | Mean | Min. | Med. | Max. | Mean | |
| Age (years) | 23 | 52 | 85 | 53.37 | 23 | 53 | 85 | 54.02 | 31 | 52 | 85 | 52.57 |
| TSH (µIU/mL) | 0.01 | 1.15 | 67.3 | 2.85 | 0.01 | 1.04 | 67.3 | 3.34 | 0.01 | 1.47 | 6.96 | 2.05 |
| fT3 (pg/mL) | 1.12 | 3.12 | 9.5 | 3.20 | 1.22 | 3.11 | 5.3 | 3.22 | 2.58 | 3.1 | 4.14 | 3.17 |
| fT4 (ng/dL) | 0.85 | 1.28 | 10.07 | 1.46 | 0.86 | 1.25 | 10.07 | 1.47 | 0.89 | 1.31 | 1.78 | 1.33 |
| anti-TPO (IU/mL) | <0.5 | 13.35 | >600 | 59 | <0.5 | 9.08 | 33 | 10.92 | <0.5 | 104.87 | >600 | 183.88 |
| anti-Tg (IU/mL) | <10 | 20.8 | 484 | 85.37 | <10 | 14.50 | 106.2 | 21.81 | <10 | 31.51 | 471.7 | 139.72 |
| anti-TSHR (IU/mL) | <0.3 | 0.32 | 7.44 | 0.61 | <0.3 | 0.34 | 1.05 | 0.30 | <0.3 | 0.3 | 7.44 | 0.77 |
| Sex (F/M) | 77/13 | 57/10 | 20/3 | |||||||||
© 2019 by the authors. Licensee MDPI, Basel, Switzerland. This article is an open access article distributed under the terms and conditions of the Creative Commons Attribution (CC BY) license (http://creativecommons.org/licenses/by/4.0/).
Share and Cite
Stasiołek, M.; Śliwka, P.W.; Stasiak, M.; Krawczyk-Rusiecka, K.; Skowrońska-Jóźwiak, E.; Adamczewski, Z.; Lewiński, A. Differences of the Structure of Immune Regulatory Cell Populations between Cellular Material from Sonographically Detected Focal Thyroid Lesions and Peripheral Blood in Humans. Int. J. Mol. Sci. 2019, 20, 918. https://doi.org/10.3390/ijms20040918
Stasiołek M, Śliwka PW, Stasiak M, Krawczyk-Rusiecka K, Skowrońska-Jóźwiak E, Adamczewski Z, Lewiński A. Differences of the Structure of Immune Regulatory Cell Populations between Cellular Material from Sonographically Detected Focal Thyroid Lesions and Peripheral Blood in Humans. International Journal of Molecular Sciences. 2019; 20(4):918. https://doi.org/10.3390/ijms20040918
Chicago/Turabian StyleStasiołek, Mariusz, Przemysław W. Śliwka, Magdalena Stasiak, Kinga Krawczyk-Rusiecka, Elżbieta Skowrońska-Jóźwiak, Zbigniew Adamczewski, and Andrzej Lewiński. 2019. "Differences of the Structure of Immune Regulatory Cell Populations between Cellular Material from Sonographically Detected Focal Thyroid Lesions and Peripheral Blood in Humans" International Journal of Molecular Sciences 20, no. 4: 918. https://doi.org/10.3390/ijms20040918