Adaptive Support Ventilation Attenuates Ventilator Induced Lung Injury: Human and Animal Study

 and
and
Abstract
:1. Introduction
2. Results
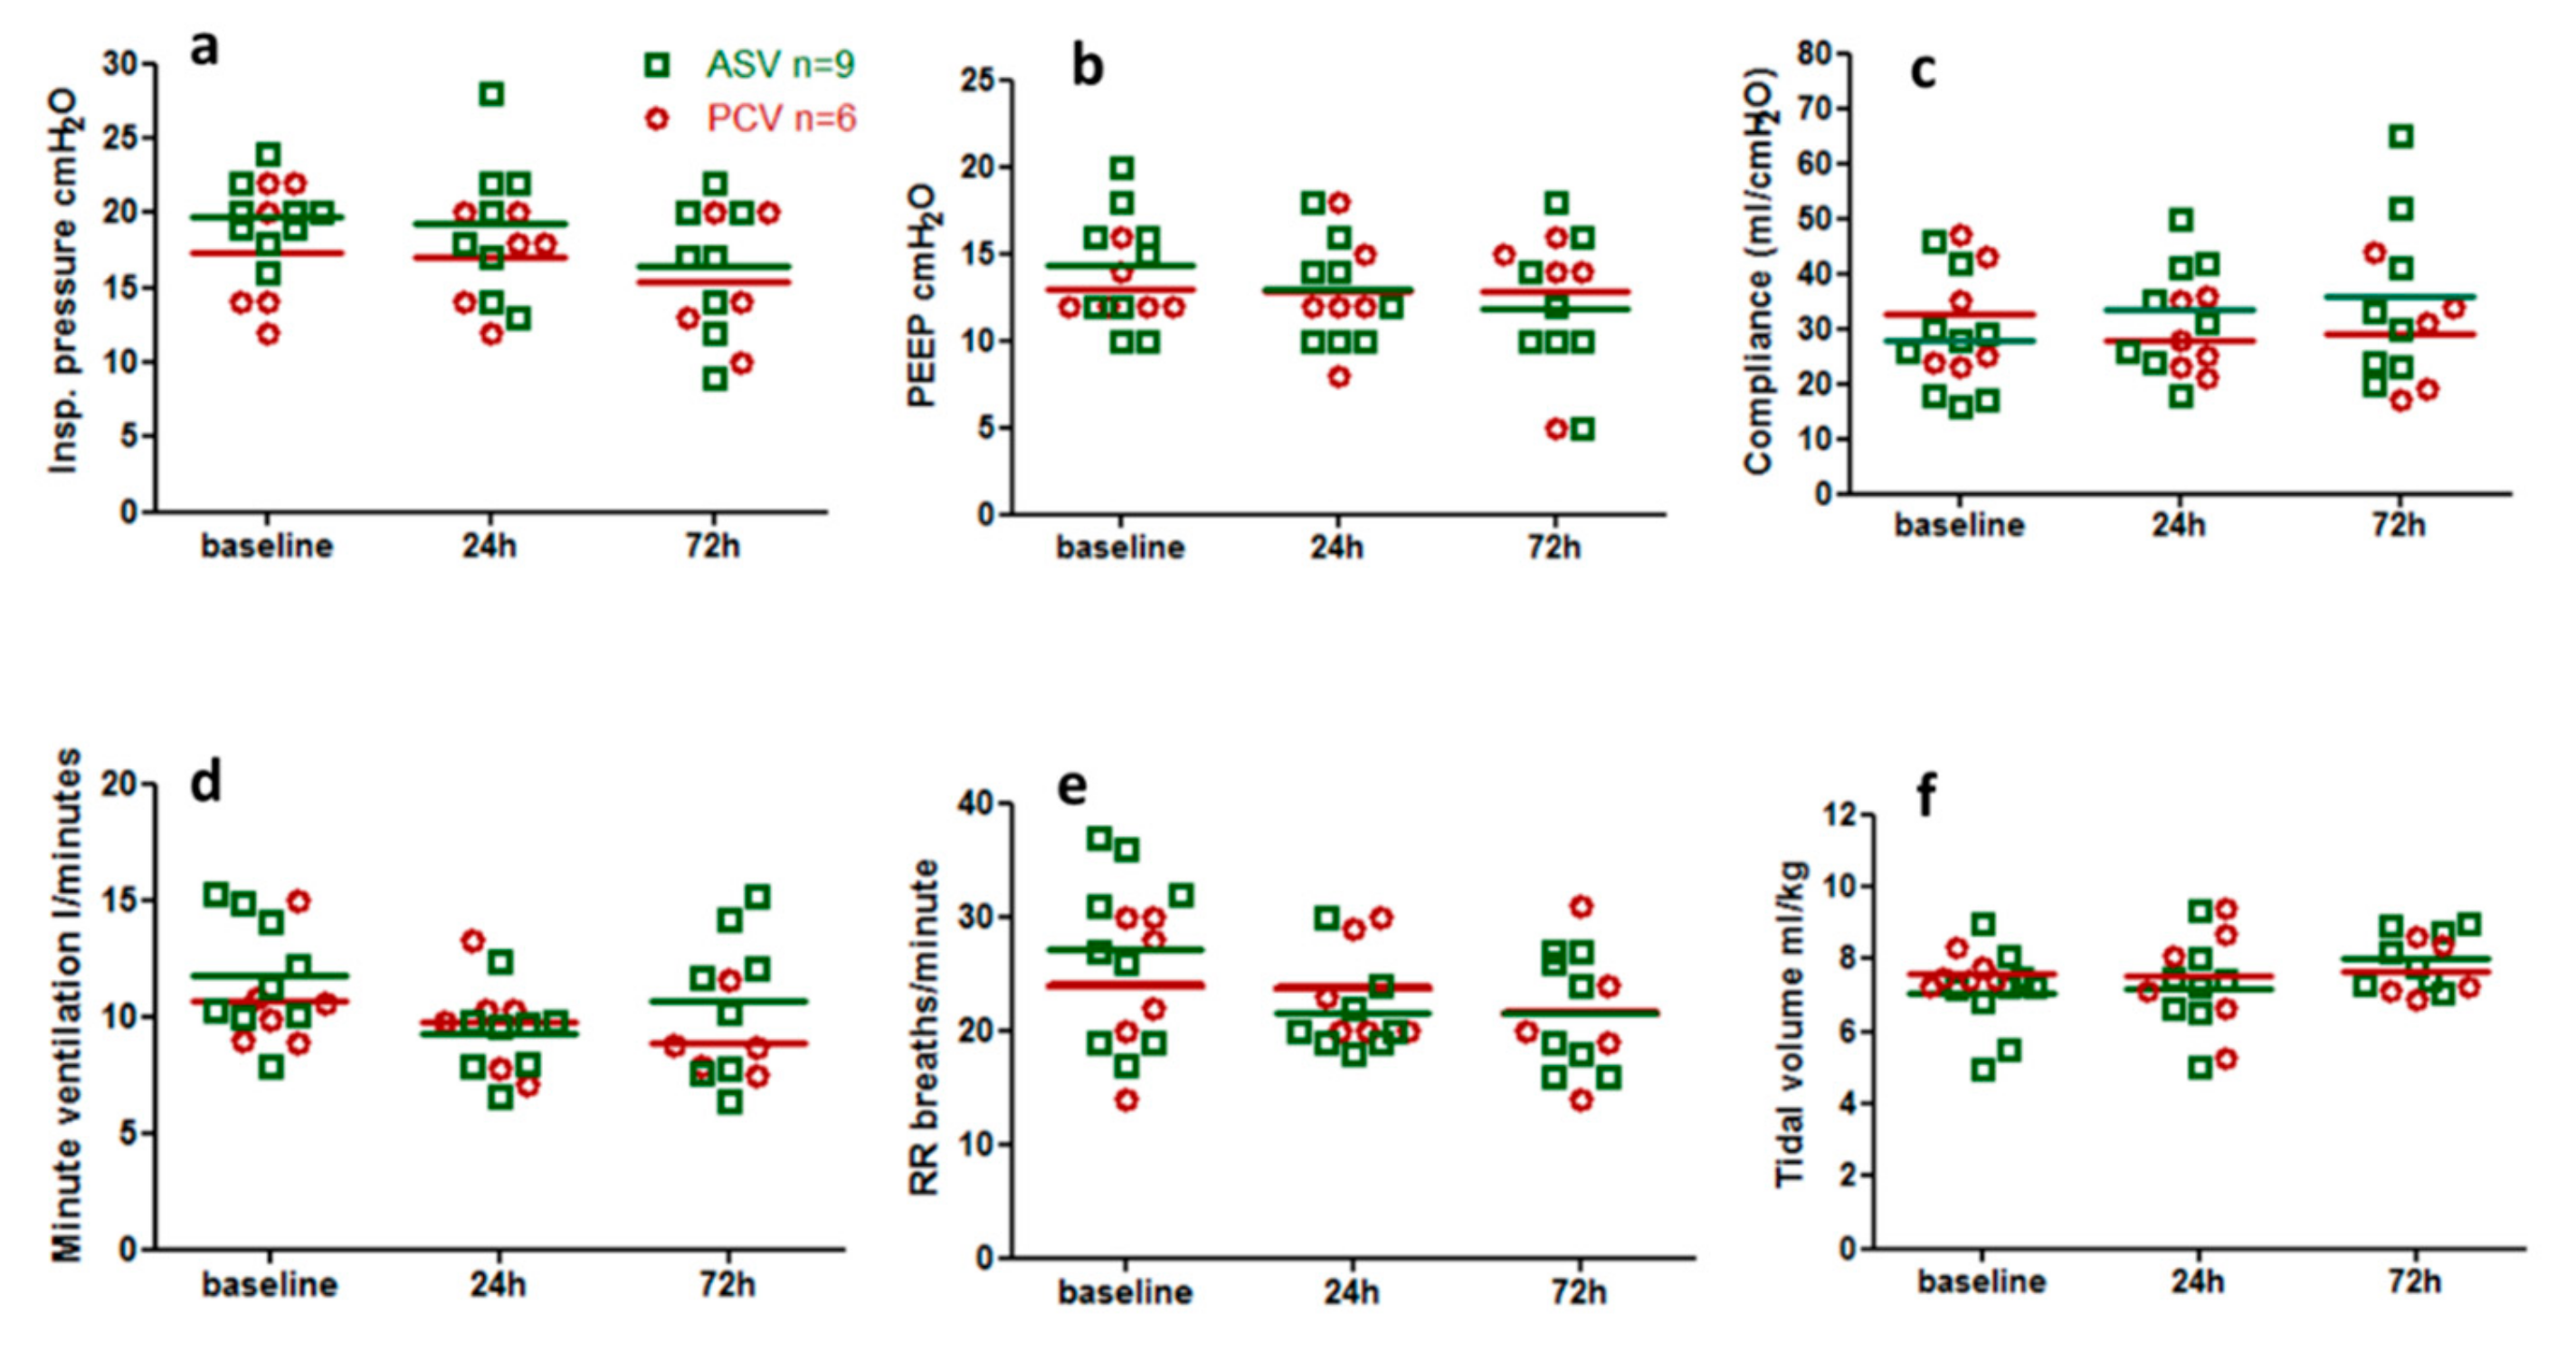
2.1. Human Studies
2.2. Animal Experiments
2.2.1. Physiological Parameters
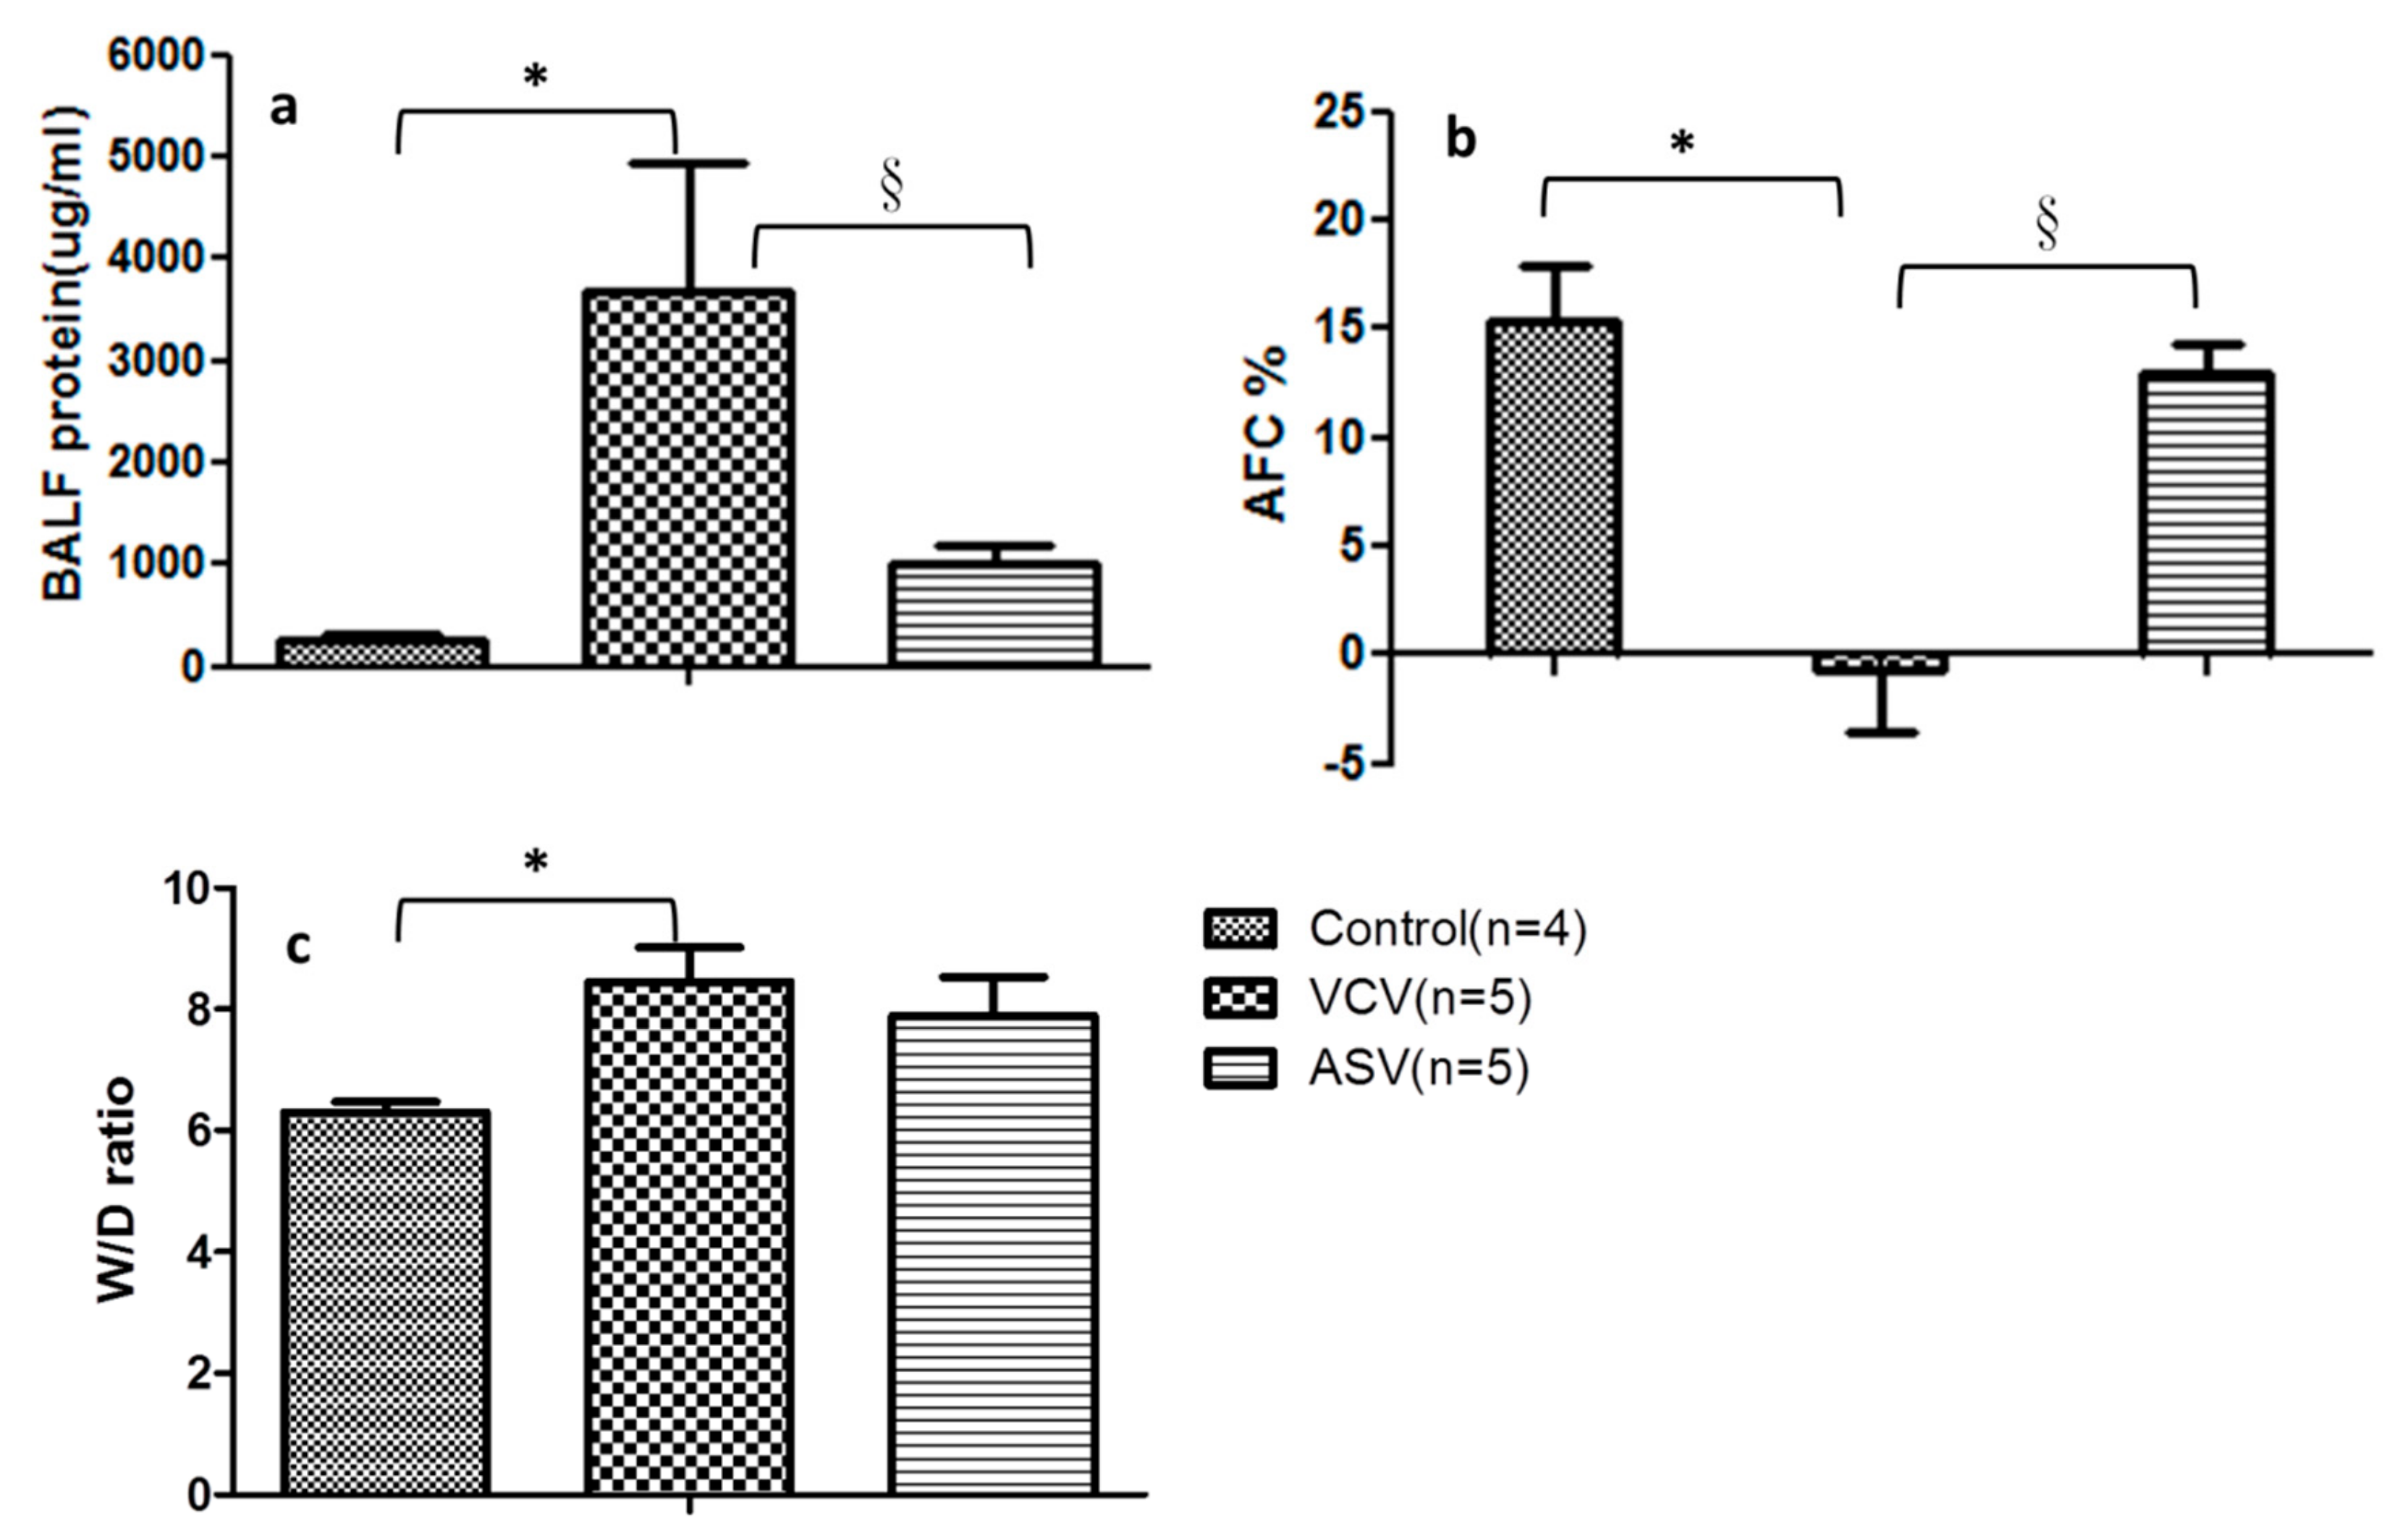
2.2.2. Indicators of Lung Injury
2.2.3. Epithelial Barrier Functions
3. Discussion
4. Materials and Methods
4.1. Human Studies
4.1.1. Ethics Statement
4.1.2. Study Design
4.1.3. Measurements
4.2. Animal Experiments
4.2.1. Animal Preparation and Cannulation
4.2.2. Induction of ARDS by Surfactant Deactivation
4.2.3. Experimental Protocol
4.2.4. Physiological Measurements
4.2.5. Alveolar Fluid Clearance
4.2.6. Ratio of Lung W/D Weight
4.2.7. Bronchoalveolar Lavage Fluid (BALF)
4.2.8. Total Protein Analysis
4.2.9. Measurement of Proinflammatory and Oxidative Stress Cytokine Concentrations
4.2.10. Gelatin Zymography
4.2.11. Western Blotting for Claudin-4 and Occludin
4.2.12. Statistical Analysis
5. Conclusions
Supplementary Materials
Author Contributions
Funding
Acknowledgments
Conflicts of Interest
Abbreviations
| AFC | Alveolar fluid clearance |
| ALI | Acute lung injury |
| APACHEII | Acute physiology and chronic health evaluation score II |
| ARDS | Acute respiratory distress syndrome |
| ARDSNet | Acute Respiratory Distress Syndrome Network; |
| ASV | Adaptive support ventilation |
| BALF | Bronchoalveolar lavage fluid |
| BSA | Bovine serum albumin |
| CI | Cardiac index |
| Cst | Static lung compliance |
| CVs | Coefficients of variance |
| ECM | Extracellular matrix |
| EIT | Electrical impedance tomography |
| ELISA | Enzyme-linked immunosorbent assay |
| ELWI | Extravascular lung water index |
| EtCO2 | End-tidal carbon dioxide |
| FiO2 | Fraction of inspired oxygen |
| FITC | Fluorescein isothiocyanate |
| HR | Heart rate |
| IBW | Ideal body weight |
| ICU | Intensive care unit |
| IL-1β | Interleukin-1β |
| IL-6 | Interleukin-6 |
| IL-8 | Interleukin-8 |
| Insp. Flow | Inspiratory flow rate |
| IQR | Inter-quartile range |
| MAP | Mean arterial blood pressure; |
| MMP-2 | Matrix metalloproteinase 2 |
| MMP-9 | Matrix metalloproteinase 9 |
| P/F ratio | Ratio of arterial partial pressure of oxygen to the fraction of inspired oxygen |
| PCV | Pressure-control ventilation |
| PCWP | Pulmonary capillary wedge pressure |
| PEEP | Positive end-expiratory pressure |
| PiCCO: | Pulse-induced contour cardiac output |
| PPeak | Peak airway pressure |
| RR | Respiratory rate |
| Rrs | Resistance of the respiratory system |
| SD | Standard deviation |
| TBS | Tetramethyl benzoate substrate |
| TNF-α | Tumor necrosis factor α |
| VCV | Volume-control ventilation |
| VE | Minute ventilation |
| VILI | Ventilator induced lung injury |
| VT | Tidal volume |
| W/D ratio | Lung tissue wet/dry ratio |
References
- Ashbaugh, D.G.; Boyd, B.; Petty, T.; Levine, B.; Michigan, E. ACUTE RESPIRATORY DISTRESS IN ADULTS. Lancet 1967, 290, 319–323. [Google Scholar] [CrossRef]
- Bernard, G.R.; Artigas, A.; Brigham, K.L.; Carlet, J.; Falke, K.; Hudson, L.; Lamy, M.; Legall, J.R.; Morris, A.; Spragg, R. The American-European Consensus Conference on ARDS. Definitions, mechanisms, relevant outcomes, and clinical trial coordination. Am. J. Respir. Crit. Care Med. 1994, 149, 818–824. [Google Scholar] [CrossRef] [PubMed]
- Thompson, B.T.; Chambers, R.C.; Liu, K.D. Acute Respiratory Distress Syndrome. N Engl. J. Med. 2017, 377, 562–572. [Google Scholar] [CrossRef] [PubMed]
- Dreyfuss, D.; Saumon, G. Ventilator-induced Lung Injury. Am. J. Respir. Crit. Care Med. 1998, 157, 294–323. [Google Scholar] [CrossRef] [PubMed]
- Slutsky, A.S.; Ranieri, V.M. Ventilator-induced lung injury. N Engl. J. Med. 2013, 369, 2126–2136. [Google Scholar] [CrossRef] [PubMed]
- Chiumello, D.; Brochard, L.; Marini, J.J.; Slutsky, A.S.; Mancebo, J.; Ranieri, V.M.; Thompson, B.T.; Papazian, L.; Schultz, M.J.; Amato, M.; et al. Respiratory support in patients with acute respiratory distress syndrome: An expert opinion. Crit Care 2017, 21, 240. [Google Scholar] [CrossRef]
- Matthay, M.A.; Ware, L.B.; Zimmerman, G.A. The acute respiratory distress syndrome. J. Clin. Invest. 2012, 122, 2731–2740. [Google Scholar] [CrossRef]
- Pelosi, P.; Negrini, D. Extracellular matrix and mechanical ventilation in healthy lungs: Back to baro/volotrauma? Curr. Opin. Crit. Care 2008, 14, 16–21. [Google Scholar] [CrossRef]
- Lellouche, F.; Brochard, L. Advanced closed loops during mechanical ventilation (PAV, NAVA, ASV, SmartCare). Best Pract. Res. Clin. Anaesthesiol. 2009, 23, 81–93. [Google Scholar] [CrossRef]
- Otis, A.B.; Fenn, W.O.; Rahn, H. Mechanics of breathing in man. J. Appl. Physiol. 1950, 2, 592–607. [Google Scholar] [CrossRef]
- Belliato, M.; Palo, A.; Pasero, D.; Iotti, G.A.; Mojoli, F.; Braschi, A. Evaluation of adaptive support ventilation in paralysed patients and in a physical lung model. Int. J. Artif. Organs 2004, 27, 709–716. [Google Scholar] [CrossRef] [PubMed]
- Brunner, J.X.; Iotti, G.A. Adaptive Support Ventilation (ASV). Minerva Anestesiol. 2002, 68, 365–368. [Google Scholar] [PubMed]
- Campbell, R.S.; Branson, R.D.; Johannigman, J.A. Adaptive support ventilation. Respir. Care Clin. North. Am. 2001, 7, 425–440. [Google Scholar] [CrossRef]
- Cassina, T.; Chiolero, R.; Mauri, R.; Revelly, J.P. Clinical experience with adaptive support ventilation for fast-track cardiac surgery. J. Cardiothorac. Vasc. Anesth. 2003, 17, 571–575. [Google Scholar] [CrossRef]
- Chen, C.W.; Wu, C.P.; Dai, Y.L.; Perng, W.C.; Chian, C.F.; Su, W.L.; Huang, Y.C. Effects of implementing adaptive support ventilation in a medical intensive care unit. Respir. Care 2011, 56, 976–983. [Google Scholar] [CrossRef] [PubMed]
- Sulzer, C.F.; Chiolero, R.; Chassot, P.G.; Mueller, X.M.; Revelly, J.P. Adaptive support ventilation for fast tracheal extubation after cardiac surgery: A randomized controlled study. Anesthesiology 2001, 95, 1339–1345. [Google Scholar] [CrossRef]
- Tassaux, D.; Dalmas, E.; Gratadour, P.; Jolliet, P. Patient-ventilator interactions during partial ventilatory support: A preliminary study comparing the effects of adaptive support ventilation with synchronized intermittent mandatory ventilation plus inspiratory pressure support. Crit. Care Med. 2002, 30, 801–807. [Google Scholar] [CrossRef]
- Agarwal, R.; Srinivasan, A.; Aggarwal, A.N.; Gupta, D. Adaptive support ventilation for complete ventilatory support in acute respiratory distress syndrome: A pilot, randomized controlled trial. Respirol. (CarltonVic.) 2013, 18, 1108–1115. [Google Scholar] [CrossRef]
- Dongelmans, D.A.; Veelo, D.P.; Bindels, A.; Binnekade, J.M.; Koppenol, K.; Koopmans, M.; Korevaar, J.C.; Kuiper, M.A.; Schultz, M.J. Determinants of tidal volumes with adaptive support ventilation: A multicenter observational study. Anesth. Analg. 2008, 107, 932–937. [Google Scholar] [CrossRef]
- Iotti, G.A.; Polito, A.; Belliato, M.; Pasero, D.; Beduneau, G.; Wysocki, M.; Brunner, J.X.; Braschi, A.; Brochard, L.; Mancebo, J.; et al. Adaptive support ventilation versus conventional ventilation for total ventilatory support in acute respiratory failure. Intensive Care Med. 2010, 36, 1371–1379. [Google Scholar] [CrossRef]
- Elizabeth, R.; Johnson, B.S.M.A.M. Acute Lung Injury: Epidemiology, Pathogenesis, and Treatment. J. Aerosol Med. Pulm. Drug Deliv. 2010, 23, 243–252. [Google Scholar]
- Veelo, D.P.; Dongelmans, D.A.; Binnekade, J.M.; Paulus, F.; Schultz, M.J. Adaptive support ventilation: A translational study evaluating the size of delivered tidal volumes. Int. J. Artif. Organs 2010, 33, 302–309. [Google Scholar] [CrossRef] [PubMed]
- Arnal, J.M.; Wysocki, M.; Nafati, C.; Donati, S.; Granier, I.; Corno, G.; Durand-Gasselin, J. Automatic selection of breathing pattern using adaptive support ventilation. Intensive Care Med. 2008, 34, 75–81. [Google Scholar] [CrossRef] [PubMed]
- Arnal, J.-M.; Wysocki, M.; Novotni, D.; Demory, D.; Lopez, R.; Donati, S.; Granier, I.; Corno, G.; Durand-Gasselin, J. Safety and efficacy of a fully closed-loop control ventilation (IntelliVent-ASV®) in sedated ICU patients with acute respiratory failure: A prospective randomized crossover study. Intensive Care Med. 2012, 38, 781–787. [Google Scholar] [CrossRef] [PubMed]
- Pomprapa, A.; Schwaiberger, D.; Pickerodt, P.; Tjarks, O.; Lachmann, B.; Leonhardt, S. Automatic protective ventilation using the ARDSNet protocol with the additional monitoring of electrical impedance tomography. Crit. Care 2014, 18, R128. [Google Scholar] [CrossRef]
- Chiumello, D.; Carlesso, E.; Cadringher, P.; Caironi, P.; Valenza, F.; Polli, F.; Tallarini, F.; Cozzi, P.; Cressoni, M.; Colombo, A.; et al. Lung stress and strain during mechanical ventilation for acute respiratory distress syndrome. Am. J. Respir. Crit. Care Med. 2008, 178, 346–355. [Google Scholar] [CrossRef]
- Samary, C.S.; Moraes, L.; Santos, C.L.; Huhle, R.; Santos, R.S.; Ornellas, D.S.; Felix, N.S.; Capelozzi, V.L.; Schanaider, A.; Pelosi, P.; et al. Lung Functional and Biologic Responses to Variable Ventilation in Experimental Pulmonary and Extrapulmonary Acute Respiratory Distress Syndrome. Crit. Care Med. 2016, 44, e553–e562. [Google Scholar] [CrossRef]
- Spieth, P.M.; Carvalho, A.R.; Pelosi, P.; Hoehn, C.; Meissner, C.; Kasper, M.; Hubler, M.; von Neindorff, M.; Dassow, C.; Barrenschee, M.; et al. Variable tidal volumes improve lung protective ventilation strategies in experimental lung injury. Am. J. Respir. Crit. Care Med. 2009, 179, 684–693. [Google Scholar] [CrossRef]
- Rentzsch, I.; Santos, C.L.; Huhle, R.; Ferreira, J.M.C.; Koch, T.; Schnabel, C.; Koch, E.; Pelosi, P.; Rocco, P.R.M.; Gama de Abreu, M. Variable stretch reduces the pro-inflammatory response of alveolar epithelial cells. PloS ONE 2017, 12, e0182369. [Google Scholar] [CrossRef]
- Muellenbach, R.M.; Kredel, M.; Bernd, Z.; Johannes, A.; Kuestermann, J.; Schuster, F.; Schwemmer, U.; Wurmb, T.; Wunder, C.; Roewer, N.; et al. Acute respiratory distress induced by repeated saline lavage provides stable experimental condition for 24 h in pigs. Exp. Lung Res. 2009, 35, 222–233. [Google Scholar] [CrossRef]
- Kenneth, J.C., Jr.; Oswari, J.; Margulies, S.S. Role of Stretch on Tight Junction Structure in Alveolar Epithelial Cells. Am. J. Respir. Cell Mol. Biol. 2001, 25, 584–591. [Google Scholar] [CrossRef] [PubMed]
- Chakrabarti, S.; Patel, K.D. Matrix metalloproteinase-2(MMP-2) and MMP-9 in pumonary pathology. Exp. Lung Res. 2005, 31, 599–621. [Google Scholar] [CrossRef] [PubMed]
- Lanchou, J.; Corbel, M.; Tanguy, M.; Germain, N.; Boichot, E.; Theret, N.; Clement, B.; Lagente, V.; Malledant, Y. Imbalance between matrix metalloproteinases (MMP-9 and MMP-2) and tissue inhibitors of metalloproteinases (TIMP-1 and TIMP-2) in acute respiratory distress syndrome patients. Crit. Care Med. 2003, 31, 536–542. [Google Scholar] [CrossRef] [PubMed]
- Pirrone, F.; Pastore, C.; Mazzola, S.; Albertini, M. In vivo study of the behaviour of matrix metalloproteinases (MMP-2, MMP-9) in mechanical, hypoxic and septic-induced acute lung injury. Vet. Res. Commun. 2009, 33, 121–124. [Google Scholar] [CrossRef] [PubMed]
- Rokkam, D.; LaFemina, M.J.; Lee, J.W.; Matthay, M.A.; Frank, J.A. Claudin-4 Levels Are Associated with Intact Alveolar Fluid Clearance in Human Lungs. Am. J. Pathol. 2011, 179, 1081–1087. [Google Scholar] [CrossRef] [PubMed]
- Lan, C.C.; Chang, C.Y.; Peng, C.K.; Wu, C.P.; Huang, K.L.; Lee, S.C.; Chang, H. Effect of body positions on hemodynamics and gas exchange in anesthetized pigs shortly after pneumonectomy. Shock 2010, 34, 482–487. [Google Scholar] [CrossRef] [PubMed]
- Lan, C.C.; Hsu, H.H.; Wu, C.P.; Lee, S.C.; Peng, C.K.; Chang, H. Influences of pleural effusion on respiratory mechanics, gas exchange, hemodynamics, and recruitment effects in acute respiratory distress syndrome. J. Surg. Res. 2014, 186, 346–353. [Google Scholar] [CrossRef]
- Norlin, A.; Finley, N.; Abedinpour, P.; Folkesson, H.G. Alveolar liquid clearance in the anesthetized ventilated guinea pig. Am. J. Physiol. 1998, 274, L235–L243. [Google Scholar] [CrossRef]
- Chintagari, N.R.; Liu, L. GABA receptor ameliorates ventilator-induced lung injury in rats by improving alveolar fluid clearance. Crit. Care 2012, 16, R55. [Google Scholar] [CrossRef] [Green Version]
- Gushima, Y.; Ichikado, K.; Suga, M.; Okamoto, T.; Iyonaga, K.; Sato, K.; Miyakawa, H.; Ando, M. Expression of matrix metalloproteinases in pigs with hyperoxia-induced acute lung injury. Eur. Respir J. 2001, 18, 827–837. [Google Scholar] [CrossRef] [Green Version]


| Variable | ASV Group (n = 9) | PCV Group (n = 6) | p Value |
|---|---|---|---|
| Age, yr, mean ±SD | 62.0 ± 18.5 | 62.5 ± 30.3 | 0.776 |
| ApacheⅡscores, mean ±SD | 17.0 ± 5.44 | 21 ± 8.46 | 0.524 |
| Gender, male/female (%) | 7/2(77.8/22.2) | 4/2(66.7/33.3) | 1 |
| Baseline Condition | |||
| IBW, kg, mean ±SD | 61.9 ± 6.23 | 57.2 ± 7.33 | 0.145 |
| PaO2/FiO2, mean ±SD | 153.6 ± 53.6 | 156.7 ± 32.8 | 1 |
| Static compliance, ml/cmH2O, mean ±SD | 28.0 ± 10.6 | 32.7 ± 10.5 | 0.529 |
| Pressure level, cmH2O, mean ±SD | 19.8 ± 2.79 | 17.3 ± 4.5 | 0.456 |
| PEEP level, cmH2O, mean ±SD | 14.8 ± 3.15 | 12.4 ± 0.9 | 0.066 |
| Minute volume, l/min, mean ±SD | 11.8 ± 2.52 | 10.7 ± 2.26 | 0.388 |
| Tidal volume/IBW, ml/kg, mean ±SD | 7.06 ± 1.2 | 7.61 ± 0.38 | 0.272 |
| Total respiratory rate, breaths/min, mean ±SD | 27.1 ± 7.5 | 24.0 ± 6.5 | 0.529 |
| Mean BP, mmHg, mean ±SD | 90.4 ± 16.9 | 84.5 ± 28.8 | 0.607 |
| Sedation +/−, (%) | 8/1(88.9/11.1) | 6/0(100/0) | 1 |
| Muscle relaxants +/−, (%) | 4/5(44.4/55.6) | 2/4(33.3/66.7) | 1 |
| Inotropic drug +/−, (%) | 1/8(11.1/88.9) | 3/3(50/50) | 0.235 |
| Main Outcome | |||
| Wean success / fail n. (%) | 5/4(55.6/44.4) | 2/4(33.3/66.7) | 0.608 |
| Ventilator-free days, median (IQR) | 7(4–9) | 8(4.5–17) | 0.473 |
| Days in ICU, median (IQR) | 15(12.5–16.5) | 13(5.5–21.5) | 0.314 |
| Days of hospitalization, median (IQR) | 29(19–55) | 15(11–43.5) | 0.174 |
| Alive/death n. (%) | 4/5(44.4/55.6) | 2/4(33.3/66.7) | 0.608 |
| Parameter | Group | Baseline | Lavage | Post 1 h | Post 2 h | Post 3 h |
|---|---|---|---|---|---|---|
| VE, L/min | ||||||
| Control (n = 6) | 5.2 ± 0.86 | 5.1 ± 0.86 | 5.1 ± 0.81 | 5.1 ± 0.82 | 4.9 ± 0.69 | |
| VCV (n = 6) | 5.7 ± 0.62 | 5.7 ± 0.57 | 6.0 ± 0.37 | 5.9 ± 0.34 | 5.9 ± 0.33 | |
| ASV (n = 6) | 5.5 ± 1.1 | 5.3 ± 1.0 | 5.5 ± 0.53 | 5.5 ± 0.62 | 5.5 ± 0.62 | |
| VT, mL/kg | ||||||
| Control | 10.0 ± 0.26 | 9.9 ± 0.31 | 10.0 ± 0.31 | 9.9 ± 0.35 | 10.0 ± 0.36 | |
| VCV | 10.1 ± 0.58 | 9.3 ± 0.88 | 8.0 ± 0.21&* | 8.0 ± 0.28&* | 7.9 ± 0.34&* | |
| ASV | 9.9 ± 0.42 | 9.9 ± 0.05 | 6.4 ± 0.93&*§ | 6.6 ± 1.03&*§ | 6.3 ± 1.03&*§ | |
| f, per minute | ||||||
| Control | 20.4 ± 2.8 | 20.5 ± 3.2 | 20.2 ± 3.2 | 20.2 ± 3.1 | 19.7 ± 2.3 | |
| VCV | 23.1 ± 5.6 | 25.5 ± 7.1 | 30.8 ± 6.1&* | 30.0 ± 4.9&* | 30.0 ± 4.8&* | |
| ASV | 23.9 ± 3.9 | 22.8 ± 3. 1 | 35.7 ± 3.9&* | 35.5 ± 4.5&* | 36.1 ± 4.9&* | |
| PPeak, cmH2O | ||||||
| Control | 18.9 ± 3.4 | 18.0 ± 4.5 | 17.6 ± 4.3 | 18.1 ± 4.6 | 18.5 ± 4.7 | |
| VCV | 20.1 ± 2.2 | 28.3 ± 5.2&* | 26.2 ± 3.6&* | 27.0 ± 4.4&* | 28.2 ± 5.1&* | |
| ASV | 18.5 ± 2.8 | 27.2 ± 4.3* | 19.5 ± 1.9§ | 20.0 ± 1.5§ | 21.7 ± 1.0§ | |
| Cst, mL/cmH2O | ||||||
| Control | 23.6 ± 5.3 | 26.1 ± 6.6 | 26.4 ± 6.3 | 25.6 ± 5.8 | 25.1 ± 5.7 | |
| VCV | 21.8 ± 5.4 | 13.9 ± 1.6&* | 12.1 ± 1.5&* | 11.3 ± 1.4&* | 10.8 ± 1.8&* | |
| ASV | 22.5 ± 4.9 | 15.1 ± 4.2&* | 12.7 ± 4.3&* | 12.2 ± 3.7&* | 10.7 ± 2.3&* | |
| Rrs, cmH2O/L/s | ||||||
| Control | 7.2 ± 1.2 | 7.7 ± 1.9 | 7.9 ± 1.9 | 8.1 ± 2.4 | 7.9 ± 1.9 | |
| VCV | 9.6 ± 3.3 | 9.1 ± 2.5 | 6.3 ± 2.2 | 6.7 ± 3.4 | 6.8 ± 4.3 | |
| ASV | 7.4 ± 1.4 | 10.8 ± 2.6 | 9.8 ± 2.1 | 8.9 ± 2.5 | 9.3 ± 2.9 | |
| Parameter | Group | Baseline | Lavage | Post 1 h | Post 2 h | Post 3 h |
|---|---|---|---|---|---|---|
| VE, % | ||||||
| Control (n = 6) | 0.29 ± 0.16 | 0.3 ± 0.21 | 0.5 ± 0.32 | 0.65 ± 0.69 | 0.41 ± 0.26 | |
| VCV (n = 6) | 0.76 ± 0.65 | 1.0 ± 0.41 | 2.5 ± 3.21 | 0.73 ± 0.82 | 0.53 ± 0.28 | |
| ASV (n = 6) | 0.78 ± 0.86 | 1.9 ± 1.9 | 2.6 ± 0.96 | 2.25 ± 1.06 *,§ | 1.6 ± 0.71 *,§ | |
| VT, % | ||||||
| Control | 0.43 ± 0.14 | 0.49 ± 0.21 | 0.59 ± 0.2 | 0.66 ± 0.21 | 0.67 ± 0.24 | |
| VCV | 0.69 ± 0.37 | 0.67 ± 0.31 | 0.76 ± 0.29 | 0.61 ± 0.22 | 0.68 ± 28 | |
| ASV | 0.61 ± 0.32 | 1.49 ± 1.29 | 3.7 ± 3.35 *,§ | 2.8 ± 0.96 *,§ | 1.9 ± 0.22 *,§ | |
| f, % | ||||||
| Control | 0 ± 0 | 0 ± 0 | 0.14 ± 0.22 | 0.26 ± 0.64 | 0.15 ± 0.36 | |
| VCV | 0 ± 0 | 0 ± 0 | 0.29 ± 0.42 | 0.07 ± 0.17 | 0.14 ± 0.18 | |
| ASV | 0 ± 0 | 0 ± 0 | 3.6 ± 2.97 *,§ | 2.23 ± 1.12 *,§ | 1.56 ± 0.8 *,§ | |
| Insp. flow, % | ||||||
| Control | 0 ± 0 | 0 ± 0 | 0 ± 0 | 0 ± 0 | 0 ± 0 | |
| VCV | 0 ± 0 | 0 ± 0 | 0.18 ± 0.44 | 0 ± 0 | 0 ± 0 | |
| ASV | 0 ± 0 | 0 ± 0 | 3.6 ± 0.71 *,§ | 4.98 ± 2.7 *,§ | 3.94 ± 2.2 *,§ |
© 2019 by the authors. Licensee MDPI, Basel, Switzerland. This article is an open access article distributed under the terms and conditions of the Creative Commons Attribution (CC BY) license (http://creativecommons.org/licenses/by/4.0/).
Share and Cite
Dai, Y.-L.; Wu, C.-P.; Yang, G.-G.; Chang, H.; Peng, C.-K.; Huang, K.-L. Adaptive Support Ventilation Attenuates Ventilator Induced Lung Injury: Human and Animal Study. Int. J. Mol. Sci. 2019, 20, 5848. https://doi.org/10.3390/ijms20235848
Dai Y-L, Wu C-P, Yang G-G, Chang H, Peng C-K, Huang K-L. Adaptive Support Ventilation Attenuates Ventilator Induced Lung Injury: Human and Animal Study. International Journal of Molecular Sciences. 2019; 20(23):5848. https://doi.org/10.3390/ijms20235848
Chicago/Turabian StyleDai, Yu-Ling, Chin-Pyng Wu, Gee-Gwo Yang, Hung Chang, Chung-Kan Peng, and Kun-Lun Huang. 2019. "Adaptive Support Ventilation Attenuates Ventilator Induced Lung Injury: Human and Animal Study" International Journal of Molecular Sciences 20, no. 23: 5848. https://doi.org/10.3390/ijms20235848