Article

The Expression Profile and Prognostic Significance of Metallothionein Genes in Colorectal Cancer

1
Division of Gastroenterologic Surgery, Department of Surgery, Yuan’s General Hospital, Kaohsiung 80249, Taiwan
2
Ph.D. Program for Cancer Molecular Biology and Drug Discovery, College of Medical Science and Technology, Taipei Medical University, Taipei 11031, Taiwan
3
Graduate Institute of Cancer Biology and Drug Discovery, College of Medical Science and Technology, Taipei Medical University, Taipei 11031, Taiwan
4
Department of Biochemistry and Molecular Cell Biology, School of Medicine, College of Medicine, Taipei Medical University, Taipei 11031, Taiwan
5
Cancer Center, Taipei Medical University Hospital, Taipei Medical University, Taipei 11031, Taiwan
6
Translational Cancer Research Center, Taipei Medical University, Taipei 11031, Taiwan
7
Department of R&D, Calgent Biotechnology Co., Ltd., Taipei 10675, Taiwan
8
Department of Biotechnology and Bioindustry Sciences, College of Bioscience and Biotechnology, National Cheng Kung University, Tainan 003107, Taiwan
9
Institute of Biochemical Sciences, National Taiwan University, Taipei 10617, Taiwan
10
Food and Drug Administration, Ministry of Health and Welfare, Taipei 11561, Taiwan
11
Cancer Center, Wan Fang Hospital, Taipei Medical University, Taipei 11696, Taiwan
*
Author to whom correspondence should be addressed.
These authors contributed equally to this work.
Int. J. Mol. Sci. 2019, 20(16), 3849; https://doi.org/10.3390/ijms20163849
Submission received: 10 July 2019 / Revised: 3 August 2019 / Accepted: 5 August 2019 / Published: 7 August 2019
(This article belongs to the Special Issue Molecular and Translational Research on Colorectal Cancer)

Abstract

:
Colorectal cancer (CRC) is a heterogeneous disease resulting from the combined influence of many genetic factors. This complexity has caused the molecular characterization of CRC to remain uncharacterized, with a lack of clear gene markers associated with CRC and the prognosis of this disease. Thus, highly sensitive tumor markers for the detection of CRC are the most essential determinants of survival. In this study, we examined the simultaneous downregulation of the mRNA levels of six metallothionein (MT) genes in CRC cell lines and public CRC datasets for the first time. In addition, we detected downregulation of these six MT mRNAs’ levels in 30 pairs of tumor (T) and adjacent non-tumor (N) CRC specimens. In order to understand the potential prognostic relevance of these six MT genes and CRC, we presented a four-gene signature to evaluate the prognosis of CRC patients. Further discovery suggested that the four-gene signature (MT1F, MT1G, MT1L, and MT1X) predicted survival better than any combination of two-, three-, four-, five-, or six-gene models. In conclusion, this study is the first to report that simultaneous downregulation of six MT mRNAs’ levels in CRC patients, and their aberrant expression together, accurately predicted CRC patients’ outcomes.

1. Introduction

Colorectal cancer (CRC) is the third most frequent tumor-related cause of mortality of men and women worldwide [1]. The number of CRC cases is still increasing, and the global burden of CRC is expected to increase by 60% to more than 2.2 million new cases and 1.1 million deaths by 2030 [2]. CRC is a heterogeneous disease; from one patient to another, it differs in clinical presentation, molecular characteristics, and prognosis [3]. Despite comprehensive studies (as reviewed by [4]), the molecular mechanisms of CRC pathogenesis are only partially understood. The formation of CRC involves multiple pathways and stepwise genetic changes; several biomarkers (APC, p53, KRAS, and BRAF) are used to detect CRC, but these biomarkers are not sufficiently sensitive and specific. Thus, there is an urgent need for the identification of efficacious biomarkers, therapeutic targets, and agents for early diagnosis, prevention, and personalized therapy in CRC [5].
With the development of high-throughput technology, gene expression profiles have been broadly used to identify more novel biomarkers [6]. However, cancer is a heterogeneous disease, resulting from the combined influence of many genetic factors [7]. Therefore, multi-gene biomarkers may be better suited to capturing the complex effects of heterogeneous diseases such as cancer on mRNA abundance levels [8]. Our recent study showed that six metallothionein (MT) genes were among the top 20 downregulated genes in CRC clinical tissues compared with normal colorectal tissues by analysis of a Gene Expression Omnibus (GEO) dataset (GSE21815) (our unpublished data from [9]). MTs are metal-binding proteins involved in diverse processes, including metal homeostasis and detoxification, the oxidative stress response, and cell proliferation [10]. In humans, four MT isoforms exist, labeled by numbers (MT1–MT4). MT2, MT3, and MT4 proteins are encoded by a single gene [11]. MT1 comprises many subtypes encoded by a set of 13 MT1 genes. The known active MT1 genes are MT1A, -B, -E, -F, -G, -H, -M, and -X. The rest of the MT1 genes (MT1C, -D, -I, -J, and -L) are pseudogenes whose protein product has not been found in humans [12]. Numerous immunohistochemical and gene expression studies have demonstrated that changes in MT expression are associated with the process of carcinogenesis in various types of human malignancies, including CRC [13,14]. Although downregulation of MT expression has been revealed in association with CRC progression, the prognostic relevance of the expression levels of MTs in CRC is still unclear.
Thus, in the present study, simultaneous downregulation of six MT mRNAs’ levels was examined in CRC cell lines and public CRC datasets. In addition, we also found downregulation of the six MT mRNAs’ levels in 30 pairs of tumor (T) and adjacent non-tumor (N) CRC specimens. Moreover, we further investigated the prognostic significance of these factors for CRC outcomes.

2. Results

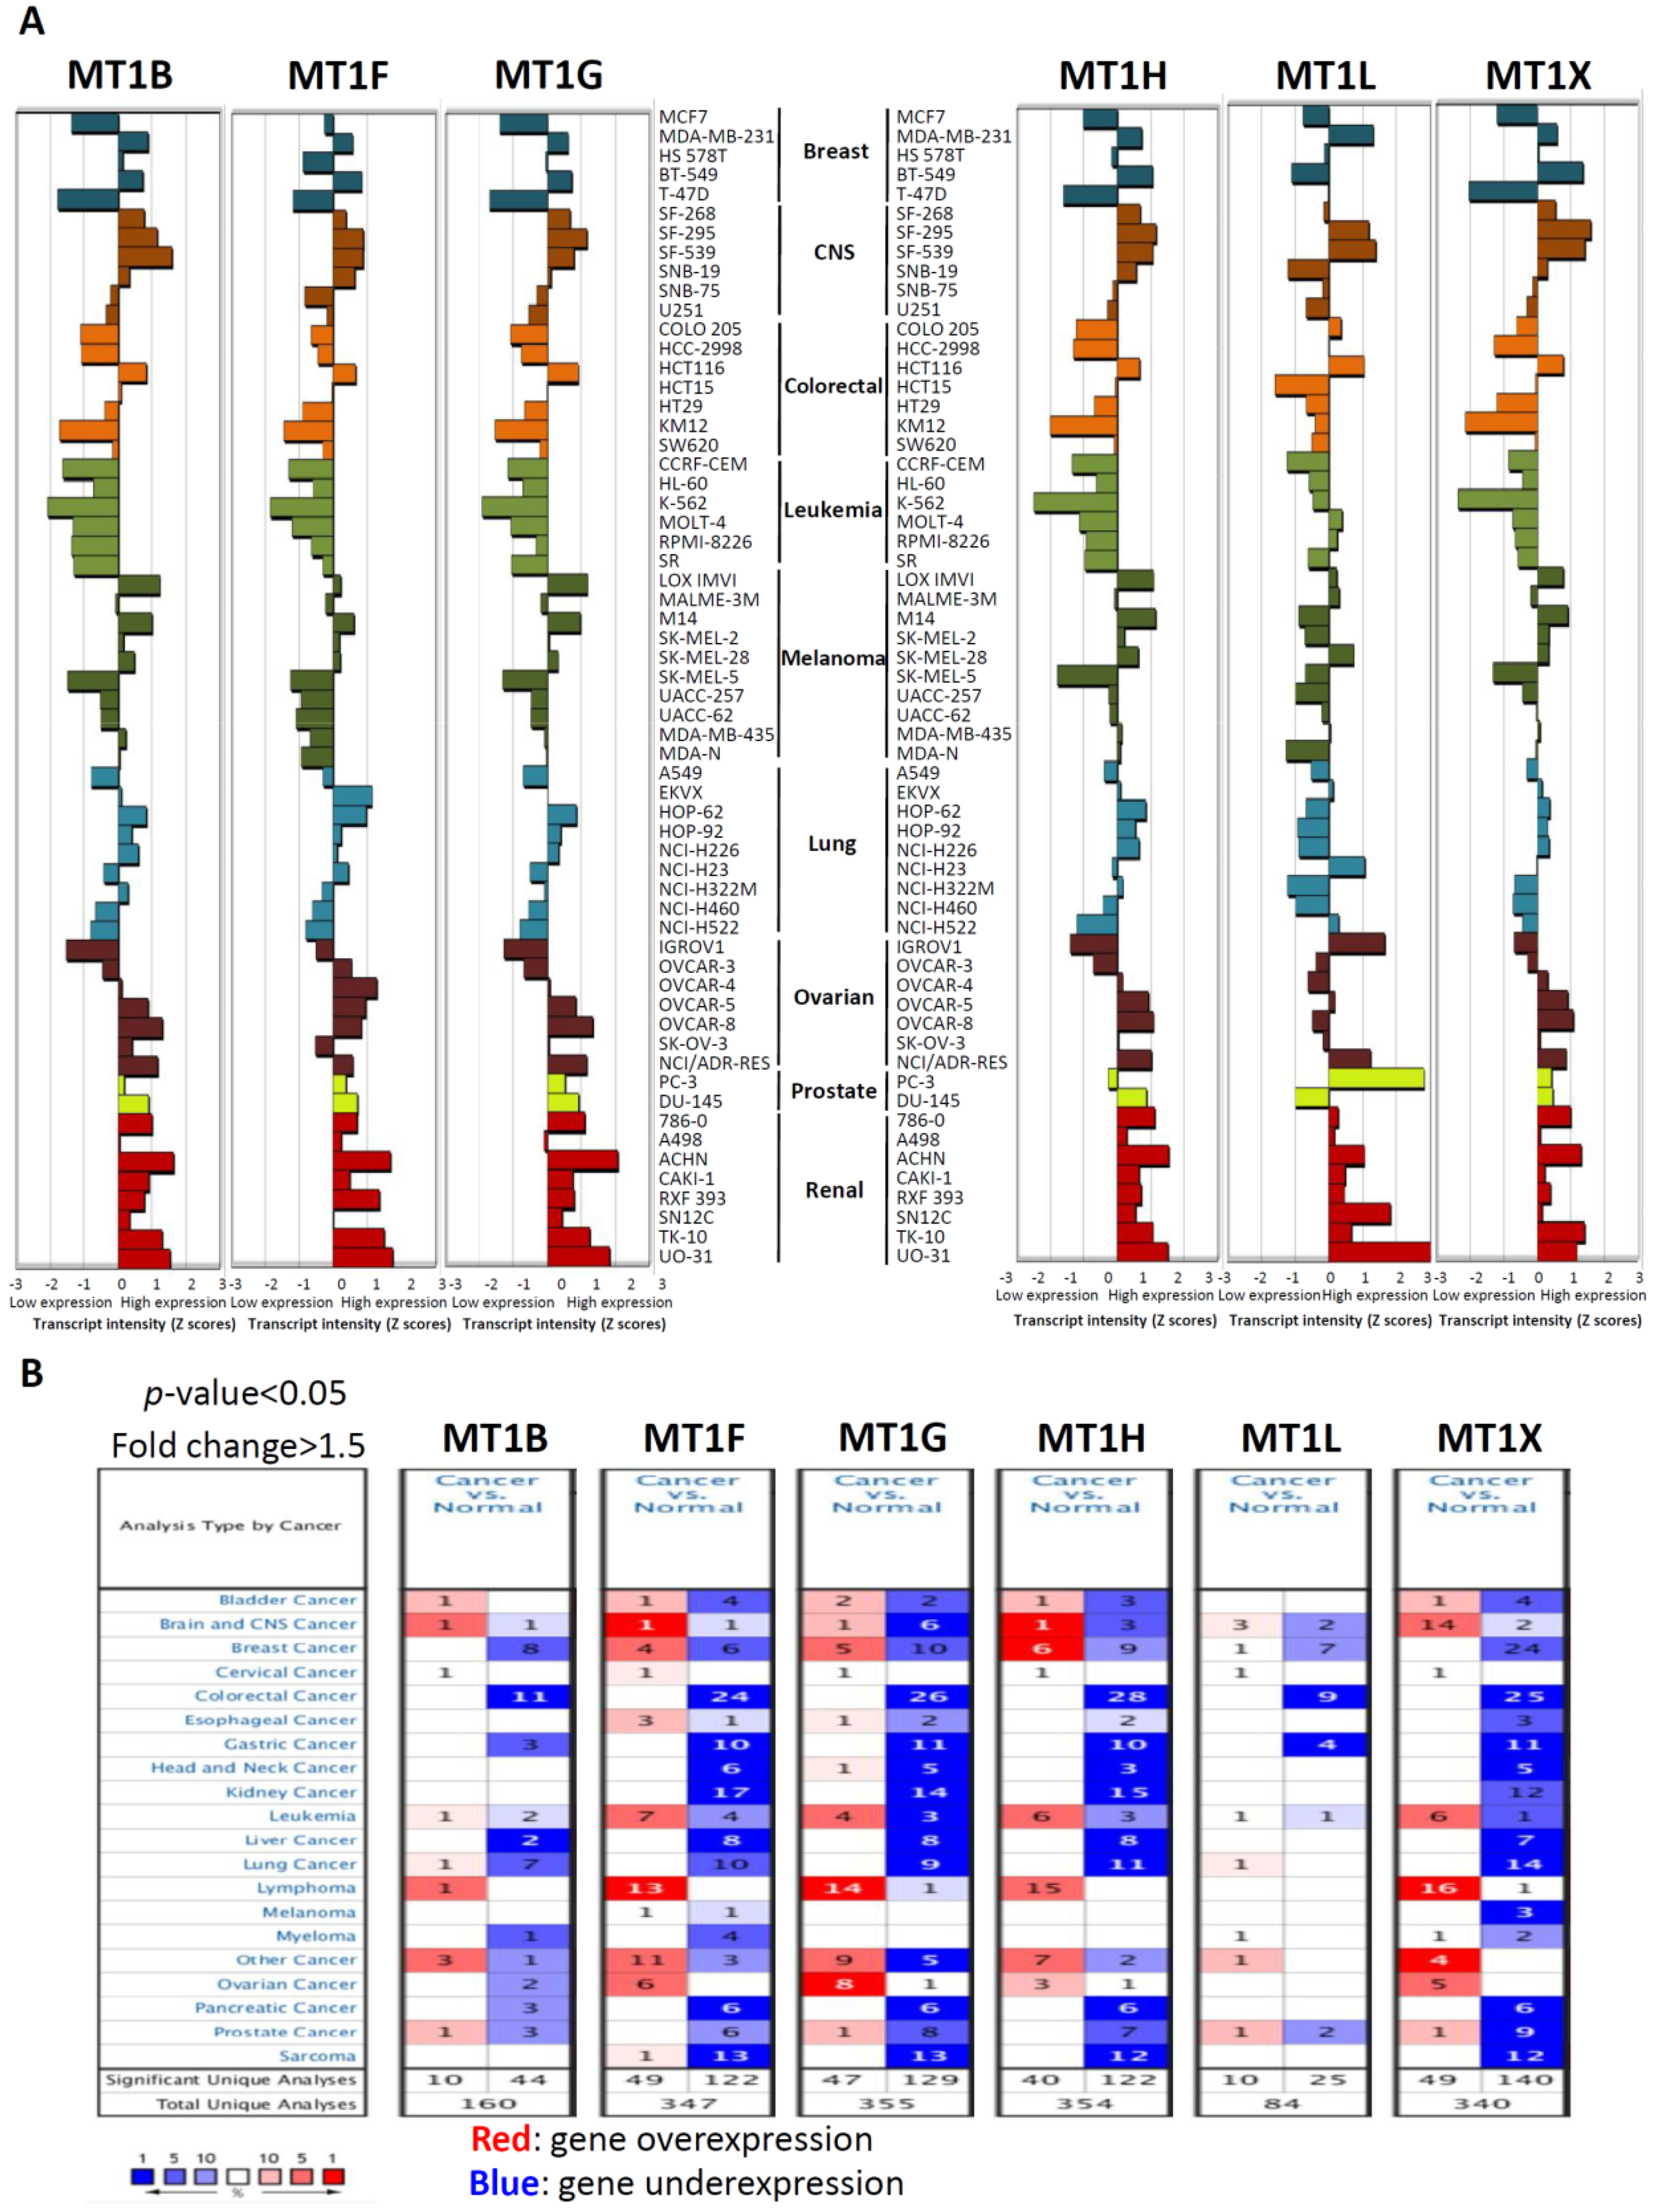
2.1. mRNA Expression of Six Metallothionein (MT) Genes in Various Human Cancers

Our recent study showed that the metallothionein (MT) gene was one of the most significantly downregulated genes in CRC clinical tissues compared with normal colorectal tissues by analysis of a Gene Expression Omnibus (GEO) dataset (GSE21815) (our unpublished data from reference [9]) (Supplementary Table S1). We found that levels of six MT genes were simultaneously decreased from 0.15- to 0.22-fold in CRC tissues compared with in normal colorectal tissues. Next, to further understand the level of MT gene expression in human cancers, we used the National Cancer Institute (NCI)-60 transcriptome database and CellMiner tools [15] (http://discover.nci.nih.gov/cellminer) to determine the mRNA expression of MTs in NCI-60. Figure 1A shows a z-score representation [15] summarizing the various microarray platforms in the NCI database. Among the 60 cell lines, MT transcript levels exhibited low expression in over half of the cell lines. Notably, a single type of cancer cell line, colorectal cancer (CRC), showed markedly low MT transcripts in most CRC cell lines, except for the HCT116 cell line (Figure 1A). Further, to understand the expression levels of MT genes in clinical tissues, we performed Oncomine [16] analysis to investigate differences in the mRNA levels of MTs between tumor and normal tissues in various cancers. As shown in Figure 1B, there were totals of 160, 347, 355, 354, 84, and 340 unique analyses for MT1B, MT1F, MT1G, MT1H, MT1L, and MT1X, respectively. In most of the datasets, mRNA levels of the six MT genes were decreased in most of the tumors, as opposed to in normal tissues. The most notable among these tumors was CRC, which showed the greatest number of cases of decreased expression levels of MT genes. In CRC cases, decreased expression levels of MT genes were observed in a total of 11 datasets for MT1B, 24 datasets for MT1F, 26 datasets for MT1G, 28 datasets for MT1H, 9 datasets for MT1L, and 25 datasets for MT1X. Taken together, these results indicate that mRNA expression levels of MT genes are downregulated in various cancers, especially in CRC.

2.2. mRNA Expression of Six MT Genes in Pairs of Tumor (T) and Adjacent Non-Tumor (N) CRC Tissues

The above results indicated that transcript levels of MT genes were significantly downregulated in CRC. Next, resected tumor and corresponding adjacent non-tumor tissues of 30 patients with colorectal cancer were analyzed for MT-mRNA expression. Quantitative RT-PCR analysis was then performed to quantitatively measure the mRNA amount of MT genes in 30 pairs of tumor (T) and adjacent non-tumor (N) CRC specimens. The results showed that MT1B was downregulated in about 87% (26/30) of CRC tumor tissues (Figure 2A); MT1F was downregulated in about 87% (26/30) of CRC tumor tissues (Figure 2B); MT1G was downregulated in about 70% (21/30) of CRC tumor tissues (Figure 2C); MT1H was downregulated in about 77% (23/30) of CRC tumor tissues (Figure 2D); MT1L was downregulated in about 90% (27/30) of CRC tumor tissues (Figure 2E); and MT1X was downregulated in about 80% (24/30) of CRC tumor tissues (Figure 2F). Taken together, these results from clinical specimens indicate that the expression of MTs is significantly downregulated in CRC tumor tissues.

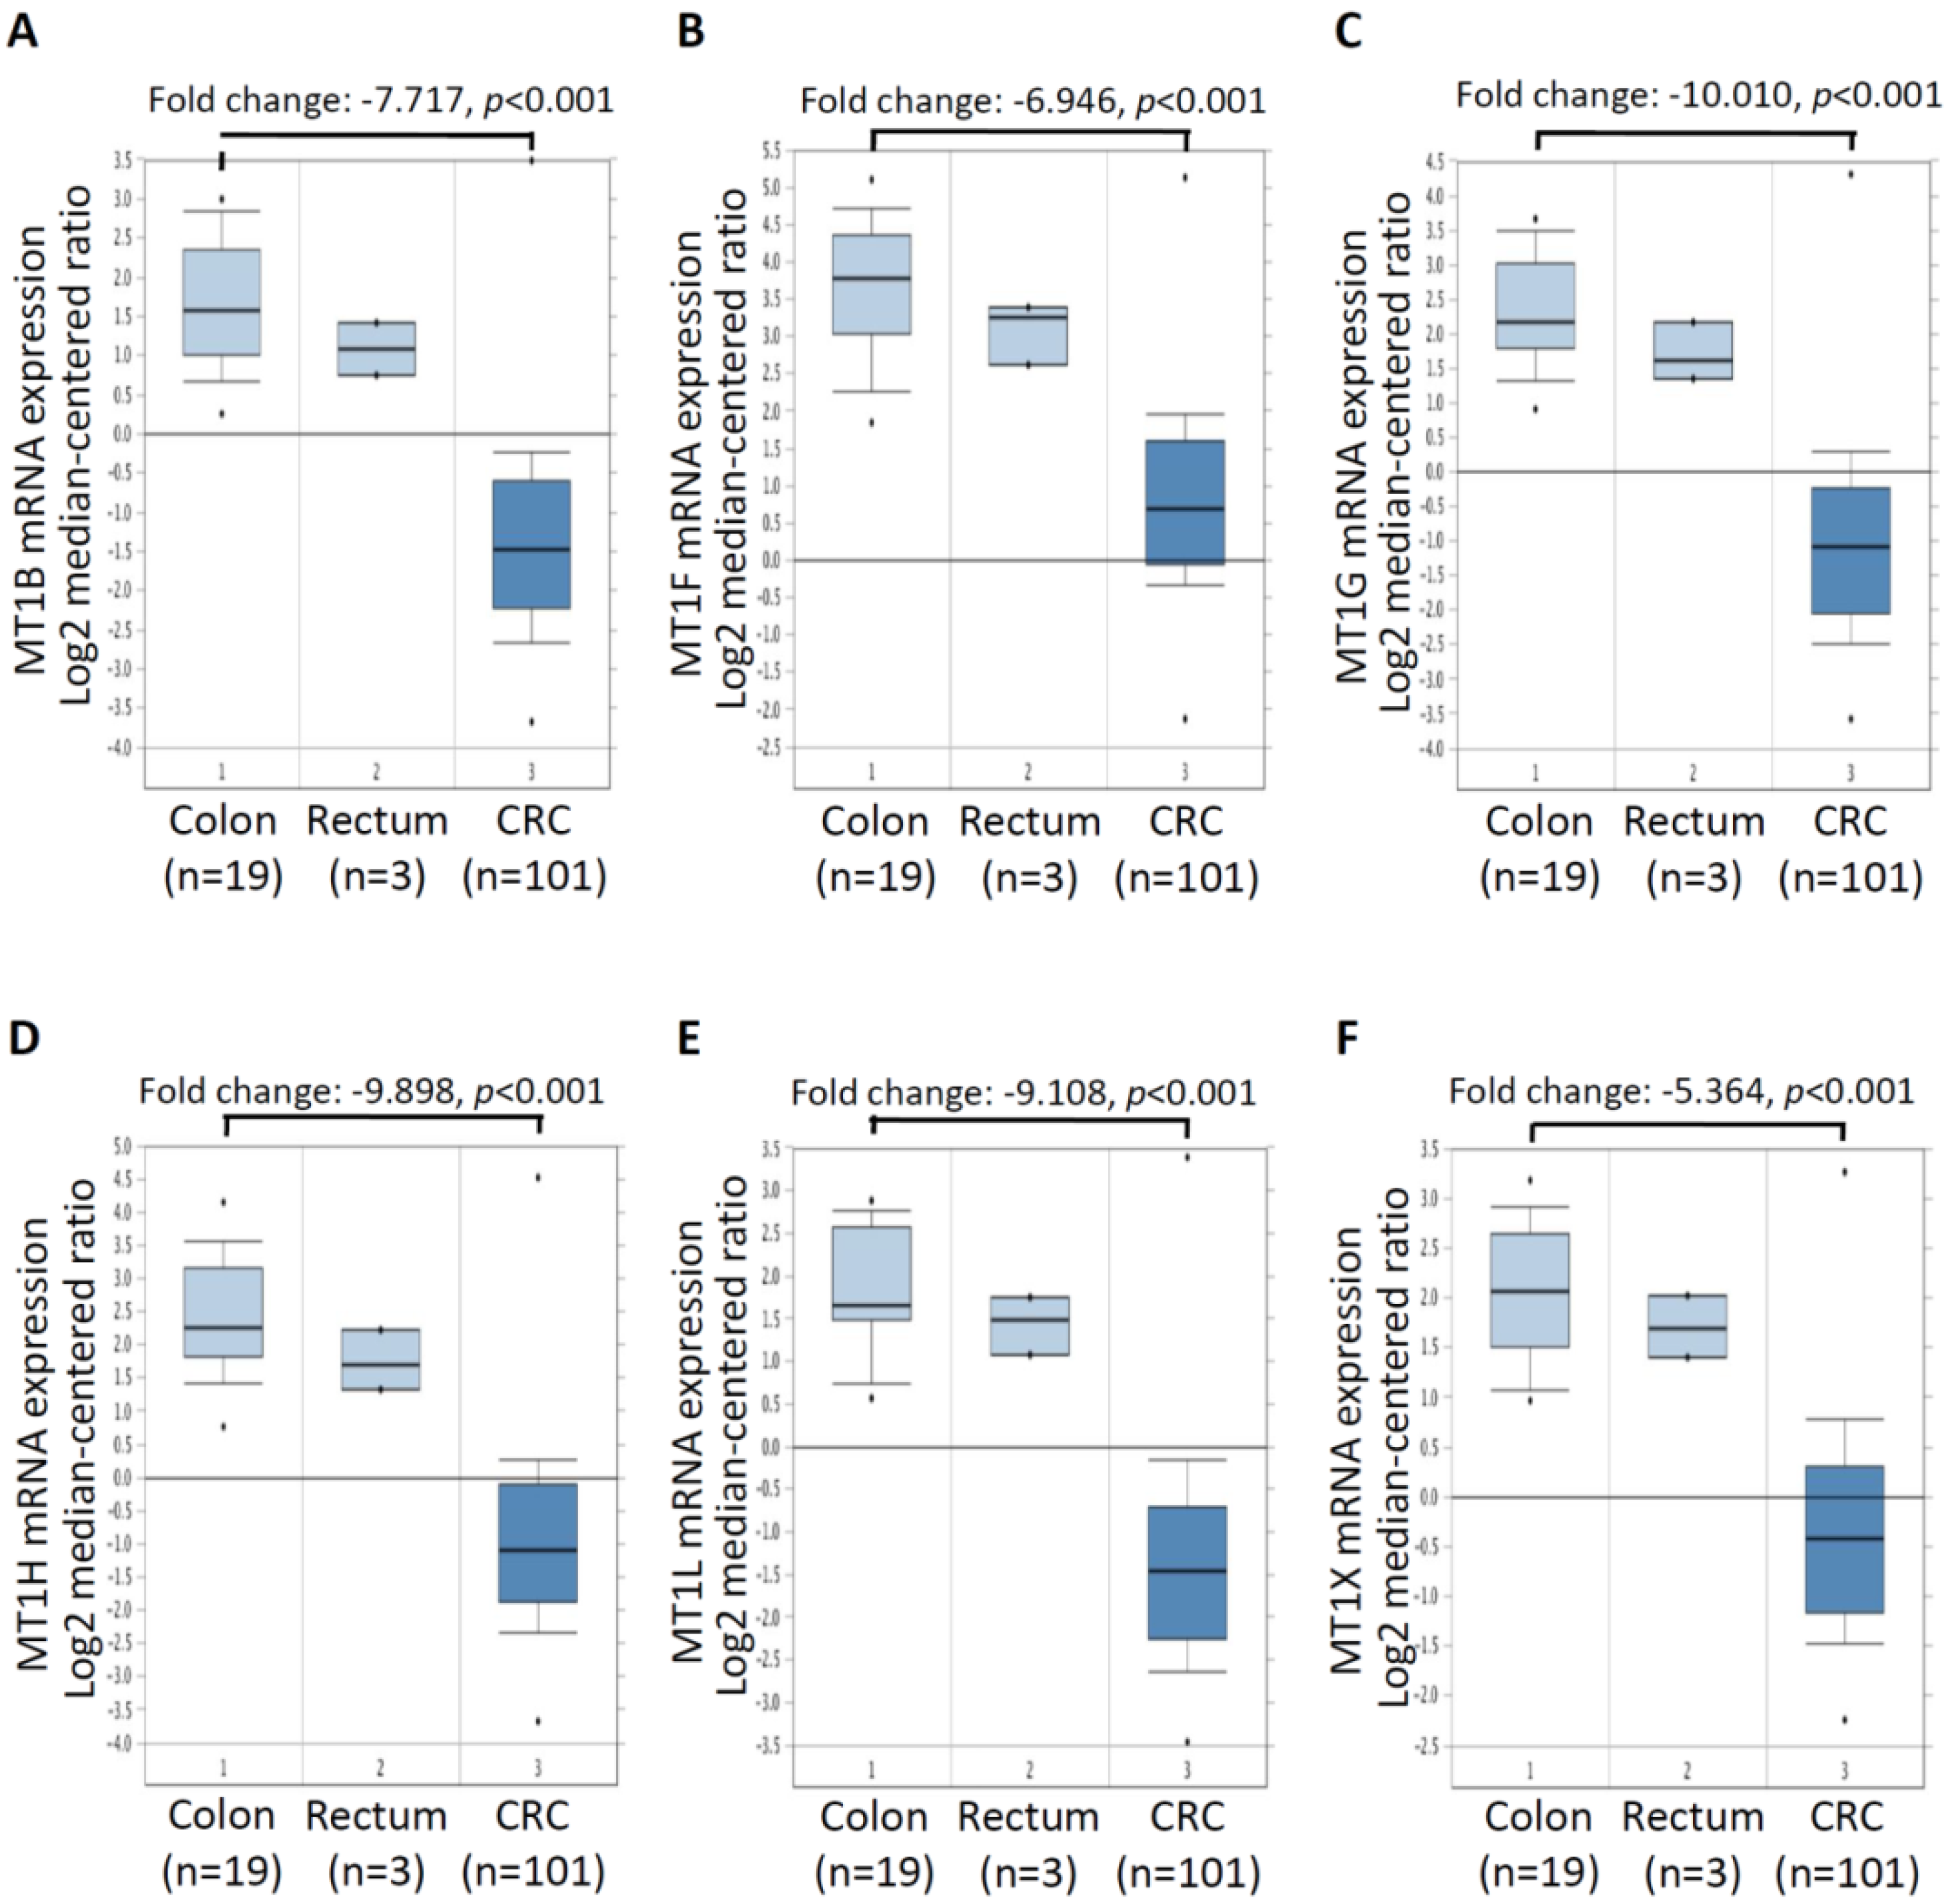
2.3. mRNA Expressionof Six MT Genes in Colorectal Cancer Tissues

Further, to confirm the expression levels of the six MT genes in a large number of CRC tissues, we analyzed mRNA expression profiles of six MT genes using existing complementary DNA (cDNA) microarray datasets deposited in the Oncomine database. In the TCGA microarray dataset of the Oncomine database with colorectal tumor and normal colorectal tissues, significant decreases were found in the mRNA expression of MT1B (a fold change of −7.717) (Figure 3A), MT1F (a fold change of −6.946) (Figure 3B), MT1G (a fold change of −10.010) (Figure 3C), MT1H (a fold change of −9.898) (Figure 3D), MT1L (a fold change of −9.108) (Figure 3E), and MT1X (a fold change of −5.364) (Figure 3F) in CRC tissues (n = 101) compared to normal colon tissues (n = 19). These results suggest that MT genes are downregulated in CRC and may be attractive markers for the diagnosis of CRC.

2.4. Prognostic Relevance of the Six Investigated MT Genes in Colorectal Cancer Tissues

We next explored the prognostic relevance of the six MT genes in CRC using SurvExpress survival analysis [17]. The patients from the TCGA-CRC dataset (n = 350) were classified into predicted low- and high-risk groups according to the prognostic index (PI) (Supplementary Figure S1). The clinicopathological parameters for the 350 patients involved in this study are supplied in the Supplementary Table S2. The results demonstrated that high expression levels of MT1B, MT1F, MT1G, MT1H, MT1L, and MT1X correlated with a low risk (Supplementary Figure S1A–F). Survival differences between the predicted low- and high-risk groups were evaluated with Kaplan–Meier survival curves and p < 0.05 was considered to be statistically significant. There was a significant difference in expression levels of MT1B (Figure 4A), MT1H (Figure 4D), and MT1L (Figure 4E) according to the Kaplan–Meier survival analysis. However, the expression levels of MT1F (Figure 4B), MT1G (Figure 4C), and MT1X (Figure 4F) mRNA were not significantly associated with the clinical outcomes of CRC patients. Collectively, these results indicate that high expression of MT1B, MT1H, or MT1L correlates with good prognosis in colorectal cancer patients.

2.5. A Combination Four-Gene Signature Predicts Survival in Colorectal Cancer Patients

We identified altered expression of the above-mentioned genes to be associated with the prognosis of CRC patients. However, cancer is a heterogeneous disease, and the alternation of a single gene is not sufficient to establish an association between gene and cancer. Thus, multi-gene-combination prediction can improve the sensitivity to the clinical outcomes of cancer patients [18]. Thus, combinations of two-, three-, four-, five-, and six-gene models of CRC patients were analyzed using Kaplan–Meier survival analysis. Specifically, as shown in Supplementary Figures S2–S5, significant differences in genes selected as a combination of any two-, three-, four-, five-, or six-gene models in clinical outcomes were exhibited according to the Kaplan–Meier survival analysis; in particular, the most significant model was the MT1F, MT1G, MT1L, and MT1X-four-gene signature combination. In our four-gene signature, the prognostic index (PI) of the 350 patients was from −9.881 to −7.151, with an optimal cut-off value of −8.134. Those with PI less than −8.134 were placed into the low-risk group (n = 195), while those with PI higher than −8.134 formed the high-risk group (n = 155). The analysis demonstrated that low risk was correlated with high expression of MT1F, MT1G, MT1L, and MT1X, while high risk was correlated with low expression of MT1F, MT1G, MT1L, and MT1X (Figure 5A). In addition, we detected the gene expression levels of MT1F, MT1G, MT1L, and MT1X in the low-risk and high-risk groups. Our results showed that the gene expression levels of MT1F, MT1G, MT1L, and MT1X were higher in the low-risk group than in the high-risk group, and all genes in the four-gene signature showed significant differences (p = 7.30 × 10⁻³ for MT1F, p = 1.20 × 10² for MT1G, p = 1.97 × 10−38 for MT1L, and p = 4.14 × 10⁷ for MT1X) (Figure 5B). Moreover, Kaplan–Meier survival curves showed that patients with a predicted low risk (n = 195) had significantly longer survival times than did those with a predicted high risk (n = 155) (p = 0.00351) (Figure 5C). Taken together, these results suggest that the most significant model of this four-gene signature is related to survival and is a predictor of prognosis in CRC. This may have significant clinical implications for predicting the prognosis of CRC.

3. Discussion

CRC is a heterogeneous disease composed of biologically and clinically diverse diseases. This complexity causes the molecular characterization of CRC to remain deficient, with a lack of clear gene markers associated with CRC and to the prognosis of this disease [19,20]. Thus, highly sensitive tumor markers for the detection of CRC are the most essential determinants of survival. In this study, we identified for the first time that the MT1F, MT1G, MT1L, and MT1X-four-gene signature combination is related to survival and is a predictor of prognosis in CRC patients. There are several lines of evidence that support this conclusion. First, we demonstrated simultaneous downregulation of the mRNA levels of six MT genes in CRC cell lines and public CRC datasets. Second, downregulation of the six MT mRNAs’ levels was detected in clinical NT pairs of CRC specimens. Third, we found that high expression of MT1B, MT1H, or MT1L was significantly correlated with good prognosis in CRC patients. Fourth, the most significant four-gene signature model was shown to be related to survival and a predictor of prognosis in CRC. Collectively, this study is the first to report simultaneous downregulation of six MT mRNAs’ levels in CRC patients and their aberrant expression together, accurately predicting CRC patients’ outcomes.
Current molecular changes in colorectal tumors are usually linked to the traditional determination of somatic mutations in well-known tumor-suppressor genes or oncogenes, such as p53, KRAS, and BRAF [21]. Molecular prognosis of CRC tumor samples by transcriptional profiling started about 10 years ago (review in [22]). Despite these efforts, at present, there is not a clear compendium of gene markers for CRC survival, and it is quite difficult to find consistency in the literature [23]. In this study, we identified a group of MT genes as biomarkers, which were downregulated in CRC tumor samples in different public datasets and CRC clinical tissues. In the beginning, six MT genes—MT1B, MT1F, MT1G, MT1H, MT1L, and MT1X—were analyzed among the top 20 downregulated genes in CRC clinical tissues when compared with normal colorectal tissues by analysis GEO dataset (GSE21815) [24]. Further, we found simultaneous downregulation of the six MT mRNAs’ levels in NT pairs of CRC clinical tissues. Moreover, downregulation of the six MT mRNAs’ levels was detected in the TCGA-CRC dataset. We combined different public datasets and CRC clinical tissues to identify six MT genes that had a clear change in expression in CRC tissues and were consistent markers of patient-risk and disease-outcome.
The recent advances in genomic and transcriptomic technologies applied to the study of clinical samples have opened the way to obtaining genome-wide expression profiles of multiple patient cohorts and correlating the expression of certain genes with disease outcome [25,26]. Importantly, some prognostic models based on gene expression levels are an excellent tool to investigate the prognosis of disease and to build risk predictors that will be applicable to individual patients. In our study, we analyzed the association of MT1B, MT1F, MT1G, MT1H, MT1L, and MT1X single gene expression with the prognosis of CRC patients in the TCGA-CRC dataset from the SurvExpress database. The data demonstrated that low expression of MT1B, MT1H, or MT1L was significantly correlated with a high risk of poor prognosis (p < 0.05). However, the efficacy of a single index was limited. Therefore, multi-gene-combination prediction can improve the sensitivity to clinical outcomes of heterogeneous diseases such as cancer to mRNA abundance levels. Thus, we identified for the first time, the most significant four-gene signature model (MT1F, MT1G, MT1L, and MT1X) that was able to predict survival and CRC prognosis. Overall, this multi-gene panel may serve as a promising outcome predictor and as potential therapeutic targets in CRC patients.
In conclusion, we consider that the results presented in this work provide strong support and a solid rationale for the exploration of changes in expression of MTs in CRC to assist in the development of clinically useful outcome prediction of CRC.

4. Materials and Methods

4.1. Tissue Samples and Ethics Statement

Human 30 pairs of tumor (T) and adjacent non-tumor (N) CRC specimens were obtained from the Department of Surgery, Taipei Medical University Hospital (Taipei, Taiwan). Informed written consent was obtained from all patients and/or guardians for the use of their resected specimens. Acquisition of samples and their subsequent examination were approved by the Institutional Review Board (IRB) of Taipei Medical University (TMU-JIRB No.: 201312039). None of the participants had a previous history of cancer.

4.2. Quantitative Reverse-Transcription (RT)-(q)PCR

Total RNA was extracted from NT pairs of CRC tissues using a Qiagen RNeasy kit (Qiagen, Valencia, CA, USA) and Qiashredder columns according to the manufacturer’s instructions (Qiagen). One microgram of total RNA was reverse-transcribed to complementary (c)DNA using a Reaction Ready™ First Strand cDNA Synthesis Kit (SABiosciences, Frederick, MD, USA). To detect mRNA expression levels of MT genes and GAPDH, specific products were amplified and detected using the cycle profile of the Qiagen SYBR green reagent (Qiagen). The sequences of primers used in this study are listed as follows: MT1B: forward 5′-GCACCACAGGTGGCTCCTG-3′ and reverse 5′-TGGGCACACTTGGCACAGC-3′; MT1F: forward 5′-CAACTGCTCCTGCGCCGCT-3′ and reverse 5′-CCAGACCATGGAGATGGCC-3′; MT1G: forward 5′-CGCTGCAGGTGTCTCCTGC-3′ and reverse 5′-CAGCCCTGGGCACACTTG-3′; MT1H: forward 5′-CCTGCGAGGCTGGTGGCTC-3′ and reverse 5′-CTGGGCACACTTGGCACAG-3′; MT1L forward 5′-GCTCCTGCTCCTGTGCCAG-3′ and reverse 5′-TCTGGGAGCAGGGCTGTCC-3′; MT1X: forward 5′-GCTCGCCTGTTGGCTCCTG-3′ and reverse 5′-TGCAGATGCAGCCCTGGGC-3′; and GAPDH: forward 5′-AATCCCATCACCATCTTCCA-3′ and reverse 5′-TGAGTACGTCGTGGAGTCCA-3′.

4.3. CellMiner Data Mining and Analysis

The CellMiner tool (http://discover.nci.nih.gov/cellminer; version 1.5) was used to compare and plot the relative baseline expression of MT mRNA in the NCI-60 cell line panel. The tool enables retrieval and integrated analysis of baseline and experimental data compiled from the 60 cell lines included in the panel. CellMiner gene transcript data were generated from microarray platforms. We selected gene transcript level z-scores for analysis of the six MT genes as gene identifier inputs.

4.4. Oncomine Database Analysis

Gene expression changes were analyzed in the TCGA microarray dataset of the Oncomine website with colorectal tumor and normal colorectal tissues (www.oncomine.org, Compendia biosciences, Ann Arbor, MI, USA). The threshold search criteria used in the study were a p-value of <0.001, a fold change of >2, and a gene rank in the top 5%.

4.5. SurvExpress Database Analysis

In our analysis, SurvExpress was used to provide survival analysis and risk assessment. SurvExpress (http://bioinformatica.mty.itesm.mx/SurvExpress), which is a comprehensive gene expression database, can provide risk assessment and survival analysis in cancer datasets using a biomarker gene list as an input. The samples of each dataset were split into two risk groups with the same size; each group was determined according to the ordered prognostic index (PI) with the dataset split by the ordered PI (higher values for lower risk) so as to have an equal number of samples in each group. The PI was computed using the expression levels and values obtained from the Cox fitting algorithm [27].

4.6. Statistical Analysis

p-Values and fold-changes for differential expression analysis of genes generated from NT pairs of CRC tissues and the Oncomine database were calculated using a one-sided Student’s t-test. p values of <0.05 were considered significant.

Supplementary Materials

The following are available online at https://www.mdpi.com/1422-0067/20/16/3849/s1.

Author Contributions

Conceptualization, K.-C.H., T.-C.H., C.-H.C., Y.-W.C., and K.-H.L.; methodology, K.-C.H., T.-C.H., C.-H.C., and D.-Y.L.; validation, K.-C.H., T.-C.H., and C.-H.C.; formal analysis, Y.-W.C., D.-Y.L., and J.-J.F.; investigation, K.-H.L.; resources, K.-H.L.; writing—original draft preparation, K.-C.H.; writing—review and editing, K.-H.L.; visualization, Y.-W.C., D.-Y.L., and J.-J.F.; supervision, K.-H.L.; project administration, K.-H.L.; funding acquisition, K.-H.L.

Funding

This work was supported by the Ministry of Education of Taiwan (grant number: DP2-107-21121-02-C-03); Health and welfare surcharge of tobacco products of Taiwan (Wan-Fang Hospital, Chi-Mei Medical Center, and Hua-lien Tzu-Chi Hospital Joint Cancer Center Grant—Focus on Colon Cancer Research, grant number: MOHW108-TDU-B-212-124020) awarded to K.-H.L.; Taipei Medical University—Yuan’s General Hospital (grant number: 107YGH-TMU-06 to K.-H.L.), and Ministry of Science and Technology of Taiwan (MOST 108-2320-B-038-019 to K.-H.L.).

Conflicts of Interest

The authors declare no conflict of interest.

References

  1. Siegel, R.L.; Miller, K.D.; Jemal, A. Cancer statistics, 2019. CA Cancer J. Clin. 2019, 69, 7–34. [Google Scholar] [CrossRef] [PubMed]
  2. Arnold, M.; Sierra, M.S.; Laversanne, M.; Soerjomataram, I.; Jemal, A.; Bray, F. Global patterns and trends in colorectal cancer incidence and mortality. Gut 2017, 66, 683–691. [Google Scholar] [CrossRef] [PubMed]
  3. Linnekamp, J.F.; Wang, X.; Medema, J.P.; Vermeulen, L. Colorectal cancer heterogeneity and targeted therapy: A case for molecular disease subtypes. Cancer Res. 2015, 75, 245–249. [Google Scholar] [CrossRef] [PubMed]
  4. Grady, W.M.; Markowitz, S.D. The molecular pathogenesis of colorectal cancer and its potential application to colorectal cancer screening. Dig. Dis. Sci. 2015, 60, 762–772. [Google Scholar] [CrossRef] [PubMed]
  5. Zarkavelis, G.; Boussios, S.; Papadaki, A.; Katsanos, K.H.; Christodoulou, D.K.; Pentheroudakis, G. Current and future biomarkers in colorectal cancer. Ann. Gastroenterol. 2017, 30, 613–621. [Google Scholar] [CrossRef] [PubMed]
  6. Li, S.; Xuan, Y.; Gao, B.; Sun, X.; Miao, S.; Lu, T.; Wang, Y.; Jiao, W. Identification of an eight-gene prognostic signature for lung adenocarcinoma. Cancer Manag. Res. 2018, 10, 3383–3392. [Google Scholar] [CrossRef] [PubMed]
  7. Aran, V.; Victorino, A.P.; Thuler, L.C.; Ferreira, C.G. Colorectal Cancer: Epidemiology, Disease Mechanisms and Interventions to Reduce Onset and Mortality. Clin. Colorectal Cancer 2016, 15, 195–203. [Google Scholar] [CrossRef] [PubMed]
  8. Grzadkowski, M.R.; Sendorek, D.H.; P’ng, C.; Huang, V.; Boutros, P.C. A comparative study of survival models for breast cancer prognostication revisited: The benefits of multi-gene models. BMC Bioinform. 2018, 19, 400. [Google Scholar] [CrossRef]
  9. Su, Y.H.; Tang, W.C.; Cheng, Y.W.; Sia, P.; Huang, C.C.; Lee, Y.C.; Jiang, H.Y.; Wu, M.H.; Lai, I.L.; Lee, J.W.; et al. Targeting of multiple oncogenic signaling pathways by Hsp90 inhibitor alone or in combination with berberine for treatment of colorectal cancer. Biochim. Biophys. Acta 2015, 1853 Pt A, 2261–2272. [Google Scholar] [CrossRef] [Green Version]
  10. Takahashi, S. Positive and negative regulators of the metallothionein gene (review). Mol. Med. Rep. 2015, 12, 795–799. [Google Scholar] [CrossRef]
  11. Vasak, M. Advances in metallothionein structure and functions. J. Trace Elem. Med. Biol. 2005, 19, 13–17. [Google Scholar] [CrossRef] [PubMed]
  12. Krizkova, S.; Kepinska, M.; Emri, G.; Eckschlager, T.; Stiborova, M.; Pokorna, P.; Heger, Z.; Adam, V. An insight into the complex roles of metallothioneins in malignant diseases with emphasis on (sub)isoforms/isoforms and epigenetics phenomena. Pharmacol. Ther. 2018, 183, 90–117. [Google Scholar] [CrossRef] [PubMed] [Green Version]
  13. Gumulec, J.; Raudenska, M.; Adam, V.; Kizek, R.; Masarik, M. Metallothionein—Immunohistochemical cancer biomarker: A meta-analysis. PLoS ONE 2014, 9, e85346. [Google Scholar] [CrossRef] [PubMed]
  14. Thirumoorthy, N.; Shyam Sunder, A.; Manisenthil Kumar, K.; Senthil Kumar, M.; Ganesh, G.; Chatterjee, M. A review of metallothionein isoforms and their role in pathophysiology. World J. Surg. Oncol. 2011, 9, 54. [Google Scholar] [CrossRef] [PubMed]
  15. Reinhold, W.C.; Sunshine, M.; Liu, H.; Varma, S.; Kohn, K.W.; Morris, J.; Doroshow, J.; Pommier, Y. CellMiner: A web-based suite of genomic and pharmacologic tools to explore transcript and drug patterns in the NCI-60 cell line set. Cancer Res. 2012, 72, 3499–3511. [Google Scholar] [CrossRef] [PubMed]
  16. Rhodes, D.R.; Yu, J.; Shanker, K.; Deshpande, N.; Varambally, R.; Ghosh, D.; Barrette, T.; Pandey, A.; Chinnaiyan, A.M. ONCOMINE: A cancer microarray database and integrated data-mining platform. Neoplasia 2004, 6, 1–6. [Google Scholar] [CrossRef]
  17. Aguirre-Gamboa, R.; Gomez-Rueda, H.; Martinez-Ledesma, E.; Martinez-Torteya, A.; Chacolla-Huaringa, R.; Rodriguez-Barrientos, A.; Tamez-Pena, J.G.; Trevino, V. SurvExpress: An online biomarker validation tool and database for cancer gene expression data using survival analysis. PLoS ONE 2013, 8, e74250. [Google Scholar] [CrossRef]
  18. Zhao, K.; Li, Z.; Tian, H. Twenty-gene-based prognostic model predicts lung adenocarcinoma survival. Onco Targets Ther. 2018, 11, 3415–3424. [Google Scholar] [CrossRef]
  19. Bogaert, J.; Prenen, H. Molecular genetics of colorectal cancer. Ann. Gastroenterol. 2014, 27, 9–14. [Google Scholar]
  20. Sepulveda, A.R.; Hamilton, S.R.; Allegra, C.J.; Grody, W.; Cushman-Vokoun, A.M.; Funkhouser, W.K.; Kopetz, S.E.; Lieu, C.; Lindor, N.M.; Minsky, B.D.; et al. Molecular Biomarkers for the Evaluation of Colorectal Cancer: Guideline from the American Society for Clinical Pathology, College of American Pathologists, Association for Molecular Pathology, and American Society of Clinical Oncology. Arch. Pathol. Lab. Med. 2017, 141, 625–657. [Google Scholar] [CrossRef]
  21. Kocarnik, J.M.; Shiovitz, S.; Phipps, A.I. Molecular phenotypes of colorectal cancer and potential clinical applications. Gastroenterol. Rep. (Oxf.) 2015, 3, 269–276. [Google Scholar] [CrossRef] [Green Version]
  22. Sanz-Pamplona, R.; Berenguer, A.; Cordero, D.; Riccadonna, S.; Sole, X.; Crous-Bou, M.; Guino, E.; Sanjuan, X.; Biondo, S.; Soriano, A.; et al. Clinical value of prognosis gene expression signatures in colorectal cancer: A systematic review. PLoS ONE 2012, 7, e48877. [Google Scholar] [CrossRef]
  23. Hong, S.N. Genetic and epigenetic alterations of colorectal cancer. Intest. Res. 2018, 16, 327–337. [Google Scholar] [CrossRef] [Green Version]
  24. Iwaya, T.; Yokobori, T.; Nishida, N.; Kogo, R.; Sudo, T.; Tanaka, F.; Shibata, K.; Sawada, G.; Takahashi, Y.; Ishibashi, M.; et al. Downregulation of miR-144 is associated with colorectal cancer progression via activation of mTOR signaling pathway. Carcinogenesis 2012, 33, 2391–2397. [Google Scholar] [CrossRef] [Green Version]
  25. Aibar, S.; Fontanillo, C.; Droste, C.; Roson-Burgo, B.; Campos-Laborie, F.J.; Hernandez-Rivas, J.M.; De Las Rivas, J. Analyse multiple disease subtypes and build associated gene networks using genome-wide expression profiles. BMC Genom. 2015, 16 (Suppl. 5), S3. [Google Scholar] [CrossRef]
  26. Aibar, S.; Abaigar, M.; Campos-Laborie, F.J.; Sanchez-Santos, J.M.; Hernandez-Rivas, J.M.; De Las Rivas, J. Identification of expression patterns in the progression of disease stages by integration of transcriptomic data. BMC Bioinform. 2016, 17 (Suppl. 15), 432. [Google Scholar] [CrossRef]
  27. Ambler, G.; Seaman, S.; Omar, R.Z. An evaluation of penalised survival methods for developing prognostic models with rare events. Stat. Med. 2012, 31, 1150–1161. [Google Scholar] [CrossRef]
Figure 1. Metallothionein (MT) mRNA expression in the National Cancer Institute (NCI)-60 human tumor cell lines and various cancer tissues. (A) Relative MT gene expression profile. Bars to the right show high expression, while bars to the left show low expression relative to the expression mean. Expression values are normalized as z-scores. Data are accessible at http://discover.nci.nih.gov/cellminer. (B) Expressions of MT mRNA in 20 common cancers were compared with those in corresponding normal tissues (Oncomine Database). The search criteria thresholds for datasets of cancer versus normal analysis were a p-value of <0.05, a fold change of >1.5, and a gene rank in the top 10%. Red signifies gene overexpression in the analyses; blue represents gene underexpression.
Ijms 20 03849 g001
Figure 2. The mRNA expression of six MT genes in 30 pairs of tumor (T) and adjacent non-tumor (N) CRC specimens. The 30 NT paired tissues were used for examination of the expression of the six MT genes. Lower expression of MT1B (A), MT1F (B), MT1G (C), MT1H (D), MT1L (E), and MT1X (F) was found in tumor part specimens than in non-tumor part tissues. * p < 0.05, ** p < 0.01.
Ijms 20 03849 g002
Figure 3. MT genes were downregulated in CRC tissues. Relative expression levels of MT1B (A), MT1F (B), MT1G (C), MT1H (D), MT1L (E), and MT1X (F) in colon/rectum normal tissue and CRC tissues by using the Oncomine database (http://www.oncomine.org/).
Ijms 20 03849 g003
Figure 4. Expression levels of MT genes were associated with prognosis in patients with CRC. Low expression levels of MT1B (A), MT1F (B), MT1G (C), MT1H (D), MT1L (E), and MT1X (F) were correlated with shorter survival time of CRC patients. Green and red lines indicate high- and low-risk groups, respectively. p < 0.05 was considered to be statistically significant.
Ijms 20 03849 g004
Figure 5. Clinical outcomes for the four-gene combination predicted survival better than the individual genes did alone in CRC patients. (A) The SurvExpress database was used to analyze the association of the four-gene signature with the predicted risk. (B) The gene expression levels of MT1F, MT1G, MT1L, and MT1X were detected in high-risk and low-risk groups. (C) Kaplan–Meier survival curves showed that patients with high levels of MT1F, MT1G, MT1L, and MT1X (n = 195) had significantly longer survival times than did those with low levels of MT1F, MT1G, MT1L, and MT1X (n = 155). p < 0.05 was considered to be statistically significant.
Ijms 20 03849 g005

