Article

Effects of Different Pollens on Primary Metabolism and Lignin Biosynthesis in Pear

School of Life Science, Anhui Agricultural University, Hefei 230036, China
*
Authors to whom correspondence should be addressed.
These authors contributed equally to this work.
Int. J. Mol. Sci. 2018, 19(8), 2273; https://doi.org/10.3390/ijms19082273
Submission received: 28 May 2018 / Revised: 28 July 2018 / Accepted: 29 July 2018 / Published: 2 August 2018
(This article belongs to the Section Molecular Plant Sciences)

Abstract

:
To investigate the effect of pollination on the fruit quality of ‘Dangshan Su’ pear, ‘Dangshan Su’ was fertilized by the pollen of ‘Wonhwang’ (Pyrus pyrifolia Nakai.) (DW) and ‘Jingbaili’ (Pyrus ussuriensis Maxim.) (DJ). The analysis of primary metabolites was achieved through untargeted metabolomics, and the quantitative analysis of intermediate metabolites of lignin synthesis was undertaken using targeted metabolomics. The untargeted metabolomics analysis was performed via gas chromatography-mass spectrometry (GC-MS). The targeted metabolomics analysis was performed using ultra-high-performance liquid chromatography-tandem mass spectrometry (UPLC-MS/MS) under the multiple reaction monitoring (MRM) mode. The results showed that the metabolite content was significantly different between DW and DJ. Compared with that in DJ, the sugar and amino acid content in DW was higher and the fatty acid content was lower at 47 days after pollination (DAPs), and the sugar, amino acid, and fatty acid content in DW was lower at 63 DAPs. The intermediate metabolites of lignin synthesis were analyzed using the orthogonal partial least squares discriminant analysis (OPLS-DA) model, and the differential metabolites at 47 DAPs were p-coumaric acid, ferulic acid, sinapaldehyde, coniferyl alcohol, and sinapyl alcohol. The differential significant metabolite at 63 DAPs was p-coumaric acid. At 47 DAPs and 63 DAPs, the p-coumaric acid level was significantly different, and the p-coumaric acid content was positively correlated with lignin synthesis. The pollination pollen affects the quality of ‘Dangshan Su’ pear fruit through regulation of the sugar, amino acid, and fatty acid content; at the same time, regulating the levels of intermediate metabolites of lignin synthesis, especially the p-coumaric acid content, to affect lignin synthesis ultimately affects the stone cell content and improves the quality of the pears.

Graphical Abstract

1. Introduction

Pyrus bretschneideri cv. ‘Dangshan Su’ is a cultivar of Pyrus bretschneideri Rehd. Pollination can affect pear fruit quality, such as its true hardness and sugar, amino acid, and stone cell content [1,2,3,4]. During the ripening of pear fruit, a large number of substances are synthesized. Previous studies have focused on the metabolites related to taste, color, aroma, and nutrition in mature fruits. A qualitative and quantitative analysis of sugar, organic acids, amino acids, and fatty acids in different varieties of pear fruits showed that the composition of different pear fruit varieties varied greatly [5]. The phenylpropanoid pathway is the junction between secondary metabolism and primary metabolism, such as lignin synthesis. The phenylpropanoid pathway is derived from the shikimic acid pathway, and the shikimic acid pathway can be formed via phosphoenolpyruvate in the primary metabolic glycolytic pathway. In addition, the phenylpropanoid pathway is not only related to the biosynthesis of lignin and flavonoids but also related to other aromatic metabolites, such as coumarin, phenolic volatiles, and hydrolysable tannins [6,7]. Oikawa analyzed the metabolic profiles of pear fruits and determined the physiological effects of the metabolites in pear fruits [8]. However, there has been no report on the effects of pollination on the primary metabolites in ‘Dangshan Su’ pear fruit.
The lignin synthesis process has been basically elucidated [9], and the types of lignin contained in the pear fruit are guaiacyl lignin (G-lignin) and syringyl lignin (S-lignin) [10]. Lignin synthesis, translocation, and deposition are closely related to the development of stone cells. Pearlite cells are thick-walled tissue cells formed by the deposition of lignin on the parenchyma of parenchyma cells and secondary thickening of the primary wall. The pear fruit quality is related to the content of stone cells [11,12]. The effect of pollination on lignin synthesis in pear fruit can theoretically be a basis for improving pear fruit quality.
Previous studies have reported that pollination affects the expression of laccase gene microRNA in pear fruit [4], and the expression of peroxidase 47 (PER47), β-glucosidase (BGLU15), and laccase-4 (LAC4) [13], thus affecting lignin synthesis. This finding demonstrates that pollination with different pollens affects the synthesis of lignin in pear fruit on the levels of gene and protein expression. However, there has been no report regarding the effect of pollination on metabolites in ‘Dangshan Su’ pear fruit. In this study, the primary metabolites in ‘Dangshan Su’ fruit pollinated by ‘Wonhwang’ (DW) and ‘Jingbaili’ (DJ) at 47 and 64 days after pollination (DAPs) were detected, combined with quantitative detection of the lignin synthesis intermediate metabolites cinnamic acid, p-coumaric acid, caffeic acid, ferulic acid, sinapic acid, coniferaldehyde, sinapaldehyde, coniferyl alcohol, and sinapyl alcohol to investigate the effects of pollination on primary metabolism and lignin synthesis in ‘Dangshan Su’ pear fruit and to improve the pear fruit quality.
According to the previous experimental results of this research group, lignin mainly forms between 15 days and 63 days after flowering [2,4,11,12]. The content of lignin and stone cells in DW and DJ has been detected. At 47 DAPs, the lignin content reaches a peak, which is the key period of lignin formation. At 63 DAPs, there are significant differences in the lignin content and stone cell content in pear fruits [13]. Therefore, fruit at 47 and 63 DAPs was selected for metabolomics analyses.

2. Results

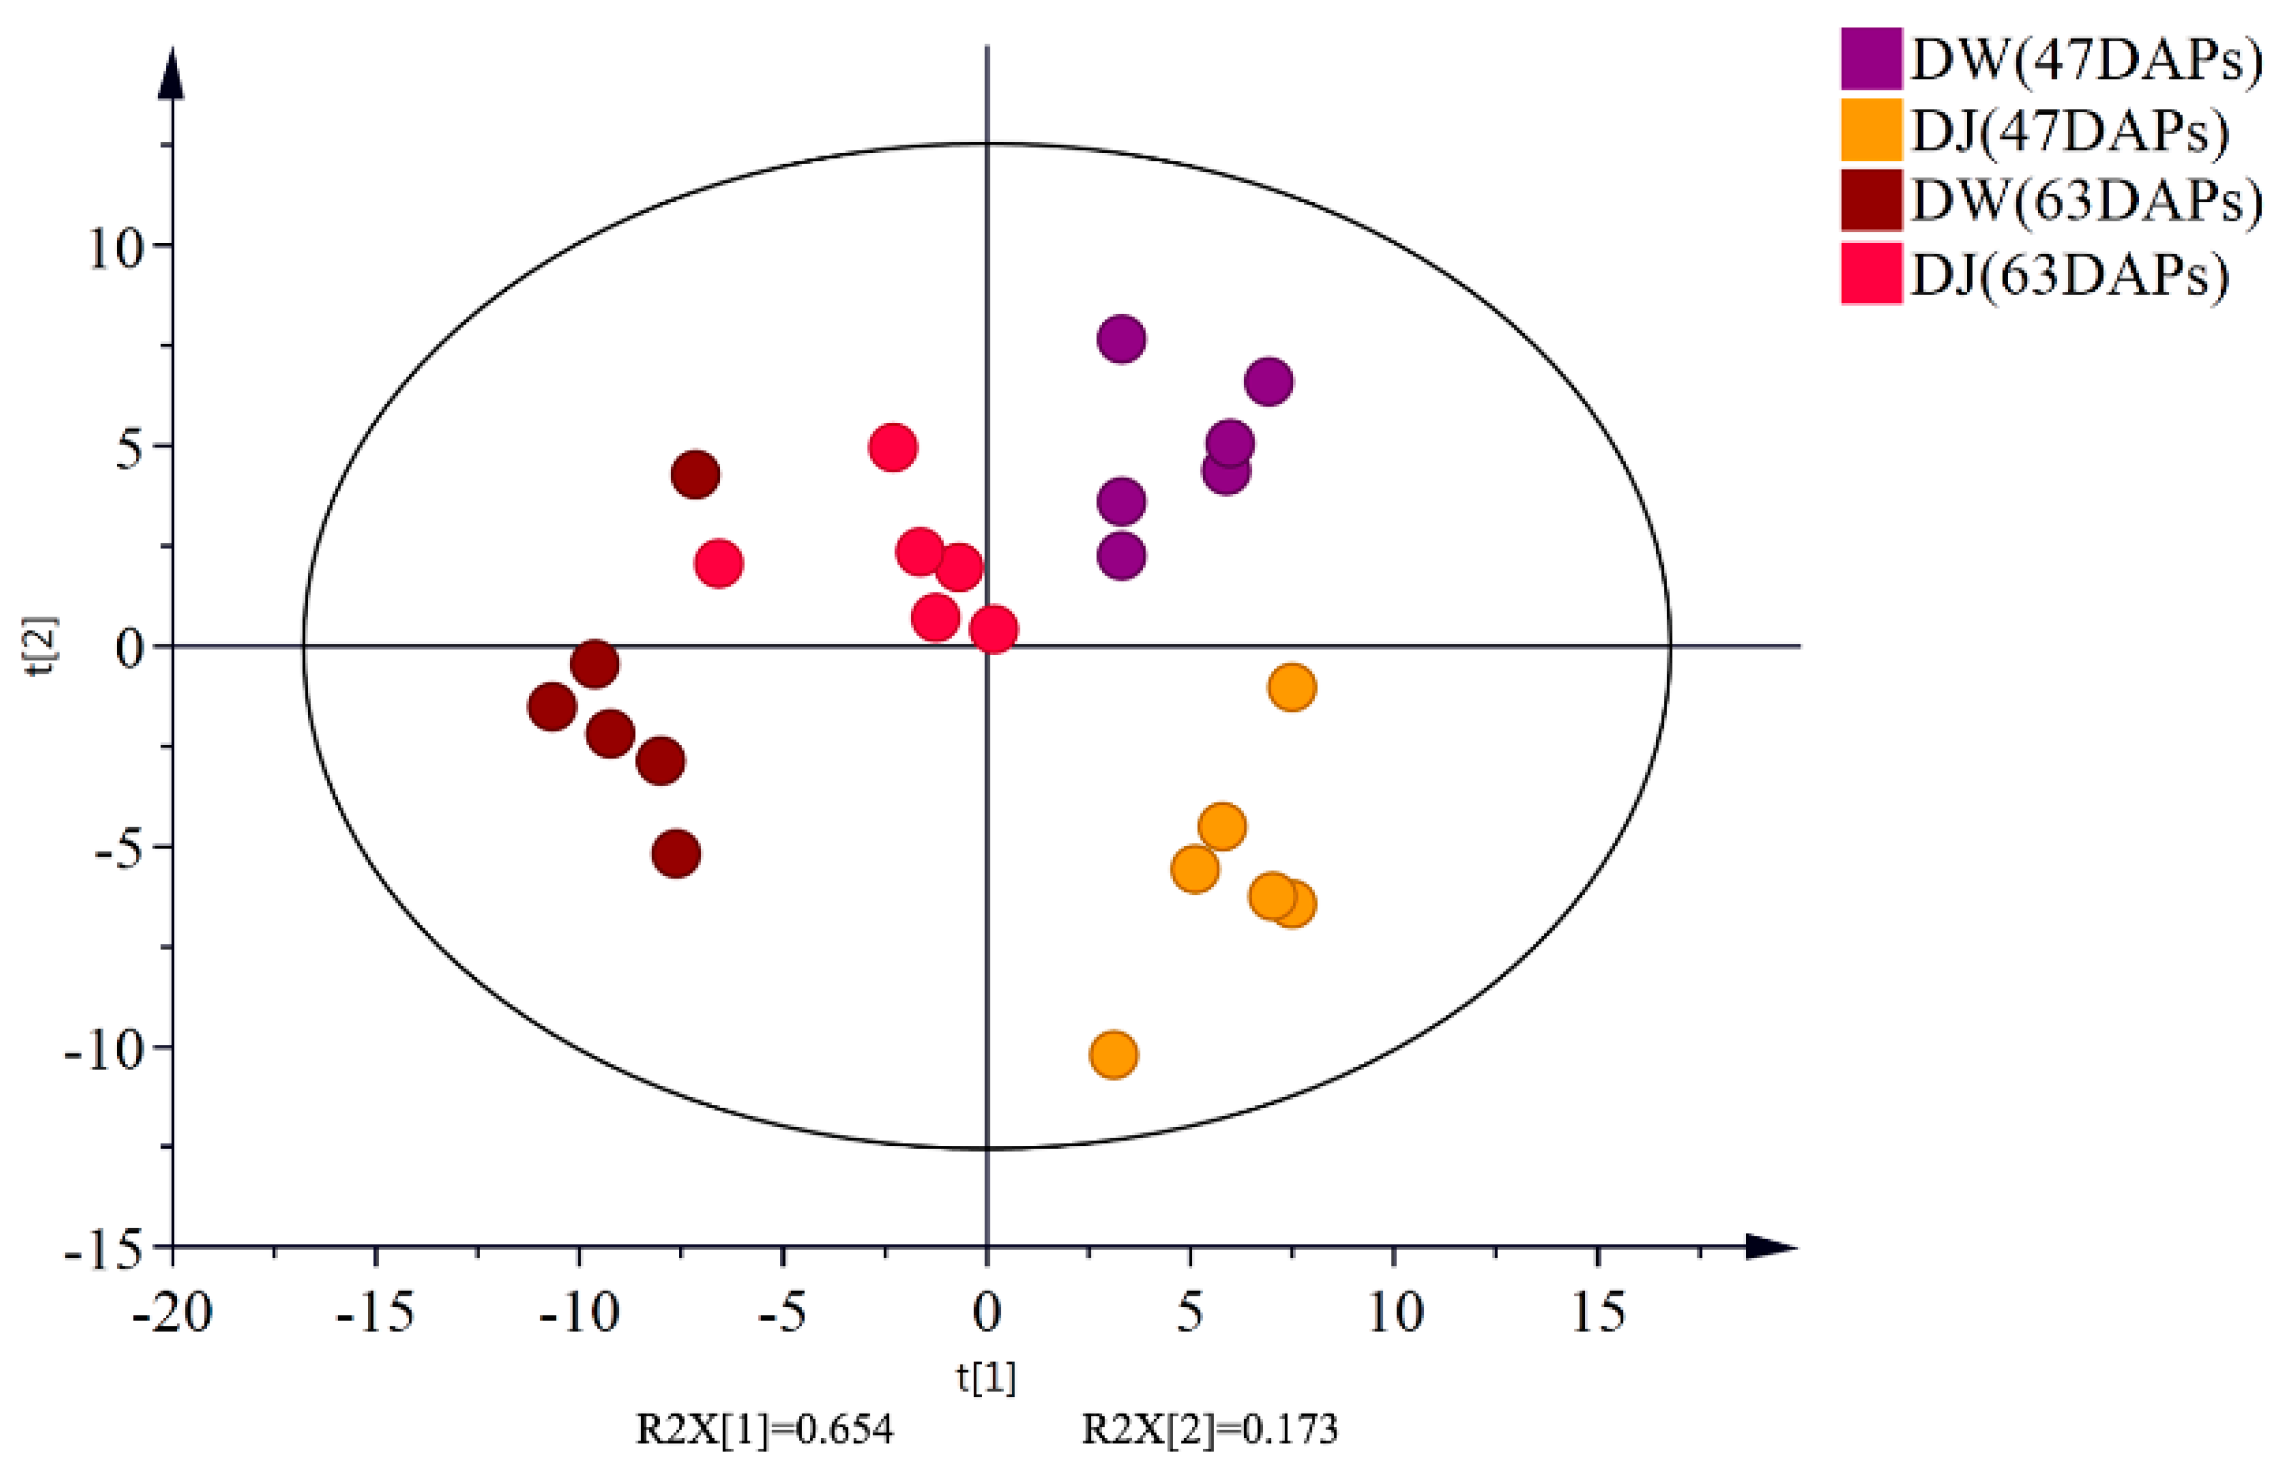
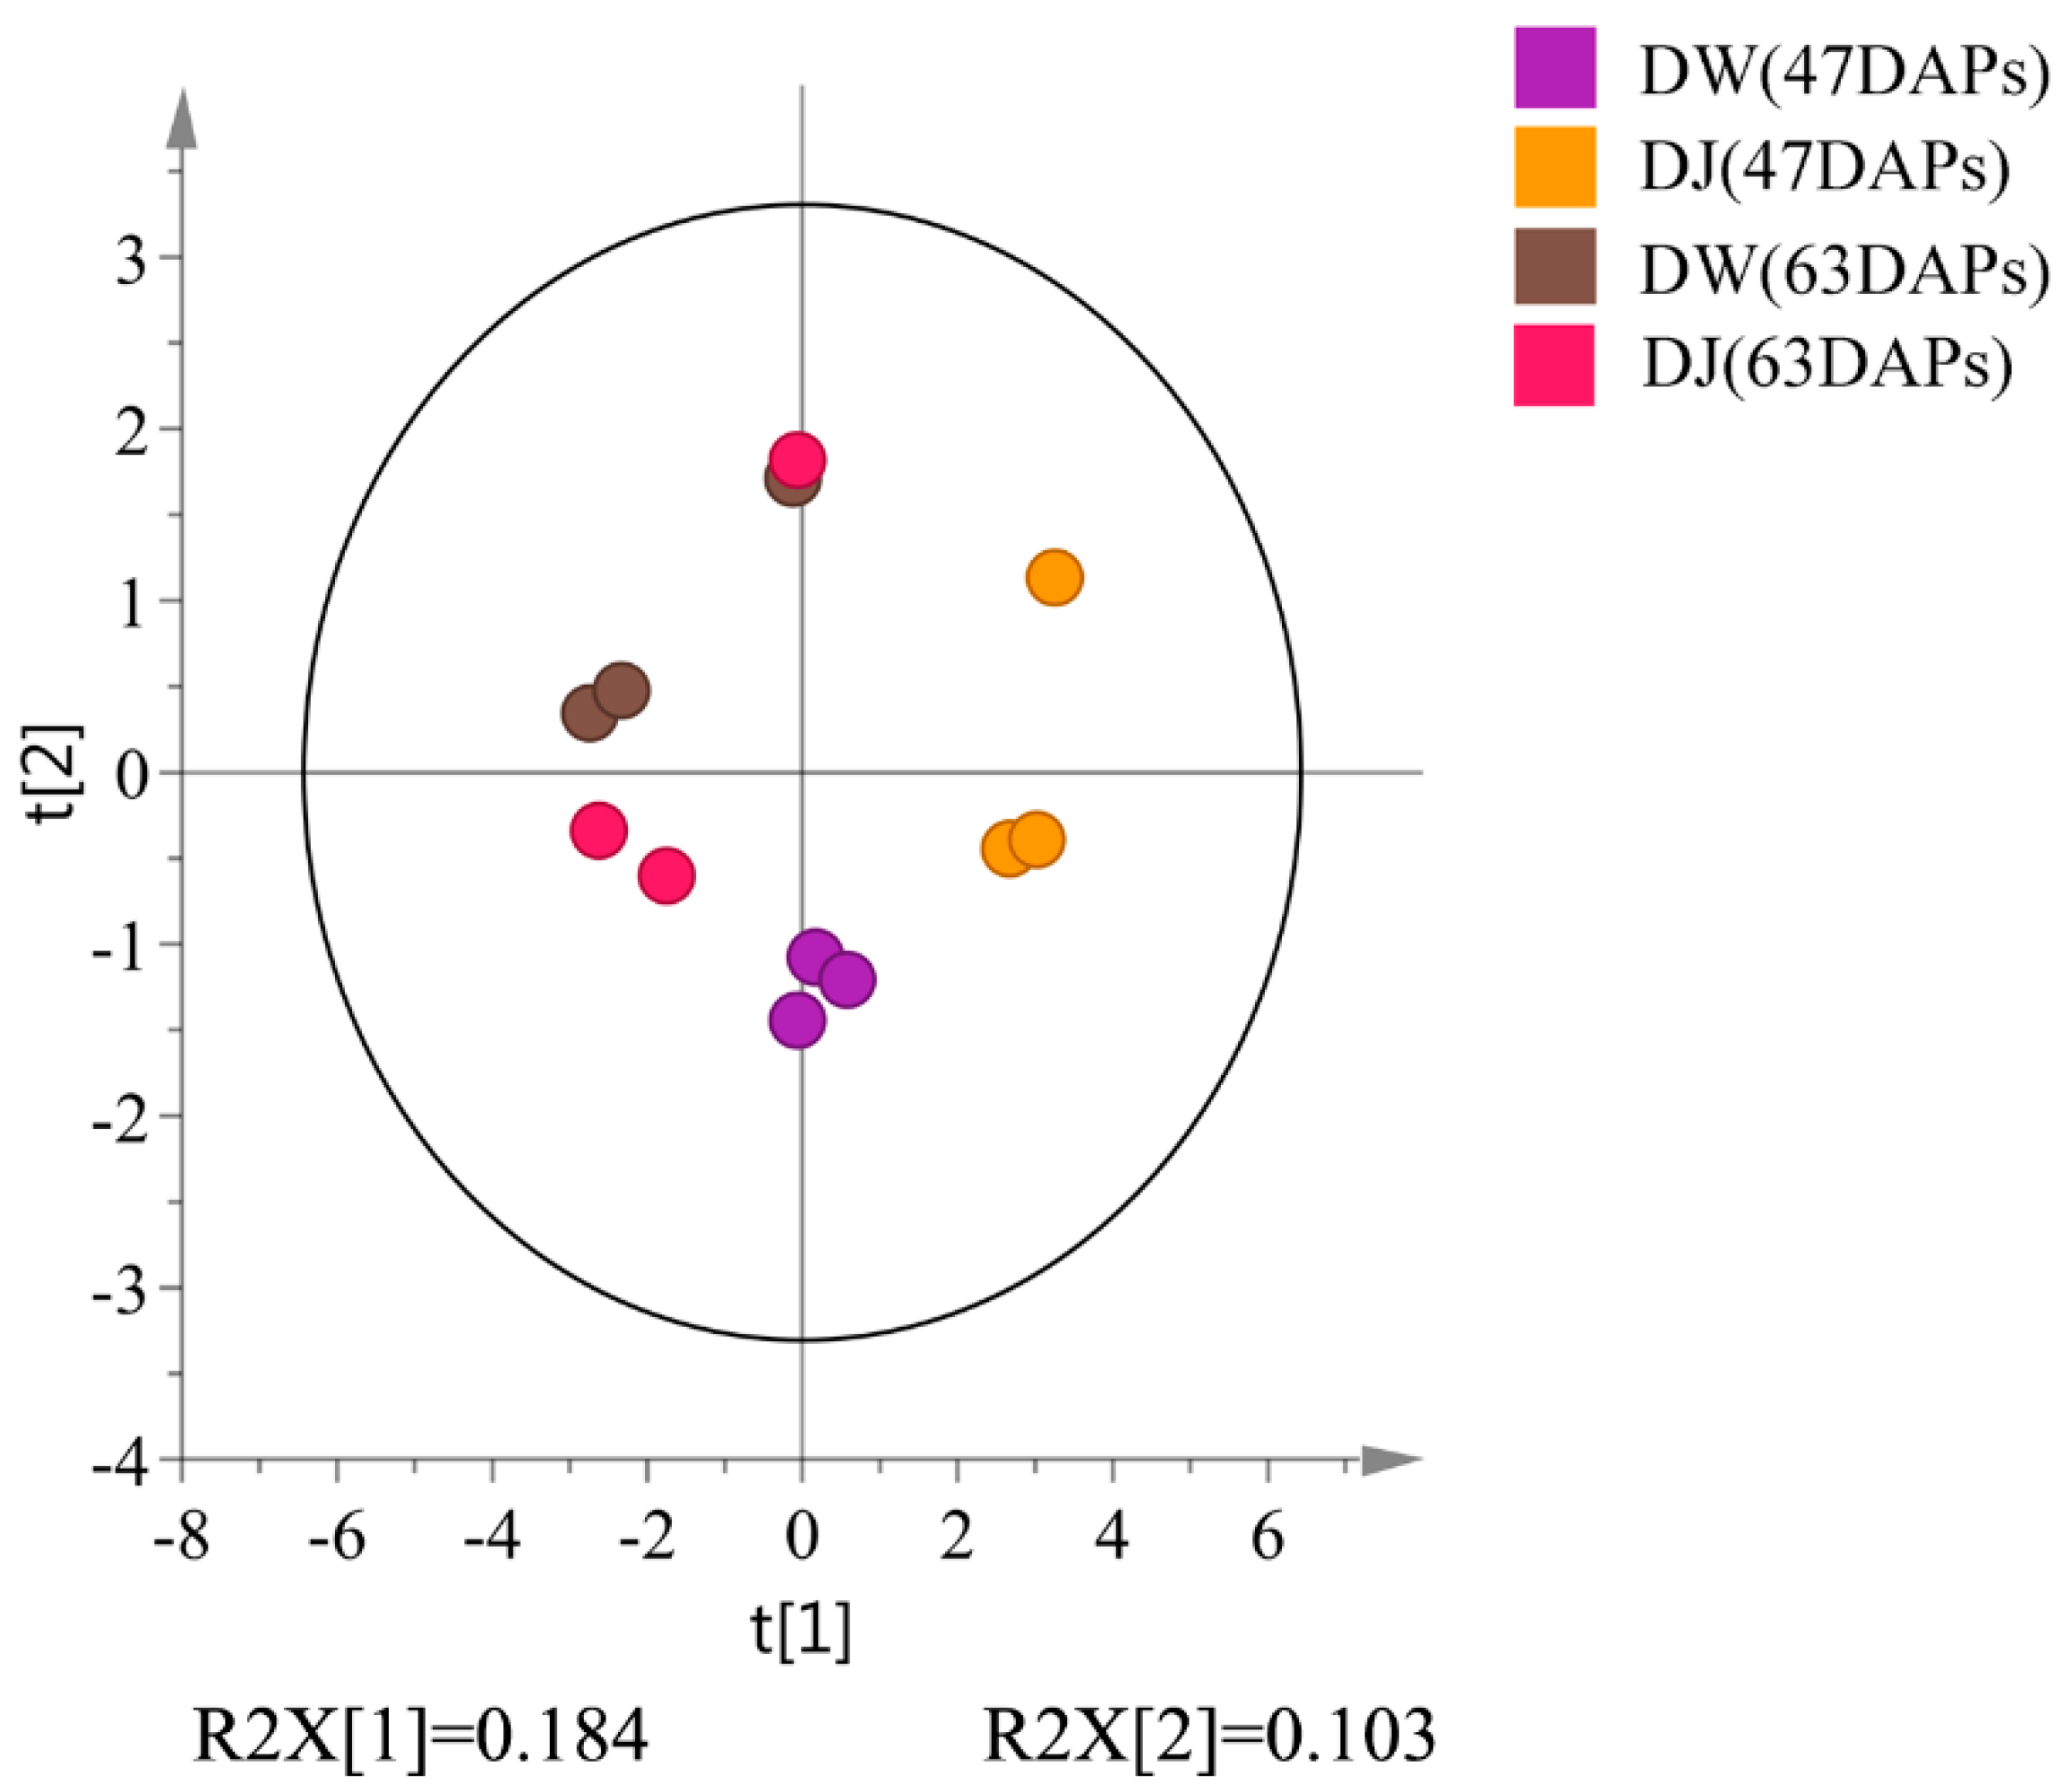
2.1. Un-Targeted Metabolomics Analysis of Primary Metabolites in ‘Dangshan Su’ Pear Fruit with Different Pollens

The total ion chromatograms (TICs) from GC-MS analyses of DW and DJ are shown in Figure 1: 711 substance peaks were detected, 218 compounds were detected, and 202 metabolites were appraised, including sugars, organic acids, amino acids, nucleosides, nucleotides, and aromatic substances. At 47 DAPs, a total of 173 and 164 metabolites were identified in DW and DJ, respectively; at 63 DAPs, a total 163 and 170 metabolites were identified in DW and DJ. To reduce the differences caused by each sampling, all peak signal strengths (peak areas) were normalized. A multivariate statistical analysis was performed on the normalized data. The first principal component contains 18.4% variables, and the second principal component contains 10.3% variables. A good distinction can be made between DW and DJ (Figure 2).

2.1.1. Effect of Pollination on Primary Metabolites in Dangshan Pear Fruit

The orthogonal partial least squares-discriminant analysis (OPLS-DA) model was applied to the GC-MS data (Figure 3). As shown in Figure 3A, the R2Y, and Q2 values were 0.999 and 0.886, respectively. The R2Y and Q2 values presented in Figure 3B were 1 and 0.8446, respectively. This result showed that the OPLS-DA model was stable and reliable. The OPLS-DA model was used according to a variable influence on projection (VIP) values and p-values to select differential metabolites. Metabolites with VIP > 1 and p < 0.05 were select as differential metabolites. At 47 DAPs, there were 51 differential metabolites, and 8 differential metabolites were only detected in DW; the levels of 26 differential metabolites were higher in DW, and 17 differential metabolite levels were higher in DJ (Table 1). At 63 DAPs, there were 34 differential metabolites; 1 differential metabolite was only detected in DW, and 7 differential metabolites were only detected in DJ. The levels of 5 differential metabolites were higher in DW, and those of 27 differential metabolites were higher in DJ (Table 2).

2.1.2. Effects of Pollination on Carbohydrate Metabolism and Amino Acid Metabolism in Dangshan Pear Fruit

To clarify changes in the metabolic pathways of DW and DJ, differential metabolites were marked on a metabolic diagram (Figure 4). At 47 DAPs (Figure 4A), the content of glucose-6-phosphate (1.850 times), arbutin (1.705 times), sorbitol (1.583 times), shikimic acid (1.446 times), caffeic acid (3.383 times), palmitic acid (1.719 times), stearic acid (1.890 times), linolenic acid (1.930 times), and elaidic acid (1.568 times) was higher in DW; l-kynurenine and lysine were only detected in DW. The glucose-1-phosphate (0.599 times), glycine (0.536 times), valine (0.394 times), aspartic acid (0.385 times) and proline (0.359 times) content was lower in DW, but asparagine was only detected in DJ.
At 63 DAPs (Figure 4B), the sorbitol (2.293 times), glycine (1.396 times) and valine (5.355 times) content was higher in DW; the fructose (0.615 times), galactose glucoside (0.579 times), mannitol (0.478 times), sitosterol (0.702 times), aspartic acid (0.557 times), proline (0.472 times), oleic acid (0.677 times) and gallic acid (0.605 times) levels were lower in DW; and sorbose and lysine were only detected in DJ.

2.2. Effects of Pollination on Intermediate Metabolites of Lignin Synthesis in Dangshan Pear Fruit

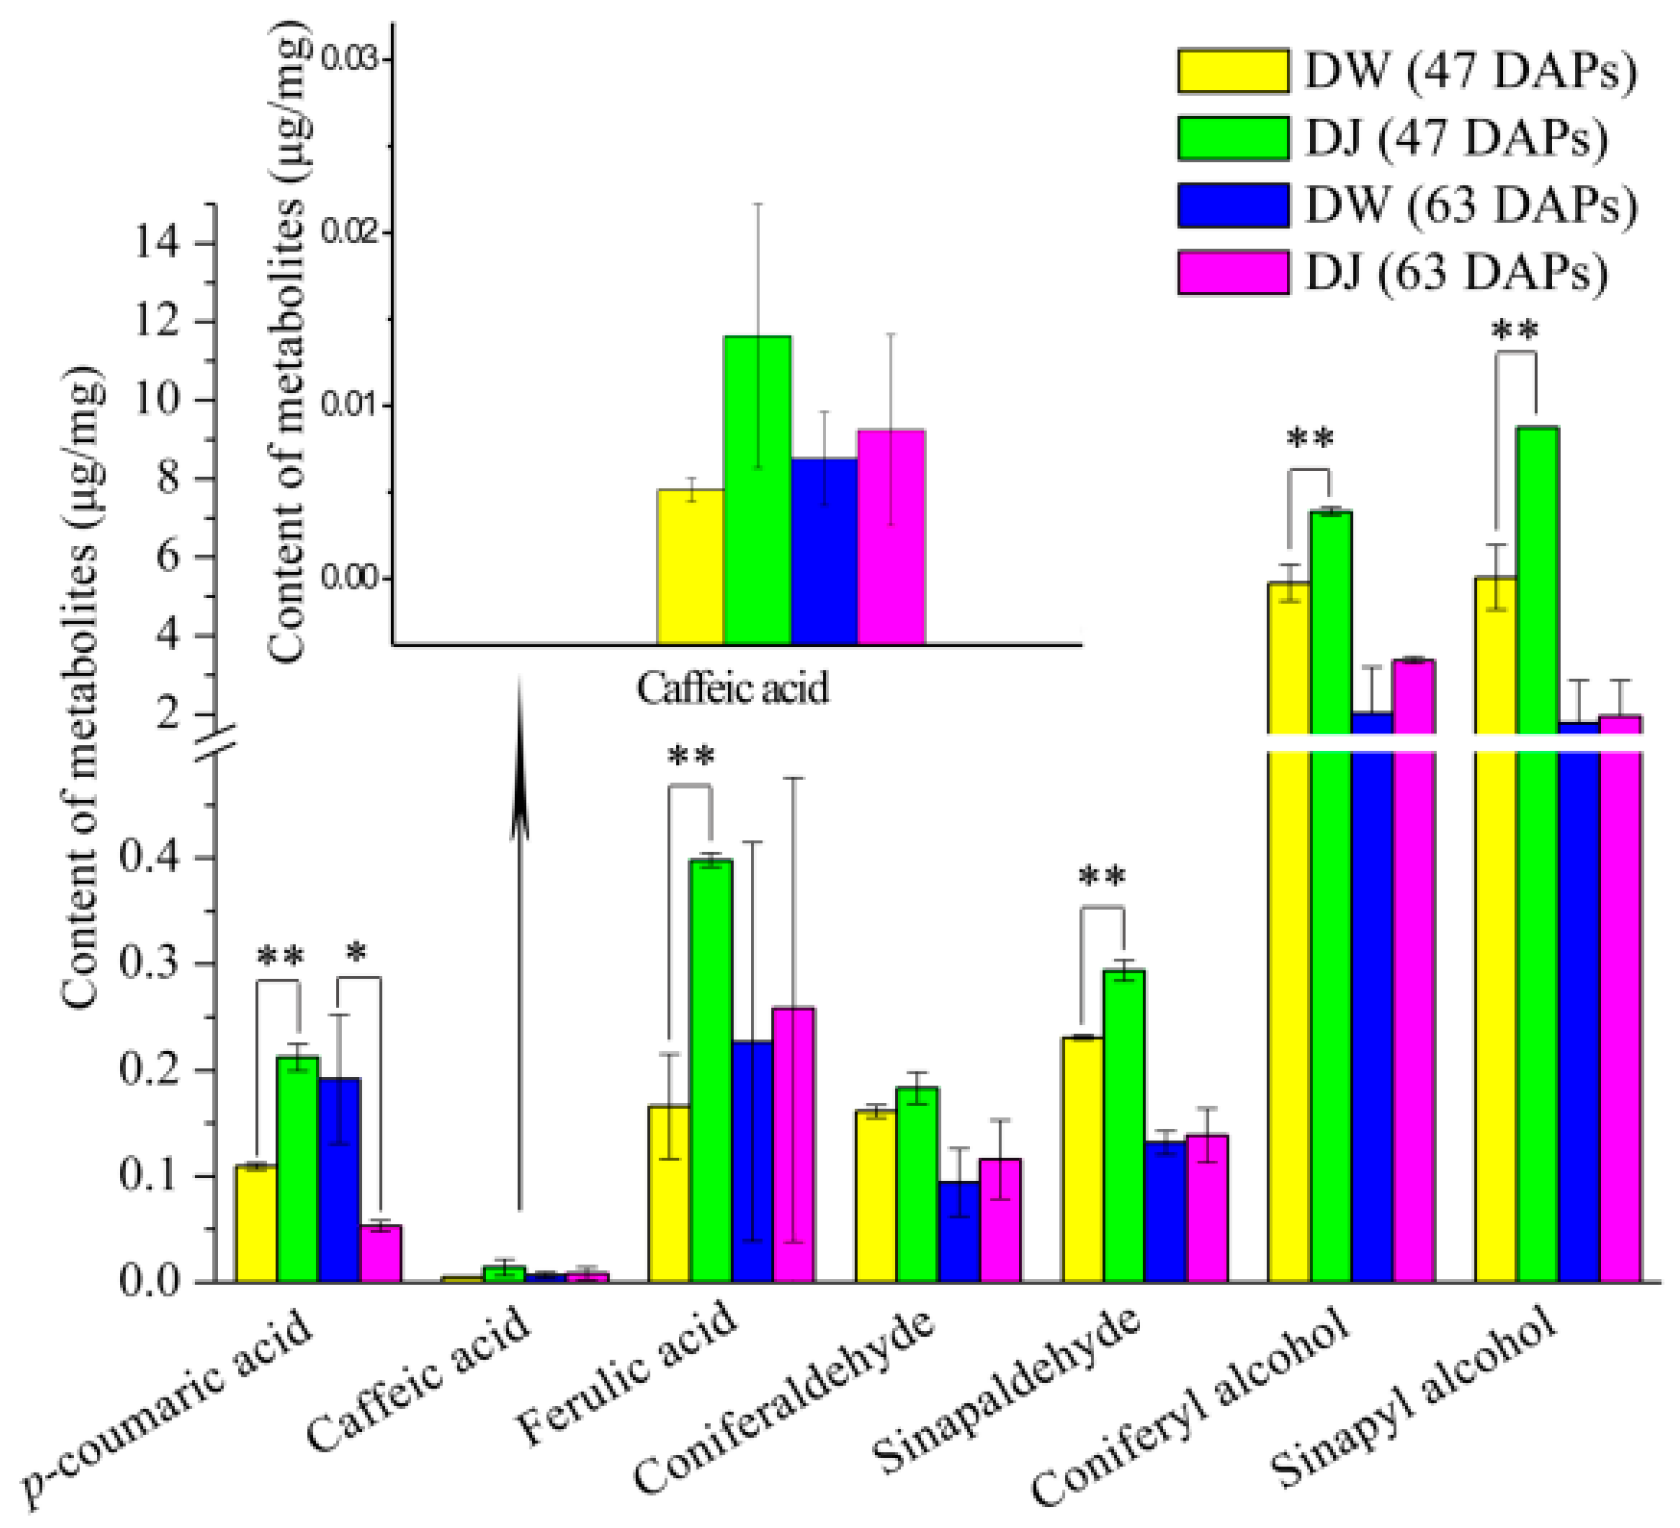
2.2.1. Effects of Pollination on the Content of Intermediate Metabolites in Lignin Synthesis of Dangshan Pear Fruit

By comparing the retention time (Figure S1) and characteristic ion pairs (Figure S2) between the standards and samples, 7 lignin synthesis metabolites were detected. The multiple reaction monitoring (MRM) scanning chromatogram of a standard and experimental sample is shown in Figures S3 and S4, respectively.
The PCA scores of samples were a good fit (R2 = 0.827) and exhibited good predictive value (Q2 = 0.415) in the PCA scoring diagram (Figure 5). The first principal component contains 65.4% variables, and the second principal component contains 17.3% variables. The PCA scores showed that the distribution of the samples was roughly the same and that there was no sample out of the scoring chart Hotelling T2 95% confidence interval; thus, it can be used for subsequent analysis [14].
The experimental data of targeted analysis with a two-tailed Student’s t-test. As seen in Figure 6, the p-coumaric acid, caffeic acid, ferulic acid, coniferaldehyde, sinapaldehyde, coniferyl alcohol, and sinapyl alcohol content in DW is lower than that in DJ at 47 DAPs. This result was consistent with the content of lignin and stone cells at 47 DAPs. The p-coumaric acid, ferulic acid, sinapaldehyde, coniferyl alcohol and sinapyl alcohol content was statistically different. At 63 DAPs, the p-coumaric acid content in DW was significantly higher than that in DJ, approximately 3.62 times higher. The lignin content could increase when the p-coumaric acid content was increased [15,16]. This result was consistent with the observation that the lignin content was higher in DW. The results showed that different pollens could affect the lignin content by regulating the intermediate metabolite content in lignin biosynthesis.
Through OPLS-DA analysis of the targeted metabonomics, it was found that the model has good quality at 47 DAPs (R2Y = 0.983, Q2 = 0.983) and 63 DAPs (R2Y = 1, Q2 = 0.982) [17]. It can be seen from the OPLS-DA scores (Figure 7) that the pear fruit can be clearly distinguished between DW and DJ. VIP > 1 and p < 0.05 were used as the criteria for selecting differential metabolites [18,19]. The differential metabolites at 47 DAPs were p-coumaric acid, ferulic acid, sinapaldehyde, coniferyl alcohol and sinapyl alcohol. At 63 DAPs, the differential metabolite was p-coumaric acid (Table 4).

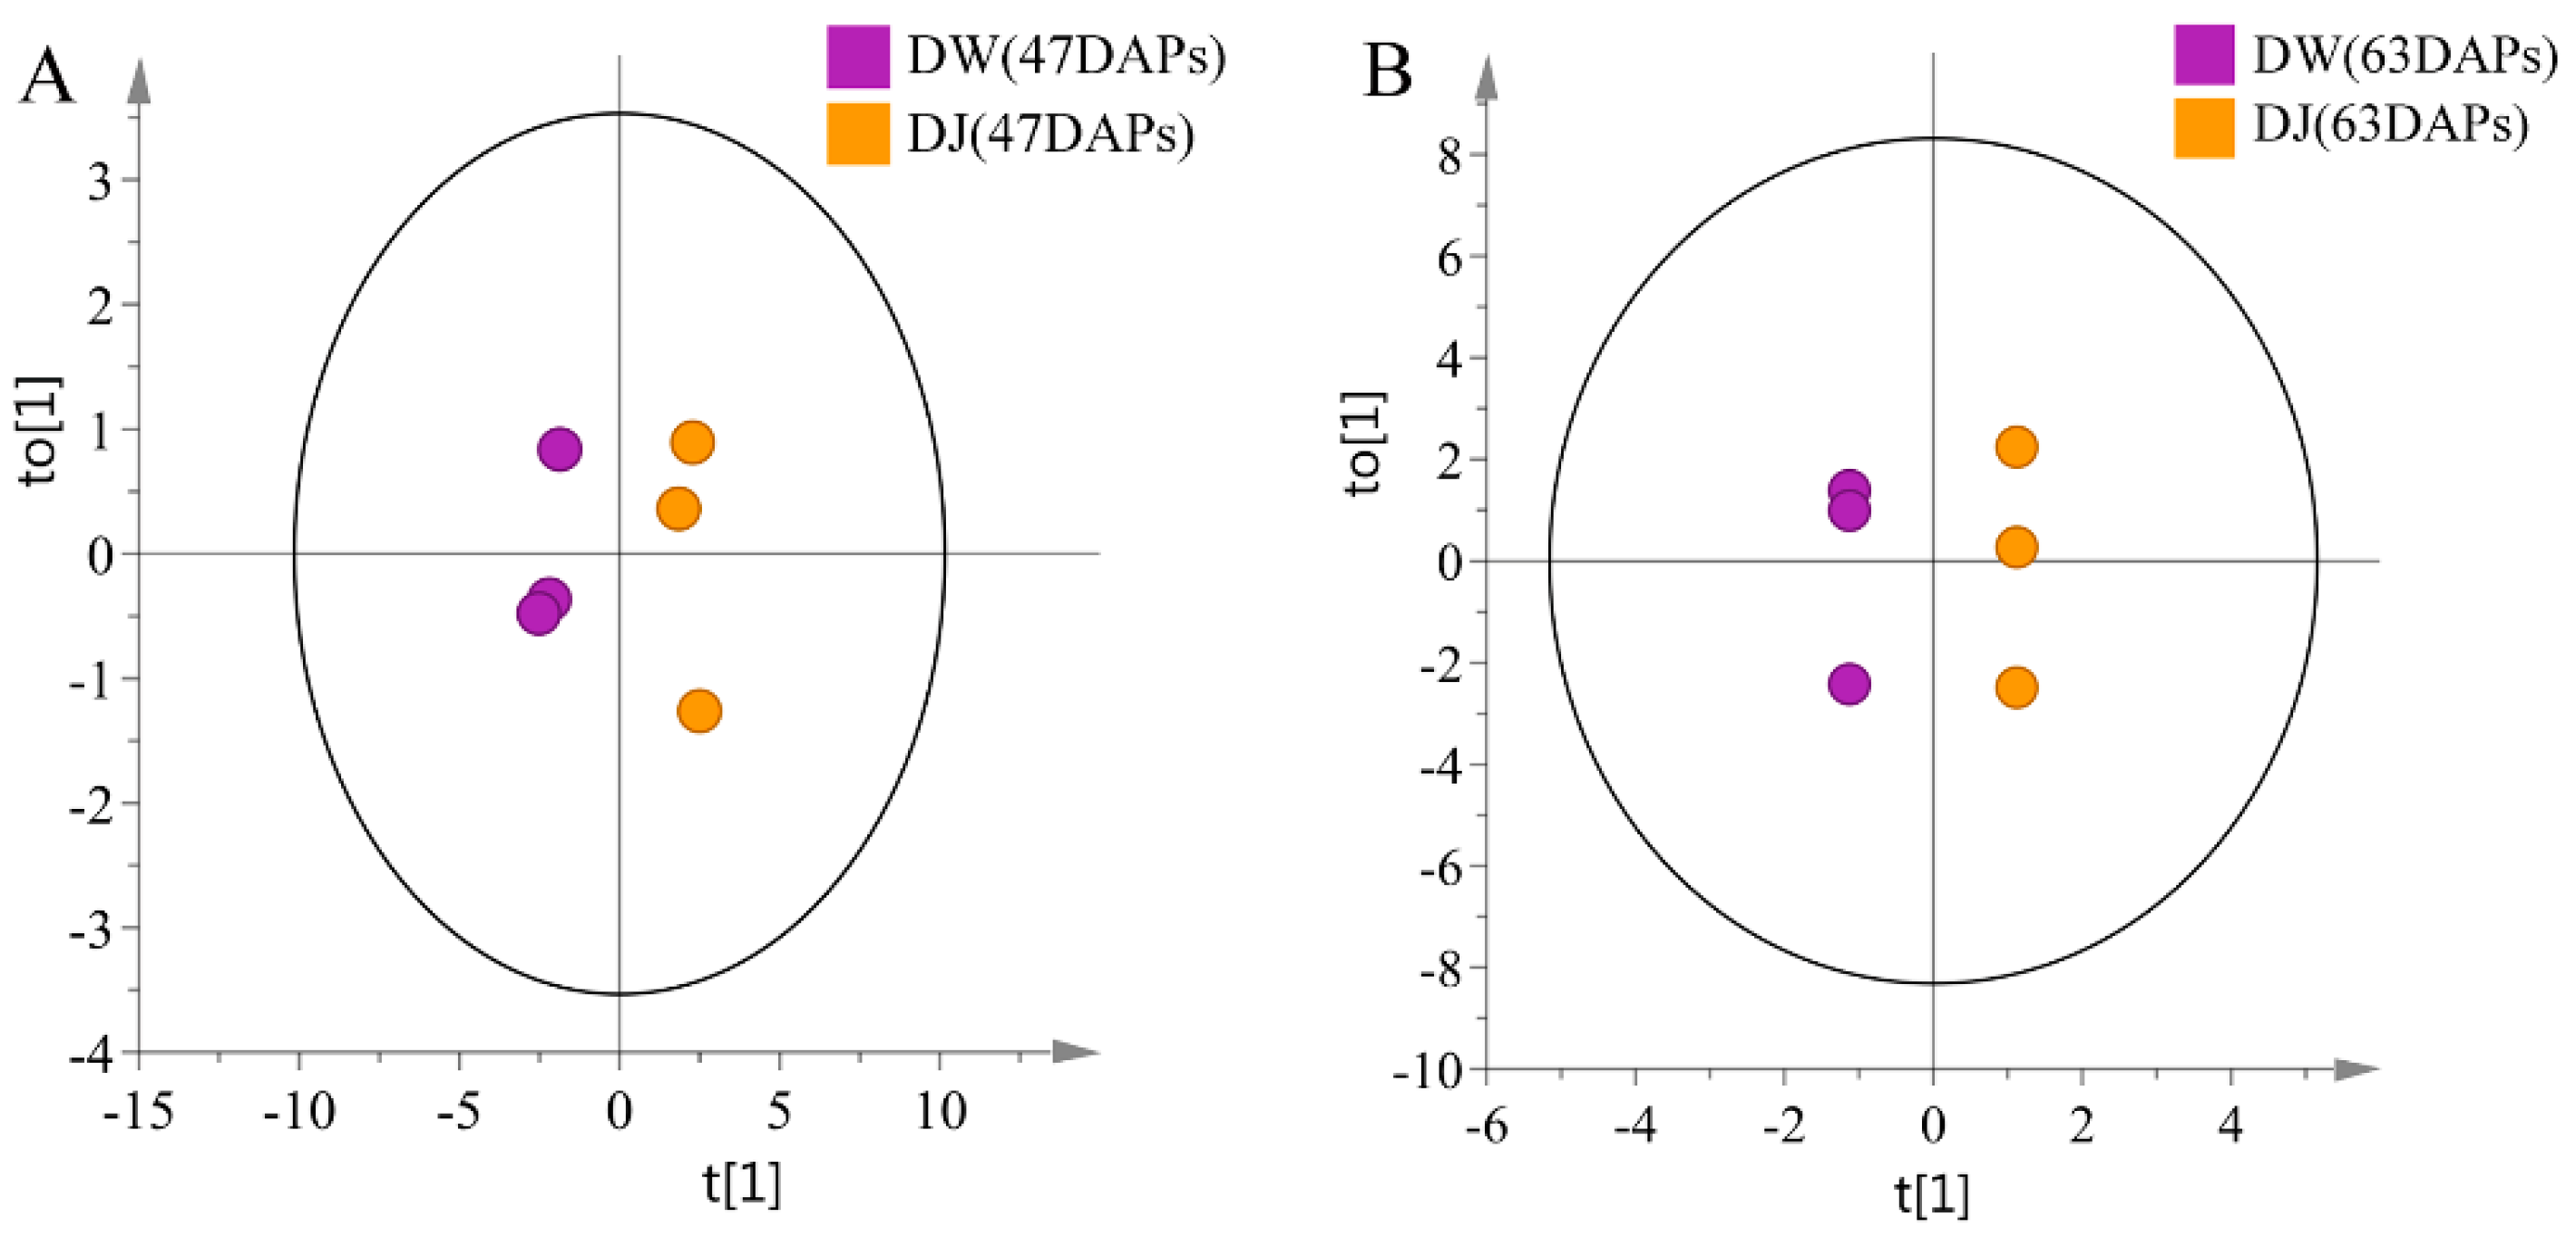
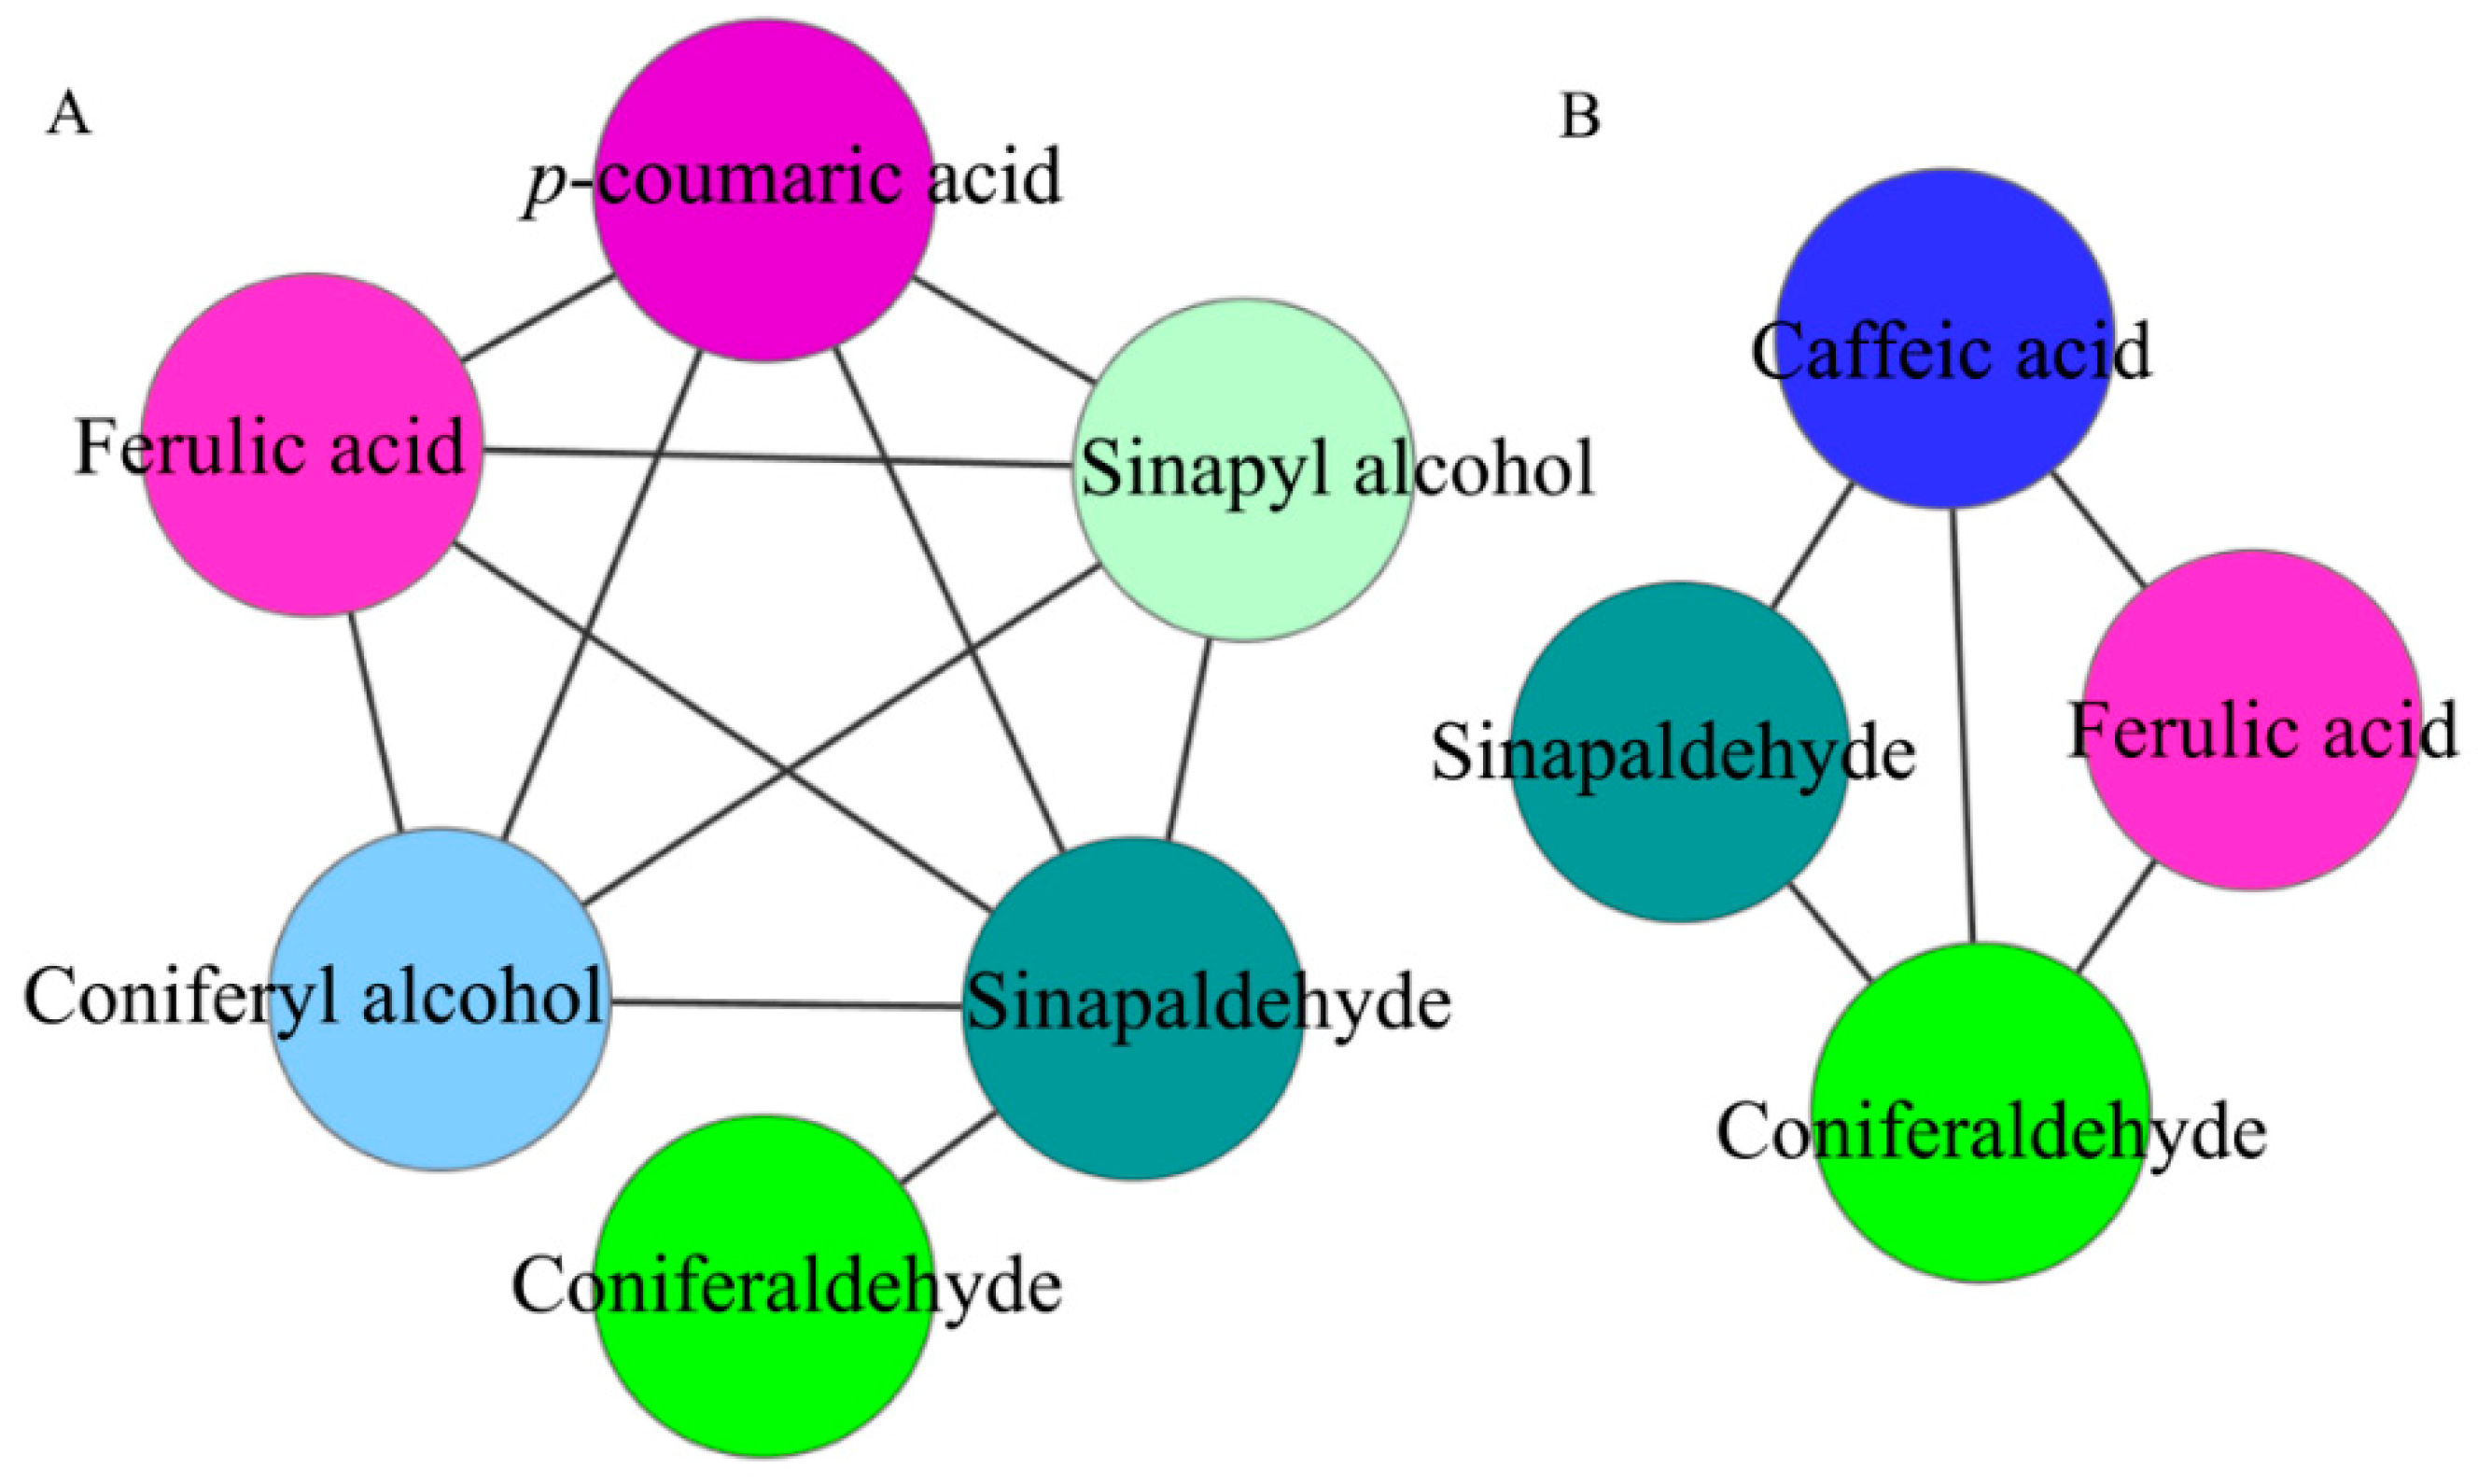
2.2.2. Correlation Analysis of Intermediate Metabolites in Lignin Synthesis in Pear Fruit

To study the effects of pollination on lignin synthesis in pear fruit, a Pearson analysis of correlations between lignin synthesis intermediate metabolites was performed (Figure 8). The results showed that at 47 DAPs most of intermediate metabolites of lignin synthesis were significantly positively correlated (r > 0.08, p < 0.05), and a few metabolites were not correlated. At 63 DAPs, most of intermediate metabolites of lignin synthesis were not correlated, and metabolites showed significant positive correlation.
A correlation network analysis was performed on the intermediate metabolites of lignin synthesis to determine significantly positive correlations (r > 0.8, p < 0.05) (Figure 9). At 47 DAPs, 11 pairs of metabolites exhibited significantly positive correlation. p-Coumaric acid and ferulic acid (r = 0.963, p = 2.011 × 10⁻³), sinapaldehyde (r = 0.986, p = 2.905 × 10⁻³), coniferyl alcohol (r = 0.938, p = 5.461 × 10⁻³), and sinapyl alcohol (r = 0.952, p = 3.447 × 10⁻³) had a significantly positive correlation. Ferulic acid and sinapaldehyde (r = 0.949, p = 3.868 × 10⁻³), coniferyl alcohol (r = 0.994, p = 5.057 × 10⁻⁴), and sinapaldehyde (r = 0.972, p = 1.16) had a significantly positive correlation. Sinapaldehyde and coniferaldehyde (r = 0.853, p = 3.071 × 10⁻²), coniferyl alcohol (r = 0.921, p = 9.213 × 10⁻³), and sinapyl alcohol (r = 0.948, p = 4.044 × 10⁻³) had a significantly positive correlation. Coniferyl alcohol and sinapyl alcohol (r = 0.976, p = 8.360 × 10⁻⁴) had a significantly positive correlation.
At 63 DAPs, 5 pairs of metabolites were positively correlated. Caffeic acid was positively correlated with ferulic acid (r = 0.976, p = 8.878 × 10⁻⁴), coniferaldehyde (r = 0.886, p = 1.872 × 10⁻²), and sinapaldehyde (r = 0.821, p = 4.517 × 10⁻²). Ferulic acid was positively correlated with coniferaldehyde (r = 0.891, p = 1.716 × 10⁻²). There was a significant positive correlation between coniferaldehyde and sinapaldehyde (r = 0.827, p = 4.221 × 10⁻²).

3. Discussion and Conclusions

Metabolomic analysis does not rely on transcriptomics, proteomics, or genomic sequences and has a wide range of applications. This analysis is one of the most effective methods for understanding the mechanisms of metabolic regulation [21,22]. In this experiment, GC-MS and LC-ESI-MS/MS methods were used for detection. Compared with NMR spectroscopy, these techniques have more extensive coverage and more complex univariate and multivariate data analysis methods [23]. In addition, LC-ESI-MS/MS has the advantages of high precision, high sensitivity, and high output [24]. In this study, LC-ESI-MS/MS data were used to rapidly and sensitively characterize and quantify 7 metabolites in pear fruit via MRM [25].
Target detection of pear fruit primary metabolites with GC-MS, PCA, and OPLS-DA showed that DW and DJ can clearly be distinguished. Different pollens have a great influence on metabolites. Sugar, amino acids, and fatty acids are associated with pear fruit quality [5]. At 47 DAPs, the sugar and amino acid content is relatively higher in DW, and the fatty acid content is relatively lower. At 63 DAPs, the sugar, amino acid, and fatty acid content in DW is lower than that in DJ. It can be speculated that different pollens could affect the quality of pear fruit.
At 47 DAPs, the KEGG pathways are enriched by differential metabolites, including phenylalanine, tyrosine and tryptophan biosynthesis (Table 3), and the synthesis of lignin is initiated by the deamination of phenylalanine to form cinnamic acid [26]. Therefore, it can be inferred that pollination affects the synthesis of phenylalanine in pear fruit and regulates the synthesis of lignin.
Through the targeted metabolomics analyses of DW and DJ, along with the OPLS-DA, at 47 DAPs, the differential metabolites identified were p-coumaric acid, ferulic acid, sinapaldehyde, coniferyl alcohol and sinapyl alcohol. At 63 DAPs, the differential metabolite was p-coumaric acid. Therefore, it is speculated that different pollens affect the formation of lignin synthesis intermediate metabolites in pear fruit and then regulate the formation of lignin. At 47 DAPs, different pollens had a great influence on the formation of lignin.
The differential metabolites included p-coumaric acid both at 47 DAPs and 63 DAPs. The p-coumaric acid content in DW was 0.52 times and 3.62 times higher than that in DJ at 47 DAPs and 63 DAPs, respectively; at the same time, the lignin content was 0.47 times and 2.55 times higher, respectively. It can be seen that when the lignin content in pear fruit is high, the p-coumaric acid content is also high. Through multiple regression analysis, it was found that p-coumaric acid and lignin were significantly positively correlated (R2 = 0.733, p < 0.01). The p-coumaric acid content could affect the synthesis of lignin [27,28]. The synthesis of pear lignin mainly initiated from p-coumaric acid, consistent with the results of Cai [2]. p-Coumaric acid is a precursor to the synthesis of lignin in pear fruit, which is closely related to the synthesis of lignin and the formation of stone cells [29].
At 47 DAPs, 11 pairs of lignin synthesis intermediate metabolites were significantly positively correlated. At 63 DAPs, 5 pairs of lignin synthesis intermediate metabolites were significantly positively correlated. It can be seen that 47 DAPs is a critical period for lignin formation in pear fruit. This result is consistent with previous results [13].

4. Materials and Methods
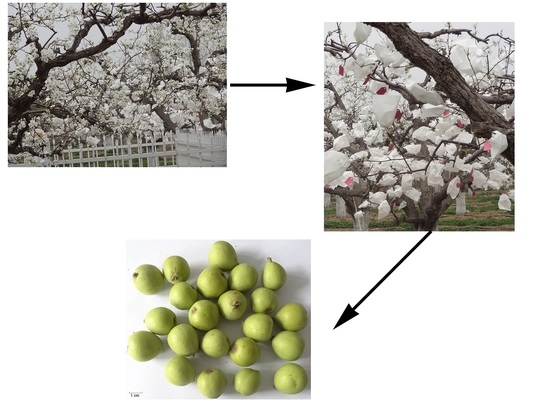
4.1. Materials

Fruits were obtained from 50-year-old pear trees grown in Dangshan, Anhui, China. In April, twenty robust and healthy ‘Dangshan Su’ managed in a consistent manner were selected as mother trees. The ‘Wonhwang’ (Pyrus pyrifolia Nakai.) and ‘Jingbaili’ (Pyrus ussuriensis Maxim.) were selected as father trees, and the pollen was collected from buds with similar developmental stages and sizes. Buds on the short branches of ‘Dangshan Su’ with similar developmental stages and sizes were selected from the mid-crown area on the south side of each tree, and the stamen was removed and fertilized with pollen from P. pyrifolia cv. ‘Wonhwang’ (DW) and P. ussuriensis cv. ‘Jingbaili’ (DJ). Two fruits were kept for each short branch and covered with bags for seven days after pollination. Fruits were collected at 47 and 63 DAPs. Twenty fruits with relatively uniform size were collected at each time point, refrigerated, and transferred to the laboratory for further study. The standard samples of cinnamic acid, p-coumaric acid, caffeic acid, ferulic acid, sinapic acid, coniferaldehyde, sinapaldehyde, coniferyl alcohol and sinapyl alcohol were purchased from Sigma-Aldrich (St. Louis, MO, USA) (purity > 99%).
Methanol (HPLC grade) was purchased from TEDIA (Fairfield, OH, USA). Pyridine was obtained from Ehrenstorfer (Augsburg, Germany). N,O-bis (trimethylsilyl)-trifluoroacetamide (BSTFA) containing 1% trimethylchlorosilane (TMCS) was purchased from SUPELCO (Bellefonte, PA, USA). Water was obtained from Wahaha Group Co., Ltd. (Hangzhou, China).

4.2. Preparation and LC-MS Detection of Lignin Synthesis Intermediate Metabolite Standard Solution

According to the difference in mass spectrometry response signals, the standards were weighed and dissolved in chromatographic-grade methanol solution to obtain standard solutions of different concentrations. Concentrations of p-coumaric acid, ferulic acid, coniferaldehyde, coniferyl alcohol, and sinapyl alcohol: 10, 30, 40, 80 and 500 ng/mL; cinnamic acid concentrations: 30, 40, 80, 500 and 1000 ng/mL; caffeic acid concentrations: 5, 10, 30, 40 and 80 ng/mL; sinapic acid concentrations: 5, 30, 40 and 80 ng/mL; and sinapaldehyde concentrations: 5, 10, 40, 80 and 500 ng/mL.
Standard solutions were analysed using ultra-high-performance liquid chromatography coupled with tandem mass spectrometry (UHPLC-MS/MS). The MS detection was performed on a Qtrap 6500 MS (AB Sciex, Framingham, MA, USA) equipped with an ESI source operating in negative-ion mode. Quantification of 9 metabolites was carried out in the MRM mode [30,31]. At the same time, optimization to voltage (DP), cluster collision (CE) and mass spectrum parameters, such as the optimal conditions for 9 types of compound ion pairs for rapid screening, was performed. The optimized mass spectrometry conditions were as follows: the gas curtain gas 30; collision gas 8; ion spray voltage −4500 V, temperature 550; ion source gas 1:55; and gas 2:55. The MRM detection parameters of 9 compounds are shown in Table 5, and the corresponding MRM changes were measured to determine the retention time of each metabolite [32,33].
The eluents were as follows: A, water with 0.1% formic acid; and B, acetonitrile with 0.1% formic acid. The gradient program was as follows: 10–10% B (3 min), 10–95% B (10 min), 95–95% B (2 min), 95–10% B (0.1 min), and 10–10% B (2.9 min) at a constant flow of 0.2 mL/min. The standard curves and retention times were obtained by testing of the lignin synthesis intermediate metabolite standards (Table 6).

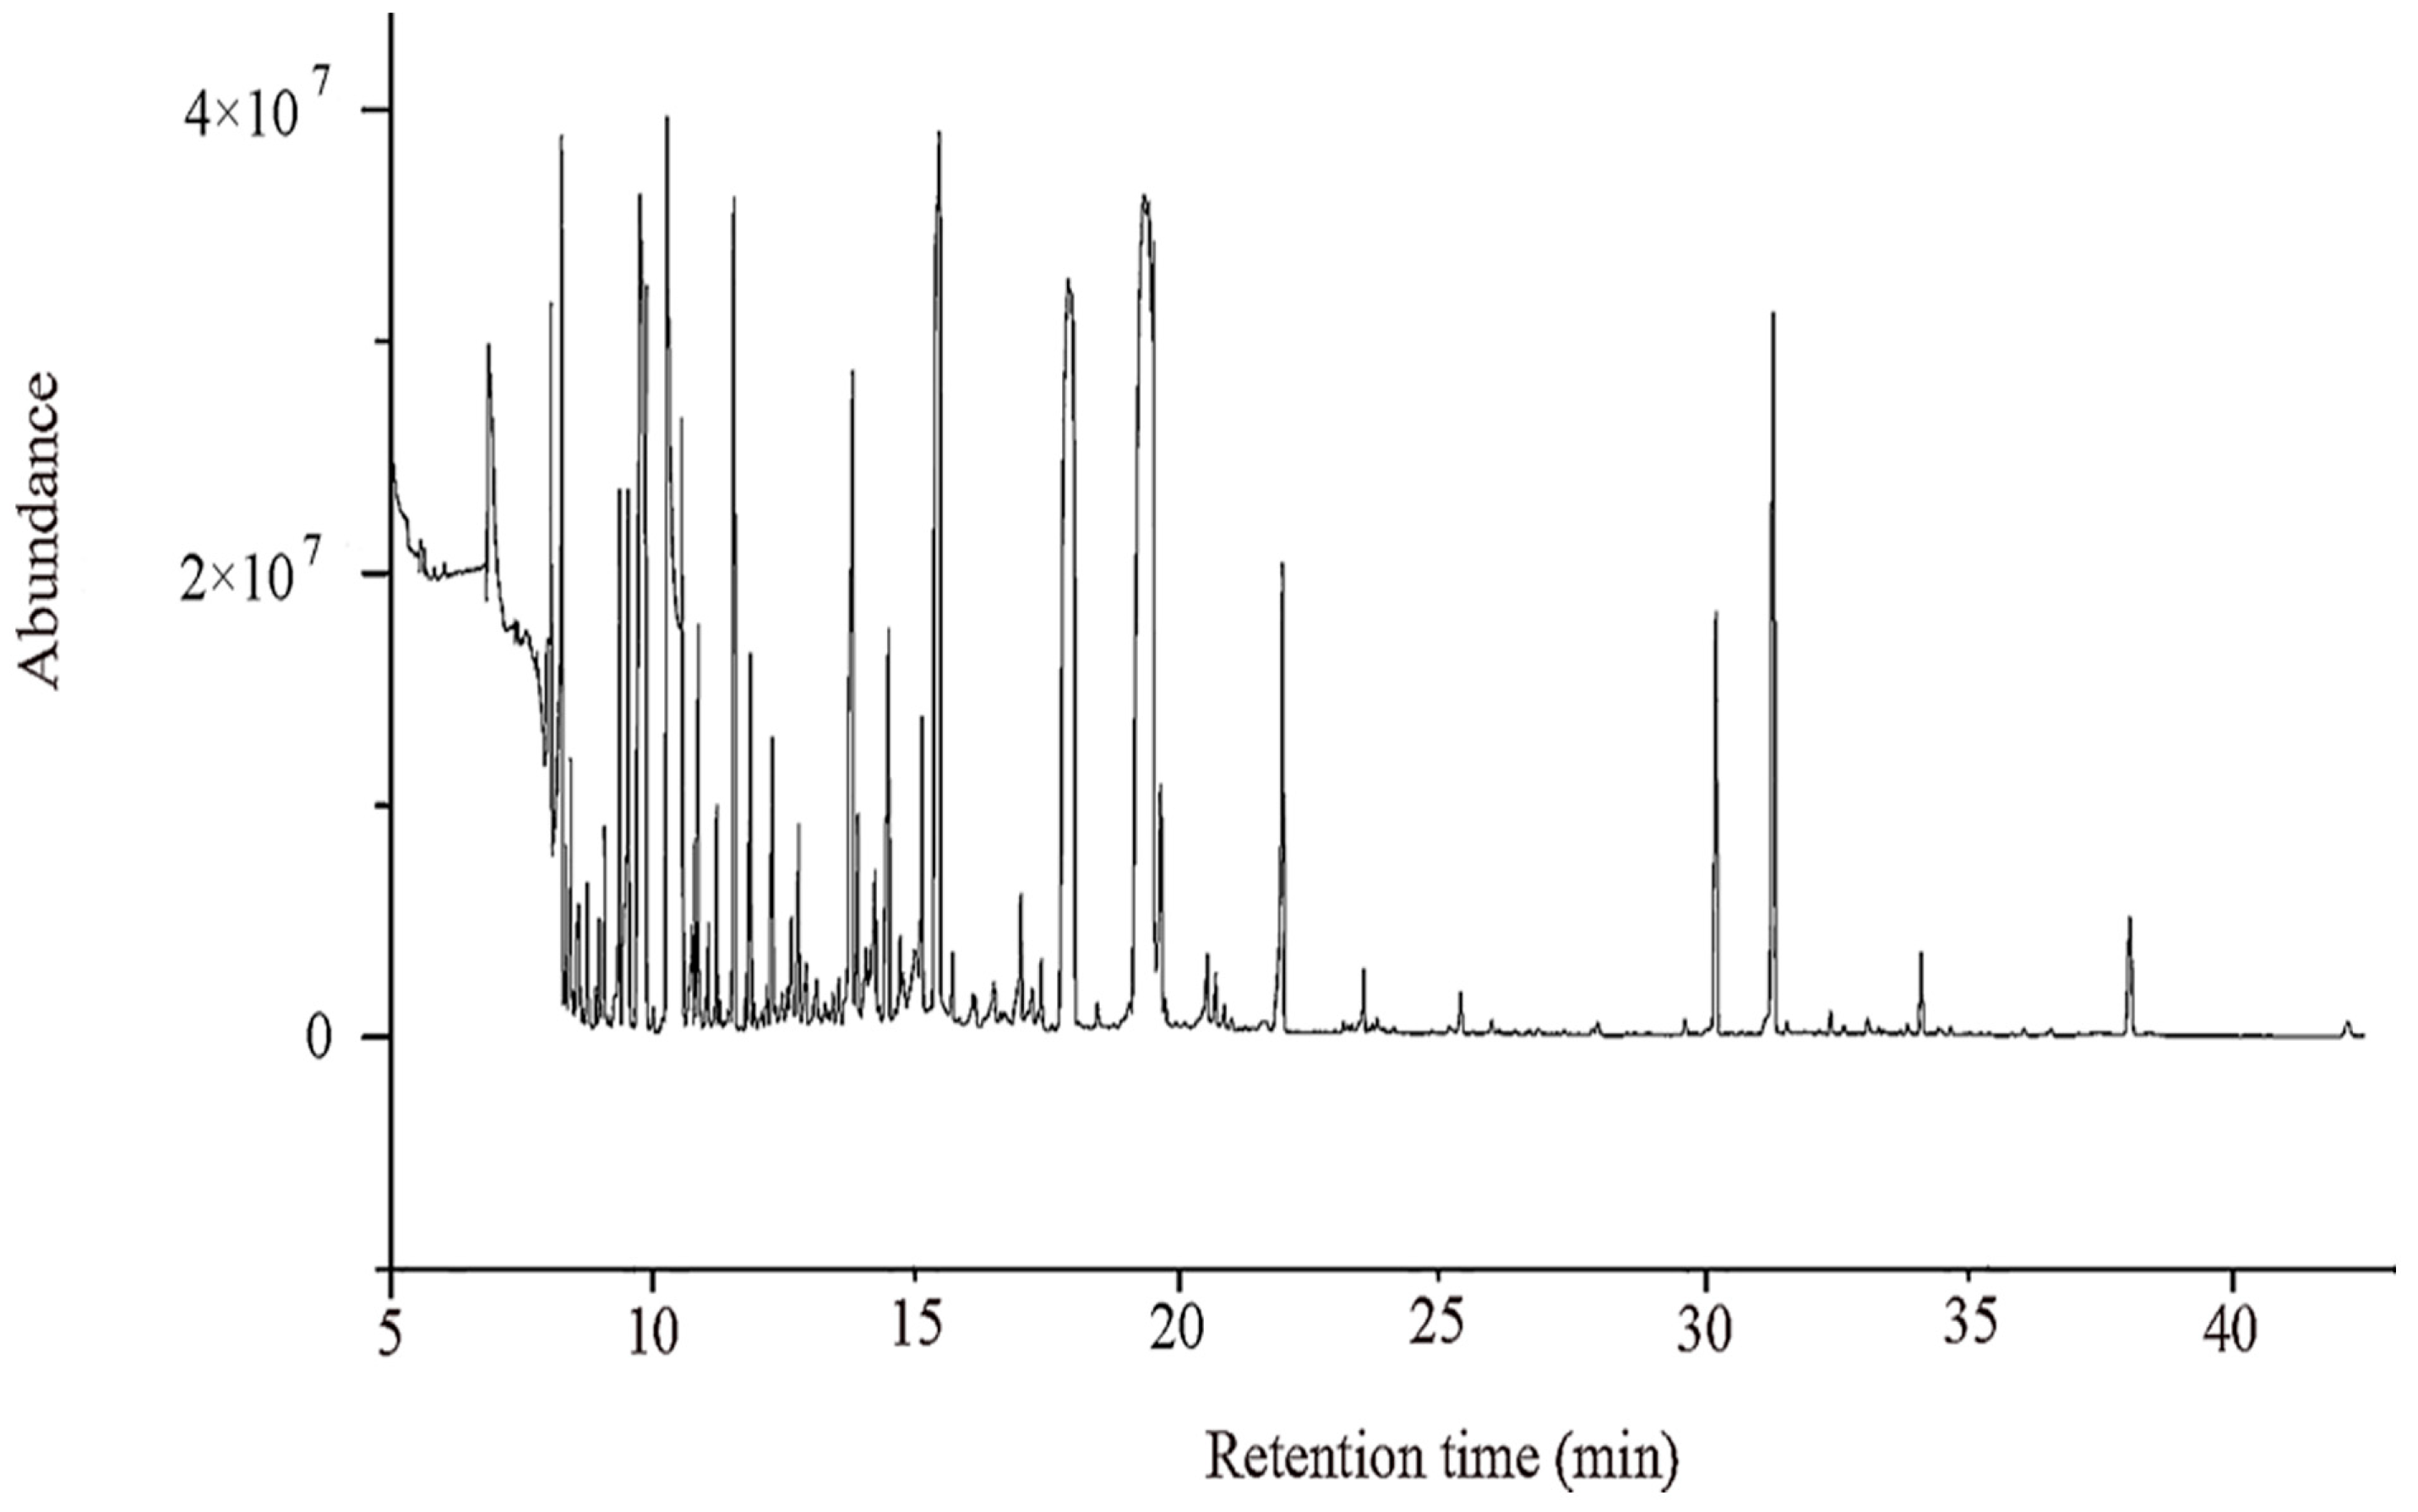
4.3. Extraction and Derivation of Primary Metabolites from Pear and Analysis by GC-MS

According to Roessner [34] and other methods, the extraction and derivation of primary metabolites in pears were performed as follows:
(1)
A 100 mg sample frozen in liquid nitrogen was placed in a 2 mL centrifuge tube, and 1.4 mL of methanol (−20 °C precooled, chromatography grade) was added. The sample was ground with a ball mill and then vortexed for 1 min.
(2)
The centrifuge tube was sealed with parafilm and placed in an ultrasonic cleaner at 40 °C for 30 min.
(3)
After the end of the ultrasonication, the liquid and the residue was transferred from the 2 mL centrifuge tube to a 10 mL centrifuge tube, and 1.4 mL of purified water (precooled at 4 °C) was added. The sample was then centrifuged at 8000 rpm/min for 15 min.
(4)
Then, 100 μL of the upper methanol/water mixture supernatant was placed in a glass flask, and the sample was dried with nitrogen and derivatized. First, 60 μL of hydroxylamine hydrochloride solution (hydroxylamine hydrochloride dissolved in pyridine, 20 mg/mL) was added, and then, the sample was sealed with parafilm, vortexed for 30 s, and placed in an oven at 37 °C for 120 min. Subsequently, 60 μL of derivatizing reagent (99% BSTFA + 1%TMCS) was added, and the flask was sealed and incubated at 37 °C for 90 min. After centrifugation at 12,000 rpm for 4 min, the supernatant was taken in the inner cannula, and the sample was tested. All samples were replicated six times. The test conditions were as follows:
Extracts of pear fruits were subjected to metabolic profiling analysis using an Agilent 7890B-5975C GC-MS system. Chromatographic separation was performed with a DB-5 MS fused-silica capillary column (30 m × 0.25 mm × 0.25 μm, Agilent Technologies, Santa Clara, CA, USA). The splitless injection volume was 1 µL. The column temperature was held at 40 °C for 4 min, increased to 190 °C at a rate of 15 °C/min, increased to 200 °C at a rate of 4 °C/min for 3 min, increased to 240 °C at a rate of 10 °C/min for 5 min, and then increased to 280 °C at a rate of 10 °C/min for 10 min. The carrier gas was helium (99.999%, Hefei Junjun Experimental Materials Co., Ltd., Hefei, China), and the flow rate was maintained at a constant linear velocity of 1.0 mL/min. The electron ionization source voltage was 70 eV with an electron impact (EI) ionization mass spectrometric detector (MSD). The ion source temperature was 230 °C, and the interface temperature was 280 °C. Data acquisition started at 5.0 min, with a mass range of 35–780 m/z.

4.4. Extraction and LC-MS Detection of Intermediate Metabolites from Pyrus Lignin

(1)
Extraction of phenolic acid material: 100 mg of the samples was taken and frozen in liquid nitrogen. According to the material liquid volume, 80% ethanol solution was added at a 1:15 ratio, and the sample was ground with a ball mill, ultrasonicated for 40 min at 40 °C, and centrifuged to obtain the supernatant. The process was repeated for each group three times.
(2)
Phenolic alcohol extract and phenolic substances: 100 mg of each sample was frozen in liquid nitrogen. According to the material liquid volume, 90% ethanol solution was added at a 1:15 ratio, and the sample was ground with a ball mill, ultrasonicated for 30 min at 70 °C, and centrifuged to obtain the supernatant. The process was repeated for each group three times.
After combination of the two supernatants, the nitrogen was blown dry, and 100 μL of acetonitrile was added. The sample was centrifuged at 12,000 rpm for 10 min, and the supernatant was removed. UPLC-ESI-MS/MS was used for qualitative and quantitative analysis of the metabolites of lignin synthesis.

4.5. Data Processing and Analysis

To pass the raw GC/MS data through ChemStation (version e. 02.02.1431, Agilent, Santa Clara CA, USA) analysis software, they must be converted into a common format (CDF format) by importing ChromaTOF (version 4.34, LECO, St Joseph, MI, USA) preprocessing software, including extraction, peak to noise, and deconvolution functions. The NIST and Fiehn databases were used for qualitative metabolite analysis and alignment, and finally, the peak data matrix was derived.
LC-MS/MS data were analyzed with Analyst 1.6.2 software (AB Sciex, Framingham, MA, USA) using the default parameters for automatic identification of the various MRM changes and integrals. In addition, an auxiliary artificial check was performed by examining retention times and characteristic ions compared with those of the standards to determine the detected compounds. The linear regression standard curve was plotted with the concentration of the analyte as the vertical coordinate. The mass spectra peak area of each metabolite in the sample was substituted into the linear equation of the standards, and the metabolite content in the samples was obtained.
SIMCA-P (version 14.0, Umetrics, Umea, Sweden) was imported to adopt unsupervised principal component analysis (PCA) of the GC-MS matrix in the numerical test results data and the lignin synthesis intermediate metabolites content to examine differences between the population distribution in the samples and the stability of the whole analysis process. Then, supervised orthogonal partial least squares-discriminant analysis (OPLS-DA) was used to differentiate between the metabolic profile of the general differences between groups and to find the differences between groups of metabolites. The differential metabolites were selected on the basis of the combination of the statistically significant threshold of variable influence on projection (VIP) values obtained from the OPLS-DA model and the p-value from a two-tailed Student’s t-test of the normalized peak area. The VIP value means variables have influence on classification [35]. Through this analysis, whether compounds in different groups significantly contributed (VIP > 1, p < 0.05) was determined [17,36]. We mapped the differential metabolites to the KEGG database (http://www.kegg.jp/kegg/pathway.html), which could be enriched to the KEGG pathway and confirmed the relationship between metabolite-metabolite correlations. SPSS software (IBM, Armonk, New York, USA) was also used for the statistical analyses, including correlations and significance analyses.

Supplementary Materials

Supplementary materials can be found at https://www.mdpi.com/1422-0067/19/8/2273/s1.

Author Contributions

Conceived and designed the experiments: Y.C., Q.J., S.L., Y.L. Performed the experiments: S.L., X.S. Analyzed the data: S.L., Y.S., G.L., X.C. Wrote the manuscript: S.L., X.S., M.A.

Funding

This work was supported by The National Natural Science Foundation of China (grant numbers 31171944, 31640068); The LC-MS/MS detected and analyzed by Shanghai Lu Ming Biological Technology Co. Ltd.

Conflicts of Interest

The authors declare no conflict of interest.

References

  1. Liu, L.; Chen, C.X.; Zhu, Y.F.; Xue, L.; Liu, Q.W.; Qi, K.J.; Zhang, S.L.; Wu, J. Maternal inheritance has impact on organic acid content in progeny of pear (Pyrus spp.) fruit. Euphytica 2016, 209, 305–321. [Google Scholar] [CrossRef]
  2. Cai, Y.; Li, G.; Nie, J.; Lin, Y.; Nie, F.; Zhang, J.; Xu, Y. Study of the structure and biosynthetic pathway of lignin in stone cells of pear. Sci. Hortic. 2010, 125, 374–379. [Google Scholar] [CrossRef]
  3. Rosianski, Y.; Freiman, Z.E.; Cochavi, S.M.; Yablovitza, Z.; Kerem, Z.; Flaishman, M.A. Advanced analysis of developmental and ripening characteristics of pollinated common-type fig (Ficus carica L.). Sci. Hortic. 2016, 198, 98–106. [Google Scholar] [CrossRef]
  4. Cheng, X.; Yan, C.; Zhang, J.; Ma, C.; Li, S.; Jin, Q.; Zhang, N.; Cao, Y.; Lin, Y.; Cai, Y. The Effect of Different Pollination on the Expression of Dangshan Su Pear MicroRNA. BioMed Res. Int. 2017, 2017, 2794040. [Google Scholar] [CrossRef] [PubMed]
  5. Chen, J.; Wang, Z.; Wu, J.; Wang, Q.; Hu, X. Chemical compositional characterization of eight pear cultivars grown in China. Food Chem. 2007, 104, 268–275. [Google Scholar] [CrossRef]
  6. Tzin, V.; Galili, G. New insights into the shikimate and aromatic amino acids biosynthesis pathways in plants. Mol. Plant 2010, 3, 956–972. [Google Scholar] [CrossRef] [PubMed]
  7. Vogt, T. Phenylpropanoid biosynthesis. Mol. Plant 2010, 3, 2–20. [Google Scholar] [CrossRef] [PubMed]
  8. Oikawa, A.; Otsuka, T.; Nakabayashi, R.; Jikumaru, Y.; Isuzugawa, K.; Murayama, H.; Saito, K.; Shiratake, K. Metabolic profiling of developing pear fruits reveals dynamic variation in primary and secondary metabolites, including plant hormones. PLoS ONE 2015, 10, e0131408. [Google Scholar] [CrossRef] [PubMed]
  9. Wilkerson, C.G.; Mansfield, S.D.; Lu, F.; Withers, S.; Park, J.Y.; Karlen, S.D.; Gonzales-Vigil, E.; Padmakshan, D.; Unda, F.; Rencoret, J.; et al. Monolignol ferulate transferase introduces chemically labile linkages into the lignin backbone. Science 2014, 344, 90–93. [Google Scholar] [CrossRef] [PubMed]
  10. Bunzel, M.; Ralph, J. NMR characterization of lignins isolated from fruit and vegetable insoluble dietary fiber. J. Agric. Food Chem. 2006, 54, 8352–8361. [Google Scholar] [CrossRef] [PubMed]
  11. Yan, C.; Yin, M.; Zhang, N.; Jin, Q.; Fang, Z.; Lin, Y.; Cai, Y. Stone cell distribution and lignin structure in various pear varieties. Sci. Hortic. 2014, 174, 142–150. [Google Scholar] [CrossRef]
  12. Jin, Q.; Yan, C.C.; Qiu, J.; Zhang, N.; Lin, Y.; Cai, Y.P. Structural characterization and deposition of stone cell lignin in Dangshan Su pear. Sci. Hortic. 2013, 155, 123–130. [Google Scholar] [CrossRef]
  13. Li, S.M.; Su, X.Q.; Jin, Q.; Li, G.H.; Sun, Y.M.; Abdullah, M.; Cai, Y.P.; Lin, Y. iTRAQ-Based Identification of Proteins Related to Lignin Synthesis in the Pear Pollinated with Pollen from Different Varieties. Molecules 2018, 23, 548. [Google Scholar] [CrossRef] [PubMed]
  14. Ebrahimi, F.; Ibrahim, B.; Teh, C.H.; Murugaiyah, V.; Chan, K.L. NMR-based plasma metabolomic discrimination for male fertility assessment of rats treated with Eurycoma longifolia extracts. Syst. Biol. Reprod. Med. 2017, 63, 179–191. [Google Scholar] [CrossRef] [PubMed]
  15. Lima, R.B.; Salvador, V.H.; Santos, W.D.D.; Bubna, G.A.; Finger-Teixeira, A.; Soares, A.R.; Marchiosi, R.; Mde, L.F.; Ferrarese-Filho, O. Enhanced Lignin Monomer Production Caused by Cinnamic Acid and Its Hydroxylated Derivatives Inhibits Soybean Root Growth. PLoS ONE 2013, 8, e80542. [Google Scholar] [CrossRef] [PubMed]
  16. Shivashankar, S.; Sumathi, M.; Krishnakumar, N.K.; Rao, V.K. Role of phenolic acids and enzymes of phenylpropanoid pathway in resistance of chayote fruit (Sechium edule) against infestation by melon fly, Bactrocera cucurbitae. Ann. Appl. Biol. 2015, 166, 420–433. [Google Scholar] [CrossRef]
  17. Zheng, K.; Shen, N.; Chen, H.; Ni, S.; Zhang, T.; Hu, M.; Wang, J.; Sun, L.; Yang, X. Global and targeted metabolomics of synovial fluid discovers special osteoarthritis metabolites. J. Orthop. Res. 2017, 35, 1973–1981. [Google Scholar] [CrossRef] [PubMed]
  18. Song, H.; Peng, J.S.; Yao, D.S.; Yang, Z.L.; Liu, H.L.; Zeng, Y.K.; Shi, X.P.; Lu, B.Y. Serum metabolic profiling of human gastric cancer based on gas chromatography/mass spectrometry. Braz. J. Med. Biol. Res. 2012, 45, 78–85. [Google Scholar] [CrossRef] [PubMed] [Green Version]
  19. Shang, X.; Zhong, X.; Tian, X. Metabolomics of papillary thyroid carcinoma tissues: Potential biomarkers for diagnosis and promising targets for therapy. Tumor Biol. 2016, 37, 11163–11175. [Google Scholar] [CrossRef] [PubMed]
  20. Cumming, G.; Fidler, F.; Vaux, D.L. Error bars in experimental biology. J. Cell Biol. 2007, 177, 7–11. [Google Scholar] [CrossRef] [PubMed] [Green Version]
  21. Fernie, A.R.; Schauer, N. Metabolomics-assisted breeding: A viable option for crop improvement? Trends Genet. 2009, 25, 39–48. [Google Scholar] [CrossRef] [PubMed]
  22. De Souza, L.P.; Naake, T.; Tohge, T.; Fernie, A.R. From chromatogram to analyte to metabolite. How to pick horses for courses from the massive web-resources for mass spectral plant metabolomics. Gigascience 2017, 6, 1–20. [Google Scholar] [CrossRef] [PubMed]
  23. Rist, M.J.; Roth, A.; Frommherz, L.; Weinert, C.H.; Krüger, R.; Merz, B.; Bunzel, D.; Mack, C.; Egert, B.; Bub, A.; et al. Metabolite patterns predicting sex and age in participants of the Karlsruhe Metabolomics and Nutrition (KarMeN) study. PLoS ONE 2017, 12, e0183228. [Google Scholar] [CrossRef] [PubMed]
  24. Georgita, C.; Sora, I.; Albu, F.; Monciu, C.M. Comparison of a LC/MS method with a LC/UV method for the determination of metformin in plasma samples. Farmacia 2010, 58, 158–169. [Google Scholar]
  25. Shehab, M.A.; Biggar, K.; Singal, S.S.; Nygard, K.; Shun-Cheng, L.S.; Jansson, T.; Gupta, M.B. Exposure of decidualized HIESC to low oxygen tension and leucine deprivation results in increased IGFBP-1 phosphorylation and reduced IGF-I bioactivity. Mol. Cell. Endocrinol. 2017, 452, 1–14. [Google Scholar] [CrossRef] [PubMed] [Green Version]
  26. Anderson, N.A.; Tobimatsu, Y.; Ciesielski, P.N.; Ximenes, E.; Ralph, J.; Donohoe, B.S.; Ladisch, M.; Chapple, C. Manipulation of guaiacyl and syringyl monomer biosynthesis in an Arabidopsis cinnamyl alcohol dehydrogenase mutant results in atypical lignin biosynthesis and modified cell wall structure. Plant Cell 2015, 27, 2195–2209. [Google Scholar] [CrossRef] [PubMed]
  27. Zanardo, D.I.L.; Lima, R.B.; Ferrarese, M.L.L.; Bubna, G.A.; Ferrarese-Filho, O. Soybean root growth inhibition and lignification induced by p-coumaric acid. Environ. Exp. Bot. 2009, 66, 25–30. [Google Scholar] [CrossRef]
  28. Bunsiri, A.; Ketsa, S.; Paull, R.E. Phenolic metabolism and lignin synthesis in damaged pericarp of mangosteen fruit after impact. Postharvest Biol. Technol. 2003, 29, 61–71. [Google Scholar] [CrossRef]
  29. Tao, S.T.; Khanizadeh, S.; Zhang, H.; Zhang, S.L. Anatomy, ultrastructure and lignin distribution of stone cells in two Pyrus species. Plant Sci. 2009, 176, 413–419. [Google Scholar] [CrossRef]
  30. Brahim, S.B.; Kelebek, H.; Ammar, S.; Abichou, M.; Bouaziz, M. LC-MS phenolic profiling combined with multivariate analysis as an approach for the characterization of extra virgin olive oils of four rare Tunisian cultivars during ripening. Food Chem. 2017, 229, 9–19. [Google Scholar] [CrossRef] [PubMed]
  31. Faccin, H.; Loose, R.F.; Viana, C.; de Carvalho, L.M. Determination of phenolic compounds in extracts of Amazonian medicinal plants by liquid chromatography-electrospray tandem mass spectrometry. Anal. Methods 2017, 9, 1141–1151. [Google Scholar] [CrossRef]
  32. Gajbhiye, N.A.; Makasana, J.; Saha, A.; Jat, R.S. LC-ESI-MS/MS Method for Simultaneous Determination of Triterpenoid Glycosides and Aglycones in Centella asiatica L. Chromatographia 2016, 79, 727–739. [Google Scholar] [CrossRef]
  33. Rehman, S.U.; Choi, M.S.; Kim, I.S.; Kim, S.H.; Yoo, H.H. An ultra-high-performance liquid chromatography-tandem mass spectrometric method for the determination of hederacoside C, a drug candidate for respiratory disorder, in rat plasma. J. Pharm. Biomed. Anal. 2016, 129, 90–95. [Google Scholar] [CrossRef] [PubMed]
  34. Roessner, U.; Wagner, C.; Kopka, J.; Trethewey, R.N.; Willmitzer, L. Simultaneous analysis of metabolites in potato tuber by gas chromatography–mass spectrometry. Plant J. 2000, 23, 131–142. [Google Scholar] [CrossRef] [PubMed]
  35. Jiao, C.Y.; Song, C.; Zheng, S.Y.; Zhu, Y.P.; Jin, Q.; Cai, Y.P.; Lin, Y. Metabolic Profiling of Dendrobium officinale in Response to Precursors and Methyl Jasmonate. Int. J. Mol. Sci. 2018, 19, 728. [Google Scholar] [CrossRef] [PubMed]
  36. De la Barca, J.M.C.; Huang, N.T.; Jiao, H.; Tessier, L.; Gadras, C.; Simard, G.; Natoli, R.; Tcherkez, G.; Reynier, P.; Valter, K. Retinal metabolic events in preconditioning light stress as revealed by wide-spectrum targeted metabolomics. Metabolomics 2017, 13, 22. [Google Scholar] [CrossRef] [PubMed]
Figure 1. Overlays of total ion chromatograms (TICs) from GC-MS analysis of metabolites in pear fruit.
Ijms 19 02273 g001
Figure 2. Principle component analysis (PCA) of the primary metabolites derived from GC-MS data.
Ijms 19 02273 g002
Figure 3. Orthogonal partial least squares-discriminant analysis (OPLS-DA) of metabolites derived from GC-MS. (A): 47 days after pollination (DAPs); (B): 63 DAPs.
Ijms 19 02273 g003
Figure 4. Changes in metabolites in DW and DJ shown in a metabolic diagram. (A) The changes at 47 DAPs; (B) The changes at 63 DAPs. The metabolites with red characters were detectable and exhibited higher content in DW than in DJ. The metabolites with labelled in green were detectable but with lower content in DW than in DJ. The metabolites with black characters were detectable. The metabolites with grey characters were undetectable. G1P, glucose-1-phosphate; G6P, glucose-6-phosphate; F6P, fructose-6-phosphate; F1,6P, fructose-1,6-diphosphate; 3-PGA, 3-phosphoglyceraldehyde; 2-PGA, 2-phosphoglyceraldehyde; PEP, phosphoenolpyruvate; Gly, glycine; Cys, cysteine; Ser, serine; Trp, tryptophan; Phe, phenylalanine; Tyr, tyrosine; Ile, isoleucine; Thr, threonine; Met, methionine; Asp, aspartate; Lys, lysine; Ala, alanine; Val, valine; Leu, leucine; Glu, glutamate; Pro, proline; Arg, arginine.
Ijms 19 02273 g004
Figure 5. Principle component analysis (PCA) of the lignin metabolites derived from LC-MS.
Ijms 19 02273 g005
Figure 6. The lignin synthesis metabolite content in DW and DJ. Note: * represents a significant difference at the 0.05 leve (two-tailed Student’s t-test); ** represents a significant difference at the 0.01 leve (two-tailed Student’s t-test). The error bars represent standard deviations [20].
Ijms 19 02273 g006
Figure 7. Orthogonal partial least squares-discriminant analysis (OPLS-DA) of lignin metabolites derived from LC-MS. (A): 47 DAPs; (B): 63 DAPs.
Ijms 19 02273 g007
Figure 8. Heat map representing the correlations of lignin intermediate metabolites in pear fruit. (A): 47 DAPs; (B): 63 DAPs.
Ijms 19 02273 g008
Figure 9. Correlation network of significantly related lignin synthesis intermediate metabolites in pear fruit. (A): 47 DAPs; (B): 63 DAPs. Node colors represent different types of metabolites.
Ijms 19 02273 g009
Table 1. Differential metabolites at 47 DAPs in Wonhwang’ (DW) and ‘Jingbaili’ (DJ).
MetaboliteVIPp-ValueFold Change
3-hydroxypyruvate1.9592.760 × 10−19+
l-kynurenine1.9584.438 × 10−16+
S-carboxymethylcysteine1.8752.322 × 10−63.374
aspartic acid1.8494.036 × 10−60.385
Cumic Acid1.8399.472 × 10−63.197
valine1.8351.009 × 10−50.394
Cysteinylglycine1.8322.973 × 10−53.979
5,6-dihydrouracil1.8242.572 × 10−52.963
proline1.8122.147 × 10−50.359
adenosine1.7932.837 × 10−50.513
oxoproline1.7865.476 × 10−50.469
malonic acid1.7782.021 × 10−47.683
glycine1.7763.924 × 10−50.536
Maleamate1.7691.128 × 10−41.633
stearic acid1.7332.268 × 10−41.890
catechol1.7301.458 × 10−40.466
Adipamide1.7061.866 × 10−40.302
palmitic acid1.7044.068 × 10−41.719
maltotriose1.7032.545 × 10−40.573
Linoleic acid methyl ester1.6871.359 × 10−32.320
linolenic acid1.6829.211 × 10−41.930
MALONAMIDE1.6499.539 × 10−41.735
linoleic acid1.6392.797 × 10−31.646
creatine degr1.6201.159 × 10−31.702
Elaidic acid1.5634.451 × 10−31.568
sorbitol1.5592.184 × 10−31.583
glucose-6-phosphate1.5573.682 × 10−31.850
Methyl Palmitoleate1.4830.0131,989
Monostearin1.4577.202 × 10−31.391
d-(glycerol 1-phosphate)1.4525.2941 × 10−30.687
caffeic acid1.4447.203 × 10−33.383
Phenylphosphoric acid1.4357.398 × 10−31.995
Maleimide1.4290.0151.519
1-Monopalmitin1.4169.943 × 10−31.410
thymine1.4130.01324.224
hexadecane1.4080.010+
2-amino-2-methylpropane-1,3-diol1.3780.010+
Nicotinoylglycine1.3700.011+
Dioctyl phthalate1.3580.0190.552
lysine1.3510.017+
3-Hydroxyanthranilic acid1.3470.0260.584
shikimic acid1.3300.0161.446
arbutin1.3030.0191.705
asparagine1.2910.019+
maltitol1.2800.0240.661
Glucose-1-phosphate1.2690.0280.599
N-epsilon-Acetyl-l-lysine1.2340.0380.682
Synephrine1.2060.0340.674
3-Methyloxindole1.1990.0452.544
Alizarin1.1980.0410.370
Mono(2-ethylhexyl) phthalate1.1840.050+
Note: The fold change = peak area of metabolites in ‘Dangshan Su’ fruit pollinated by ‘Wonhwang’ (DW)/peak area of metabolites in ‘Dangshan Su’ fruit pollinated by ‘Jingbaili’ (DJ); + indicates that the metabolite was only detected in DW.
Table 2. Differential metabolites at 63 DAPs in DW and DJ.
MetaboliteVIPp-ValueFold Change
Leucrose1.9185.181 × 10−14-
Valine1.9072.145 × 10−105.355
Myo-inositol1.7664.069 × 10−50.682
Palatinitol1.7511.052 × 10−40.628
Sorbitol1.7201.402 × 10−42.293
Cellobiotol1.7022.840 × 10−40.622
Mannitol1.6517.616 × 10−40.478
Maltotriose1.6501.137 × 10−30.647
1-Methyladenosine1.6494.547 × 10−4-
Lysine1.6465.772 × 10−4-
Aspartic acid1.6435.372 × 10−40.557
2-Amino-2-methylpropane-1,3-diol1.6266.194 × 10−4-
Elaidic acid1.6261.583 × 10−30.677
Glycine1.6251.313 × 10−31.396
Linoleic acid1.5584.088 × 10−30.629
Oxoproline1.5492.818 × 10−30.690
Galactinol1.5400.590 × 10−30.579
Sitosterol1.5106.632 × 10−30.702
N-epsilon-Acetyl-l-lysine1.4798.339 × 10−30.808
β-Mannosylglycerate1.4536.939 × 10−30.649
Ribitol1.4490.0150.669
Adipamide1.4356.447 × 10−31.396
Fructose1.4230.0100.615
Proline1.4110.0170.472
Vanillylmandelic acid1.3860.0190.715
Heptadecanoic acid1.3800.0190.780
Gallic acid1.3790.0240.605
Citramalic acid1.3460.016+
3-Methyloxindole1.2880.0250.727
d-Glyceric acid1.2720.0451.384
3-Hydroxypropionic acid1.2110.0430.566
Hydantoin, 5-(4-hydroxybutyl)-1.1940.049-
Sorbose1.1960.050-
2-Indanone1.1770.050-
Note: The fold change = peak area of metabolites in DW/peak area of metabolites in DJ; + indicates that the metabolite was only detected in DW, and - indicates that the metabolite was only detected in DJ. Through Kyoto Encyclopedia of Genes and Genomes (KEGG) pathway analysis of differential metabolites between DW and DJ at 47 DAPs and 63 DAPs, 36 and 27 KEGG pathways were found to be enriched, respectively. Moreover, 31 KEGG pathways were significantly enriched (p < 0.05, FDR < 0.01) at 47 DAPs (Table 3), and they were mainly related to fatty acid metabolism, amino acid metabolism, and sugar metabolism. At 63 DAPs, the enrichment of the KEGG pathways was not significant.
Table 3. Significantly enriched KEGG pathways associated with differential metabolites.
KEGG Pathwayp-ValueFDR
Glycerophospholipid metabolism5.330 × 10−89.592 × 10⁻⁷
Glycerolipid metabolism5.330 × 10−89.592 × 10⁻⁷
α-Linolenic acid metabolism2.098 × 10−72.518 × 10⁻⁶
Glutathione metabolism6.650 × 10−72.946 × 10⁻⁶
Biosynthesis of unsaturated fatty acids8.173 × 10−72.946 × 10⁻⁶
Pyrimidine metabolism8.620 × 10−72.946 × 10⁻⁶
Pantothenate and CoA biosynthesis8.805 × 10−72.946 × 10⁻⁶
Fatty acid biosynthesis1.010 × 10−62.946 × 10⁻⁶
Fatty acid elongation in mitochondria1.080 × 10−62.946 × 10⁻⁶
Fatty acid metabolism1.080 × 10−62.946 × 10⁻⁶
β-Alanine metabolism1.124 × 10−62.946 × 10⁻⁶
Phenylalanine, tyrosine and tryptophan biosynthesis1.130 × 10−62.946 × 10⁻⁶
Fructose and mannose metabolism1.191 × 10−62.946 × 10⁻⁶
Valine, leucine and isoleucine biosynthesis1.309 × 10−62.946 × 10⁻⁶
Valine, leucine and isoleucine degradation1.309 × 10−62.946 × 10⁻⁶
Glucosinolate biosynthesis1.309 × 10−62.946 × 10⁻⁶
Arginine and proline metabolism1.802 × 10−63.280 × 10⁻⁶
Cysteine and methionine metabolism1.823 × 10−63.280 × 10⁻⁶
Carbon fixation in photosynthetic organisms1.823 × 10−63.280 × 10⁻⁶
Nicotinate and nicotinamide metabolism1.823 × 10−63.280 × 10⁻⁶
Cyanoamino acid metabolism1.968 × 10−63.374 × 10⁻⁶
Galactose metabolism2.552 × 10−64.18 × 10⁻⁶
Tryptophan metabolism4.674 × 10−67.32 × 10⁻⁶
Methane metabolism7.196 × 10−61.04 × 10⁻⁵
Nitrogen metabolism7.196 × 10−61.04 × 10⁻⁵
Glycine, serine and threonine metabolism2.417 × 10−53.35 × 10⁻⁵
Starch and sucrose metabolism1.051 × 10−41.261 × 10⁻⁴
Amino sugar and nucleotide sugar metabolism1.051 × 10−41.261 × 10⁻⁴
Glycolysis or Gluconeogenesis1.051 × 10−41.261 × 10⁻⁴
Pentose and glucuronate interconversions1.051 × 10−41.261 × 10⁻⁴
Lysine biosynthesis6.498 × 10−37.546 × 10⁻³
Table 4. The differential intermediate metabolites in lignin synthesis.
Metabolite47 DAPs63 DAPs
VIPp-ValueVIPp-Value
p-coumaric acid1.083250.00018 **1.906390.01701 *
Caffeic acid0.7763440.114830.4836290.66653
Ferulic acid1.0630.00129 **0.1829740.87196
Coniferaldehyde0.8392680.075560.7667780.48518
Sinapaldehyde1.077330.00040 **0.4442750.69285
Coniferyl alcohol1.048660.00268 **1.505850.11830
Sinapyl alcohol1.062640.00132 **0.2130070.85107
Paired t-test (Paired t-test); ** indicates significant difference at the 0.01 level; * indicates significant difference at the 0.05 level.
Table 5. MRM detection parameters for intermediate metabolites of lignin synthesis.
MetaboliteIon ModePrecursor Ion (m/z)Product Ion (m/z)DPCE
Cinnamic acid-146.9103.0−30−13
p-coumaric acid-162.8119.0−30−15.5
Caffeic acid-179.0135.0−30−20
Ferulic acid-193.0134.0−30−20
149.1−30−13
116.9−30−20
Sinapic acid-223.0148.9−30−17
164.0−30−18
Coniferaldehyde-177.0162.0−30−17
134.0−30−28
Sinapaldehyde-207.0192.0−24−17
176.8−30−27
149.2−30−35
Coniferyl alcohol-179.1146.0−30−19
164.0−30−18
161−30−13
Sinapyl alcohol-209.0194.0−30−17
179.0−40−24
176.1−40−18
Table 6. Standard information and standard curves for intermediate metabolites of lignin synthesis.
MetaboliteChemical FormulaFormula WeightStandard CurveCorrelation CoefficientRetention Time (min)
Cinnamic acidC9H8O2148.161Y = 1.12 × 10³X + 4.35 × 10⁴R2 = 1.000011.8
p-coumaric acidC9H8O3164.160Y = 2.36 × 10⁴X + 2.29 × 10⁵R2 = 0.999410.4
Caffeic acidC9H8O4180.159Y = 4.57 × 10⁴X − 1.33 × 10⁵R2 = 0.99959.9
Ferulic acidC10H10O4194.186Y = 8.38 × 10³X + 6.2 × 10³R2 = 0.999910.5
Sinapic acidC11H12O5224.212Y = 455X − 603R2 = 0.999210.3
ConiferaldehydeC10H10O3178.187Y = 2.38 × 10⁴X + 6.08 × 10⁴R2 = 0.999811.0
SinapaldehydeC11H12O4208.213Y = 1.22 × 10⁴X − 2.55 × 10⁴R2 = 0.999910.9
Coniferyl alcoholC10H12O3180.203Y = 98.4X − 519R2 = 0.999810.3
Sinapyl alcoholC11H14O4210.229Y = 150X − 776R2 = 0.999810.1

