Article

Fish Oil Ameliorates High-Fat Diet Induced Male Mouse Reproductive Dysfunction via Modifying the Rhythmic Expression of Testosterone Synthesis Related Genes

School of Biology and Pharmaceutical Engineering, Wuhan Polytechnic University, Wuhan 30023, China
*
Author to whom correspondence should be addressed.
These authors contributed equally to this work.
Int. J. Mol. Sci. 2018, 19(5), 1325; https://doi.org/10.3390/ijms19051325
Submission received: 4 April 2018 / Revised: 23 April 2018 / Accepted: 28 April 2018 / Published: 29 April 2018
(This article belongs to the Section Bioactives and Nutraceuticals)

Abstract

:
The present study aims to investigate the protective effects of ω-3 polyunsaturated fatty acids (ω-3PUFAs) against high-fat diet induced male mouse reproductive dysfunction and to explore circadian regulation mechanisms. Male C57BL/6 mice were randomly divided into three groups and fed a normal chow diet (control group, CON), a high-fat diet (HFD group) or a HFD supplemented with fish oil (FO group) for 12 weeks. After 12 weeks of feeding, the body weight and the ratio of perinephric and epididymal fat weight to body weight were significantly higher in the HFD group compared with the CON group. The supplement of fish oil rich in ω-3PUFAs only slightly reduced the HFD-induced obesity but remarkably ameliorated HFD-induced dyslipidemia, sexual hormones disorder, testicle lesions and germ cell apoptosis. Fish oil supplementation restored the expression of steroid synthesis associated genes in HFD fed mouse and flattened the HFD-induced oscillations in circadian genes’ expression. Fish oil supplementation prevented HFD-induced male mouse reproductive dysfunction and modified the rhythmic expression of testosterone synthesis related genes.

1. Introduction

Lipid metabolism is closely associated with reproduction. Epidemiological data have revealed that chronic high fat intake is accompanied by a rise of the incidence of metabolic diseases, such as obesity and non-alcoholic fatty liver disease, as well as the morbidity of reproductive dysfunction [1]. The relationship between high fat diet induced metabolic disorder and reproduction has attracted much attention. A number of studies have pointed out that a high-fat diet induces lipid metabolic disorder and leads to a loss of male reproductive function, such as low serum testosterone level, sexual hormones metabolic chaos, reproductive cell apoptosis and poor sperm quality [2,3,4,5,6]. On the other hand, a decreased serum testosterone level aggravates the metabolic syndrome then leads to a vicious loop [7]. Testosterone, the primary androgen synthesized in Leydig cells, plays key roles in the development of male reproductive tissues and spermatogenesis. Several proteins take part in testosterone synthesis; steroidogenic acute regulatory protein (STAR) is in charge of transporting cholesterol to the inner mitochondria membrane and cholesterol side-chain cleavage enzyme (P450scc) is the key rate-limited enzyme in testosterone synthesis, catalyzes the oxidative cleavage of the side-chain of cholesterol to form pregnenolone [8,9,10]. Then pregnenolone was transported to smooth endoplasmic reticulum by 3β-hydroxysteroid dehydrogenase (3β-Hsd) and reduced by 17β-hydroxysteroid dehydrogenase (17β-Hsd) to yield testosterone [10,11]. Some studies have illustrated that high-fat intake and obesity down-regulated the expression of Star and P450scc, leading to reproductive dysfunction [4]. ω-3 Polyunsaturated fatty acids (ω-3PUFAs) have been found to have the capability to regulate the expression of Star and P450scc and to improve testosterone synthesis, thereby modifying reproduction [12]. Our previous studies have demonstrated that fish oil rich in ω-3PUFAs can modify cholesterol metabolism and peripheral circadian rhythms [13].
Most mammalian activities, including the sleep–wake cycle, hormone secretion, energy metabolism and immune response, present typical circadian rhythms and are regulated by the body’s internal clock [14,15]. The physiological clock consists of the master clock located in the suprachiasmatic nucleus (SCN) and the sub-clock in the peripheral tissues. Light stimulates the retina and transmits the signal to the SCN to integrate and then deliver to the peripheral clock by the neuroendocrine and autonomic nervous systems [16]. At the molecular level, the core clock genes, including Bmal1, Clock, Per1/2, Cry1/2, Rev-erbα, Pparα, Sirt1 and Rorα, construct a transcriptional/translational feedback loop to control the circadian clock [17]. The rhythmic expression of clock genes is controlled by light and physiological activities such as food intake and they regulate energy metabolism in a nuclear receptors dependent way [18].
The quantity and components of daily food play crucial roles in reproductive rhythms [19]. In normal male rats, mice and humans, testosterone secretions present a circadian rhythm [20,21,22] and a high-fat diet reduces the serum testosterone level and disturbs the 24 h cycle [23]. Meanwhile, a high-fat diet changes the normal peripheral rhythms and exacerbates metabolic disorder [24,25,26,27,28]. In our previous study, we pointed out that fish oil supplementation remarkably improved lipid metabolism and rescued the expression of hepatic clock genes in high-fat diet fed animals [13]. However, whether fish oil can ameliorate high-fat diet-induced male mouse testicle dysfunction and circadian rhythmic chaos remains unclear.
In the current study, we aimed to investigate whether fish oil ameliorates high-fat-diet-induced male sexual hormones metabolic chaos and reproductive disorder in a rhythm-dependent way and to explore the effects of fish oil on the circadian expression of genes involved in testosterone synthesis and testicle function in high-fat diet fed male mice.

2. Results

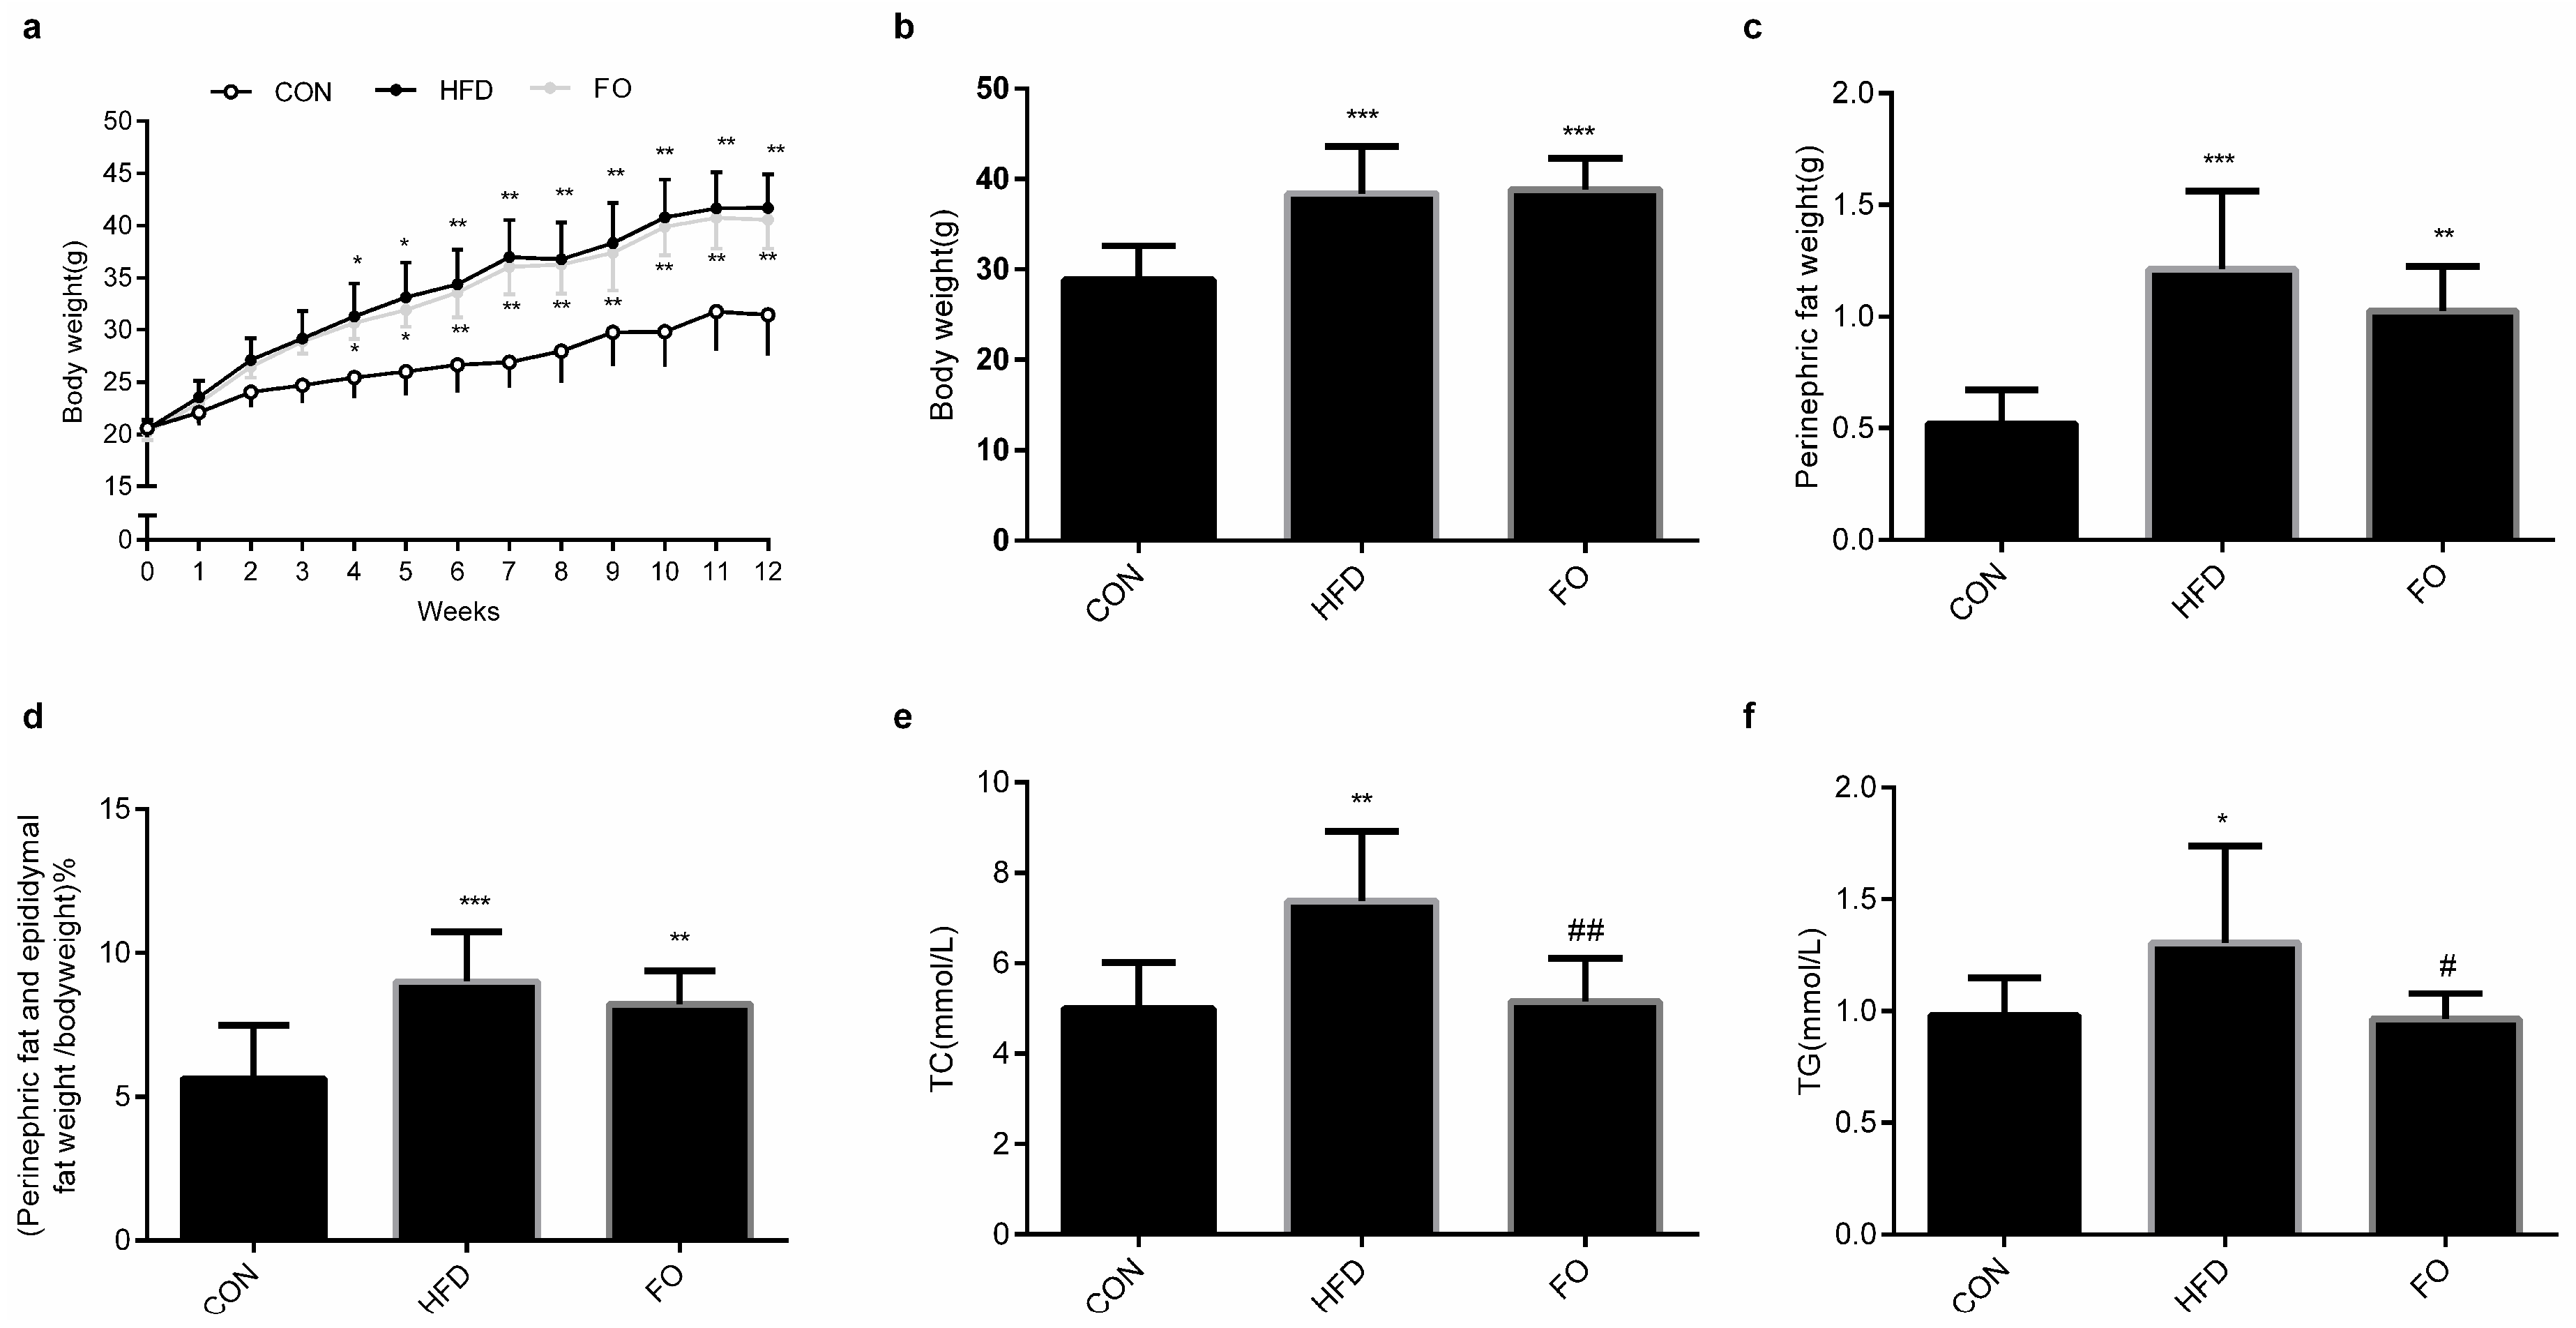
2.1. Effect of High-Fat Diet (HFD) and Fish Oil Diet (FO) on the Body Weight, Perinephric Fat and Epididymal Fat Weight and the Plasma Total Cholesterol (TC), Triglyceride (TG) Levels

After only 4 weeks’ feeding, the body weight of mice in both the high-fat diet (HFD) and fish oil (FO) groups increased significantly compared with the control diet (CON) group (Figure 1a). After 12 weeks’ feeding, the body weight, perinephric fat weight and perinephric and epididymal fat weight/body weight ratios in the HFD and FO groups were significantly higher than those in the CON group (Figure 1b–d). HFD feeding elevated plasma total cholesterol (TC) and the triacylglycerol (TG) level significantly compared with the CON group. Compared with the HFD group, plasma TC and TG concentrations in the FO group decreased significantly (Figure 1e,f).

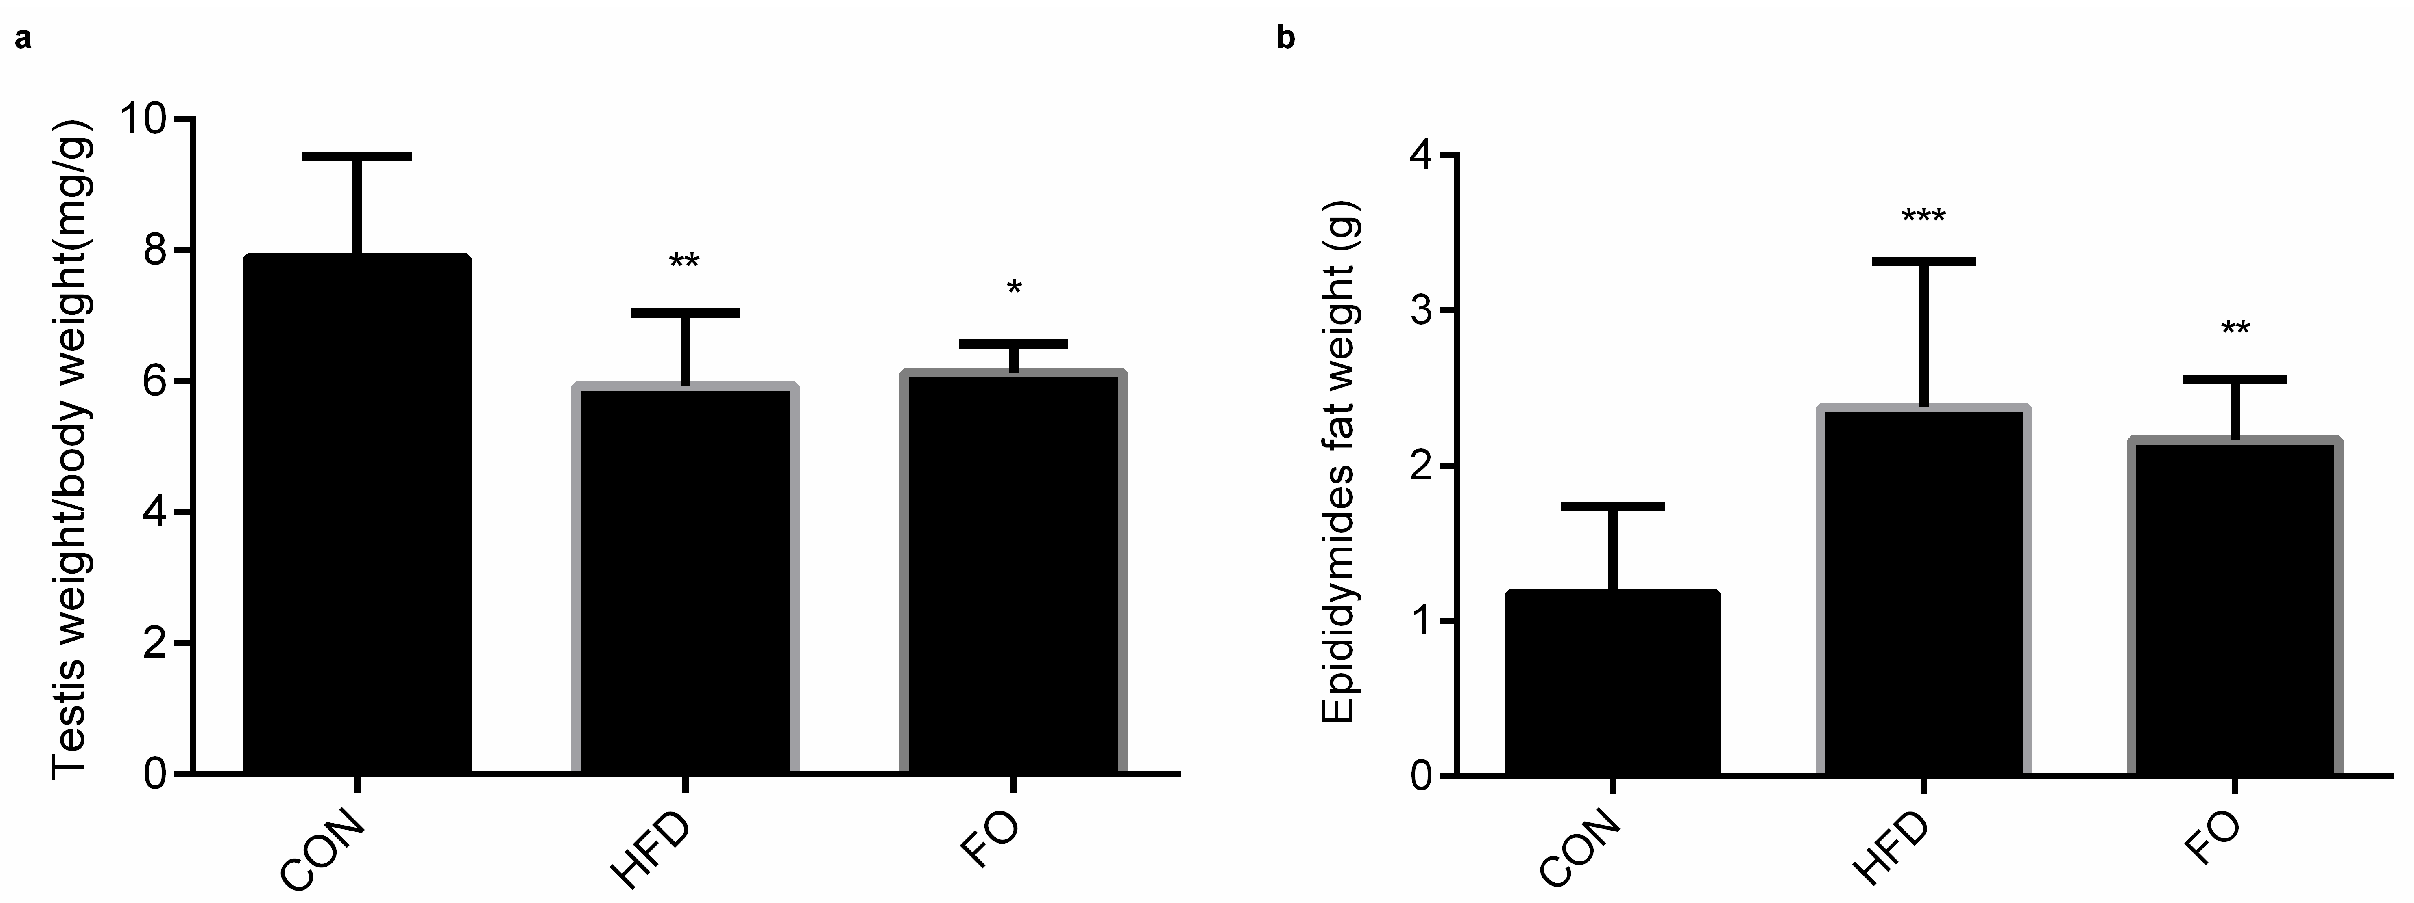
2.2. Effect of HFD and FO on Male Reproductive Organ

The ratio of testes weight/body weight decreased in the HFD and FO groups compared with the CON group (Figure 2a). The epididymal fat weight in the HFD and FO groups were significantly higher than that in the CON group (Figure 2b).

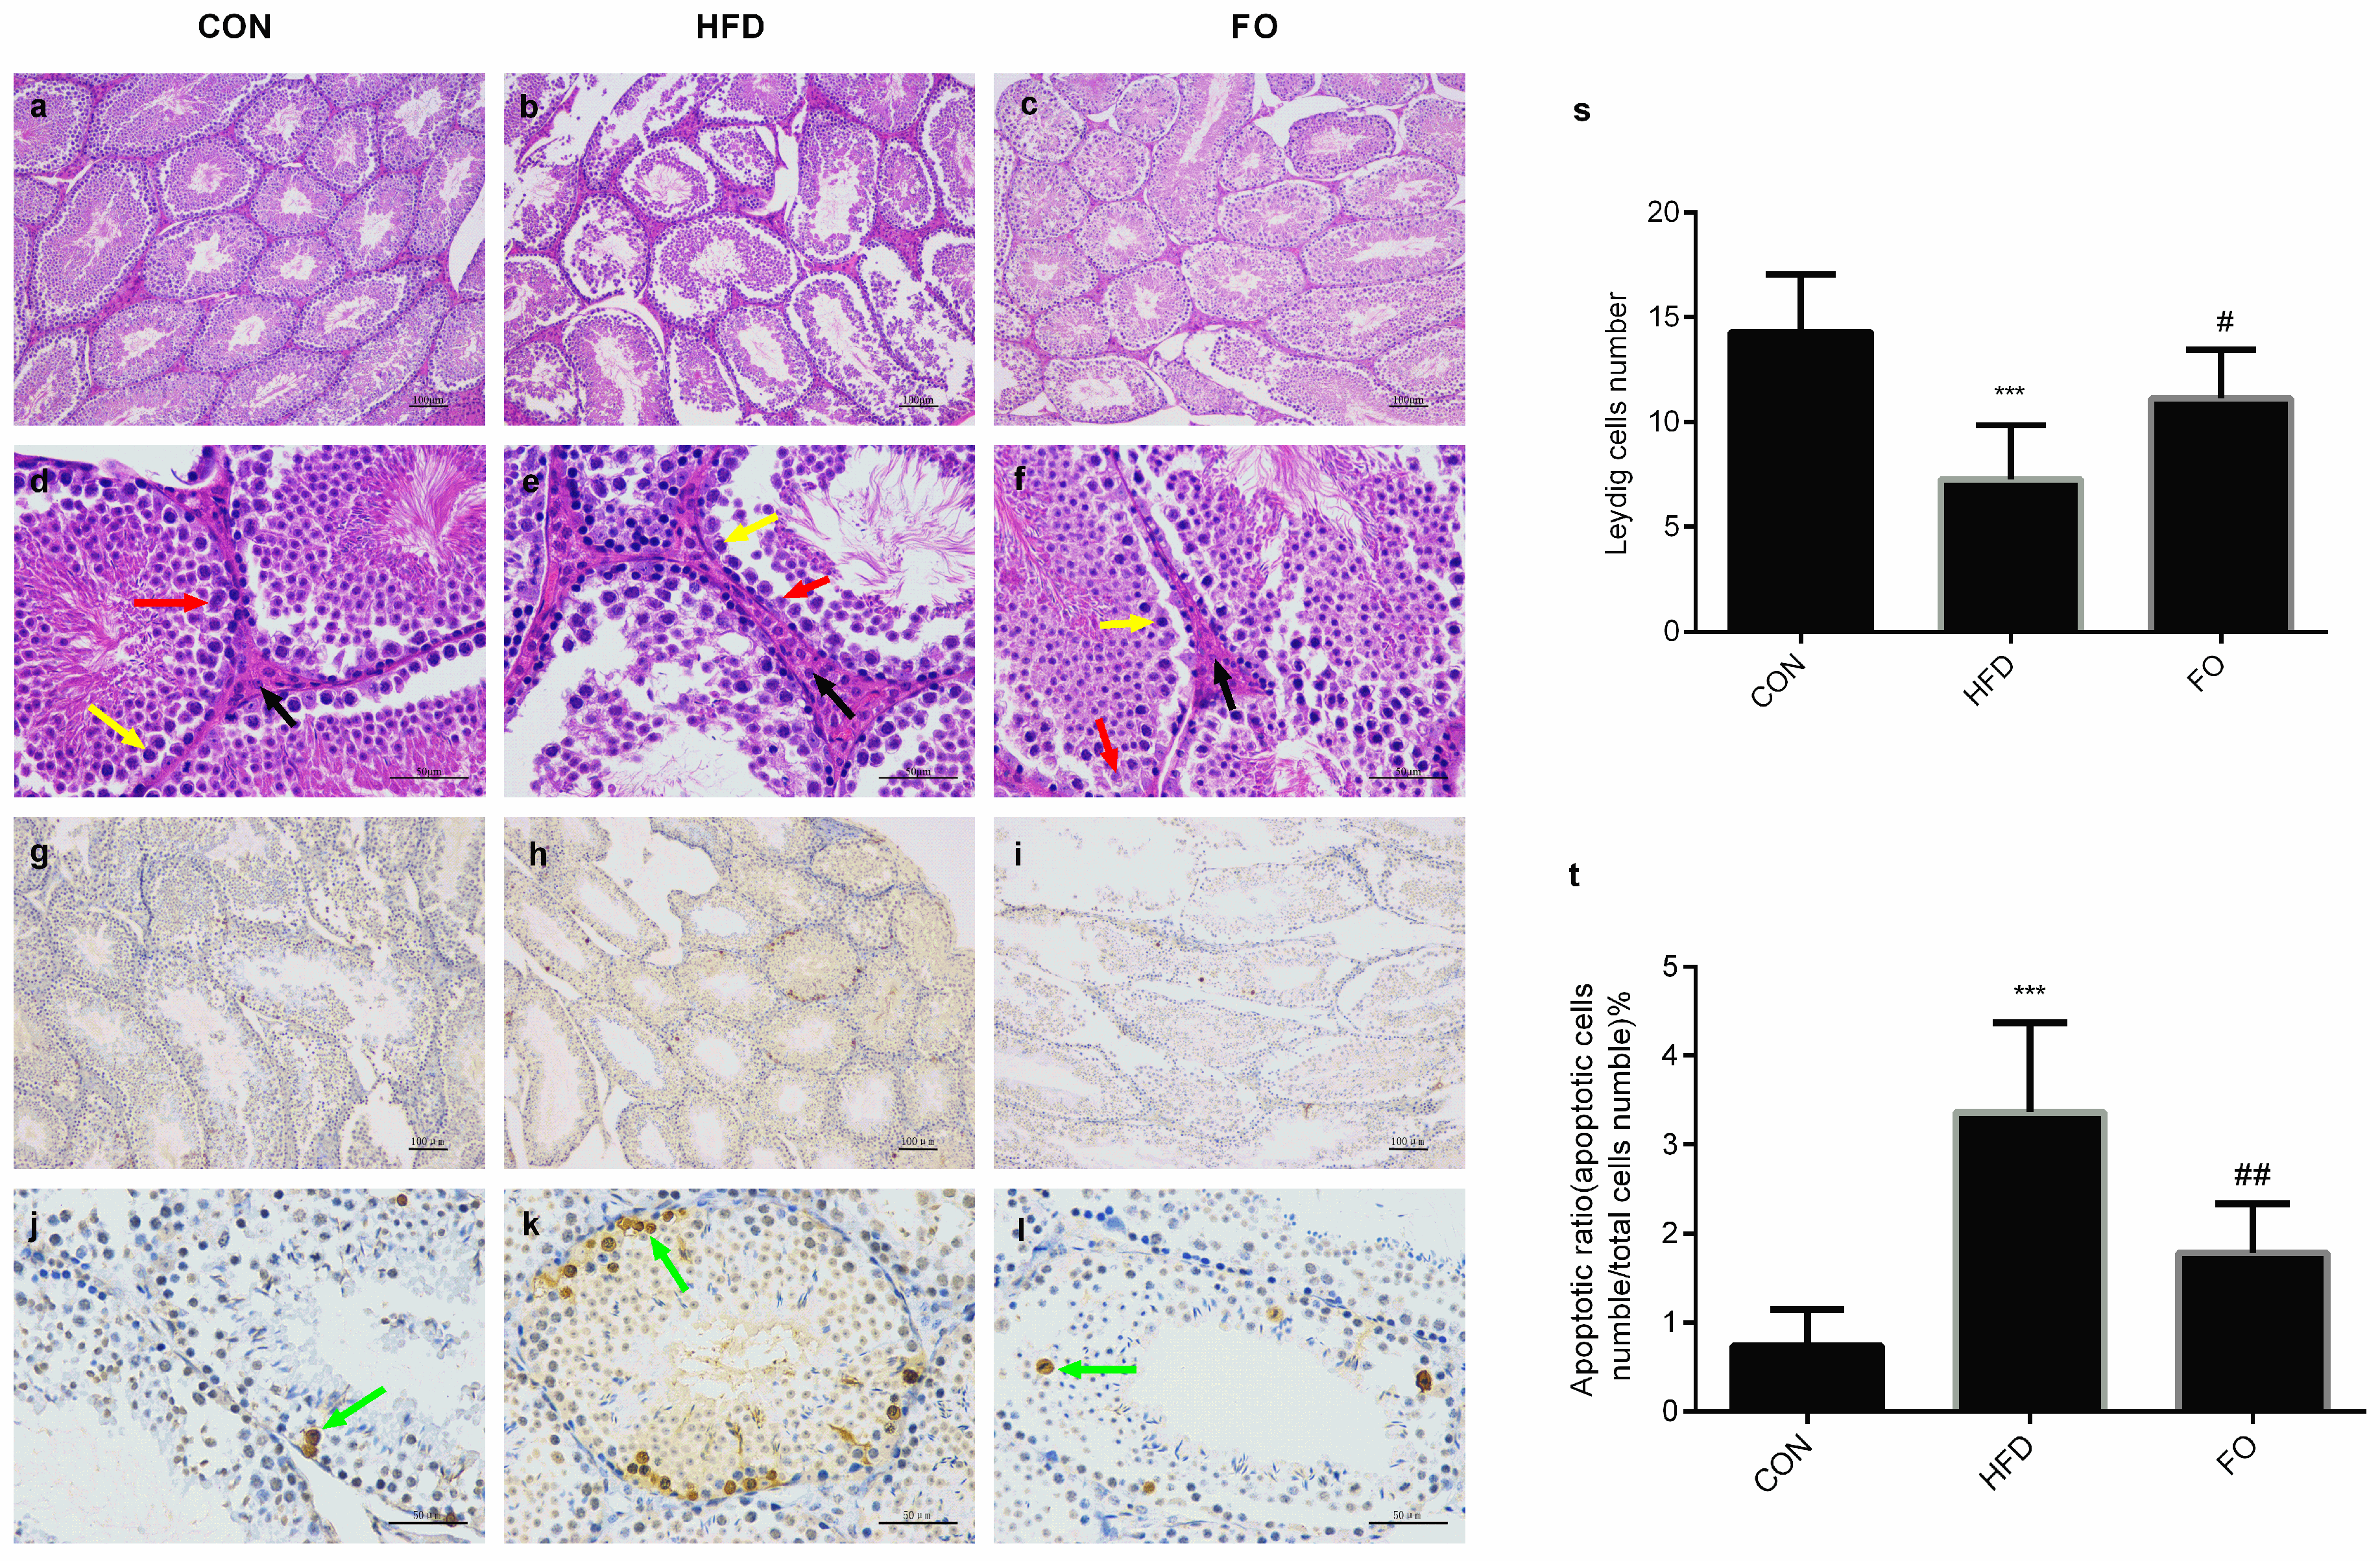
2.3. Effect of HFD and FO on Histological Study and Testicular Cell Apoptosis

Histological staining of testicular structure illustrated that, compared with the control group, HFD feeding induced obvious pathological changes in testicular tissue: the bore size of seminiferous tubules increased markedly, the arrangement of spermatogenic cells were disturbed and fewer sperm were observed (Figure 3b–e). These histological changes were improved following supplementation with fish oil (Figure 3c–f). In each field of measurement, the average number of Leydig cells was evaluated adjacent to the seminiferous tubules. As shown in Figure 3s, the average number of Leydig cells was reduced in the HFD group (p < 0.001) and which was restored in the FO group. The apoptosis index was found to be higher in the HFD group compared with the control group; after fish oil was added, the apoptosis index went down markedly and no significant difference was seen between the FO group and the CON group (Figure 3g–l,t).

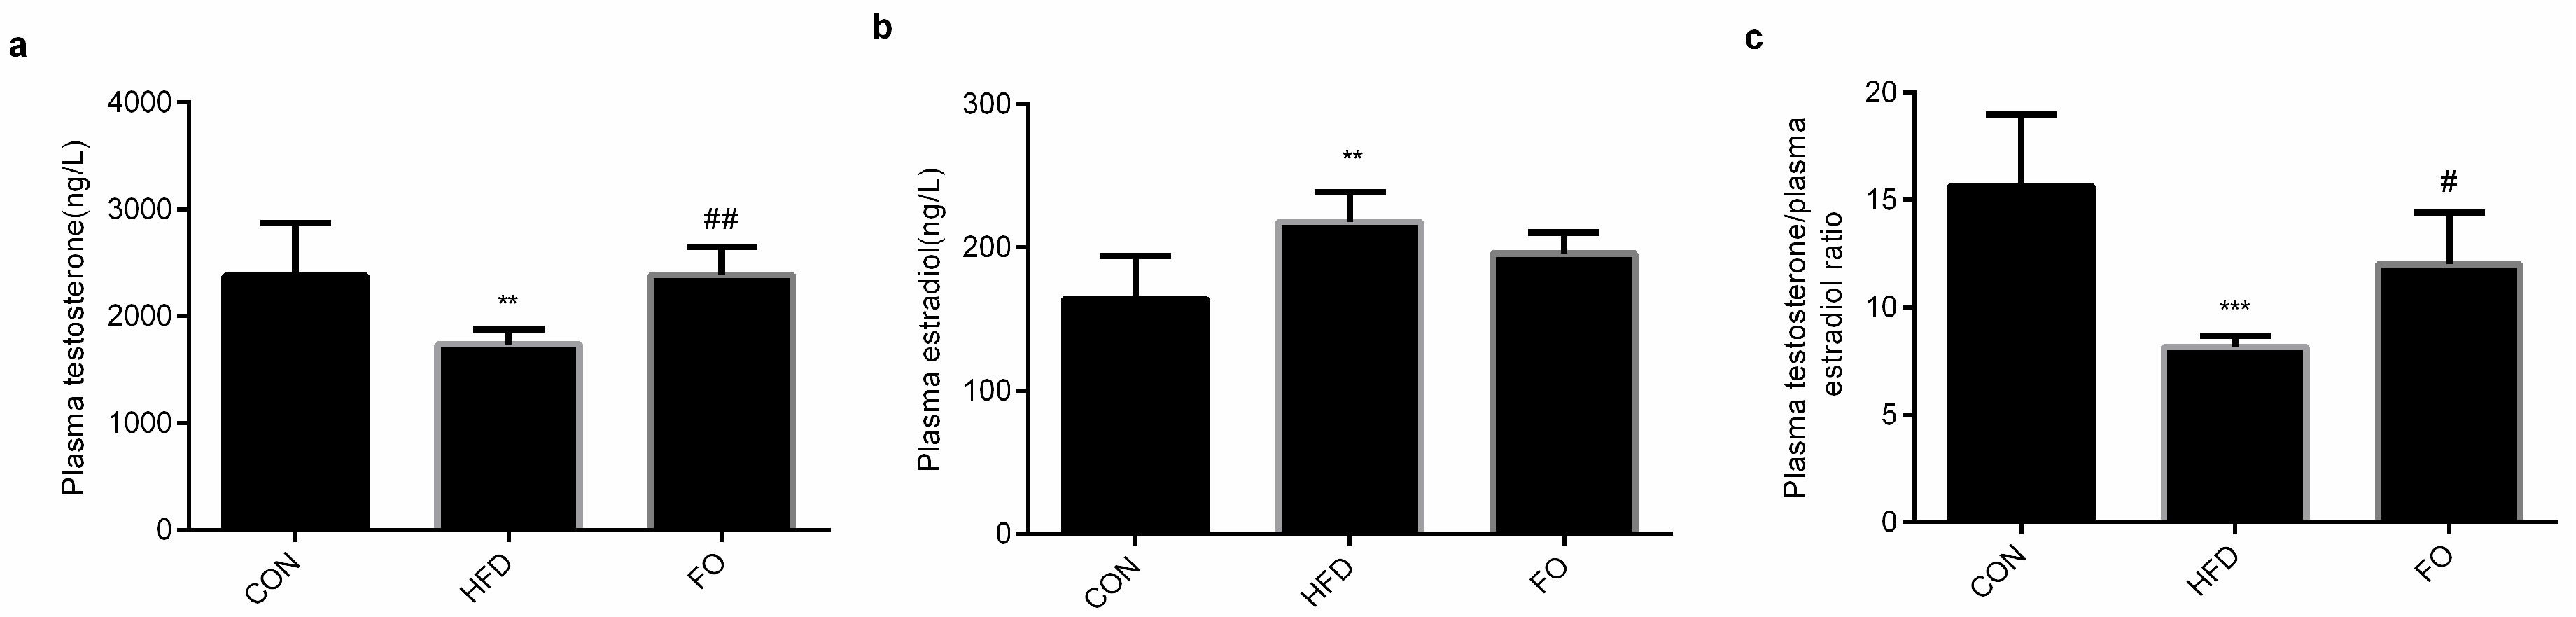
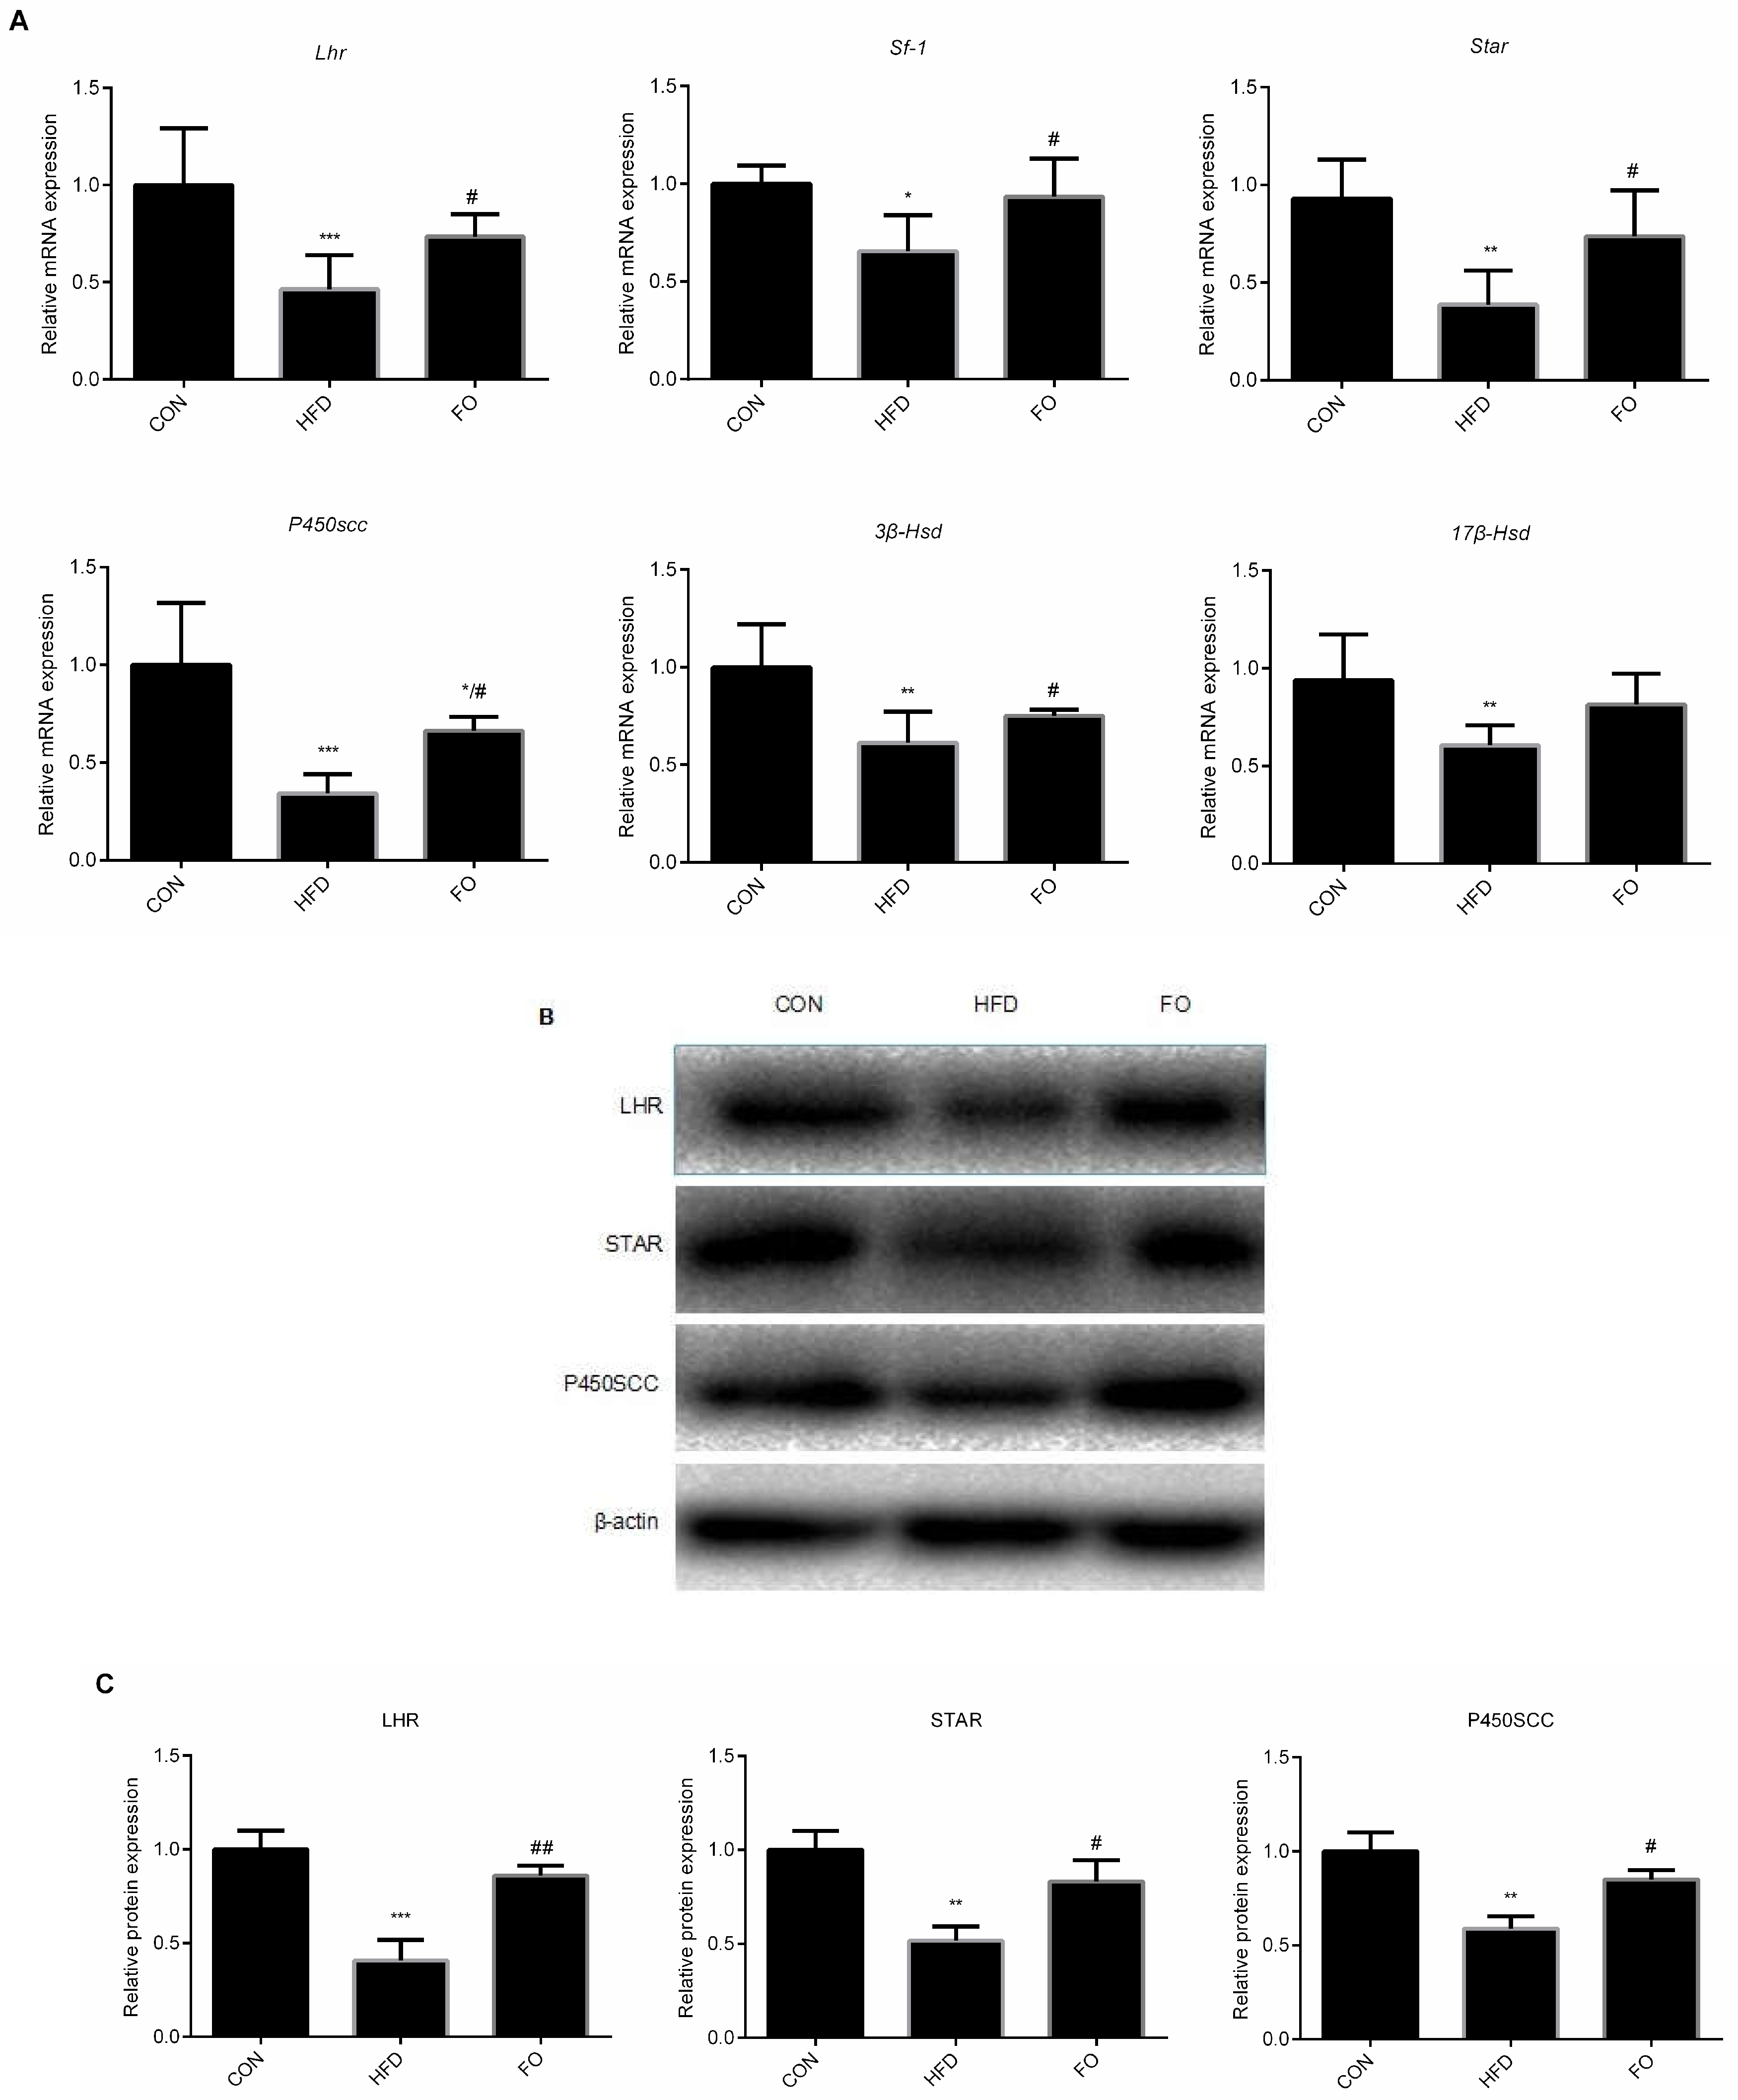
2.4. FO Alleviated Testes Testosterone Synthesis Capacity in HFD Mice

After 12 weeks’ feeding, plasma testosterone and estradiol levels were measured. The results showed that the plasma testosterone and the ratio of plasma testosterone/estradiol were significantly reduced in the HFD group compared with the CON group, while those changes were restored in the FO group (p < 0.01, Figure 4a–c). The plasma estradiol concentrations increased significantly in the HFD group than in the CON group (p < 0.01) and slightly reduced with the intake of fish oil (Figure 4b).
After 12 weeks’ feeding, the testicle mRNA levels of Lhr, Star, P450scc, 3β-Hsd, 17β-Hsd, Sf-1 were significantly lower in the HFD group than in the CON group, while the expression of these genes—except 17β-Hsd—were significantly higher in the FO group than in the HFD group and only the mRNA expression level of P450scc was significantly reduced in the FO group compared with the CON group, no significant differences in the other genes were observed between the FO and the CON group (p < 0.05, Figure 5A). Additionally, Western blotting analysis indicated that HFD feeding down-regulated the protein levels of LHR, STAR and P450SCC, which were prevented by supplementation with fish oil (Figure 5B,C).

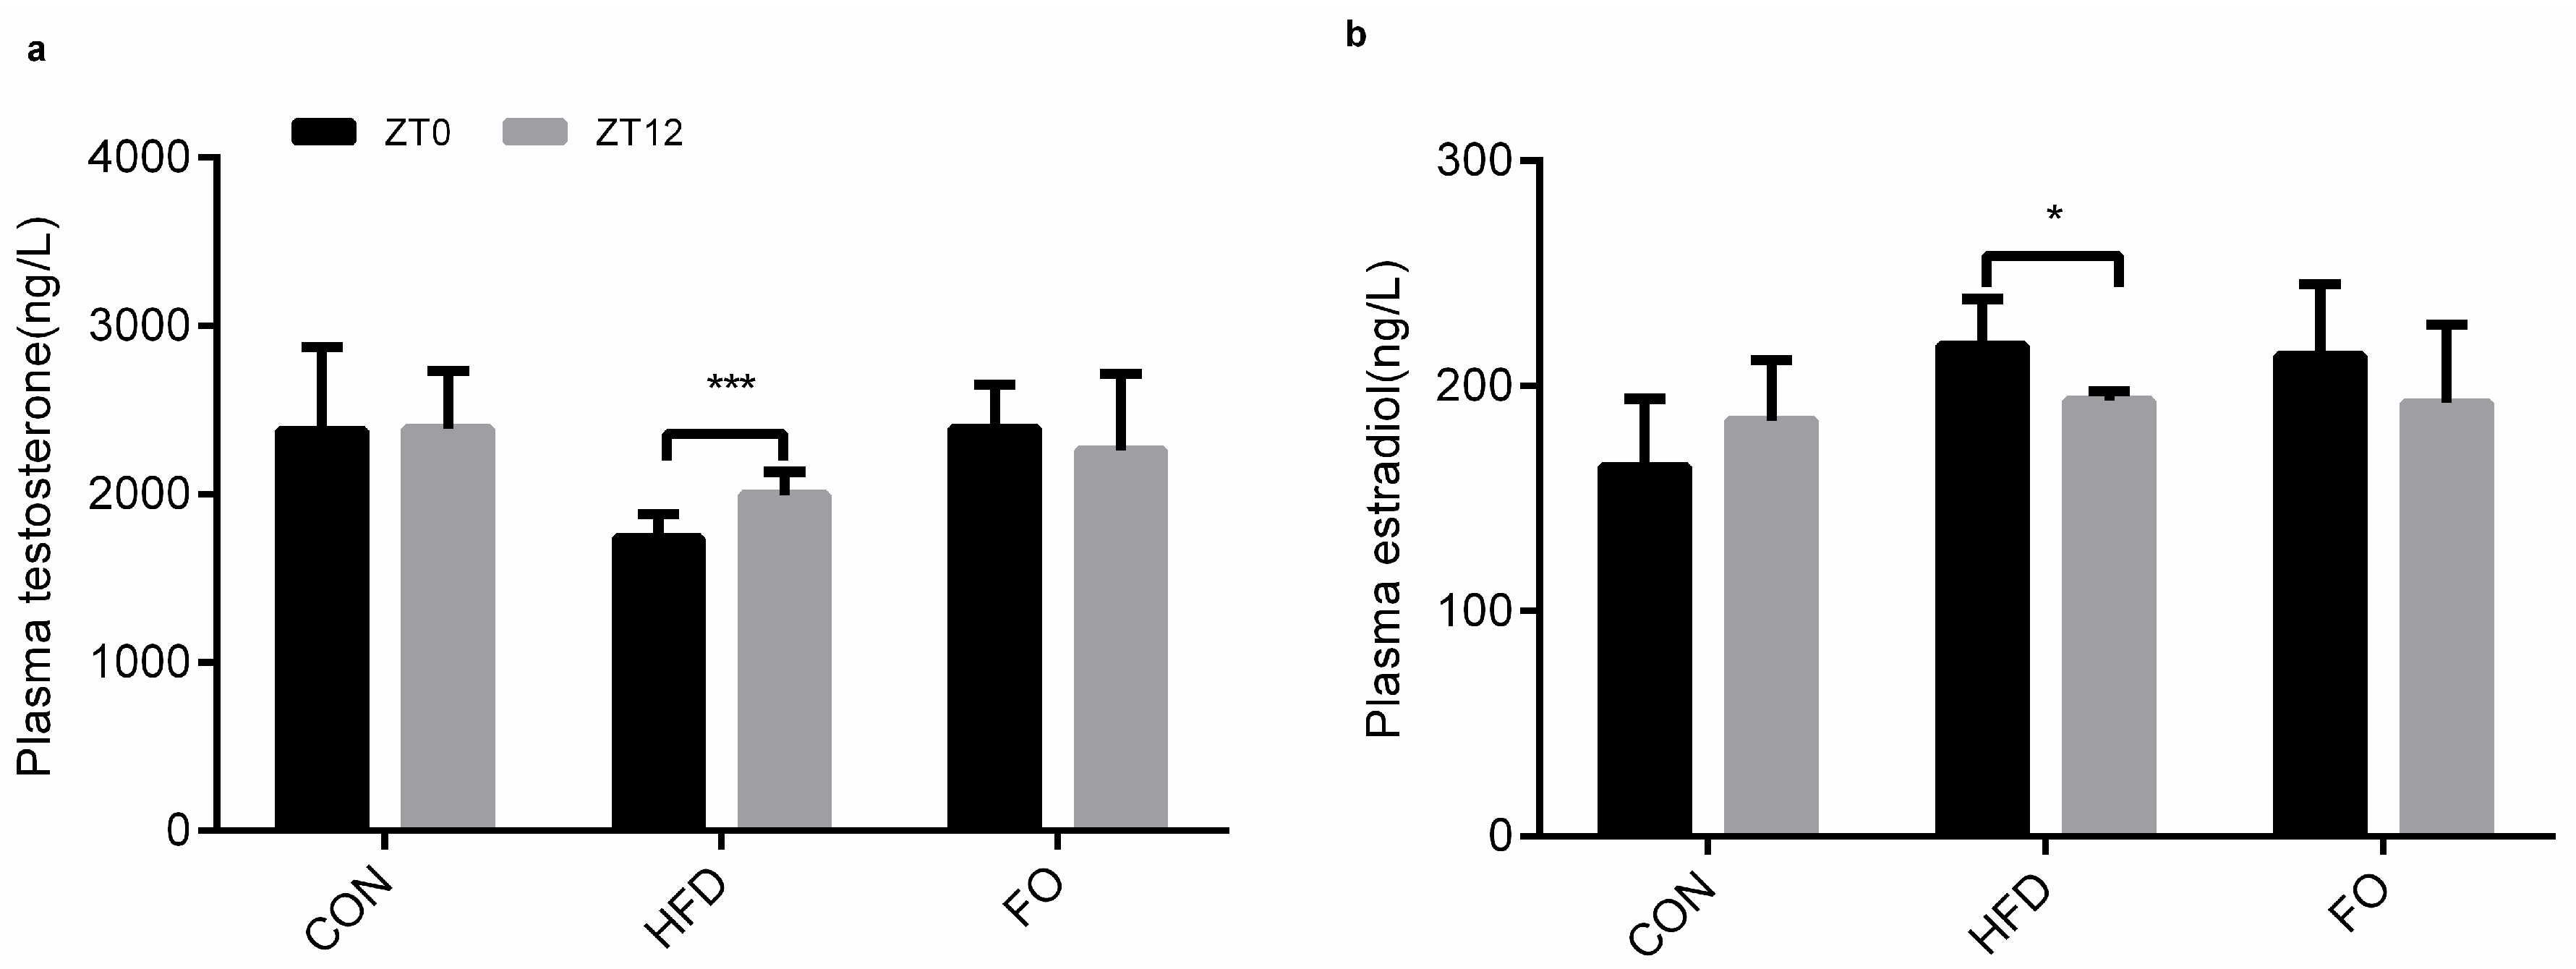
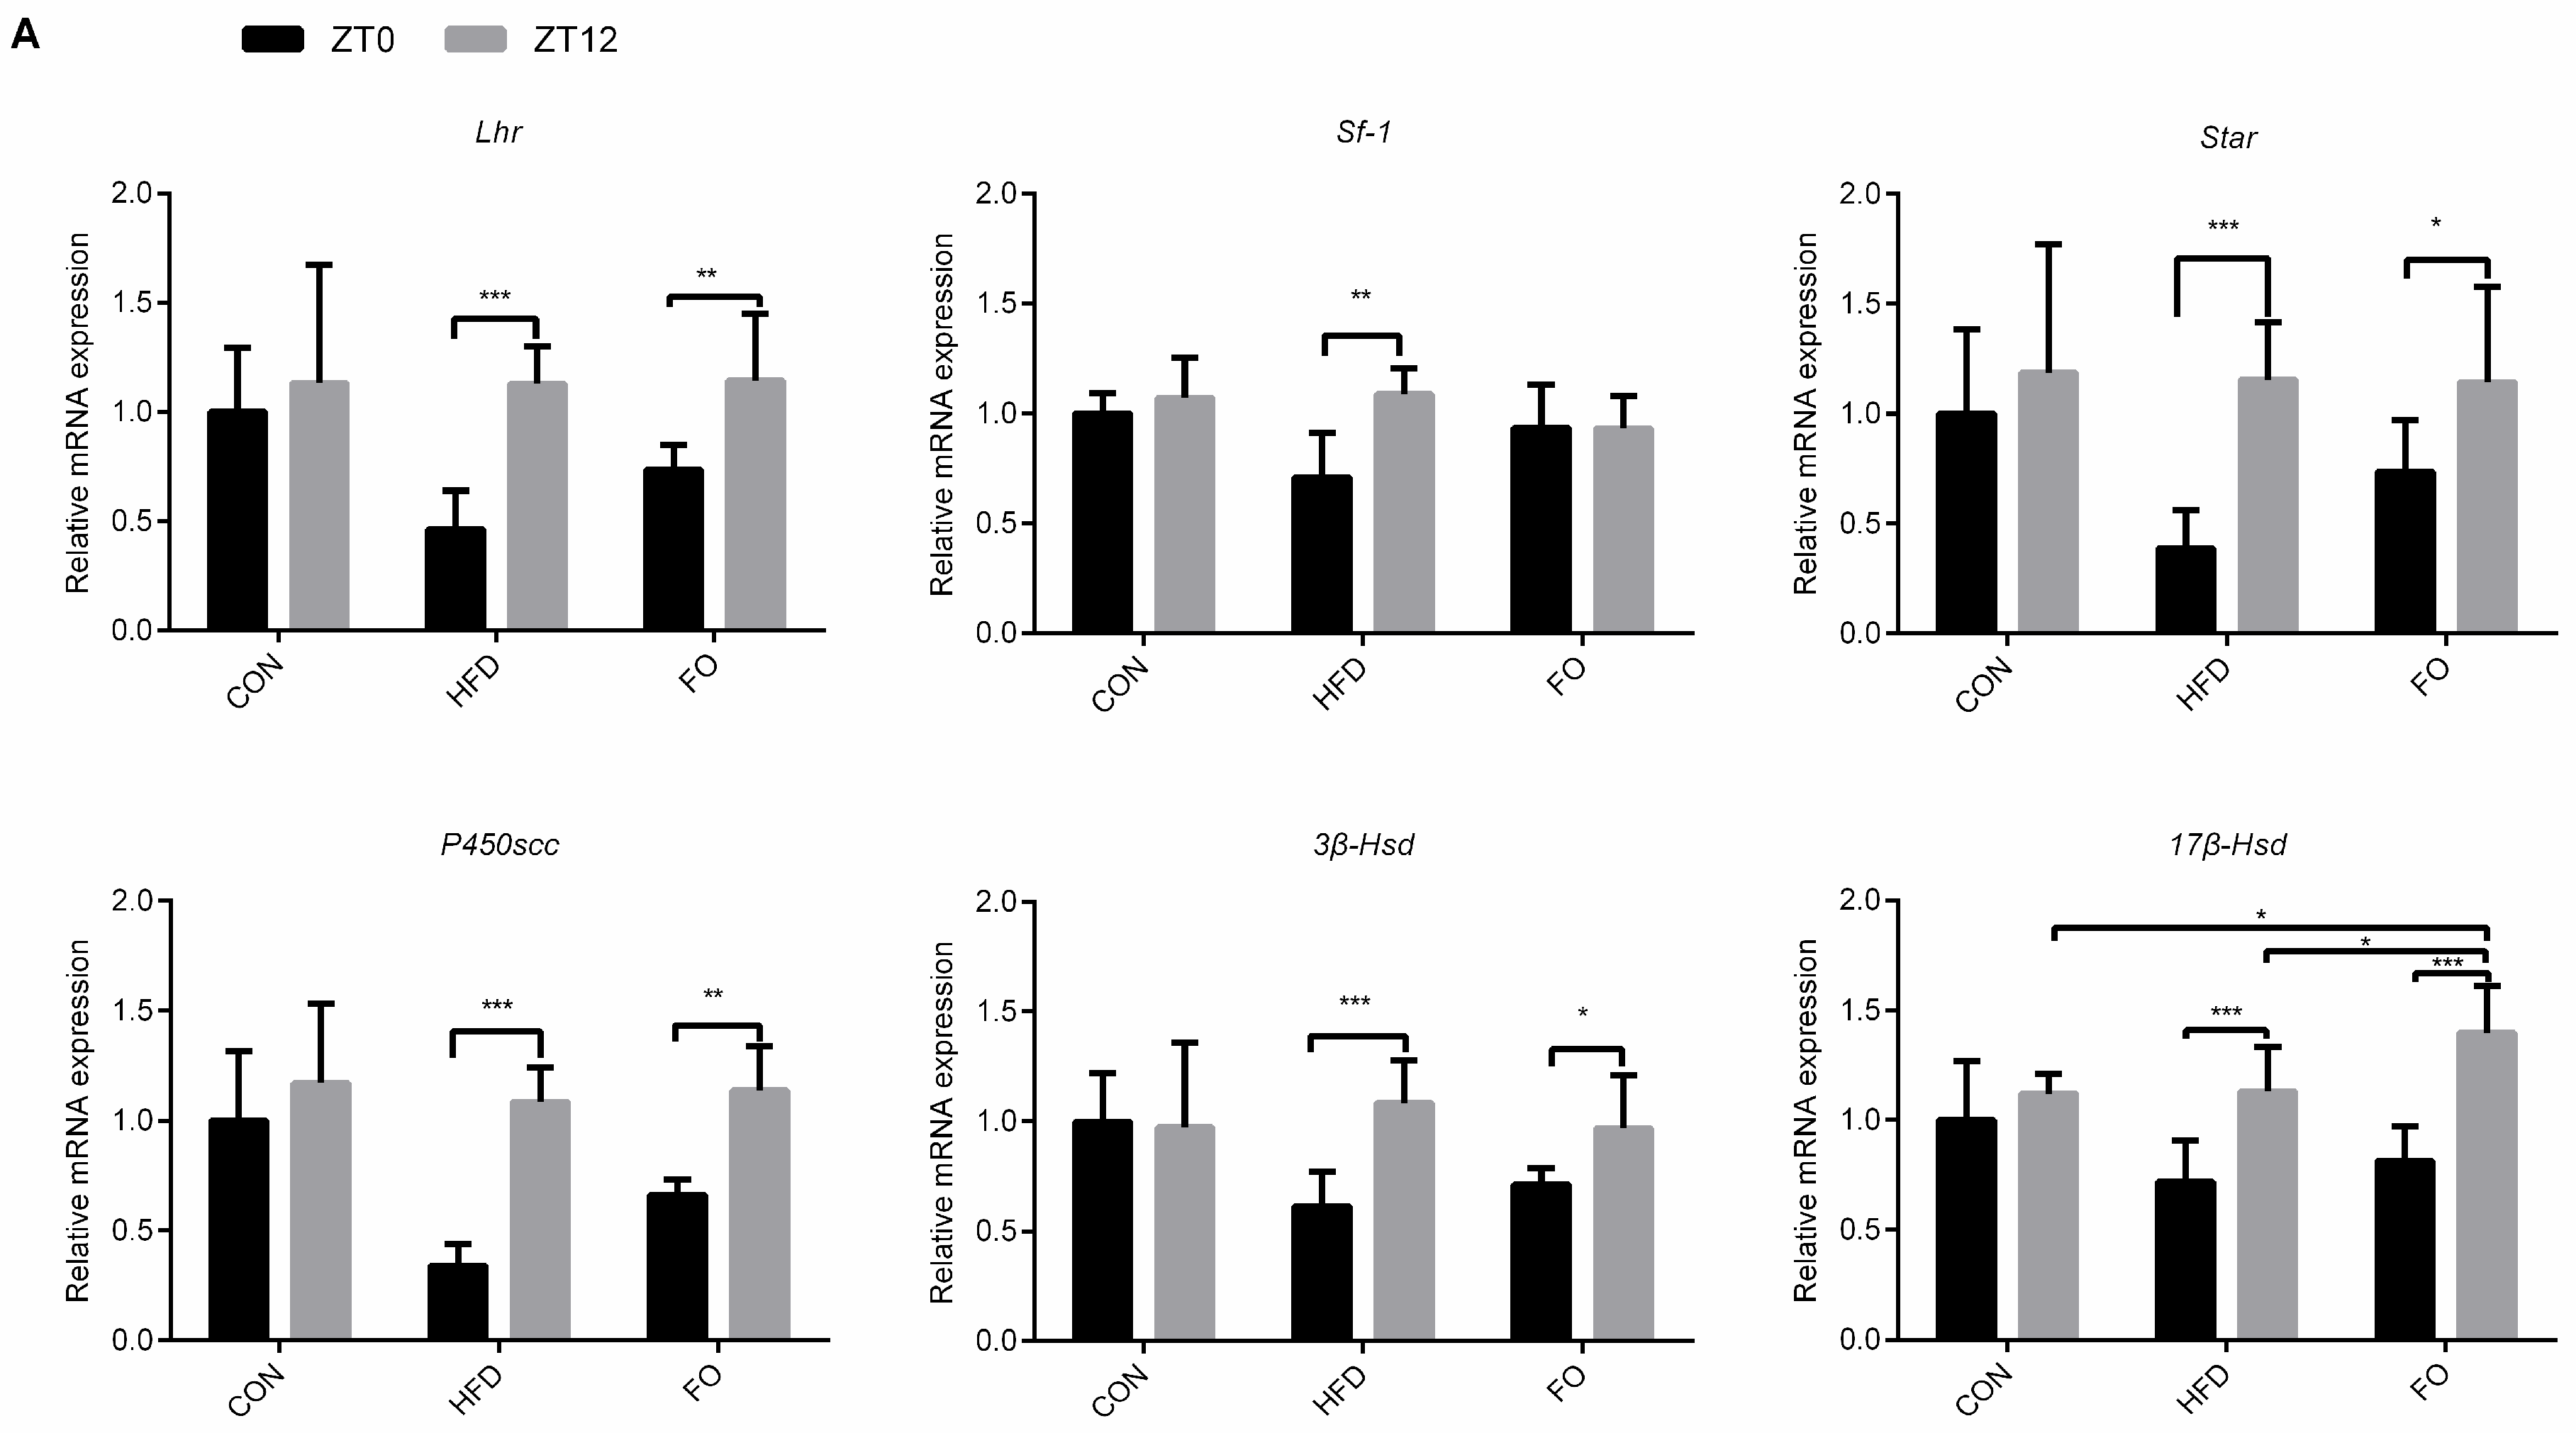
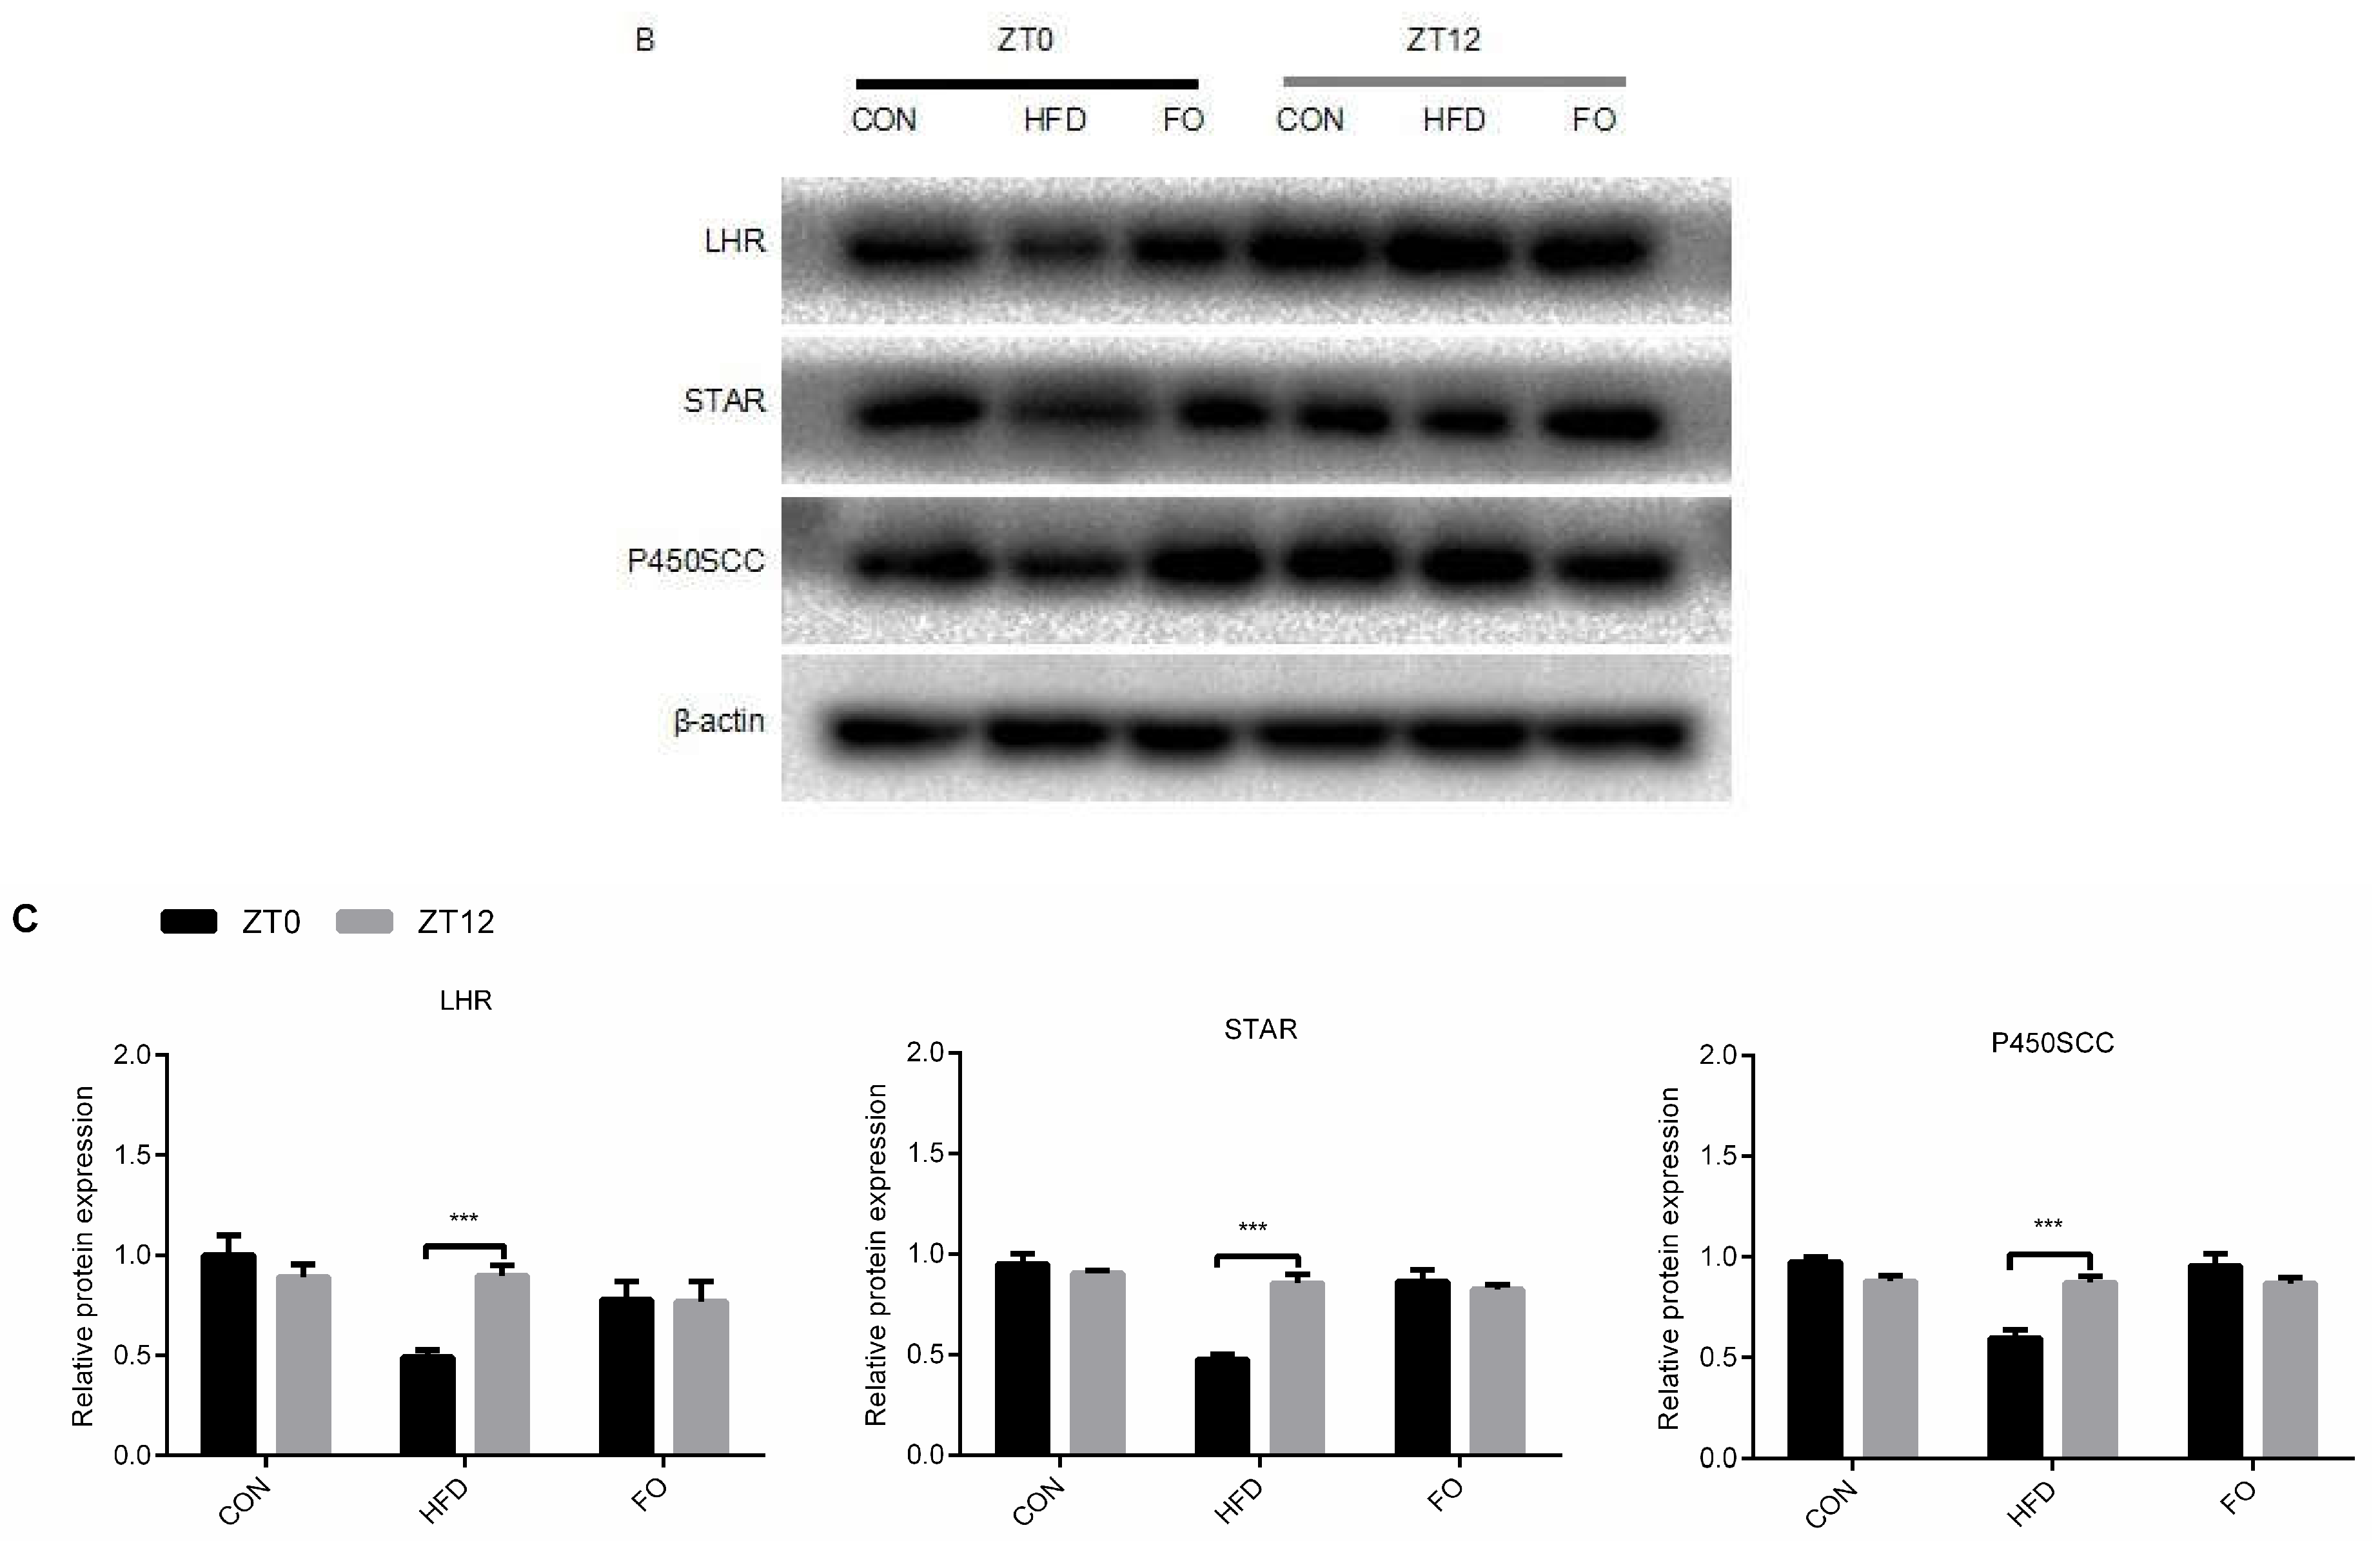
2.5. Different Diets Affect the Circadian Rhythm of Testes Testosterone Synthesis

Our data showed that the plasma testosterone and estradiol concentrations had no significant difference between ZT0 and ZT12 in the CON group. Interestingly, significant differences were observed between ZT0 and ZT12 in the HFD group but the differences disappeared in the FO group (Figure 6).
To explain the circadian oscillations of the sexual hormones in the HFD group, the expression levels of testosterone synthesis genes at ZT0 and ZT12 were checked, the mRNA expression of Lhr, Star, P450scc, 3β-Hsd, 17β-Hsd and Sf-1 and the protein expression of LHR, STAR, P450SCC showed no significant difference between ZT0 and ZT12 in the CON group (Figure 7). The mRNA and protein expression were significantly changed between ZT0 and ZT12 in the HFD group (p < 0.05, Figure 7) but this change in the mRNA expression of genes eased in the FO group (p < 0.05, Figure 7A)—no change in the protein levels was observed (p > 0.05, Figure 7). Additionally, the expression of 17β-Hsd at ZT12 was significantly increased in the FO group compared with the CON and HFD groups (p > 0.05, Figure 7A).

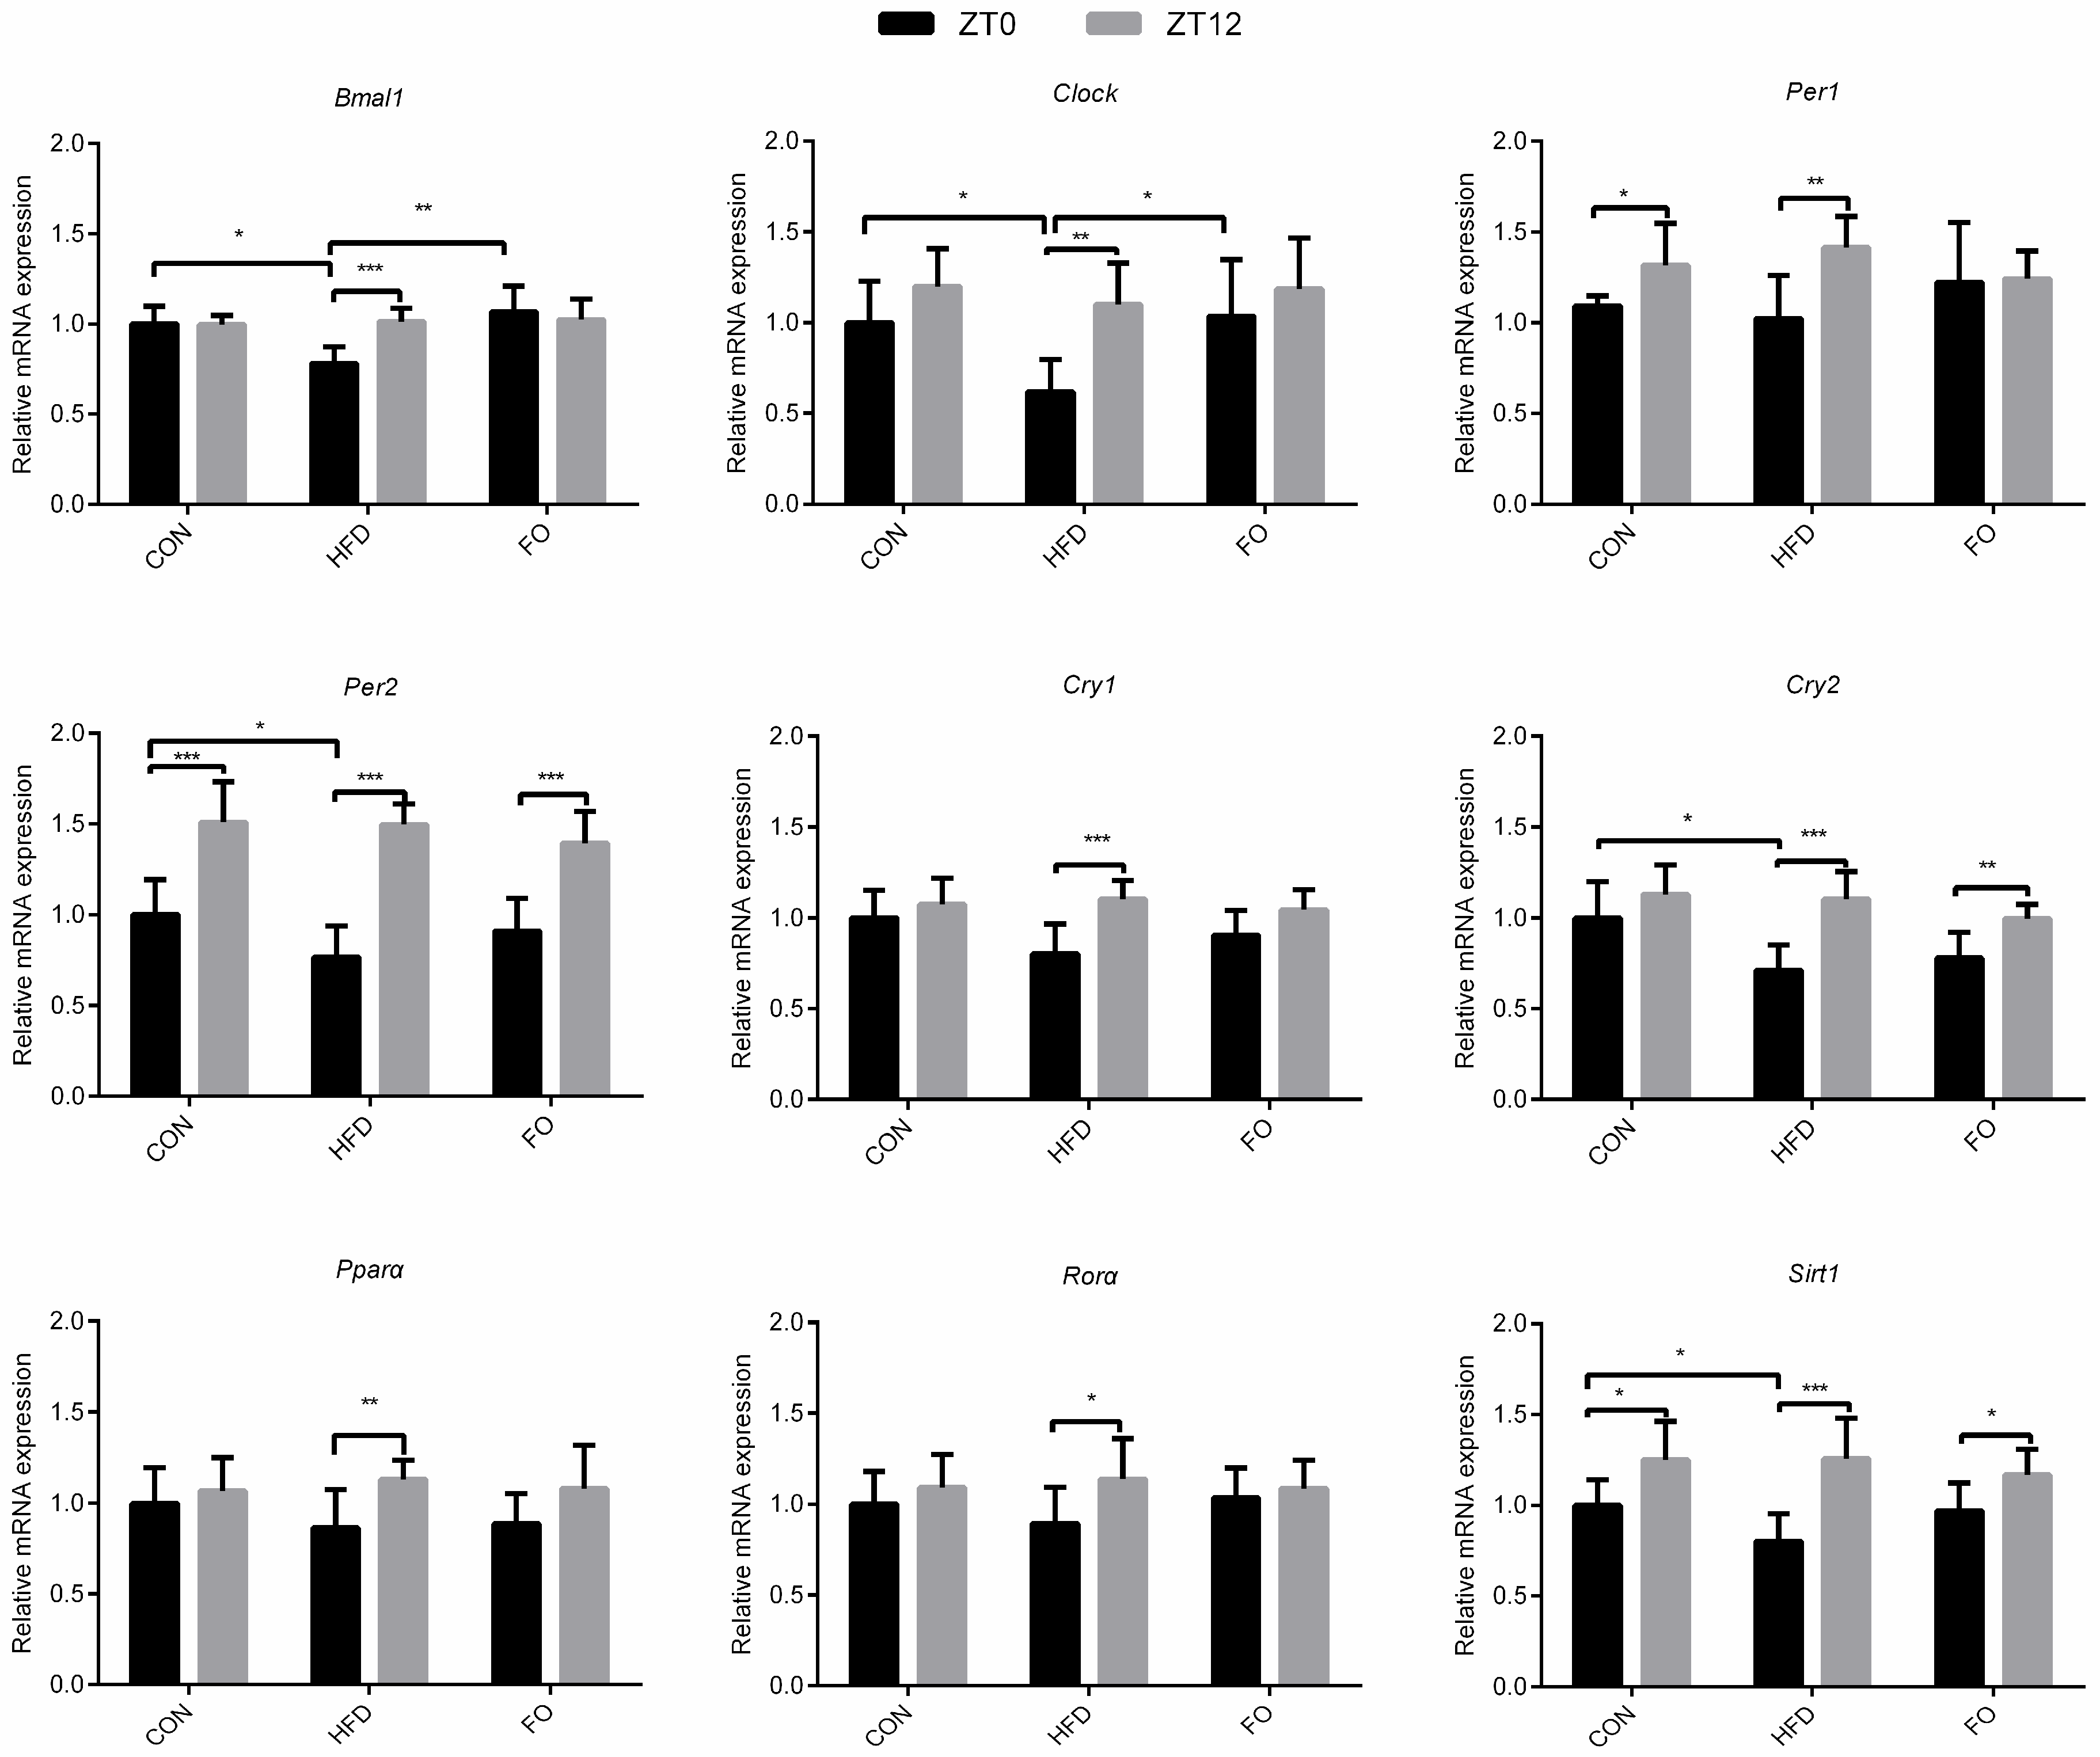
2.6. Effect of HFD and FO on Rhythmic Expression of Core Clock Genes

Testes, used for the RT-qPCR assay of core clock genes, were collected at ZT0 and ZT12 from the three groups of mice. The circadian expression of genes was controlled by clock genes. At ZT0, the HFD feeding significantly down-regulated the expression of clock genes (Bmal1, Clock, Per2, Cry2, Sirt1) (p < 0.05) and the expression of Bmal1, Clock genes was rescued by fish oil feeding. However, no differences were found at ZT12 between the three groups. The rhythmic expression of clock genes between ZT0 and ZT12 were analyzed. The testicle mRNA levels of Bmal1, Clock, Cry1, Cry2, Rorα and Pparα genes at ZT0 and ZT12 showed no remarkable differences in the CON group (p > 0.05). In the HFD group, all the examined clock genes presented oscillated expression (p < 0.05) and the oscillations of Bmal1, Clock, Per1, Cry1, Rorα and Pparα genes were abated in the FO group (Figure 8).

3. Discussion

Numerous studies have revealed the negative effects of a high-fat diet on male reproduction [2,3,4,5,6]. In the present study, after 12 weeks of high-fat feeding, remarkable features of obesity, including increased body weight, perinephric and epididymal fat weight, hypercholesteremia and hypertriglyceridemia, were identified in mice (Figure 1). However, testicle weight was not increased to accompany the elevation in body weight (Figure 2). The structure of testes in the HFD group was damaged with reduced Leydig cells number and increased apoptotic reproductive cells (Figure 3) and sexual hormones were disordered (Figure 4). A restricted diet with low fat has potential benefits for testicle tissues in mice [29]. A recent study indicated that ω-3PUFAs can also relieve reproductive disorder induced by a high-fat diet [12]. Clinical data illustrated that monounsaturated fatty acid intake is inversely proportional to serum testosterone levels, whereas ω-3PUFAs intake is proportional to serum testosterone levels [30]. In the present study, a high fat diet supplemented with fish oil reduced plasma TC and TG levels compared with the HFD group (Figure 1) and prevented the effect of high-fat on testicular structure (Figure 3). The disturbed plasma testosterone, estradiol levels and testosterone/estradiol ratio were recovered by fish oil supplementation (Figure 4). The results were consistent with Li et. al’s study [12], which suggests that supplementation with fish oil rich in ω-3PUFAs improved sexual hormones synthesis in high-fat induced obese mice.
Testosterone synthesis level is related to the number of Leydig cells in the testes [31]. Sf-1, a member of the orphan nuclear receptor family, can stimulate the expression of Star and all other genes involved in testicular steroids synthesis [32,33]. Lhr is another gene in charge of testosterone synthesis, a study has demonstrated that the expression of Star, P450scc and 17β-Hsd were all significantly reduced in Lhr knock-out mice compared with wild type [34]. In our current study, the testicular mRNA levels of Lhr, Sf-1, Star, P450scc, 3β-Hsd, 17β-Hsd and the protein levels of LHR, STAR, P450SCC were all significantly higher in mice testes in the FO group than in the HFD group (Figure 5). These data supported our findings that fish oil supplementation prevented HFD-induced testosterone level reduction. Restored testosterone levels in the FO group may be attributed to an increased total number of Leydig cells and a reduced number of apoptotic cells, which led to an elevated expression of testosterone synthesis related enzymes.
A classic opinion is that the peripheral circadian clock is not presented in normal mice testicles [35,36,37,38]. Zylka et al. identified that Per1 and Per3 transcription levels had circadian oscillations and Per2 was not detected by Northern blotting [39]. However, Alvarez et. al found that these genes had no circadian expression oscillations in testicles using Rnase protection assay and RT-qPCR [36,37,38,40,41]. In the current study, the expression of clock genes such as Bmal1, Clock, Cry1/2, Pparα and Rorα had no significant differences between ZT0 and ZT12 (p > 0.05, Figure 8), which were consistent with previous studies but circadian expression of Per1 and Per2 was observed (p < 0.05, Figure 8) [39,42]. After 12 weeks of HFD feeding, oscillations in the expression of clock genes between ZT0 and ZT12 were observed, which disappeared for the most studied genes with fish oil supplementation (Figure 8).
Circadian rhythm has been thought to affect reproductive functions. Deficiency of the Bmal1 gene in mice resulted in disturbed reproduction, low testosterone levels and reduced the expression of Star and other testosterone synthesis associated genes [43,44]. In Bmal1, Per2 or Per1/2 knockout mice, the testicular Star expression was significantly inhibited, whereas Per1 deficiency has no effects on Star expression [43]. These findings suggest that clock genes such as Bmal1 and Per2 contribute to the regulation of testosterone synthesis. In the present study, the expression of testosterone synthesis-related genes, including Lhr, Sf-1, Star, P450scc, 3β-Hsd and 17β-Hsd, had no significant difference between ZT0 and ZT12 in the CON group (Figure 7), the findings were consistent with other studies [43]. Interestingly, changes in the expression of these genes between ZT0 and ZT12 were observed in the HFD group (Figure 7), which suggested that the disorder of testosterone synthesis in HFD mice may be partly attributed to circadian rhythm chaos. Fish oil supplementation prevented the normal rhythms from being disrupted.
In conclusion, fish oil rich in ω-3PUFAs can ameliorate the chaos of sexual hormones synthesis in high-fat induced obese male mice by increasing the number of Leydig cells and inhibiting apoptosis in reproductive cells and then stimulating the expression of Lhr, Star and testosterone synthesis associated enzymes through the adenylyl cyclase–cyclic adenosine monophosphate–protein kinase A (AC–cAMP–PKA) and Sf-1 pathways. To our knowledge, this is the first finding that high-fat feeding disturbed normal testicular rhythms, disrupted the circadian expression of clock core genes and steroidogenesis-related gene expression in testicles, which may lead to reproductive dysfunction. Furthermore, the protective effects of fish oil against a high-fat diet and the induced disorder of testosterone synthesis, may be partly attributed to the rescue of testicular rhythms.

4. Materials and Methods

4.1. Animals and Diets

This animal study was conducted according to the Guidelines for the Care and Use of Experimental Animals, and the protocol was approved by Laboratory Animal Ethics Committee of Wuhan Polytechnic University (ID Number: 20160709003) on 9 July 2016. Male C57BL/6 mice (7 weeks old, weighing 18–20 g) were purchased from the Center for Disease Control of Hubei province (Wuhan, China) and were housed in a 12 h day/night cycle with a room temperature of 22 °C ± 1 °C. Mice were randomly allocated to three groups (20 animals per group) and each group was fed one of the following three diets for 12 weeks: a normal chow diet with 10 kcal% fat (CON group), a high fat diet with 42 kcal% fat and 0.5% cholesterol (w/w) (HFD group), a fish-oil-rich diet with 6.5% fish oil (w/w) and a total of 42 kcal% fat with 0.5% cholesterol (w/w) (FO group). Detailed information on these diets is presented in Table 1.
At the end of 12th week of feeding, mice were sacrificed by way of CO2 suffocation. Blood was distributed into a heparinized tube (1.5 mL) and centrifuged at 1000× g for 15 min at 4 °C and plasma was collected and stored at −80 °C until analysis. Concurrently, the testes, perinephric fat and epididymal fat were rapidly removed, rinsed with 0.9% sodium chloride solution and weighed. Isolated testes were kept at −80 °C or fixed in 10% neutral buffered formalin.

4.2. Measurement of Plasma Parameters

Plasma TC (A111-1, Jiancheng Technology, Nanjing, China), TG (A110-1, Jiancheng Technology), estradiol (JYM0379Mo, Wuhan ColorfulGene Biological Technology, Wuhan, China) and testosterone (JYM0373Mo, Wuhan ColorfulGene Biological Technology) were determined using respective kits according to the manufacturer’s instructions.

4.3. Histological Studies and TUNEL Assay

Fixed testes were processed for HE staining according to a previously described method [2]. In each group, 30 fields (five fields per mouse, ×400 magnification) in six mice were randomly selected to count Leydig cells and the data mean values for each parameter were calculated. Testicular cell apoptosis was measured using a TUNEL assay kit (11684817910, Roche Applied Science, Basel, Switzerland) according to the instructions provided by the manufacturer. The number of TUNEL-positive cells and total cells were counted in 10 randomly selected fields per slide at magnification 400×.

4.4. Real-Time Polymerase Chain Reaction (PCR) Analysis

Total RNAs from mouse testes were extracted using the TRIzol reagent (Takara Bio, Dalian, China). cDNA was synthesized using the primeScript™ RT Reagent Kit (RR037A, Takara Bio). A 20μL amplification reaction consisted of iTaq Universal SYBR Green Supermix (172-5124, Bio-Rad, Hercules, CA, USA) with 300 nM of both reverse and forward primers. All reactions were performed on the RT-qPCR system (CFX96™, Bio-Rad). The thermal cycling conditions were for 2 min at 50 °C and 3 min at 95 °C, followed by 40 repeats at 95 °C for 15 s, 60 °C for 20 s and 72 °C for 30 s. Primer sets used for q-PCR are listed in Table 2.

4.5. Western Blot

Testicular samples were homogenized in lysis buffer containing 50 mM Tris-HCl (pH 7.6), 150 mM NaCl, 1 mM EDTA-Na2 (pH 7.4), 1% Triton X-100, 1% sodium deoxycholate, 0.1% SDS, 1mM phenylmethylsulfonyl fluoride (PMSF), 10 mM NaF and 1 mM Na3VO3 and centrifuged at 15,000× g for 15 min. Protein concentrations were measured using the bicinchoninic acid (BCA) assay (T9300A, Takara Bio-Rad, Shanghai, China). Equal quantities of protein (20–40 µg) were separated with denaturing sodium dodecyl sulphate 10% polyacrylamide gels under reducing and denaturing conditions and were subsequently transferred onto a polyvinylidene difluoride (PVDF) membrane (16919300, Roche, Mannheim, Germany). Membranes were blocked with 5% (w/v) bovine serum albumin (BSA) and 0.1% Tween in Tris-buffered saline (pH 7.4) at 37 °C for 2 h, followed by hybridization with an anti-LHR (8449T, ABclonal, Wuhan, China), anti-STAR (8449T, CST, Boston, MA, USA), anti-P450SCC (14217S, CST), anti-β-actin (sc-47778, Santa Cruz Biotechnology, Dallas, TX, USA) primary antibody (1:1000 dilution) at 4 °C overnight. After washing three time in Tris-buffered saline containing 0.1% Tween 20, membranes were hybridized with a horseradish peroxidase-conjugated rabbit immunoglobulin G secondary antibody for 1 h at room temperature. Specific protein expression levels were normalized to β-actin for total protein analyses. The blot was detected with the ChemiDoc™ MP System detection system (Bio-Rad Laboratories, Inc., Hercules, CA, USA). The membranes were scanned and the sum optical density was quantitatively analyzed by Image Lab software (Bio-Rad Laboratories, Inc).

4.6. Statistical Analysis

Data are presented as mean ± SD. A one-way ANOVA and Tukey’s post hoc analysis were conducted to establish significant differences. All analyses were performed with Graphpad Prism (Version 6.0, Graphpad Software Inc., San Diego, CA, USA) statistical software. Differences were considered statistically significant at p < 0.05.

Author Contributions

Z.L. conceived and designed the study. Y.S. and Y.C. performed animal experiments. Y.C. conducted the real-time PCR and western blot experiment. N.L. and H.Z. helped to perform the experiment result analysis. H.W., Z.L., Y.C. and X.Z. wrote the manuscript. All authors read and approved the final version of the manuscript. Y.C. and H.W. contributed equally to this work.

Acknowledgments

This study was supported by National Natural Science Foundation of China (Grant No. 31271855 and 81402669), Hubei Provincial Natural Science Foundation of China (Grant No. 2012FFB04802, 2017CFB275) and Educational Commission of Hubei Province of China (Grant No. D20141705).

Conflicts of Interest

The authors declare no conflict of interest.

Abbreviations

ACAdenylyl cyclase
β-ActinActin, beta
Bmal1Aryl hydrocarbon receptor nuclear translocator-like
BSABovine serum albumin
cAMPCyclic adenosine monophosphate
ClockCircadian locomotor output cycles kaput
CONControl diet
Cry1/2Cryptochrome 1/2
3/17β-Hsd3β-Hydroxysteroid dehydrogenase
HEHematoxylin-eosin
HFDHigh fat diet
FOHigh fat and fish oil diet
KOKnockout
LhLuteinizing hormone
LhrLuteinizing hormone receptors
Per1/2Period circadian clock 1/2
PMSFPhenylmethylsulfonyl fluoride
PparαPeroxisome proliferator activated receptor alpha
P450sccCholesterol side-chain cleavage enzyme
PUFAsPolyunsaturated fatty acids
PVDFPolyvinylidene difluoride
RorαRAR-related orphan receptor alpha
Sf-1Steroidogenic factor 1
Sirt1Sirtuin 1
StarSteroidogenic acute regulatory protein
TUNELTerminal deoxynucleotidyl transferase-mediated dUTP nick end labeling
RT-qPCRQuantitative real-time PCR
TCTotal cholesterol
TGTriacylglycerol
ZTZeitgeber time

References

  1. Jensen, T.K.; Heitmann, B.L.; Blomberg Jensen, M.; Halldorsson, T.I.; Andersson, A.M.; Skakkebaek, N.E.; Joensen, U.N.; Lauritsen, M.P.; Christiansen, P.; Dalgard, C.; et al. High dietary intake of saturated fat is associated with reduced semen quality among 701 young danish men from the general population. Am. J. Clin. Nutr. 2013, 97, 411–418. [Google Scholar] [CrossRef] [PubMed] [Green Version]
  2. Yan, W.J.; Mu, Y.; Yu, N.; Yi, T.L.; Zhang, Y.; Pang, X.L.; Cheng, D.; Yang, J. Protective effects of metformin on reproductive function in obese Male rats induced by high-fat diet. J. Assist. Reprod. Genet. 2015, 32, 1097–1104. [Google Scholar] [CrossRef] [PubMed]
  3. Jensen, T.K.; Andersson, A.M.; Jorgensen, N.; Andersen, A.G.; Carlsen, E.; Petersen, J.H.; Skakkebaek, N.E. Body mass index in relation to semen quality and reproductive hormones among 1558 danish men. Fertil. Steril. 2004, 82, 863–870. [Google Scholar] [CrossRef] [PubMed]
  4. Yi, X.; Gao, H.; Chen, D.; Tang, D.; Huang, W.; Li, T.; Ma, T.; Chang, B. Effects of obesity and exercise on testicular leptin signal transduction and testosterone biosynthesis in male mice. Am. J. Physiol. Regul. Integr. Compar. Physiol. 2017, 312, R501–R510. [Google Scholar] [CrossRef] [PubMed]
  5. Campos-Silva, P.; Furriel, A.; Costa, W.S.; Sampaio, F.J.; Gregorio, B.M. Metabolic and testicular effects of the long-term administration of different high-fat diets in adult rats. Int. Braz. J. Urol. 2015, 41, 569–575. [Google Scholar] [CrossRef] [PubMed]
  6. Chambers, T.J.; Richard, R.A. The impact of obesity on male fertility. Hormones 2015, 14, 563–568. [Google Scholar] [CrossRef] [PubMed]
  7. Fui, M.N.; Dupuis, P.; Grossmann, M. Lowered testosterone in male obesity: Mechanisms, morbidity and management. Asian J. Androl. 2014, 16, 223–231. [Google Scholar] [PubMed]
  8. Miller, W.L. Star search—What we know about how the steroidogenic acute regulatory protein mediates mitochondrial cholesterol import. Mol. Endocrinol. 2007, 21, 589–601. [Google Scholar] [CrossRef] [PubMed]
  9. Christenson, L.K.; Strauss, J.F., III. Steroidogenic acute regulatory protein: An update on its regulation and mechanism of action. Arch. Med. Res. 2001, 32, 576–586. [Google Scholar] [CrossRef]
  10. Miller, W.L. Molecular biology of steroid hormone synthesis. Endocr. Rev. 1988, 9, 295–318. [Google Scholar] [CrossRef] [PubMed]
  11. Payne, A.H.; Youngblood, G.L. Regulation of expression of steroidogenic enzymes in leydig cells. Biol. Reprod. 1995, 52, 217–225. [Google Scholar] [CrossRef] [PubMed]
  12. Li, Y.; Liu, L.; Wang, B.; Xiong, J.; Li, Q.; Wang, J.; Chen, D. Impairment of reproductive function in a male rat model of non-alcoholic fatty liver disease and beneficial effect of n-3 fatty acid supplementation. Toxicol. Lett. 2013, 222, 224–232. [Google Scholar] [CrossRef] [PubMed]
  13. Yuan, F.; Wang, H.; Tian, Y.; Li, Q.; He, L.; Li, N.; Liu, Z. Fish oil alleviated high-fat diet-induced non-alcoholic fatty liver disease via regulating hepatic lipids metabolism and metaflammation: A transcriptomic study. Lipids Health Dis. 2016, 15, 20. [Google Scholar] [CrossRef] [PubMed]
  14. Mohawk, J.A.; Green, C.B.; Takahashi, J.S. Central and peripheral circadian clocks in mammals. Annu. Rev. Neurosci. 2012, 35, 445–462. [Google Scholar] [CrossRef] [PubMed]
  15. Zhang, W.X.; Chen, S.Y.; Liu, C. Regulation of reproduction by the circadian rhythms. Sheng Li Xue Bao 2016, 68, 799–808. [Google Scholar] [PubMed]
  16. Dibner, C.; Schibler, U.; Albrecht, U. The mammalian circadian timing system: Organization and coordination of central and peripheral clocks. Annu. Rev. Physiol. 2010, 72, 517–549. [Google Scholar] [CrossRef] [PubMed]
  17. Partch, C.L.; Green, C.B.; Takahashi, J.S. Molecular architecture of the mammalian circadian clock. Trends Cell Biol. 2014, 24, 90–99. [Google Scholar] [CrossRef] [PubMed]
  18. Panda, S. Circadian physiology of metabolism. Science 2016, 354, 1008–1015. [Google Scholar] [CrossRef] [PubMed]
  19. Salas-Huetos, A.; Bullo, M.; Salas-Salvado, J. Dietary patterns, foods and nutrients in male fertility parameters and fecundability: A systematic review of observational studies. Hum. Reprod. Update 2017, 23, 371–389. [Google Scholar] [CrossRef] [PubMed]
  20. Kinson, G.A.; Liu, C.C. Diurnal variation in plasma testosterone of the male laboratory rat. Horm. Metab. Res. 1973, 5, 233–234. [Google Scholar] [CrossRef] [PubMed]
  21. Faiman, C.; Winter, J.S. Diurnal cycles in plasma fsh, testosterone and cortisol in men. J. Clin. Endocrinol. Metabol. 1971, 33, 186–192. [Google Scholar] [CrossRef] [PubMed]
  22. Sayegh, J.F.; Kobor, G.; Lajtha, A.; Vadasz, C. Effects of social isolation and the time of day on testosterone levels in plasma of c57bl/6by and balb/cby mice. Steroids 1990, 55, 79–82. [Google Scholar] [CrossRef]
  23. Cano, P.; Jimenez-Ortega, V.; Larrad, A.; Reyes Toso, C.F.; Cardinali, D.P.; Esquifino, A.I. Effect of a high-fat diet on 24-h pattern of circulating levels of prolactin, luteinizing hormone, testosterone, corticosterone, thyroid-stimulating hormone and glucose, and pineal melatonin content, in rats. Endocrine 2008, 33, 118–125. [Google Scholar] [CrossRef] [PubMed]
  24. Froy, O. Circadian rhythms and obesity in mammals. ISRN Obes. 2012, 2012, 437198. [Google Scholar] [CrossRef] [PubMed]
  25. Ando, H.; Yanagihara, H.; Hayashi, Y.; Obi, Y.; Tsuruoka, S.; Takamura, T.; Kaneko, S.; Fujimura, A. Rhythmic messenger ribonucleic acid expression of clock genes and adipocytokines in mouse visceral adipose tissue. Endocrinology 2005, 146, 5631–5636. [Google Scholar] [CrossRef] [PubMed]
  26. Blancas-Velazquez, A.; Mendoza, J.; Garcia, A.N.; la Fleur, S.E. Diet-induced obesity and circadian disruption of feeding behavior. Front. Neurosci. 2017, 11, 23. [Google Scholar] [CrossRef] [PubMed]
  27. Kohsaka, A.; Laposky, A.D.; Ramsey, K.M.; Estrada, C.; Joshu, C.; Kobayashi, Y.; Turek, F.W.; Bass, J. High-fat diet disrupts behavioral and molecular circadian rhythms in mice. Cell Metab. 2007, 6, 414–421. [Google Scholar] [CrossRef] [PubMed]
  28. Mendoza, J.; Pevet, P.; Challet, E. High-fat feeding alters the clock synchronization to light. J. Physiol. 2008, 586, 5901–5910. [Google Scholar] [CrossRef] [PubMed]
  29. Mohammadi Roushandeh, A.; Salehi, I.; Mortazavi, M. Protective effects of restricted diet and antioxidants on testis tissue in rats fed with high-fat diet. Iran. Biomed. J. 2015, 19, 96–101. [Google Scholar] [PubMed]
  30. MInguez-Alarcón, L.; Chavarro, J.E.; Mendiola, J.; Roca, M.; Tanrikut, C.; Vioque, J.; Jorgensen, N.; Torres-Cantero, A.M. Fatty acid intake in relation to reproductive hormones and testicular volume among young healthy men. Asian J. Androl. 2017, 19, 184–190. [Google Scholar] [CrossRef] [PubMed]
  31. Gould, M.L.; Hurst, P.R.; Nicholson, H.D. The effects of oestrogen receptors alpha and beta on testicular cell number and steroidogenesis in mice. Reproduction 2007, 134, 271–279. [Google Scholar] [CrossRef] [PubMed]
  32. Hatano, M.; Migita, T.; Ohishi, T.; Shima, Y.; Ogawa, Y.; Morohashi, K.I.; Hasegawa, Y.; Shibasaki, F. Sf-1 deficiency causes lipid accumulation in leydig cells via suppression of star and cyp11a1. Endocrine 2016, 54, 484–496. [Google Scholar] [CrossRef] [PubMed]
  33. Lopez, D.; Shea-Eaton, W.; McLean, M.P. Characterization of a steroidogenic factor-1-binding site found in promoter of sterol carrier protein-2 gene. Endocrine 2001, 14, 253–261. [Google Scholar] [CrossRef]
  34. Zhang, F.P.; Pakarainen, T.; Zhu, F.; Poutanen, M.; Huhtaniemi, I. Molecular characterization of postnatal development of testicular steroidogenesis in luteinizing hormone receptor knockout mice. Endocrinology 2004, 145, 1453–1463. [Google Scholar] [CrossRef] [PubMed]
  35. Mazzoccoli, G.; Francavilla, M.; Giuliani, F.; Aucella, F.; Vinciguerra, M.; Pazienza, V.; Piepoli, A.; Benegiamo, G.; Liu, S.; Cai, Y. Clock gene expression in mouse kidney and testis: Analysis of periodical and dynamical patterns. J. Biol. Regul. Homeost. Agents 2012, 26, 303–311. [Google Scholar] [PubMed]
  36. Alvarez, J.D.; Chen, D.; Storer, E.; Sehgal, A. Non-cyclic and developmental stage-specific expression of circadian clock proteins during murine spermatogenesis. Biol. Reprod. 2003, 69, 81–91. [Google Scholar] [CrossRef] [PubMed]
  37. Alvarez, J.D.; Sehgal, A. The thymus is similar to the testis in its pattern of circadian clock gene expression. J. Biol. Rhythms 2005, 20, 111–121. [Google Scholar] [CrossRef] [PubMed]
  38. Chen, H.; Gao, L.; Xiong, Y.; Yang, D.; Li, C.; Wang, A.; Jin, Y. Circadian clock and steroidogenic-related gene expression profiles in mouse leydig cells following dexamethasone stimulation. Biochem. Biophys. Res. Commun. 2017, 483, 294–300. [Google Scholar] [CrossRef] [PubMed]
  39. Zylka, M.J.; Shearman, L.P.; Weaver, D.R.; Reppert, S.M. Three period homologs in mammals: Differential light responses in the suprachiasmatic circadian clock and oscillating transcripts outside of brain. Neuron 1998, 20, 1103–1110. [Google Scholar] [CrossRef]
  40. Yamamoto, T.; Nakahata, Y.; Soma, H.; Akashi, M.; Mamine, T.; Takumi, T. Transcriptional oscillation of canonical clock genes in mouse peripheral tissues. BMC Mol. Biol. 2004, 5, 18. [Google Scholar] [CrossRef] [PubMed] [Green Version]
  41. Morse, D.; Cermakian, N.; Brancorsini, S.; Parvinen, M.; Sassone-Corsi, P. No circadian rhythms in testis: Period1 expression is clock independent and developmentally regulated in the mouse. Mol. Endocrinol. 2003, 17, 141–151. [Google Scholar] [CrossRef] [PubMed]
  42. Bebas, P.; Goodall, C.P.; Majewska, M.; Neumann, A.; Giebultowicz, J.M.; Chappell, P.E. Circadian clock and output genes are rhythmically expressed in extratesticular ducts and accessory organs of mice. FASEB J. 2009, 23, 523–533. [Google Scholar] [CrossRef] [PubMed]
  43. Alvarez, J.D.; Hansen, A.; Ord, T.; Bebas, P.; Chappell, P.E.; Giebultowicz, J.M.; Williams, C.; Moss, S.; Sehgal, A. The circadian clock protein bmal1 is necessary for fertility and proper testosterone production in mice. J. Biol. Rhythms 2008, 23, 26–36. [Google Scholar] [CrossRef] [PubMed]
  44. Schoeller, E.L.; Clark, D.D.; Dey, S.; Cao, N.V.; Semaan, S.J.; Chao, L.W.; Kauffman, A.S.; Stowers, L.; Mellon, P.L. Bmal1 is required for normal reproductive behaviors in male mice. Endocrinology 2016, 157, 4914–4929. [Google Scholar] [CrossRef] [PubMed]
Figure 1. Phenotypic comparison of mice fed the control (CON), high fat diet (HFD), or fish oil (FO) diets for 12 weeks. (a) Body weight of mice at 12 weeks. At the end of week 12, the body weight of the three groups (b), perinephric fat weight (c), the perinephric and epididymal fat weight/body weight ratio (d), the plasma total cholesterol (TC) (e) and triacylglycerol (TG) (f). Data are expressed as mean ± SD (n = 10 per group). * p < 0.05, ** p < 0.01, *** p < 0.001 vs. CON group; # p < 0.05, ## p < 0.01 vs. HFD group.
Ijms 19 01325 g001
Figure 2. Effect of HFD and FO on male reproductive organs. (a) the relative ratio of testes weight/body weight (b) the epididymal fat weight. Data were expressed as mean ± SD (n = 10 per group). * p < 0.05, ** p < 0.01, *** p < 0.001 vs. CON group.
Ijms 19 01325 g002
Figure 3. Hematoxylin–eosin (HE) and terminal deoxynucleotidyl transferase-mediated dUTP nick end labeling (TUNEL) staining of testes. Testes tissue sections were stained with HE staining (af) and TUNEL staining (gl) respectively and quantitative analysis of the Leydig cells (s), apoptosis index (t). The representative photographs as follow: (ac) H&E staining of the CON, HFD and FO group testes sections (scale bar 100 μm), respectively; (df) H&E staining of the CON, HFD and FO group testes sections (scale bar 50 μm), respectively; (gi) TUNEL staining of the CON, HFD and FO group testes sections (scale bar 100 μm), respectively; (jl) TUNEL staining of the CON, HFD and FO group testes sections (scale bar 50 μm), respectively. Black, red, yellow, green arrow indicates the Leydig cell, sertoli cell, spermatozoa cell, apoptotic cell, respectively. Data were expressed as mean ± SD (n = 10 per group). *** p < 0.001 vs. CON group; # p<0.05, ## p < 0.01 vs. HFD group.
Ijms 19 01325 g003
Figure 4. Effects of HFD and FO on plasma testosterone (a), estradiol levels (b) and the testosterone/estradiol ratio (c). Data were expressed as mean ± SD (n = 10 per group). ** p < 0.01, *** p < 0.001 vs. CON group; # p < 0.05, ## p < 0.01 vs. HFD group.
Ijms 19 01325 g004
Figure 5. Effect of HFD and FO on the expression of the genes involved in some testosterone synthesis in the testes. (A) the mRNA expression of Lhr, Sf-1, Star, P450scc, 3β-Hsd, 17β-Hsd in the testes. (B) Western blot analysis of LHR, STAR, P450SCC expression in the testes. (C) The LHR, STAR, P450SCC expression levels were quantitatively analyzed with Image Lab software. Data were expressed as mean ± SD (n = 10 per group). * p < 0.05, ** p < 0.01, *** p < 0.001 vs. CON group; # p < 0.05, ## p < 0.01 vs. HFD group.
Ijms 19 01325 g005
Figure 6. Effect of HFD and FO on the contents of T (a) and E2 (b) in plasma between morning (zeitgeber time 0, ZT0) and night (zeitgeber time 12, ZT12) variation. Data were expressed as mean ± SD (n = 10 per group). * p < 0.05, *** p < 0.001.
Ijms 19 01325 g006
Figure 7. Effect of HFD and FO on the rhythmic expression of some steroidogenic-related genes. (A)Rhythmic transcription levels analysis of Lhr, Star, P450scc, 3β-Hsd, 17β-Hsd, Sf-1genes. (B) Western blot analysis of LHR, STAR, P450SCC expression in testes. (C) Expression levels of LHR, STAR and P450SCC were quantitatively analyzed with Image Lab software. Data were expressed as mean ± SD (n = 10 per group). * p < 0.05, ** p < 0.01, *** p < 0.001.
Ijms 19 01325 g007aIjms 19 01325 g007b
Figure 8. Rhythmic expression of Bmal1, Clock, Per1/2, Cry1/2, Rorα, Pparα and sirt1 genes. Data were expressed as mean ± SD (n = 10 per group). * p < 0.05, ** p < 0.01, *** p < 0.001.
Ijms 19 01325 g008
Table 1. Feed formulation, feed energy constitute and the total fatty acids profile of experimental diets.
Feed Formulation (g)Control Diet (CON)High-Fat Diet (HFD)Fish Oil Diet (FO)
casein141.8178178
corn starch565.692489489
dextrin15500
cream0148110
corn oil406033
fish oil0065
fibrin506060
vitamin premix456060
TBHQ0.0420.0420.042
choline chloride2.500
cholesterin04.634.725
total100010001000
Calories (kcal/g)
protein14.2%14%14%
carbohydrate75%44%44%
fat10%42%42%
total3.64.54.5
cholesterin00.5%0.5%
Fatty acid composition
∑SFA15.5%49.70%47.76%
∑MFA32%32.83%30.30%
∑n−653%17.14%10.98%
∑n−31%0.33%10.96%
∑PUFA54%17.47%21.94%
n−6/n−353521.002
Table 2. Primer sequences.
NameSequence (5′ → 3′)
β-Actin-FGGAGATTACTGCCCTGGCTCCTA
β-Actin-RGACTCATCGTACTCCTGCTTGCTG
Bmal1-FCGTTCACTCAGGACAGACAGATAAG
Bmal1-RTGTGGCGAAGGTAGGATAGGC
Clock-FCGTTCACTCAGGACAGACAGATAAG
Clock-RTGTGGCGAAGGTAGGATAGGC
Per 1-FCCTCCTCCTACACTGCCTCTTC
Per 1-RCACCACGCTCTCTGCCTTATTG
Per 2-FGCCAACACAGACGACAGCATC
Per2-RTCTCCTGGTCCTCCTTCAACAC
Cry 1-FGCACCAGAAGGCATCCAGAAG
Cry 1-RGGACCGAGGCGAGAAGACC
Cry 2-FTGGCAAGGAGGAGAGACAGAAG
Cry2-RGAAGAGGCGGCAGGAGAGG
Pparα-FATTTCCCTGTTTGTGGCTGC
Pparα-RCGAAGGTCCACCATTTTTTG
Rorα-FGTGGCTTCAGGAAAAGGTAAA
Rorα-RGTCGCACAATGTCTGGGTAT
Sirt1-FTGGTTCATTTATCAGAGTTGCC
Sirt1-RCATTGTTGTTTGTTGCTTGGTC
Lhr-FTTGTCGTCATCTGTGCTTGCTAC
Lhr-RTTTGAGTTGGTGACAGTGATAAGGG
Sf1-FGGAGCGGCACACCCTTATTA
Sf1-RCCAACTTTCCCTTCTTTCACT
Star-FAACTCACTTGGCTGCTCAGTATTG
Star-RCAGGTGGTTGGCGAACTCTATC
P450scc-FTGCTGCGGGCTGAAGTCC
P450scc-RTGTCTCCTTGATGCTGGCTTTG
3β-Hsd-FCAAGGTGACAGTGTTGGAAGGAG
3β-Hsd-RAATGATGGCAGCAGTATGGATGAC
17β-Hsd-FGTGGTTATGAGCAAGCCCTGAG
17β-Hsd-RGAAGCGGTTCGTGGAGAAGTAG

