Influence of Mechanical Unloading on Articular Chondrocyte Dedifferentiation

 , and
, and 
Abstract
:
1. Introduction
2. Results
2.1. Stability of Reference Genes
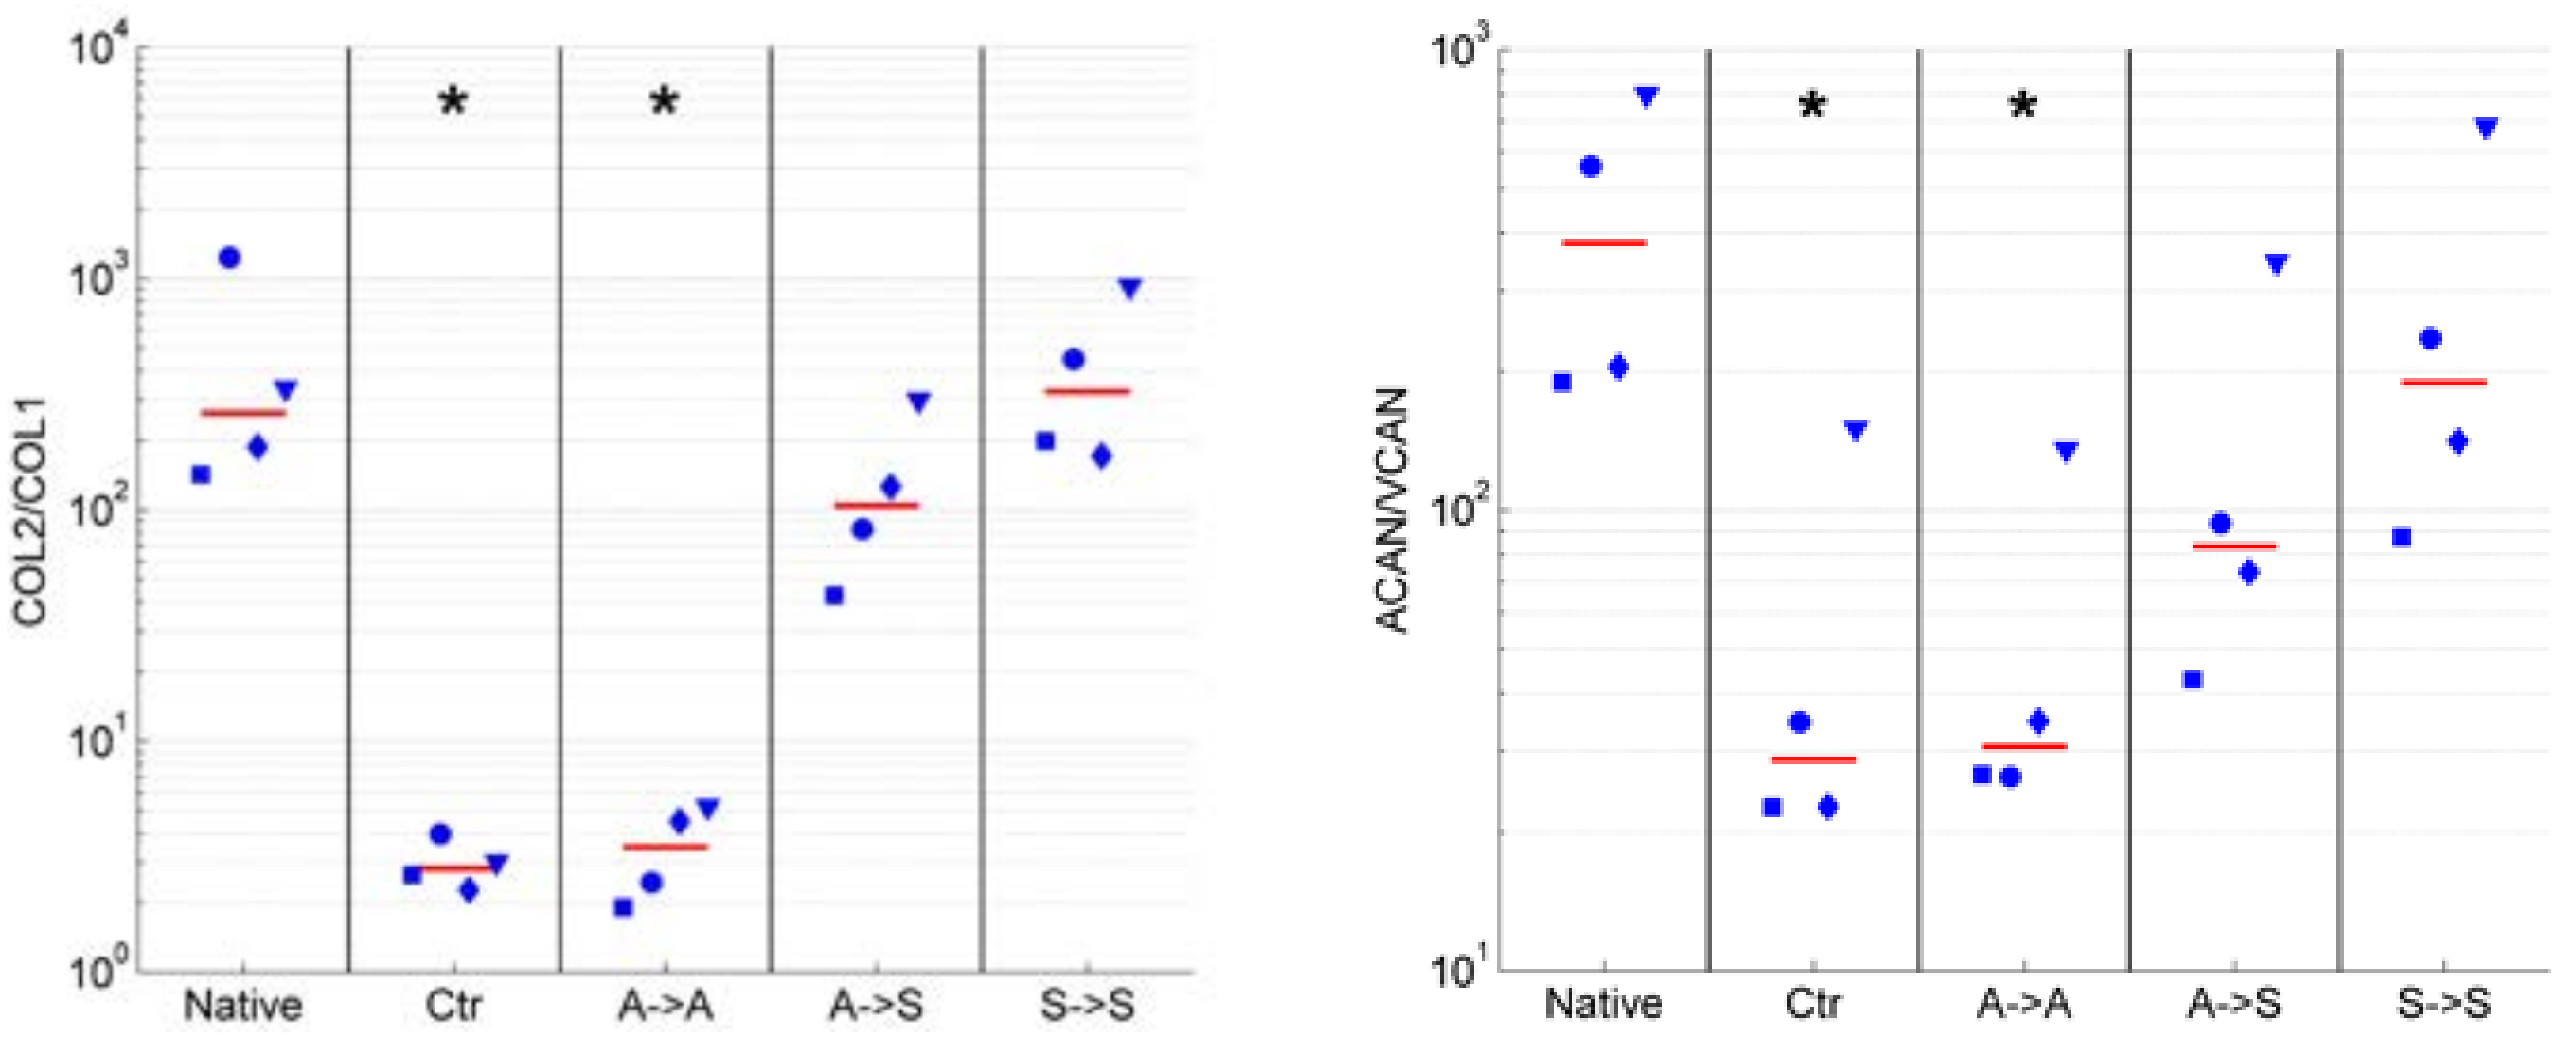
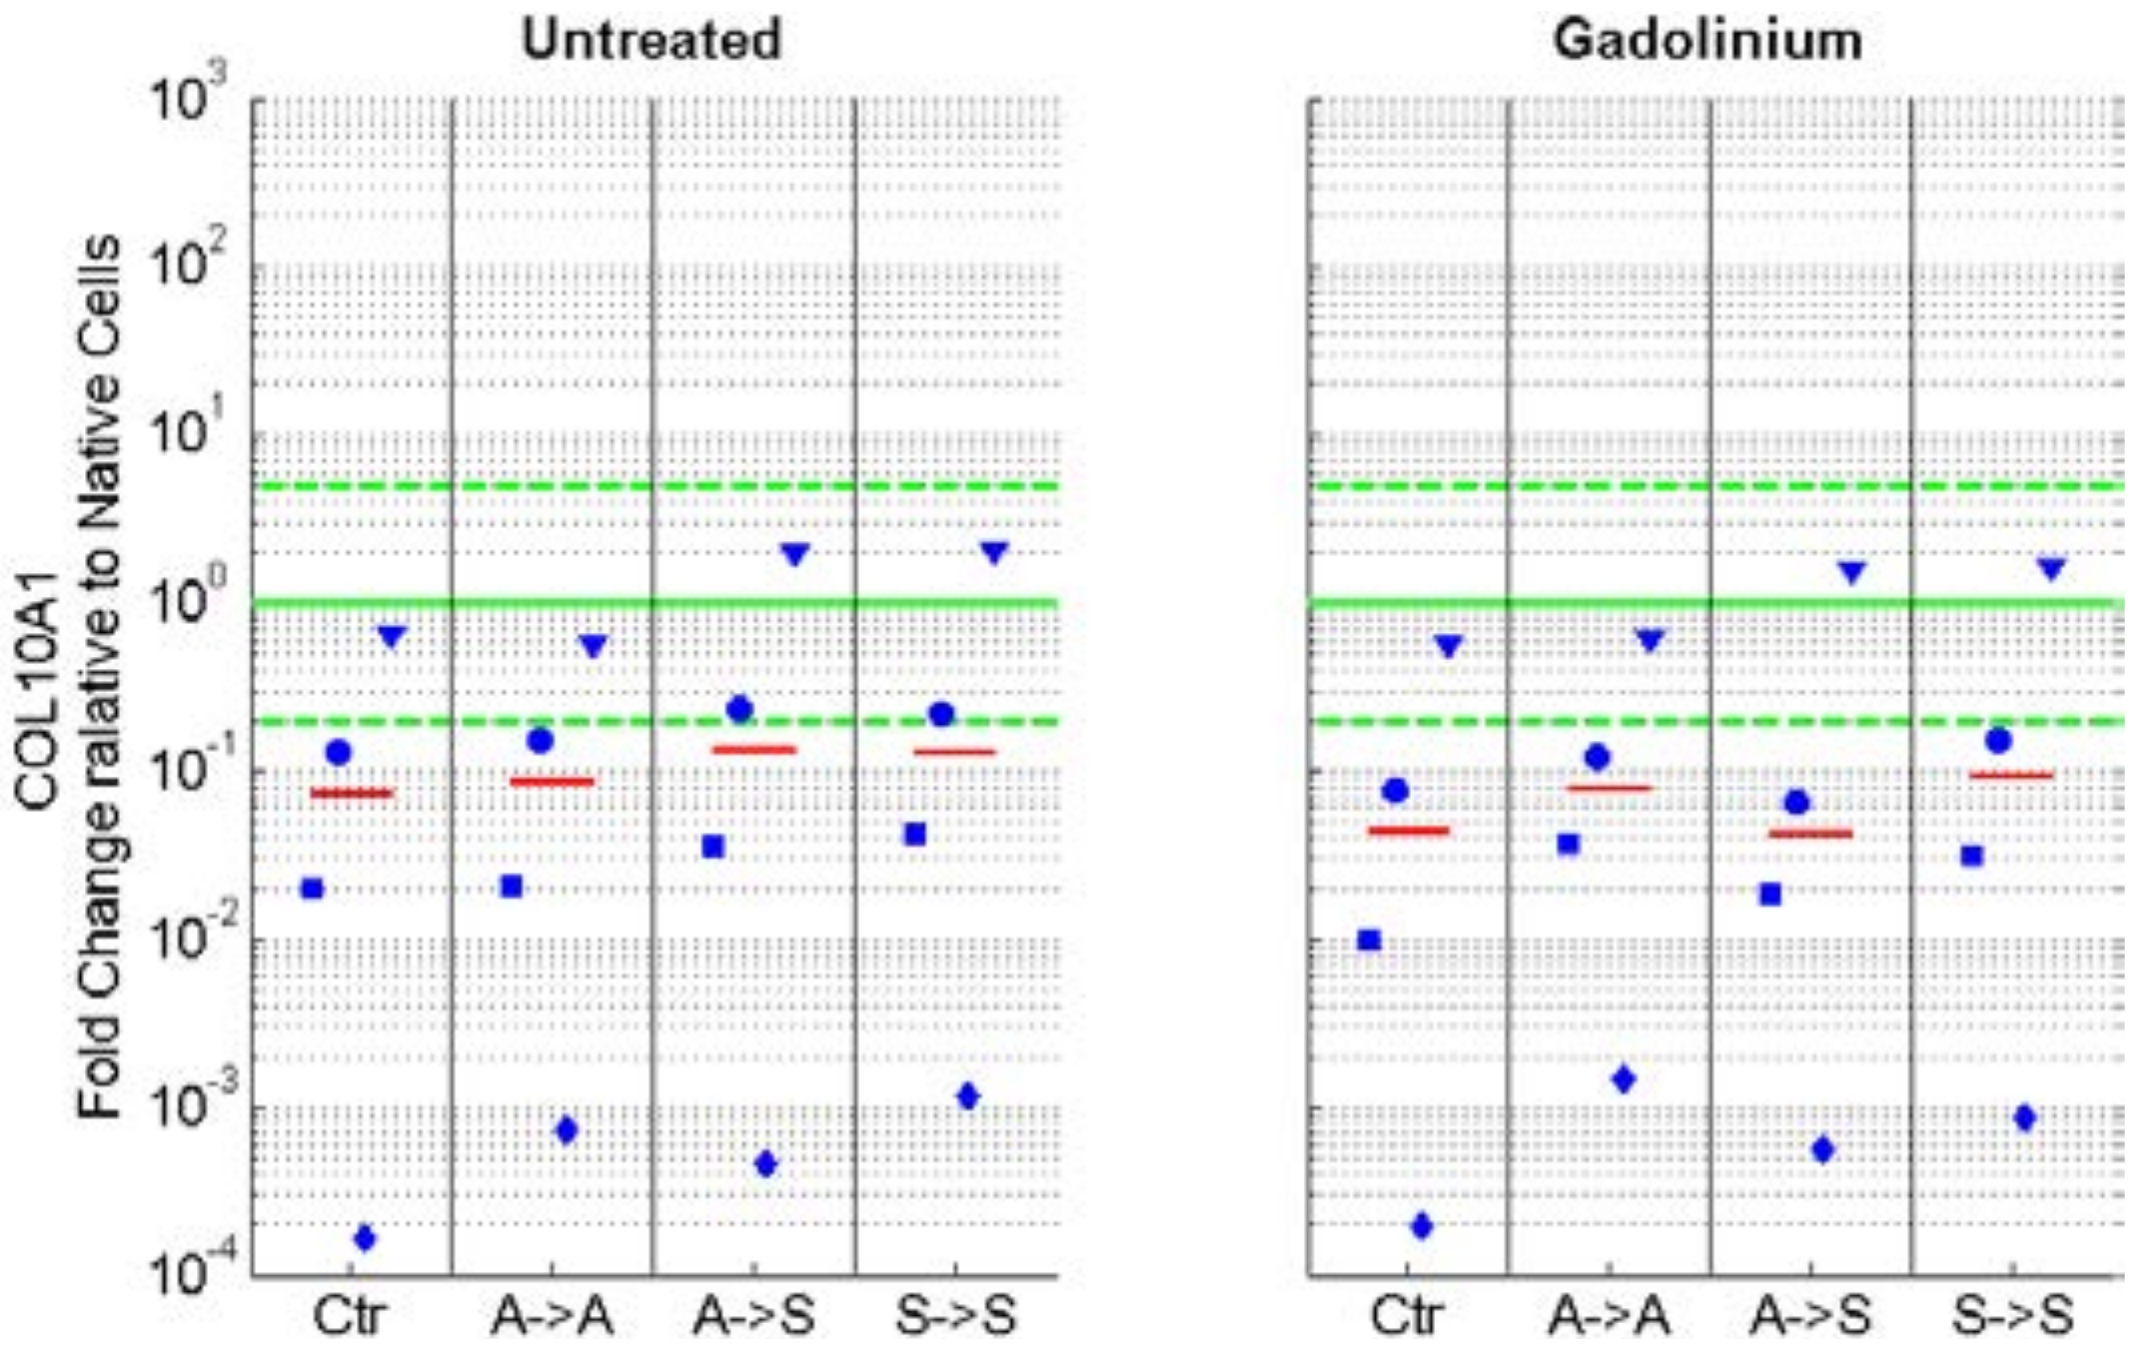
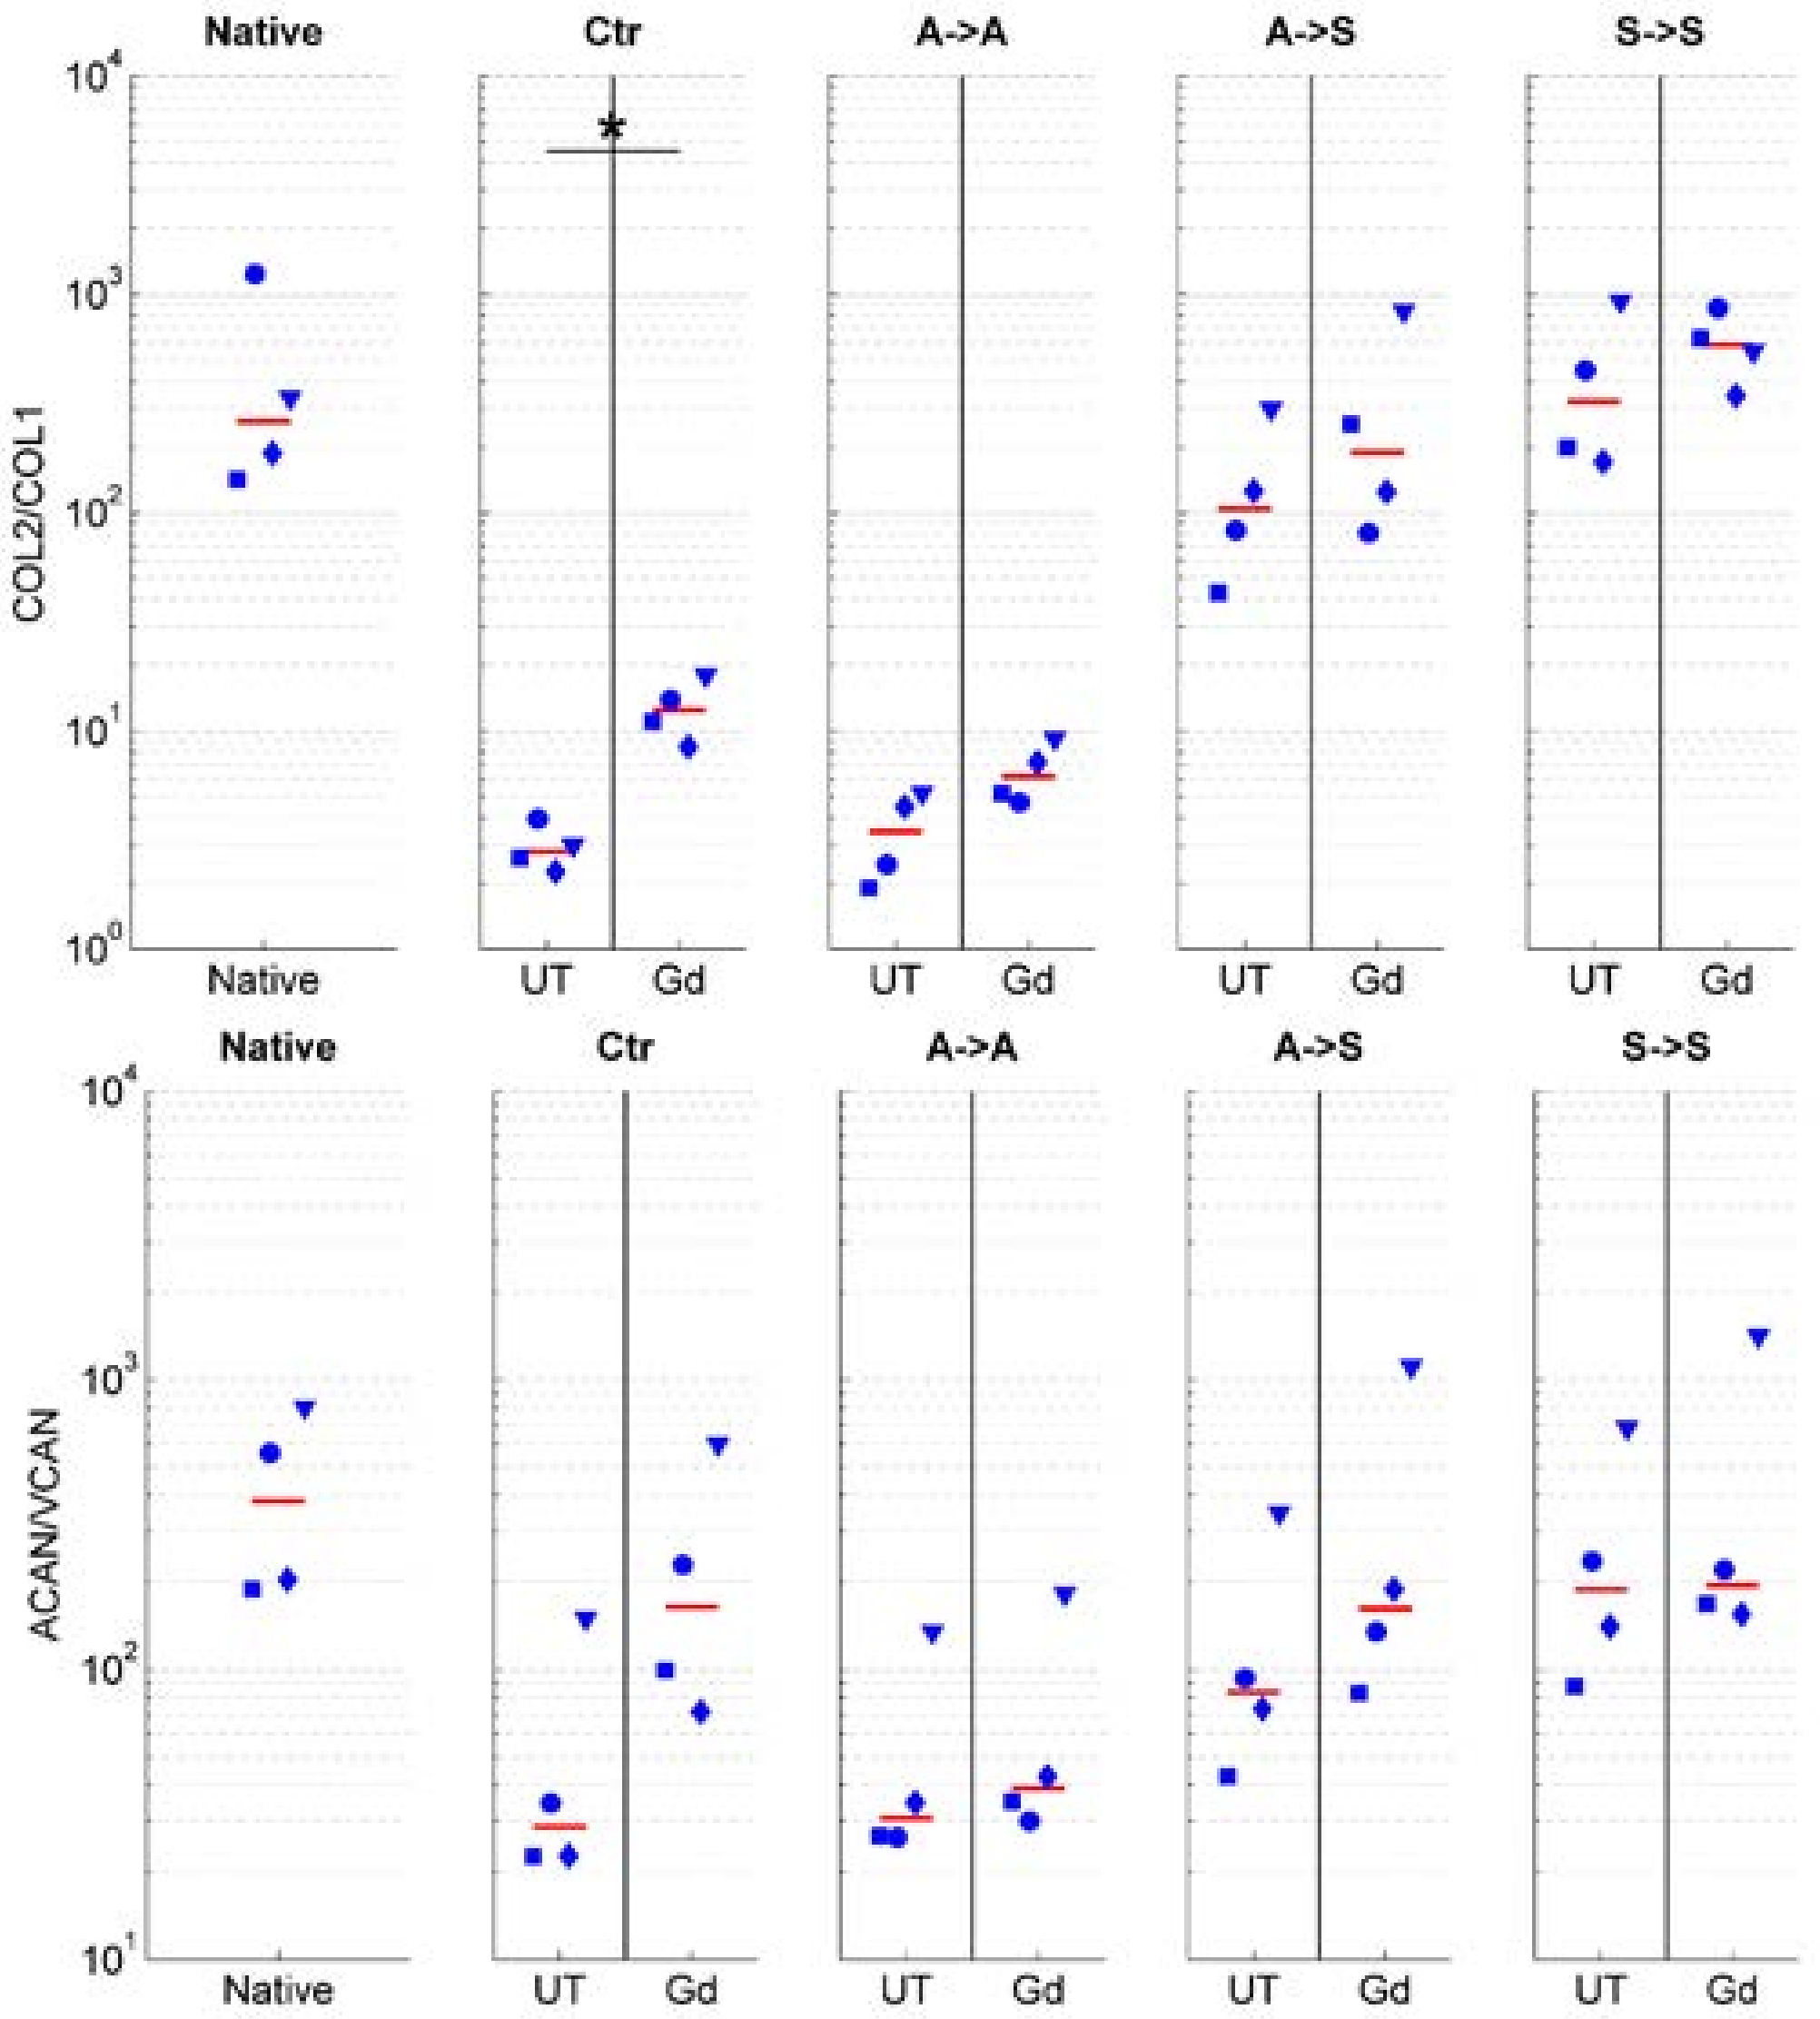
2.2. Phenotype
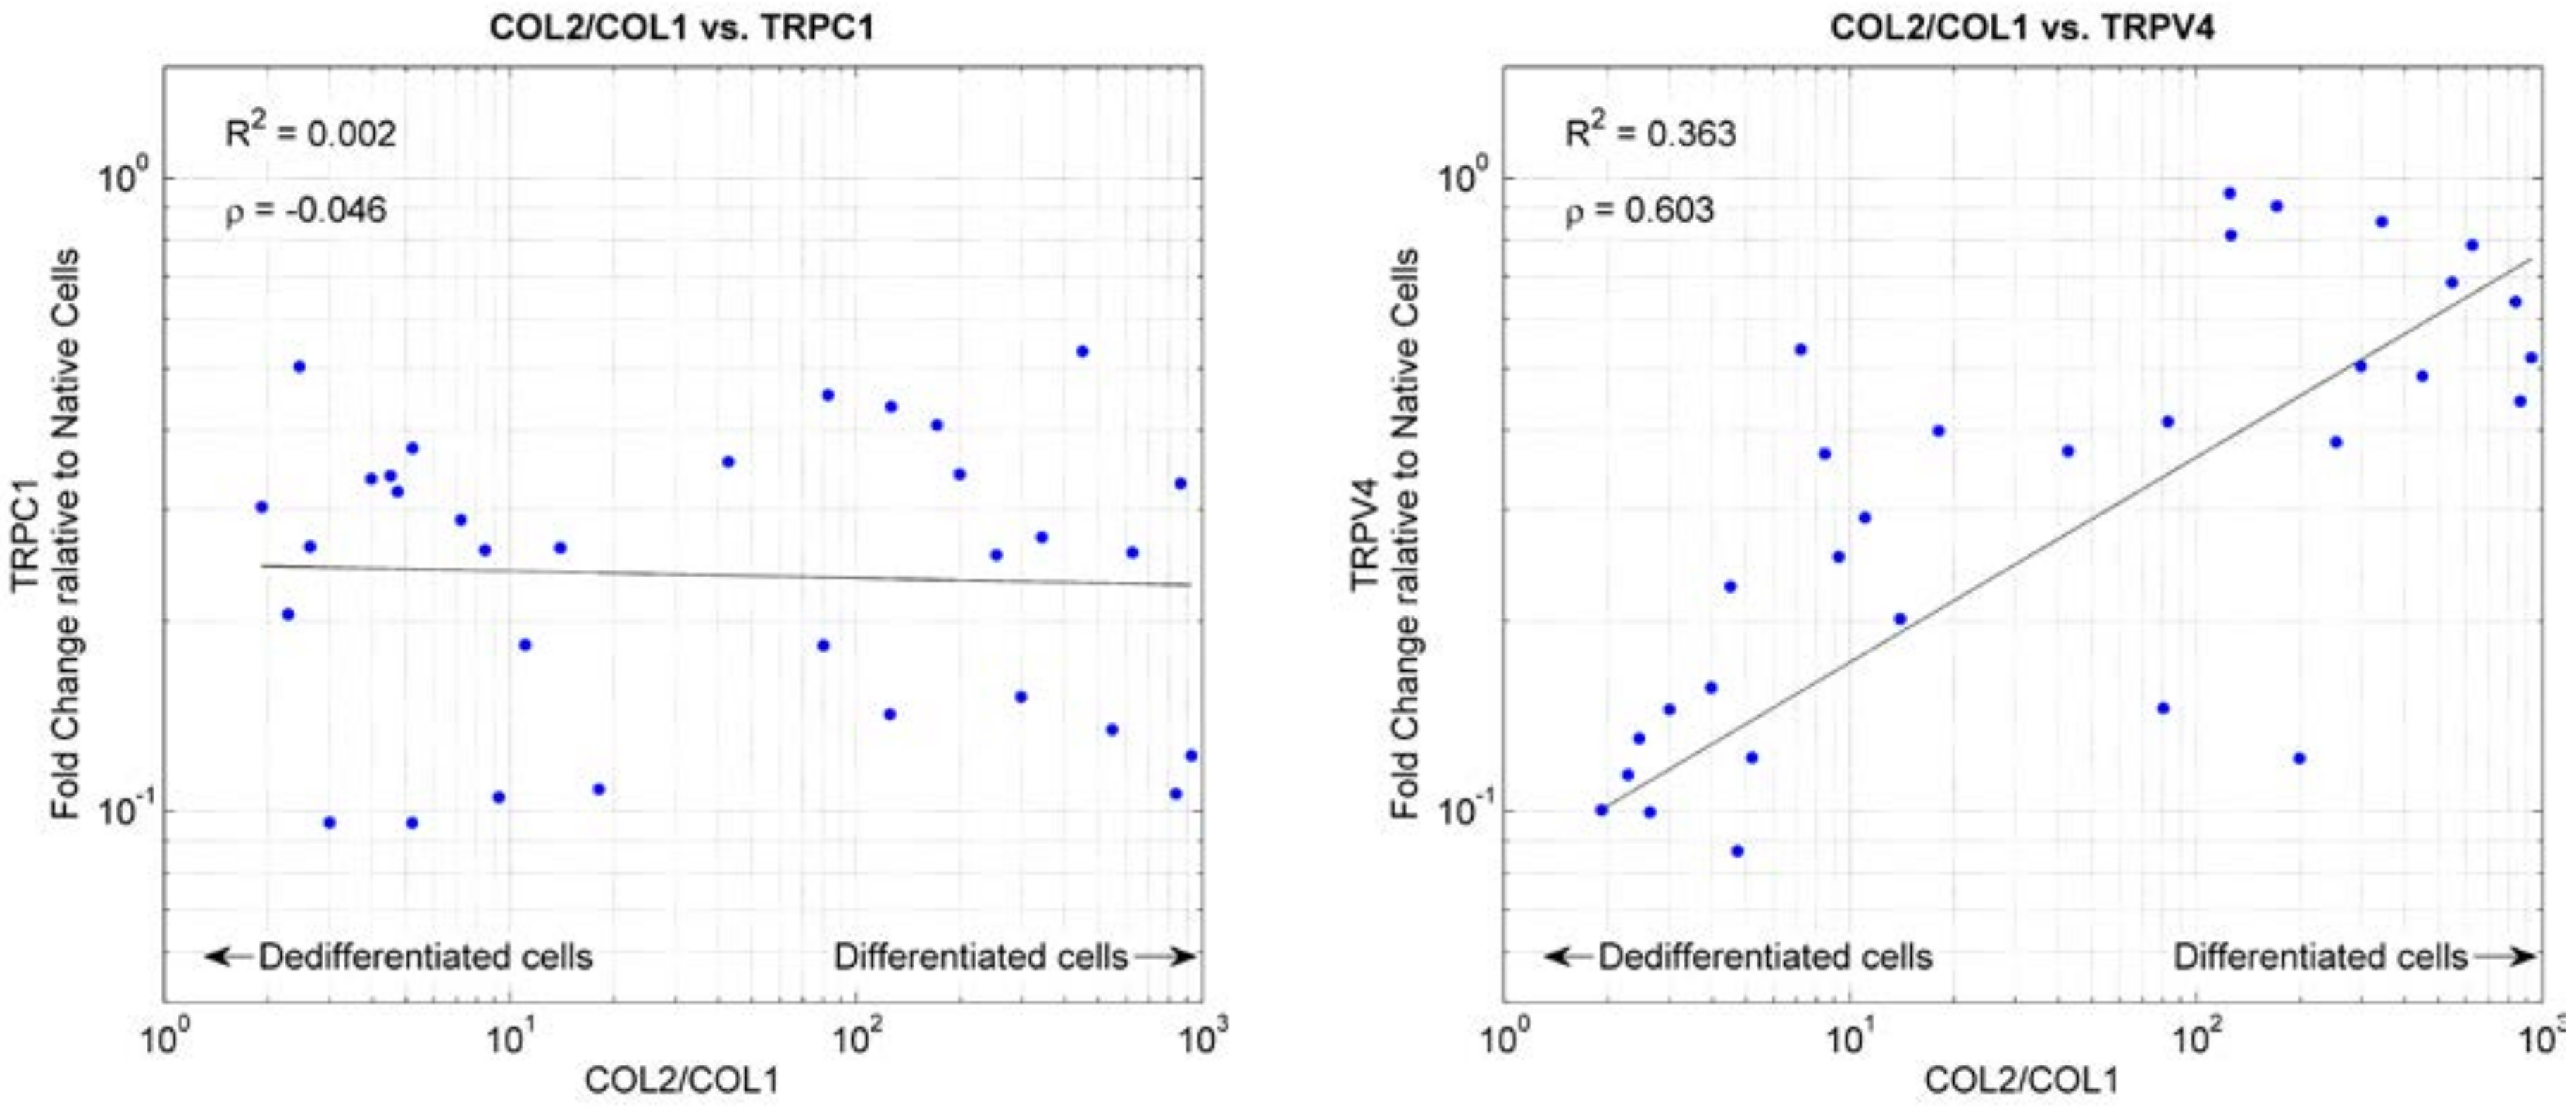
2.3. Ion Channels
3. Discussion
4. Materials and Methods
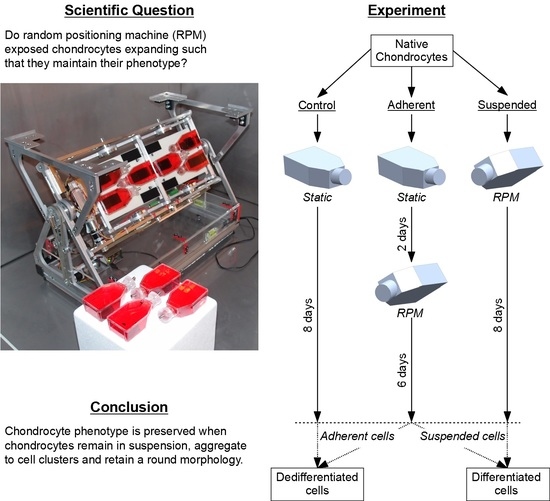
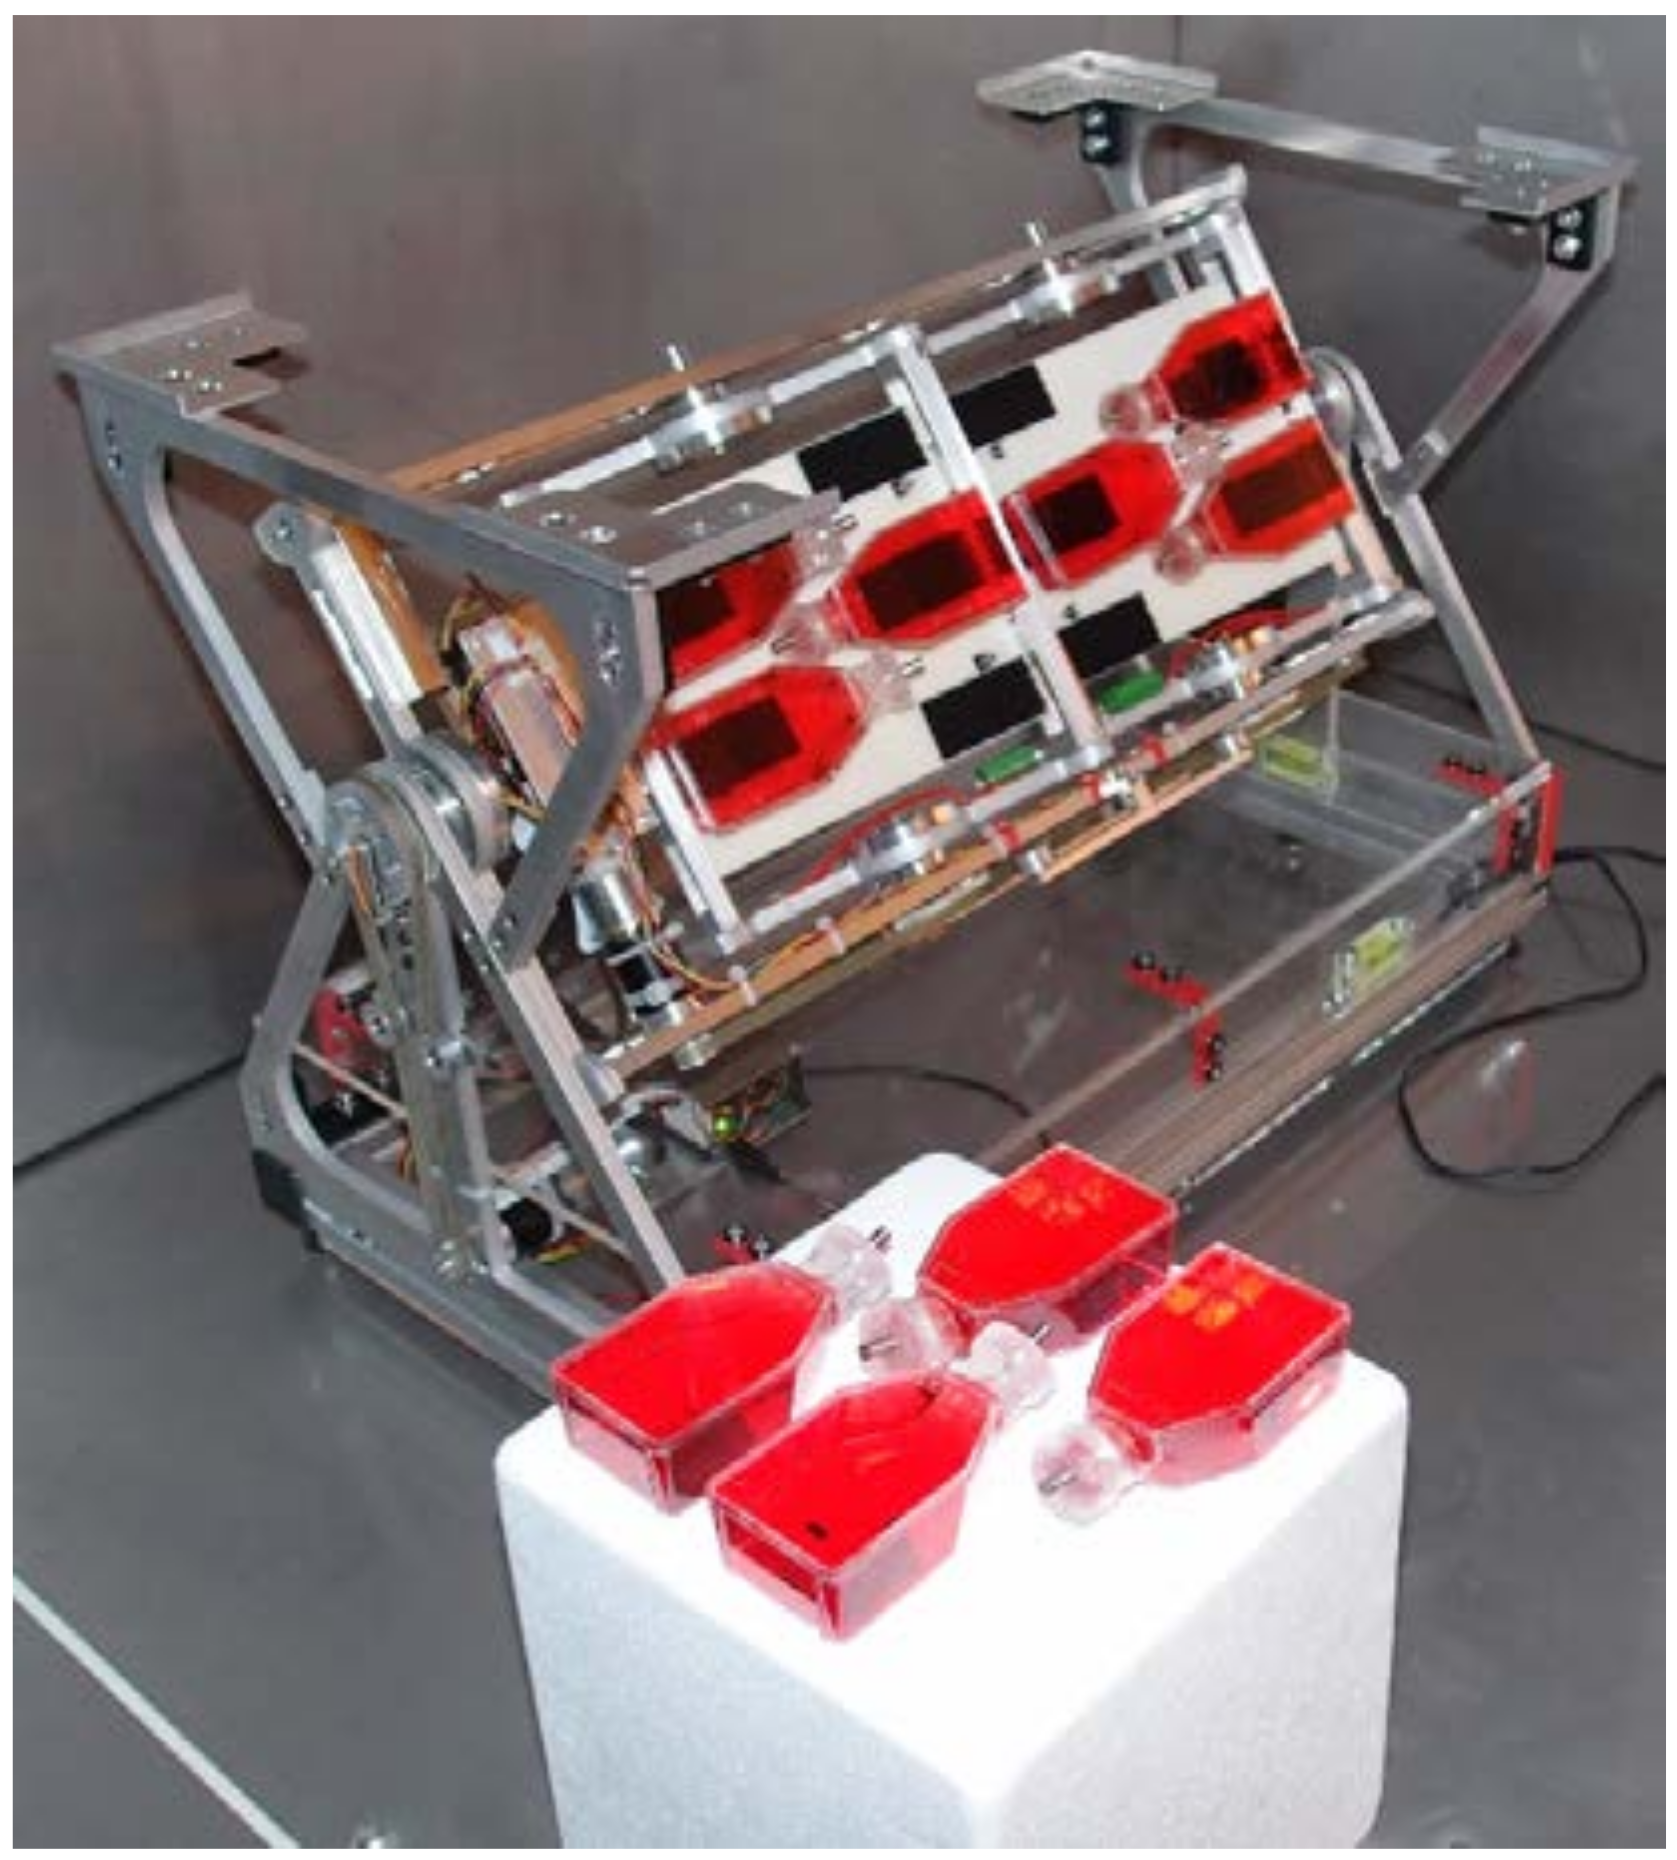
4.1. Random Positioning Machine (RPM)
4.2. Bovine Chondrocytes and Cell Culture
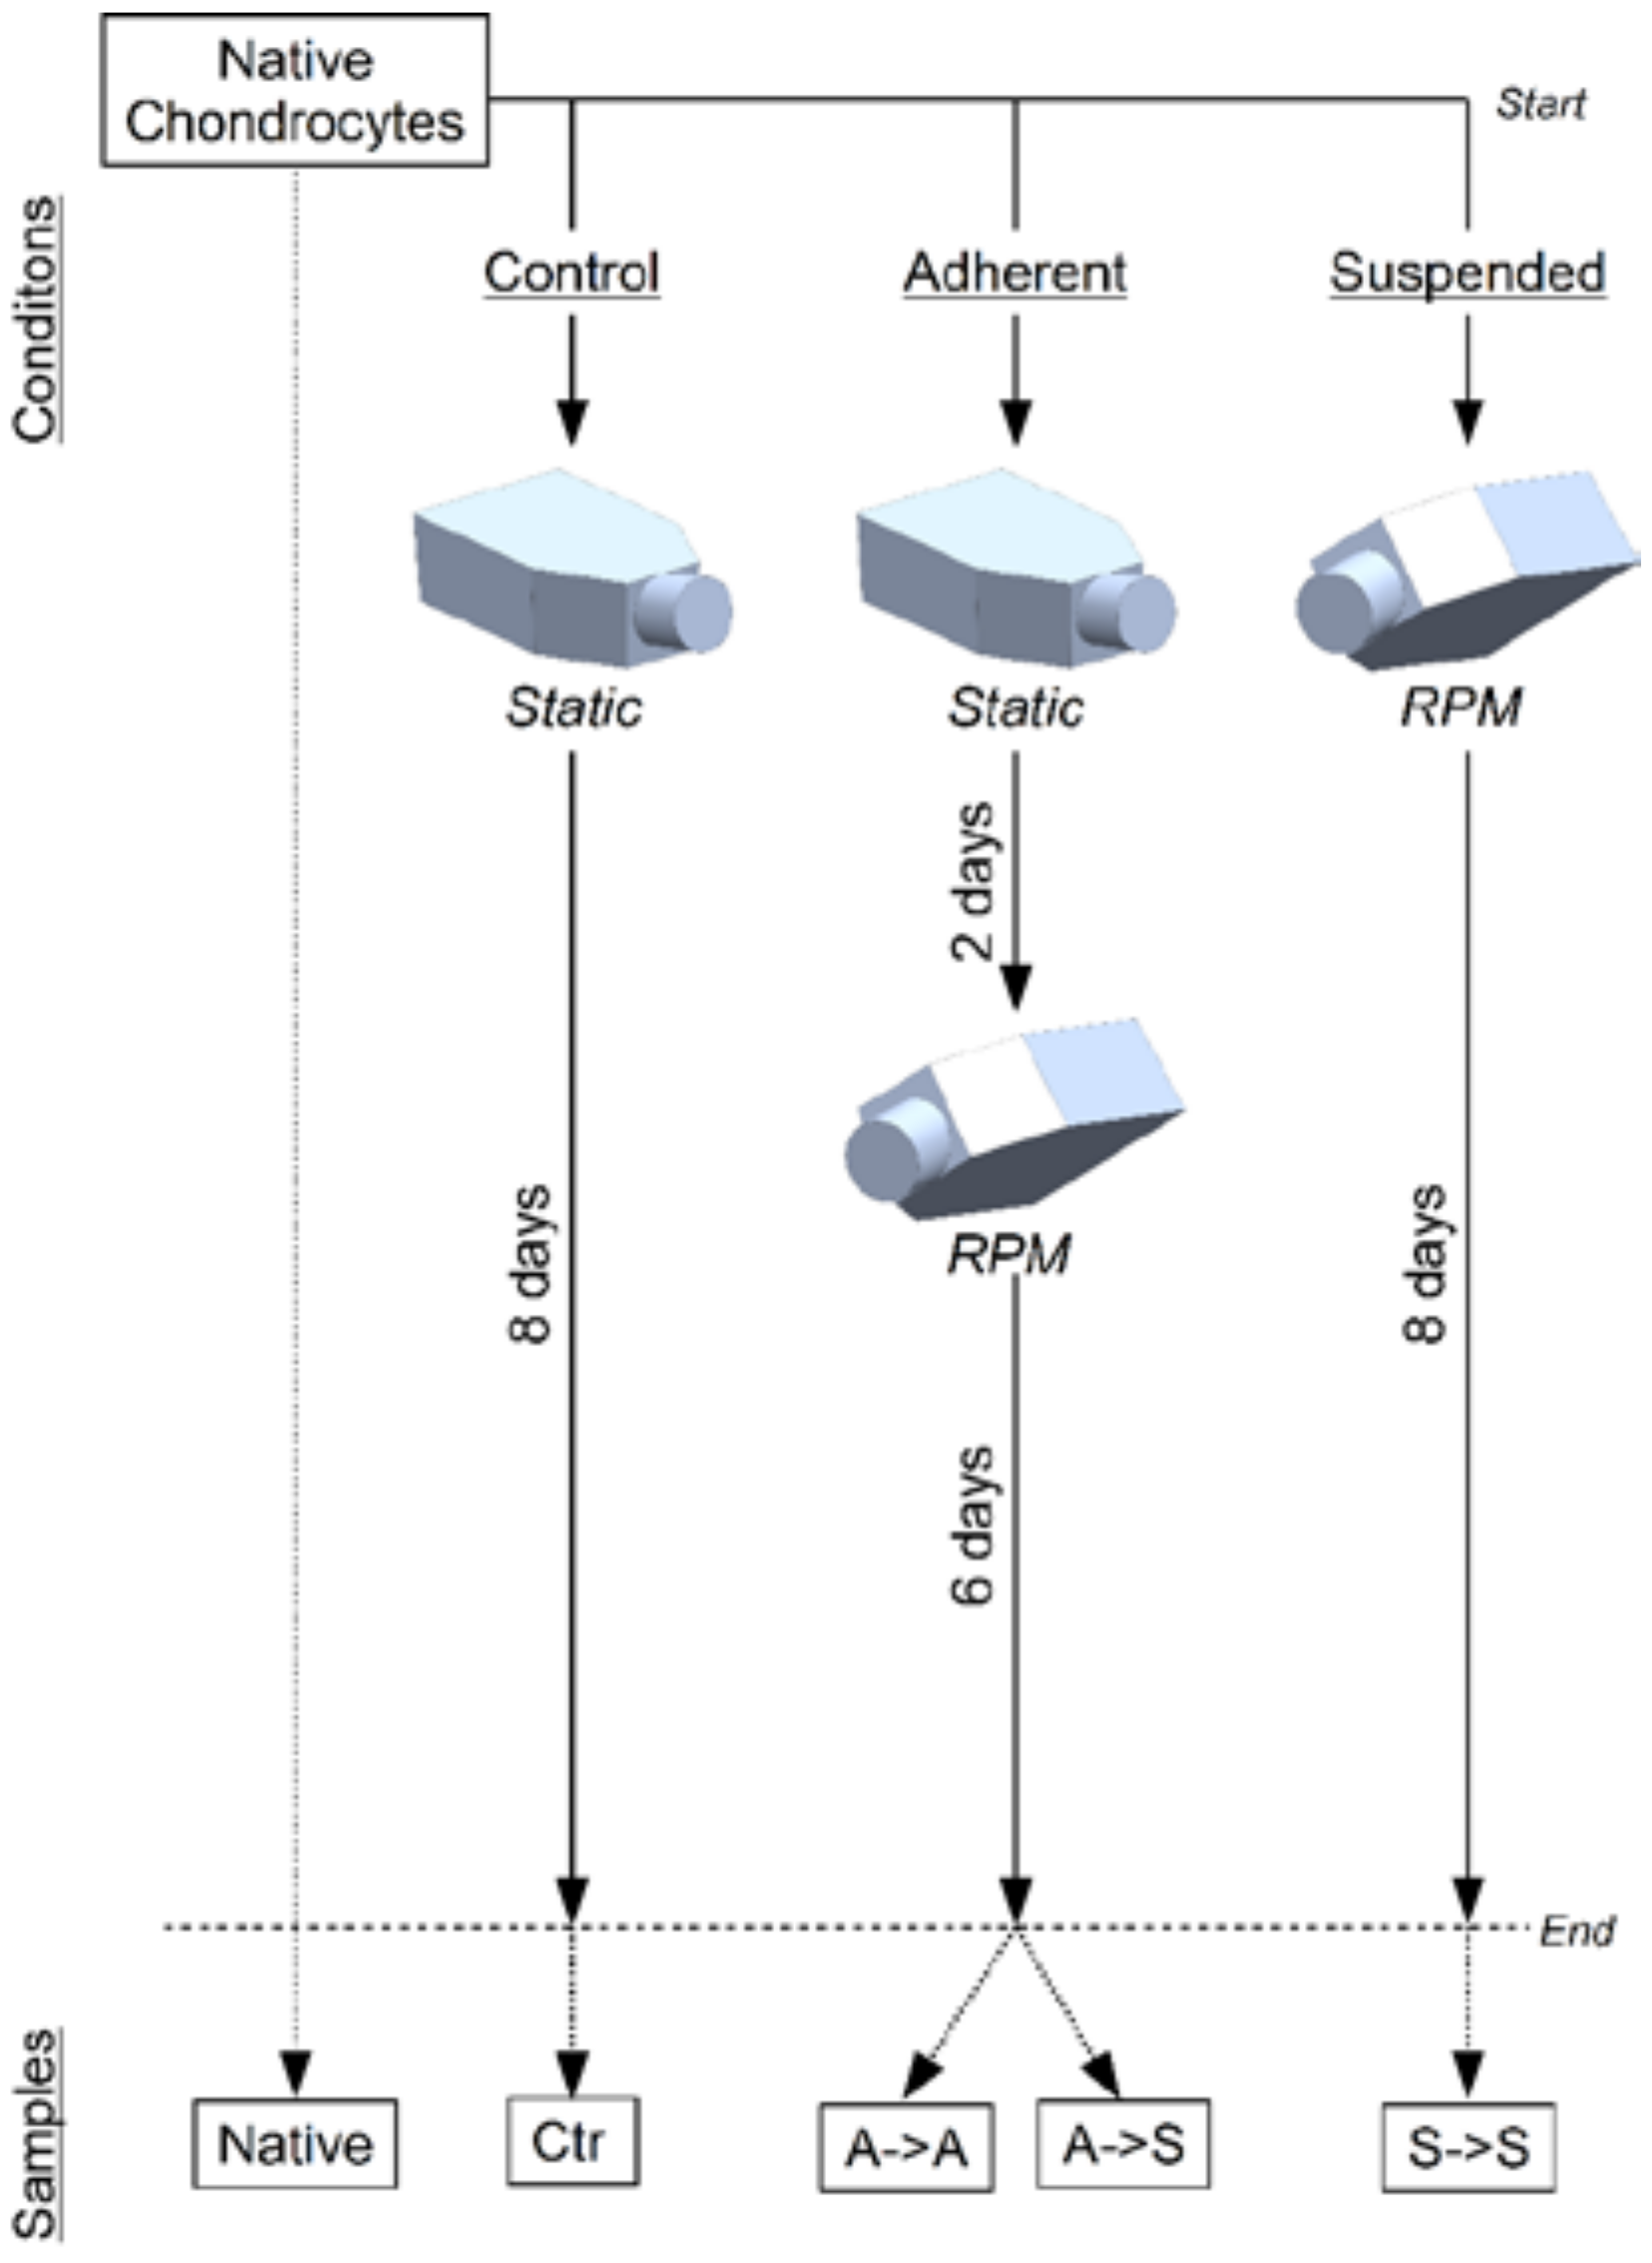
4.3. Experiment Design
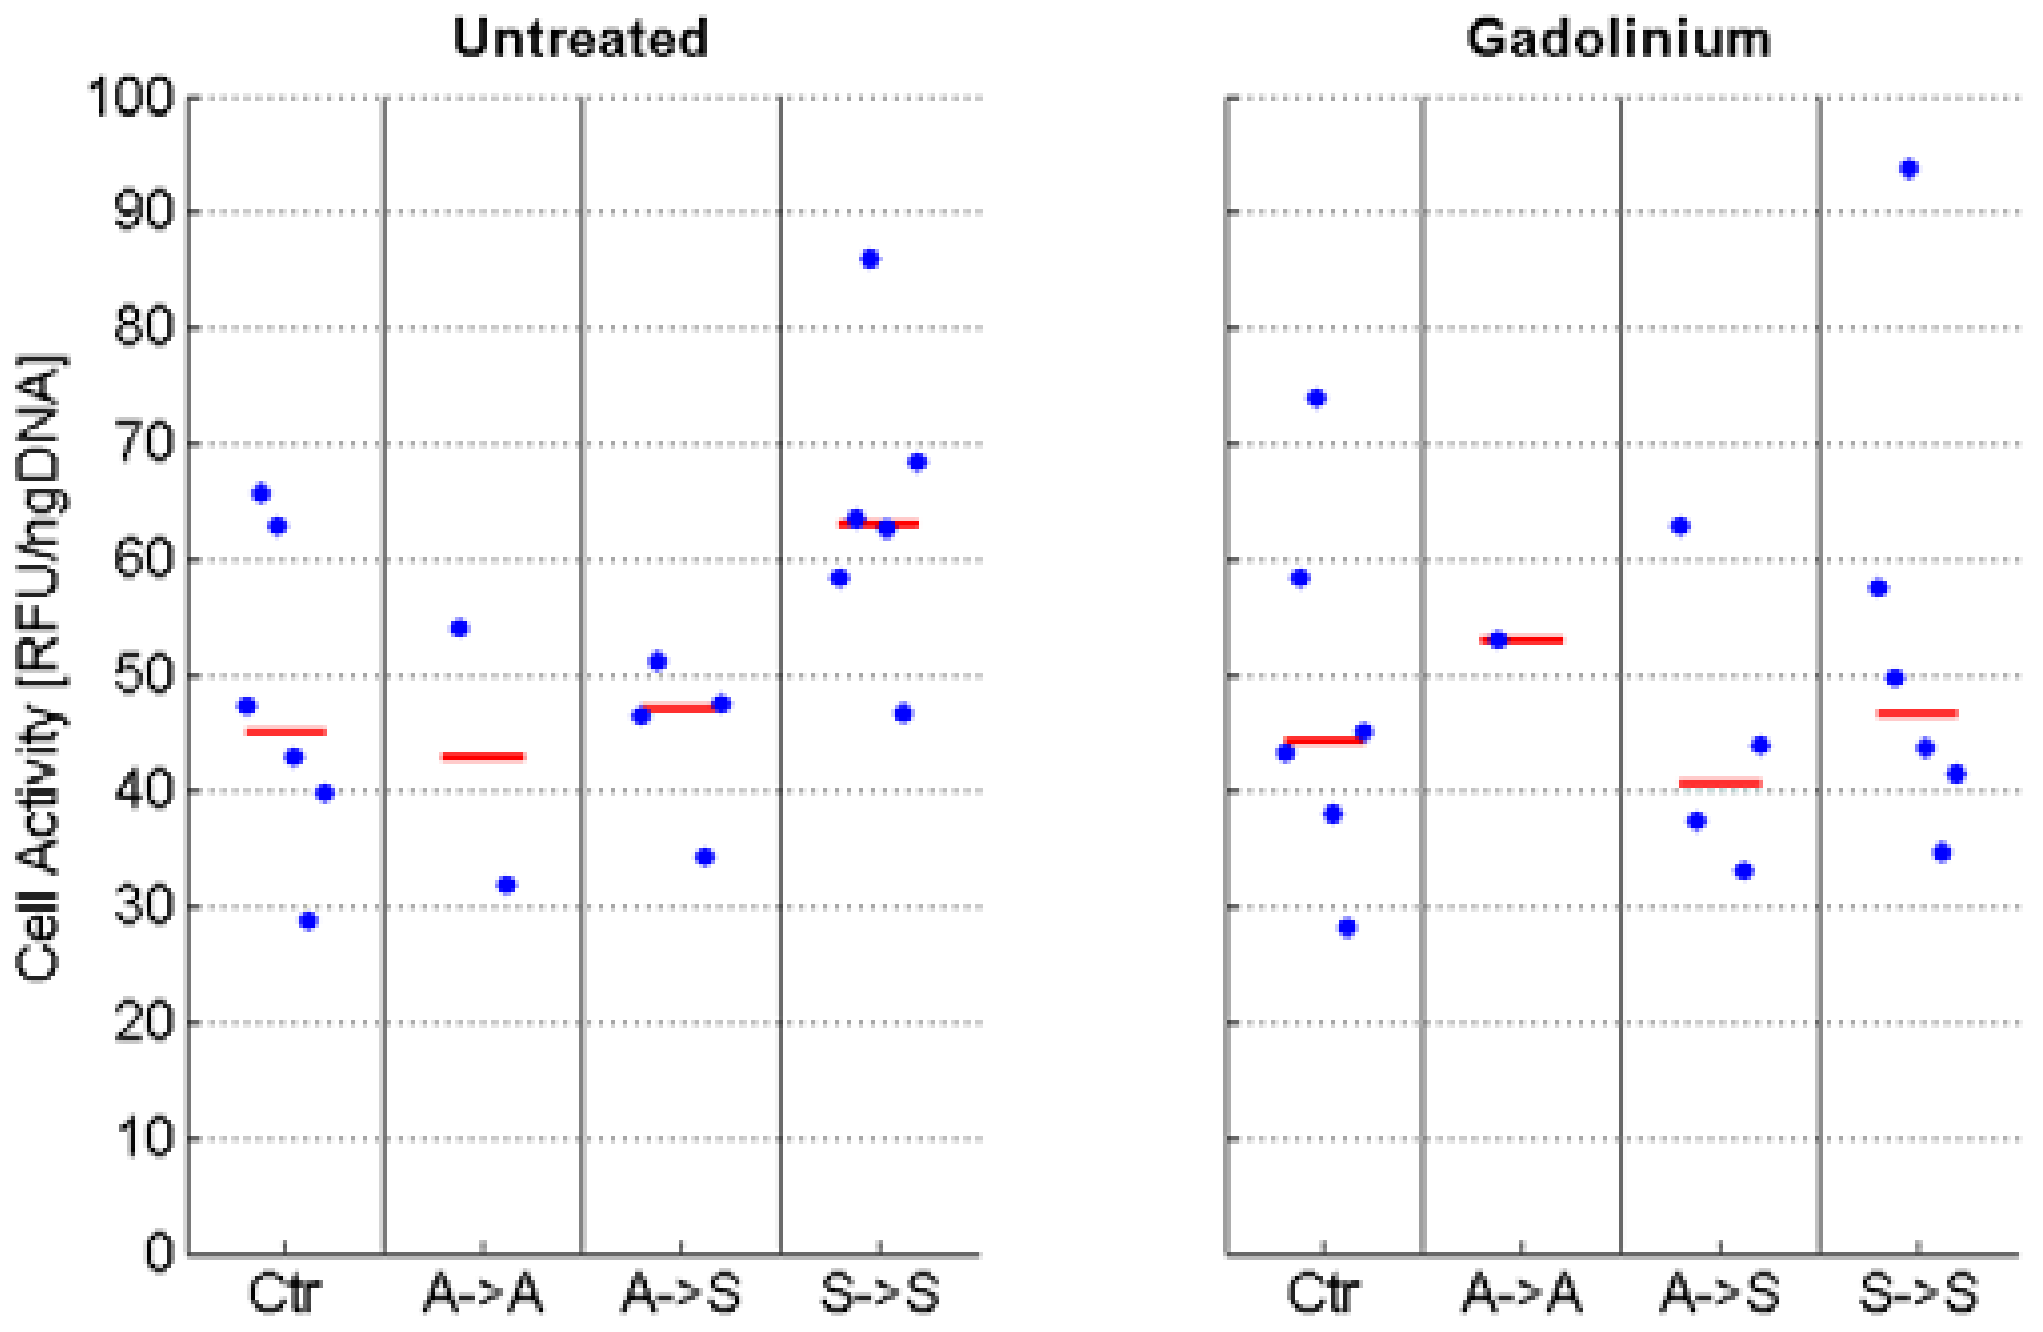
4.4. Cell Activity Assay
4.5. mRNA Gene Expression by qPCR
4.6. Statistics
5. Conclusions
Supplementary Materials
Author Contributions
Acknowledgments
Conflicts of Interest
References
- Hunziker, E.B. Articular cartilage repair: Basic science and clinical progress. A review of the current status and prospects. Osteoarthr. Cartil. 2002, 10, 432–463. [Google Scholar] [CrossRef] [PubMed]
- Smith, G.D.; Knutsen, G.; Richardson, J.B. A clinical review of cartilage repair techniques. J. Bone Jt. Surg. Br. 2005, 87, 445–449. [Google Scholar] [CrossRef] [PubMed]
- Redman, S.N.; Oldfield, S.F.; Archer, C.W. Current strategies for articular cartilage repair. Eur. Cells Mater. 2005, 9, 23–32. [Google Scholar] [CrossRef]
- Brittberg, M.; Lindahl, A.; Nilsson, A.; Ohlsson, C.; Isaksson, O.; Peterson, L. Treatment of deep cartilage defects in the knee with autologous chondrocyte transplantation. N. Engl. J. Med. 1994, 331, 889–895. [Google Scholar] [CrossRef] [PubMed]
- Brittberg, M.; Peterson, L.; Sjogren-Jansson, E.; Tallheden, T.; Lindahl, A. Articular cartilage engineering with autologous chondrocyte transplantation. A review of recent developments. J. Bone Jt. Surg. Am. Vol. 2003, 85-A (Suppl. 3), 109–115. [Google Scholar] [CrossRef]
- Marlovits, S.; Zeller, P.; Singer, P.; Resinger, C.; Vecsei, V. Cartilage repair: Generations of autologous chondrocyte transplantation. Eur. J. Radiol. 2006, 57, 24–31. [Google Scholar] [CrossRef] [PubMed]
- Khan, I.M.; Gilbert, S.J.; Singhrao, S.K.; Duance, V.C.; Archer, C.W. Cartilage integration: Evaluation of the reasons for failure of integration during cartilage repair. A review. Eur. Cells Mater. 2008, 16, 26–39. [Google Scholar] [CrossRef]
- Moseley, J.B., Jr.; Anderson, A.F.; Browne, J.E.; Mandelbaum, B.R.; Micheli, L.J.; Fu, F.; Erggelet, C. Long-term durability of autologous chondrocyte implantation: A multicenter, observational study in US patients. Am. J. Sports Med. 2010, 38, 238–246. [Google Scholar] [CrossRef] [PubMed]
- Browne, J.E.; Anderson, A.F.; Arciero, R.; Mandelbaum, B.; Moseley, J.B., Jr.; Micheli, L.J.; Fu, F.; Erggelet, C. Clinical outcome of autologous chondrocyte implantation at 5 years in US subjects. Clin. Orthop. Relat. Res. 2005, 436, 237–245. [Google Scholar] [CrossRef]
- Niemeyer, P.; Porichis, S.; Steinwachs, M.; Erggelet, C.; Kreuz, P.C.; Schmal, H.; Uhl, M.; Ghanem, N.; Sudkamp, N.P.; Salzmann, G. Long-term outcomes after first-generation autologous chondrocyte implantation for cartilage defects of the knee. Am. J. Sports Med. 2014, 42, 150–157. [Google Scholar] [CrossRef] [PubMed]
- Peterson, L.; Minas, T.; Brittberg, M.; Lindahl, A. Treatment of osteochondritis dissecans of the knee with autologous chondrocyte transplantation: Results at two to ten years. J. Bone Jt. Surg. Am. Vol. 2003, 85-A (Suppl. 2), 17–24. [Google Scholar] [CrossRef]
- Marlovits, S.; Hombauer, M.; Truppe, M.; Vecsei, V.; Schlegel, W. Changes in the ratio of type-I and type-II collagen expression during monolayer culture of human chondrocytes. J. Bone Jt. Surg. Br. 2004, 86, 286–295. [Google Scholar] [CrossRef]
- Schulze-Tanzil, G. Activation and dedifferentiation of chondrocytes: Implications in cartilage injury and repair. Ann. Anat. 2009, 191, 325–338. [Google Scholar] [CrossRef] [PubMed]
- Tekari, A.; Luginbuehl, R.; Hofstetter, W.; Egli, R.J. Chondrocytes expressing intracellular collagen type II enter the cell cycle and co-express collagen type I in monolayer culture. J. Orthop. Res. Off. Publ. Orthop. Res. Soc. 2014, 32, 1503–1511. [Google Scholar] [CrossRef] [PubMed]
- Barlič, A.; Drobnič, M.; Maličev, E.; Kregar-Velikonja, N. Quantitative analysis of gene expression in human articular chondrocytes assigned for autologous implantation. J. Orthop. Res. 2008, 26, 847–853. [Google Scholar] [CrossRef] [PubMed]
- Diaz-Romero, J.; Gaillard, J.P.; Grogan, S.P.; Nesic, D.; Trub, T.; Mainil-Varlet, P. Immunophenotypic analysis of human articular chondrocytes: Changes in surface markers associated with cell expansion in monolayer culture. J. Cell. Physiol. 2005, 202, 731–742. [Google Scholar] [CrossRef] [PubMed]
- Diaz-Romero, J.; Nesic, D.; Grogan, S.P.; Heini, P.; Mainil-Varlet, P. Immunophenotypic changes of human articular chondrocytes during monolayer culture reflect bona fide dedifferentiation rather than amplification of progenitor cells. J. Cell. Physiol. 2008, 214, 75–83. [Google Scholar] [CrossRef] [PubMed]
- Kang, S.W.; Yoo, S.P.; Kim, B.S. Effect of chondrocyte passage number on histological aspects of tissue-engineered cartilage. Biomed. Mater. Eng. 2007, 17, 269–276. [Google Scholar] [PubMed]
- Lin, Z.; Fitzgerald, J.B.; Xu, J.; Willers, C.; Wood, D.; Grodzinsky, A.J.; Zheng, M.H. Gene expression profiles of human chondrocytes during passaged monolayer cultivation. J. Orthop. Res. Off. Publ. Orthop. Res. Soc. 2008, 26, 1230–1237. [Google Scholar] [CrossRef] [PubMed]
- von der Mark, K.; Gauss, V.; von der Mark, H.; Muller, P. Relationship between cell shape and type of collagen synthesised as chondrocytes lose their cartilage phenotype in culture. Nature 1977, 267, 531–532. [Google Scholar] [CrossRef] [PubMed]
- Martin, I.; Jakob, M.; Schäfer, D.; Dick, W.; Spagnoli, G.; Heberer, M. Quantitative analysis of gene expression in human articular cartilage from normal and osteoarthritic joints. Osteoarthr. Cartil. 2001, 9, 112–118. [Google Scholar] [CrossRef] [PubMed]
- Benya, P.D.; Shaffer, J.D. Dedifferentiated chondrocytes reexpress the differentiated collagen phenotype when cultured in agarose gels. Cell 1982, 30, 215–224. [Google Scholar] [CrossRef]
- Bonaventure, J.; Kadhom, N.; Cohen-Solal, L.; Ng, K.H.; Bourguignon, J.; Lasselin, C.; Freisinger, P. Reexpression of cartilage-specific genes by dedifferentiated human articular chondrocytes cultured in alginate beads. Exp. Cell Res. 1994, 212, 97–104. [Google Scholar] [CrossRef] [PubMed]
- Grunder, T.; Gaissmaier, C.; Fritz, J.; Stoop, R.; Hortschansky, P.; Mollenhauer, J.; Aicher, W.K. Bone morphogenetic protein (BMP)-2 enhances the expression of type II collagen and aggrecan in chondrocytes embedded in alginate beads. Osteoarthr. Cartil. OARS Osteoarthr. Res. Soc. 2004, 12, 559–567. [Google Scholar] [CrossRef] [PubMed]
- Caron, M.M.; Emans, P.J.; Coolsen, M.M.; Voss, L.; Surtel, D.A.; Cremers, A.; van Rhijn, L.W.; Welting, T.J. Redifferentiation of dedifferentiated human articular chondrocytes: Comparison of 2D and 3D cultures. Osteoarthr. Cartil. OARS Osteoarthr. Res. Soc. 2012, 20, 1170–1178. [Google Scholar] [CrossRef] [PubMed]
- Gibson, G.J.; Schor, S.L.; Grant, M.E. Effects of matrix macromolecules on chondrocyte gene expression: Synthesis of a low molecular weight collagen species by cells cultured within collagen gels. J. Cell Biol. 1982, 93, 767–774. [Google Scholar] [CrossRef] [PubMed]
- Galois, L.; Hutasse, S.; Cortial, D.; Rousseau, C.F.; Grossin, L.; Ronziere, M.C.; Herbage, D.; Freyria, A.M. Bovine chondrocyte behaviour in three-dimensional type I collagen gel in terms of gel contraction, proliferation and gene expression. Biomaterials 2006, 27, 79–90. [Google Scholar] [CrossRef] [PubMed]
- Tekari, A.; Luginbuehl, R.; Hofstetter, W.; Egli, R.J. Transforming growth factor beta signaling is essential for the autonomous formation of cartilage-like tissue by expanded chondrocytes. PLoS ONE 2015, 10, e0120857. [Google Scholar] [CrossRef] [PubMed] [Green Version]
- Freyria, A.M.; Mallein-Gerin, F. Chondrocytes or adult stem cells for cartilage repair: The indisputable role of growth factors. Injury 2012, 43, 259–265. [Google Scholar] [CrossRef] [PubMed]
- Jakob, M.; Demarteau, O.; Schafer, D.; Hintermann, B.; Dick, W.; Heberer, M.; Martin, I. Specific growth factors during the expansion and redifferentiation of adult human articular chondrocytes enhance chondrogenesis and cartilaginous tissue formation in vitro. J. Cell. Biochem. 2001, 81, 368–377. [Google Scholar] [CrossRef]
- Vanwanseele, B.; Lucchinetti, E.; Stussi, E. The effects of immobilization on the characteristics of articular cartilage: Current concepts and future directions. Osteoarthr. Cartil. OARS Osteoarthr. Res. Soc. 2002, 10, 408–419. [Google Scholar] [CrossRef] [PubMed]
- Jortikka, M.O.; Inkinen, R.I.; Tammi, M.I.; Parkkinen, J.J.; Haapala, J.; Kiviranta, I.; Helminen, H.J.; Lammi, M.J. Immobilisation causes longlasting matrix changes both in the immobilised and contralateral joint cartilage. Ann. Rheum. Dis. 1997, 56, 255–261. [Google Scholar] [CrossRef] [PubMed]
- Guilak, F.; Fermor, B.; Keefe, F.J.; Kraus, V.B.; Olson, S.A.; Pisetsky, D.S.; Setton, L.A.; Weinberg, J.B. The role of biomechanics and inflammation in cartilage injury and repair. Clin. Orthop. Relat. Res. 2004, 17–26. [Google Scholar] [CrossRef]
- Meinert, C.; Schrobback, K.; Hutmacher, D.W.; Klein, T.J. A novel bioreactor system for biaxial mechanical loading enhances the properties of tissue-engineered human cartilage. Sci. Rep. 2017, 7, 16997. [Google Scholar] [CrossRef] [PubMed]
- Li, K.; Zhang, C.; Qiu, L.; Gao, L.; Zhang, X. Advances in Application of Mechanical Stimuli in Bioreactors for Cartilage Tissue Engineering. Tissue Eng. Part B Rev. 2017, 23, 399–411. [Google Scholar] [CrossRef] [PubMed]
- Bougault, C.; Aubert-Foucher, E.; Paumier, A.; Perrier-Groult, E.; Huot, L.; Hot, D.; Duterque-Coquillaud, M.; Mallein-Gerin, F. Dynamic compression of chondrocyte-agarose constructs reveals new candidate mechanosensitive genes. PLoS ONE 2012, 7, e36964. [Google Scholar] [CrossRef] [PubMed]
- Brungs, S.; Egli, M.; Wuest, S.L.; Christianen, P.C.M.; van Loon, J.J.W.A.; Ngo Anh, T.J.; Hemmersbach, R. Facilities for Simulation of Microgravity in the ESA Ground-Based Facility Programme. Microgravity Sci. Technol. 2016. [Google Scholar] [CrossRef]
- Freed, L.E.; Langer, R.; Martin, I.; Pellis, N.R.; Vunjak-Novakovic, G. Tissue engineering of cartilage in space. Proc. Natl. Acad. Sci. USA 1997, 94, 13885–13890. [Google Scholar] [CrossRef] [PubMed]
- Stamenkovic, V.; Keller, G.; Nesic, D.; Cogoli, A.; Grogan, S.P. Neocartilage formation in 1 g, simulated, and microgravity environments: Implications for tissue engineering. Tissue Eng. Part A 2010, 16, 1729–1736. [Google Scholar] [CrossRef] [PubMed]
- Aleshcheva, G.; Sahana, J.; Ma, X.; Hauslage, J.; Hemmersbach, R.; Egli, M.; Infanger, M.; Bauer, J.; Grimm, D. Changes in morphology, gene expression and protein content in chondrocytes cultured on a random positioning machine. PLoS ONE 2013, 8, e79057. [Google Scholar] [CrossRef] [PubMed]
- Ulbrich, C.; Westphal, K.; Pietsch, J.; Winkler, H.D.; Leder, A.; Bauer, J.; Kossmehl, P.; Grosse, J.; Schoenberger, J.; Infanger, M.; et al. Characterization of human chondrocytes exposed to simulated microgravity. Cell. Physiol. Biochem. Int. J. Exp. Cell. Physiol. Biochem. Pharmacol. 2010, 25, 551–560. [Google Scholar] [CrossRef] [PubMed]
- Aleshcheva, G.; Bauer, J.; Hemmersbach, R.; Egli, M.; Wehland, M.; Grimm, D. Tissue Engineering of Cartilage on Ground-Based Facilities. Microgravity Sci. Technol. 2016, 28, 237–245. [Google Scholar] [CrossRef]
- Begley, C.M.; Kleis, S.J. The fluid dynamic and shear environment in the NASA/JSC rotating-wall perfused-vessel bioreactor. Biotechnol. Bioeng. 2000, 70, 32–40. [Google Scholar] [CrossRef]
- Hammond, T.G.; Hammond, J.M. Optimized suspension culture: The rotating-wall vessel. Am. J. Physiol. Renal Physiol. 2001, 281, F12–F25. [Google Scholar] [CrossRef] [PubMed]
- Marlovits, S.; Tichy, B.; Truppe, M.; Gruber, D.; Schlegel, W. Collagen expression in tissue engineered cartilage of aged human articular chondrocytes in a rotating bioreactor. Int. J. Artif. Organs 2003, 26, 319–330. [Google Scholar] [CrossRef] [PubMed]
- Marlovits, S.; Tichy, B.; Truppe, M.; Gruber, D.; Vecsei, V. Chondrogenesis of aged human articular cartilage in a scaffold-free bioreactor. Tissue Eng. 2003, 9, 1215–1226. [Google Scholar] [CrossRef] [PubMed]
- Wuest, S.L.; Richard, S.; Kopp, S.; Grimm, D.; Egli, M. Simulated Microgravity: Critical Review on the Use of Random Positioning Machines for Mammalian Cell Culture. BioMed Res. Int. 2015, 2015, 8. [Google Scholar] [CrossRef] [PubMed]
- Herranz, R.; Anken, R.; Boonstra, J.; Braun, M.; Christianen, P.C.; de Geest, M.; Hauslage, J.; Hilbig, R.; Hill, R.J.; Lebert, M.; et al. Ground-based facilities for simulation of microgravity: Organism-specific recommendations for their use, and recommended terminology. Astrobiology 2013, 13, 1–17. [Google Scholar] [CrossRef] [PubMed] [Green Version]
- van Loon, J.J.W.A. Some history and use of the random positioning machine, RPM, in gravity related research. Adv. Space Res. 2007, 39, 1161–1165. [Google Scholar] [CrossRef]
- Grimm, D.; Wehland, M.; Pietsch, J.; Aleshcheva, G.; Wise, P.; van Loon, J.; Ulbrich, C.; Magnusson, N.E.; Infanger, M.; Bauer, J. Growing tissues in real and simulated microgravity: New methods for tissue engineering. Tissue Eng. Part B Rev. 2014, 20, 555–566. [Google Scholar] [CrossRef] [PubMed]
- Hdud, I.M.; El-Shafei, A.A.; Loughna, P.; Barrett-Jolley, R.; Mobasheri, A. Expression of Transient Receptor Potential Vanilloid (TRPV) Channels in Different Passages of Articular Chondrocytes. Int. J. Mol. Sci. 2012, 13, 4433–4445. [Google Scholar] [CrossRef] [PubMed] [Green Version]
- Gavenis, K.; Schumacher, C.; Schneider, U.; Eisfeld, J.; Mollenhauer, J.; Schmidt-Rohlfing, B. Expression of ion channels of the TRP family in articular chondrocytes from osteoarthritic patients: Changes between native and in vitro propagated chondrocytes. Mol. Cell. Biochem. 2009, 321, 135–143. [Google Scholar] [CrossRef] [PubMed]
- Anishkin, A.; Loukin, S.H.; Teng, J.; Kung, C. Feeling the hidden mechanical forces in lipid bilayer is an original sense. Proc. Natl. Acad. Sci. USA 2014, 111, 7898–7905. [Google Scholar] [CrossRef] [PubMed]
- Lewis, R.; May, H.; Mobasheri, A.; Barrett-Jolley, R. Chondrocyte channel transcriptomics: Do microarray data fit with expression and functional data? Channels 2013, 7, 459–467. [Google Scholar] [CrossRef] [PubMed]
- Asmar, A.; Barrett-Jolley, R.; Werner, A.; Kelly, R., Jr.; Stacey, M. Membrane channel gene expression in human costal and articular chondrocytes. Organogenesis 2016, 12, 94–107. [Google Scholar] [CrossRef] [PubMed]
- Muramatsu, S.; Wakabayashi, M.; Ohno, T.; Amano, K.; Ooishi, R.; Sugahara, T.; Shiojiri, S.; Tashiro, K.; Suzuki, Y.; Nishimura, R.; et al. Functional gene screening system identified TRPV4 as a regulator of chondrogenic differentiation. J. Biol. Chem. 2007, 282, 32158–32167. [Google Scholar] [CrossRef] [PubMed]
- Silver, N.; Best, S.; Jiang, J.; Thein, S.L. Selection of housekeeping genes for gene expression studies in human reticulocytes using real-time PCR. BMC Mol. Biol. 2006, 7, 33. [Google Scholar] [CrossRef] [PubMed]
- Vandesompele, J.; De Preter, K.; Pattyn, F.; Poppe, B.; Van Roy, N.; De Paepe, A.; Speleman, F. Accurate normalization of real-time quantitative RT-PCR data by geometric averaging of multiple internal control genes. Genome Biol. 2002, 3, RESEARCH0034. [Google Scholar] [CrossRef] [PubMed] [Green Version]
- Andersen, C.L.; Jensen, J.L.; Orntoft, T.F. Normalization of real-time quantitative reverse transcription-PCR data: A model-based variance estimation approach to identify genes suited for normalization, applied to bladder and colon cancer data sets. Cancer Res. 2004, 64, 5245–5250. [Google Scholar] [CrossRef] [PubMed]
- Pfaffl, M.W.; Tichopad, A.; Prgomet, C.; Neuvians, T.P. Determination of stable housekeeping genes, differentially regulated target genes and sample integrity: BestKeeper–Excel-based tool using pair-wise correlations. Biotechnol. Lett. 2004, 26, 509–515. [Google Scholar] [CrossRef] [PubMed]
- Lee, C.R.; Grad, S.; Maclean, J.J.; Iatridis, J.C.; Alini, M. Effect of mechanical loading on mRNA levels of common endogenous controls in articular chondrocytes and intervertebral disk. Anal. Biochem. 2005, 341, 372–375. [Google Scholar] [CrossRef] [PubMed]
- Wuest, S.L.; Stern, P.; Casartelli, E.; Egli, M. Fluid Dynamics Appearing during Simulated Microgravity Using Random Positioning Machines. PLoS ONE 2017, 12, e0170826. [Google Scholar] [CrossRef] [PubMed]
- Glowacki, J.; Trepman, E.; Folkman, J. Cell shape and phenotypic expression in chondrocytes. Proc. Soc. Exp. Biol. Med. 1983, 172, 93–98. [Google Scholar] [CrossRef] [PubMed]
- Gigout, A.; Jolicoeur, M.; Buschmann, M.D. Low calcium levels in serum-free media maintain chondrocyte phenotype in monolayer culture and reduce chondrocyte aggregation in suspension culture. J. Orthop. Res. Off. Publ. Orthop. Res. Soc. 2005, 13, 1012–1024. [Google Scholar] [CrossRef] [PubMed]
- Kino-Oka, M.; Yashiki, S.; Ota, Y.; Mushiaki, Y.; Sugawara, K.; Yamamoto, T.; Takezawa, T.; Taya, M. Subculture of chondrocytes on a collagen type I-coated substrate with suppressed cellular dedifferentiation. Tissue Eng. 2005, 11, 597–608. [Google Scholar] [CrossRef] [PubMed]
- Shakibaei, M.; De Souza, P.; Merker, H.J. Integrin expression and collagen type II implicated in maintenance of chondrocyte shape in monolayer culture: An immunomorphological study. Cell Biol. Int. 1997, 21, 115–125. [Google Scholar] [CrossRef] [PubMed]
- Ingber, D.E. Cellular tensegrity: Defining new rules of biological design that govern the cytoskeleton. J. Cell Sci. 1993, 104 (Pt3), 613–627. [Google Scholar]
- Ingber, D.E. The riddle of morphogenesis: A question of solution chemistry or molecular cell engineering? Cell 1993, 75, 1249–1252. [Google Scholar] [CrossRef]
- Ingber, D.E. Tensegrity: The architectural basis of cellular mechanotransduction. Annu. Rev. Physiol. 1997, 59, 575–599. [Google Scholar] [CrossRef] [PubMed]
- Ingber, D.E. Tensegrity II. How structural networks influence cellular information processing networks. J. Cell Sci. 2003, 116, 1397–1408. [Google Scholar] [CrossRef] [PubMed]
- Ermakov, Y.A.; Kamaraju, K.; Sengupta, K.; Sukharev, S. Gadolinium ions block mechanosensitive channels by altering the packing and lateral pressure of anionic lipids. Biophys. J. 2010, 98, 1018–1027. [Google Scholar] [CrossRef] [PubMed]
- Yang, X.C.; Sachs, F. Block of stretch-activated ion channels in Xenopus oocytes by gadolinium and calcium ions. Science 1989, 243, 1068–1071. [Google Scholar] [CrossRef] [PubMed]
- Biagi, B.A.; Enyeart, J.J. Gadolinium blocks low- and high-threshold calcium currents in pituitary cells. Am. J. Physiol. 1990, 259, C515–C520. [Google Scholar] [CrossRef] [PubMed]
- Boland, L.M.; Brown, T.A.; Dingledine, R. Gadolinium block of calcium channels: Influence of bicarbonate. Brain Res. 1991, 563, 142–150. [Google Scholar] [CrossRef]
- Bourne, G.W.; Trifaro, J.M. The gadolinium ion: A potent blocker of calcium channels and catecholamine release from cultured chromaffin cells. Neuroscience 1982, 7, 1615–1622. [Google Scholar] [CrossRef]
- Docherty, R.J. Gadolinium selectively blocks a component of calcium current in rodent neuroblastoma x glioma hybrid (NG108-15) cells. J. Physiol. 1988, 398, 33–47. [Google Scholar] [CrossRef] [PubMed]
- Mlinar, B.; Enyeart, J.J. Block of current through T-type calcium channels by trivalent metal cations and nickel in neural rat and human cells. J. Physiol. 1993, 469, 639–652. [Google Scholar] [CrossRef] [PubMed]
- Roland, C.R.; Naziruddin, B.; Mohanakumar, T.; Flye, M.W. Gadolinium blocks rat Kupffer cell calcium channels: Relevance to calcium-dependent prostaglandin E2 synthesis and septic mortality. Hepatology 1999, 29, 756–765. [Google Scholar] [CrossRef] [PubMed]
- Rychkov, G.; Barritt, G.J. TRPC1 Ca(2+)-permeable channels in animal cells. Handb. Exp. Pharmacol. 2007. [Google Scholar] [CrossRef]
- Garcia-Elias, A.; Mrkonjic, S.; Jung, C.; Pardo-Pastor, C.; Vicente, R.; Valverde, M.A. The TRPV4 channel. Handb. Exp. Pharmacol. 2014, 222, 293–319. [Google Scholar] [PubMed]
- Phan, M.N.; Leddy, H.A.; Votta, B.J.; Kumar, S.; Levy, D.S.; Lipshutz, D.B.; Lee, S.H.; Liedtke, W.; Guilak, F. Functional characterization of TRPV4 as an osmotically sensitive ion channel in porcine articular chondrocytes. Arthritis Rheum. 2009, 60, 3028–3037. [Google Scholar] [CrossRef] [PubMed]
- Lewis, R.; Feetham, C.H.; Barrett-Jolley, R. Cell volume regulation in chondrocytes. Cell. Physiol. Biochem. Int. J. Exp. Cell. Physiol. Biochem. Pharmacol. 2011, 28, 1111–1122. [Google Scholar] [CrossRef] [PubMed]
- Hdud, I.M.; Mobasheri, A.; Loughna, P.T. Effect of osmotic stress on the expression of TRPV4 and BKCa channels and possible interaction with ERK1/2 and p38 in cultured equine chondrocytes. Am. J. Physiol. Cell Physiol. 2014, 306, C1050–C1057. [Google Scholar] [CrossRef] [PubMed]
- Clark, A.L.; Votta, B.J.; Kumar, S.; Liedtke, W.; Guilak, F. Chondroprotective role of the osmotically sensitive ion channel transient receptor potential vanilloid 4: Age- and sex-dependent progression of osteoarthritis in Trpv4-deficient mice. Arthritis Rheum. 2010, 62, 2973–2983. [Google Scholar] [CrossRef] [PubMed]
- O‘Conor, C.J.; Leddy, H.A.; Benefield, H.C.; Liedtke, W.B.; Guilak, F. TRPV4-mediated mechanotransduction regulates the metabolic response of chondrocytes to dynamic loading. Proc. Natl. Acad. Sci. USA 2014, 111, 1316–1321. [Google Scholar] [CrossRef] [PubMed]
- McNulty, A.L.; Leddy, H.A.; Liedtke, W.; Guilak, F. TRPV4 as a therapeutic target for joint diseases. Naunyn Schmied. Arch. Pharmacol. 2015, 388, 437–450. [Google Scholar] [CrossRef] [PubMed]
- Wuest, S.; Richard, S.; Walther, I.; Furrer, R.; Anderegg, R.; Sekler, J.; Egli, M. A Novel Microgravity Simulator Applicable for Three-Dimensional Cell Culturing. Microgravity Sci. Technol. 2014, 1–12. [Google Scholar] [CrossRef]
- Grad, S.; Zhou, L.; Gogolewski, S.; Alini, M. Chondrocytes seeded onto poly (L/DL-lactide) 80%/20% porous scaffolds: A biochemical evaluation. J. Biomed. Mater. Res. A 2003, 66, 571–579. [Google Scholar] [CrossRef] [PubMed]
- Hilz, F.M.; Ahrens, P.; Grad, S.; Stoddart, M.J.; Dahmani, C.; Wilken, F.L.; Sauerschnig, M.; Niemeyer, P.; Zwingmann, J.; Burgkart, R.; et al. Influence of extremely low frequency, low energy electromagnetic fields and combined mechanical stimulation on chondrocytes in 3-D constructs for cartilage tissue engineering. Bioelectromagnetics 2014, 35, 116–128. [Google Scholar] [CrossRef] [PubMed]
- Xiao, J.; Zhang, Y.; Wang, J.; Yu, W.; Wang, W.; Ma, X. Monitoring of cell viability and proliferation in hydrogel-encapsulated system by resazurin assay. Appl. Biochem. Biotechnol. 2010, 162, 1996–2007. [Google Scholar] [CrossRef] [PubMed]
- Livak, K.J.; Schmittgen, T.D. Analysis of relative gene expression data using real-time quantitative PCR and the 2(-Delta Delta C(T)) Method. Methods 2001, 25, 402–408. [Google Scholar] [CrossRef] [PubMed]
- Chan, S.C.; Walser, J.; Kappeli, P.; Shamsollahi, M.J.; Ferguson, S.J.; Gantenbein-Ritter, B. Region specific response of intervertebral disc cells to complex dynamic loading: An organ culture study using a dynamic torsion-compression bioreactor. PLoS ONE 2013, 8, e72489. [Google Scholar] [CrossRef] [PubMed] [Green Version]
- Zaros, L.G.; Bricarello, P.A.; Amarante, A.F.T.; Coutinho, L.L. Quantification of bovine cytokine gene expression using real-time RT-PCR methodology. Genet. Mol. Biol. 2007, 30, 575–579. [Google Scholar] [CrossRef]


| Group Name | Chemical Treatment | Mechanical Treatment |
|---|---|---|
| Control, UT | Untreated | 8 days static culture |
| Adherent, UT | Untreated | 2 days static culture followed by 6 days RPM exposure |
| Suspended, UT | Untreated | 8 days RPM exposure |
| Control, Gd | Gadolinium | 8 days static culture |
| Adherent, Gd | Gadolinium | 2 days static culture followed by 6 days RPM exposure |
| Suspended, Gd | Gadolinium | 8 days RPM exposure |
| Stability Rank | Silver et al. | GeNorm | NormFinder | BestKeeper |
|---|---|---|---|---|
| Most stable | 18S | 18S | B2M | 18S |
| B2M | B2M | 18S | B2M | |
| HPRT1 | HPRT1 | HPRT1 | HPRT1 | |
| L30 | L30 | L30 | L30 | |
| Least stable | GAPDH | GAPDH | GAPDH | GAPDH |
| Gene | Primer | Sequence | Ref. |
|---|---|---|---|
| 18S | Forward | ACG GAC AGG ATT GAC AGA TTG | [92] |
| Reverse | CCA GAG TCT CGT TCG TTA TCG | ||
| B2M | Forward | TGC CGA GTG AAA CAC GTT ACT | |
| Reverse | GTT CAA ATC TCG ATG GTG CTG CTT | ||
| HPRT1 | Forward | AGA CTG CCT TCA GCC CG | |
| Reverse | GGT TCA TCA TCG CTA ATC ACC AC | ||
| L30 | Forward | AGG AAG GCT CAA CGA GAA CA | [27] |
| Reverse | CGA GGA GCA GAA ACC TTC AC | ||
| GAPDH | Forward | GGC GTG AAC CAC GAG AAG TAT AA | [93] |
| Reverse | CCC TCC ACG ATG CCA AAG T | ||
| COL1A1 | Forward | ACT GTC CTA ACG CCA AAG TCC | |
| Reverse | CTC CTT TCG GTC CCT CGA C | ||
| COL2A1 | Forward | AAA GCC TGG AAA ATC TGG CG | |
| Reverse | ACC TGG GTA ACC TCT GTG AC | ||
| COL10A1 | Forward | GGG AGT GCC TGG ACA CAA TG | |
| Reverse | AGT TCC CAC ATC GCC TTT GG | ||
| ACAN | Forward | CCT CCC CGA CTG ATG CTT CTA | |
| Reverse | CAC AGC TTC TGG TCT GTT GTG G | ||
| VCAN | Forward | ATA AGC CGC CTT TCA AGG ACA AGA | |
| Reverse | ACT TTC TGT AGT GCA TGG GCT G | ||
| TRPC1 | Forward | TGT ATG ATA AAG GCT ACA CTC CCA | |
| Reverse | GAT GAA CGA ATG GAA GGT GTC ATT G | ||
| TRPV4 | Forward | TTC CGG GAA CCG TCC A | |
| Reverse | ATG TCC AGA AGC ACA GGG AT |
© 2018 by the authors. Licensee MDPI, Basel, Switzerland. This article is an open access article distributed under the terms and conditions of the Creative Commons Attribution (CC BY) license (http://creativecommons.org/licenses/by/4.0/).
Share and Cite
Wuest, S.L.; Caliò, M.; Wernas, T.; Tanner, S.; Giger-Lange, C.; Wyss, F.; Ille, F.; Gantenbein, B.; Egli, M. Influence of Mechanical Unloading on Articular Chondrocyte Dedifferentiation. Int. J. Mol. Sci. 2018, 19, 1289. https://doi.org/10.3390/ijms19051289
Wuest SL, Caliò M, Wernas T, Tanner S, Giger-Lange C, Wyss F, Ille F, Gantenbein B, Egli M. Influence of Mechanical Unloading on Articular Chondrocyte Dedifferentiation. International Journal of Molecular Sciences. 2018; 19(5):1289. https://doi.org/10.3390/ijms19051289
Chicago/Turabian StyleWuest, Simon L., Martina Caliò, Timon Wernas, Samuel Tanner, Christina Giger-Lange, Fabienne Wyss, Fabian Ille, Benjamin Gantenbein, and Marcel Egli. 2018. "Influence of Mechanical Unloading on Articular Chondrocyte Dedifferentiation" International Journal of Molecular Sciences 19, no. 5: 1289. https://doi.org/10.3390/ijms19051289