New Gene Markers for Metabolic Processes and Homeostasis in Porcine Buccal Pouch Mucosa during Cells Long Term-Cultivation—A Primary Culture Approach


 ,
, 

Abstract
1. Introduction
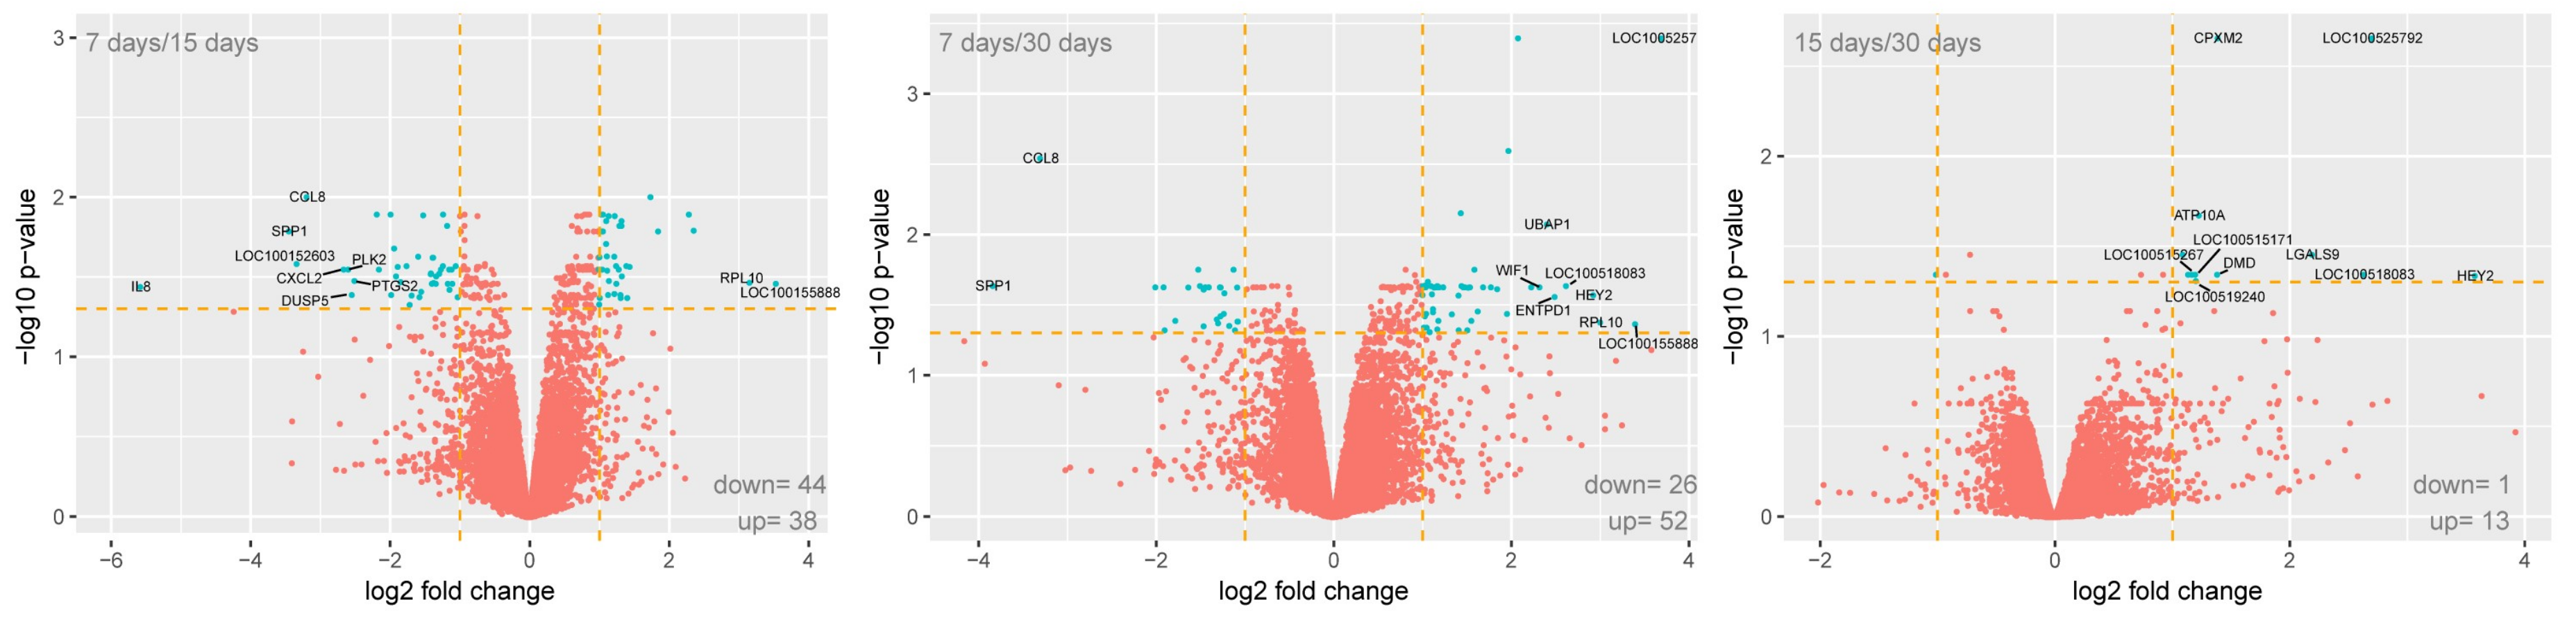
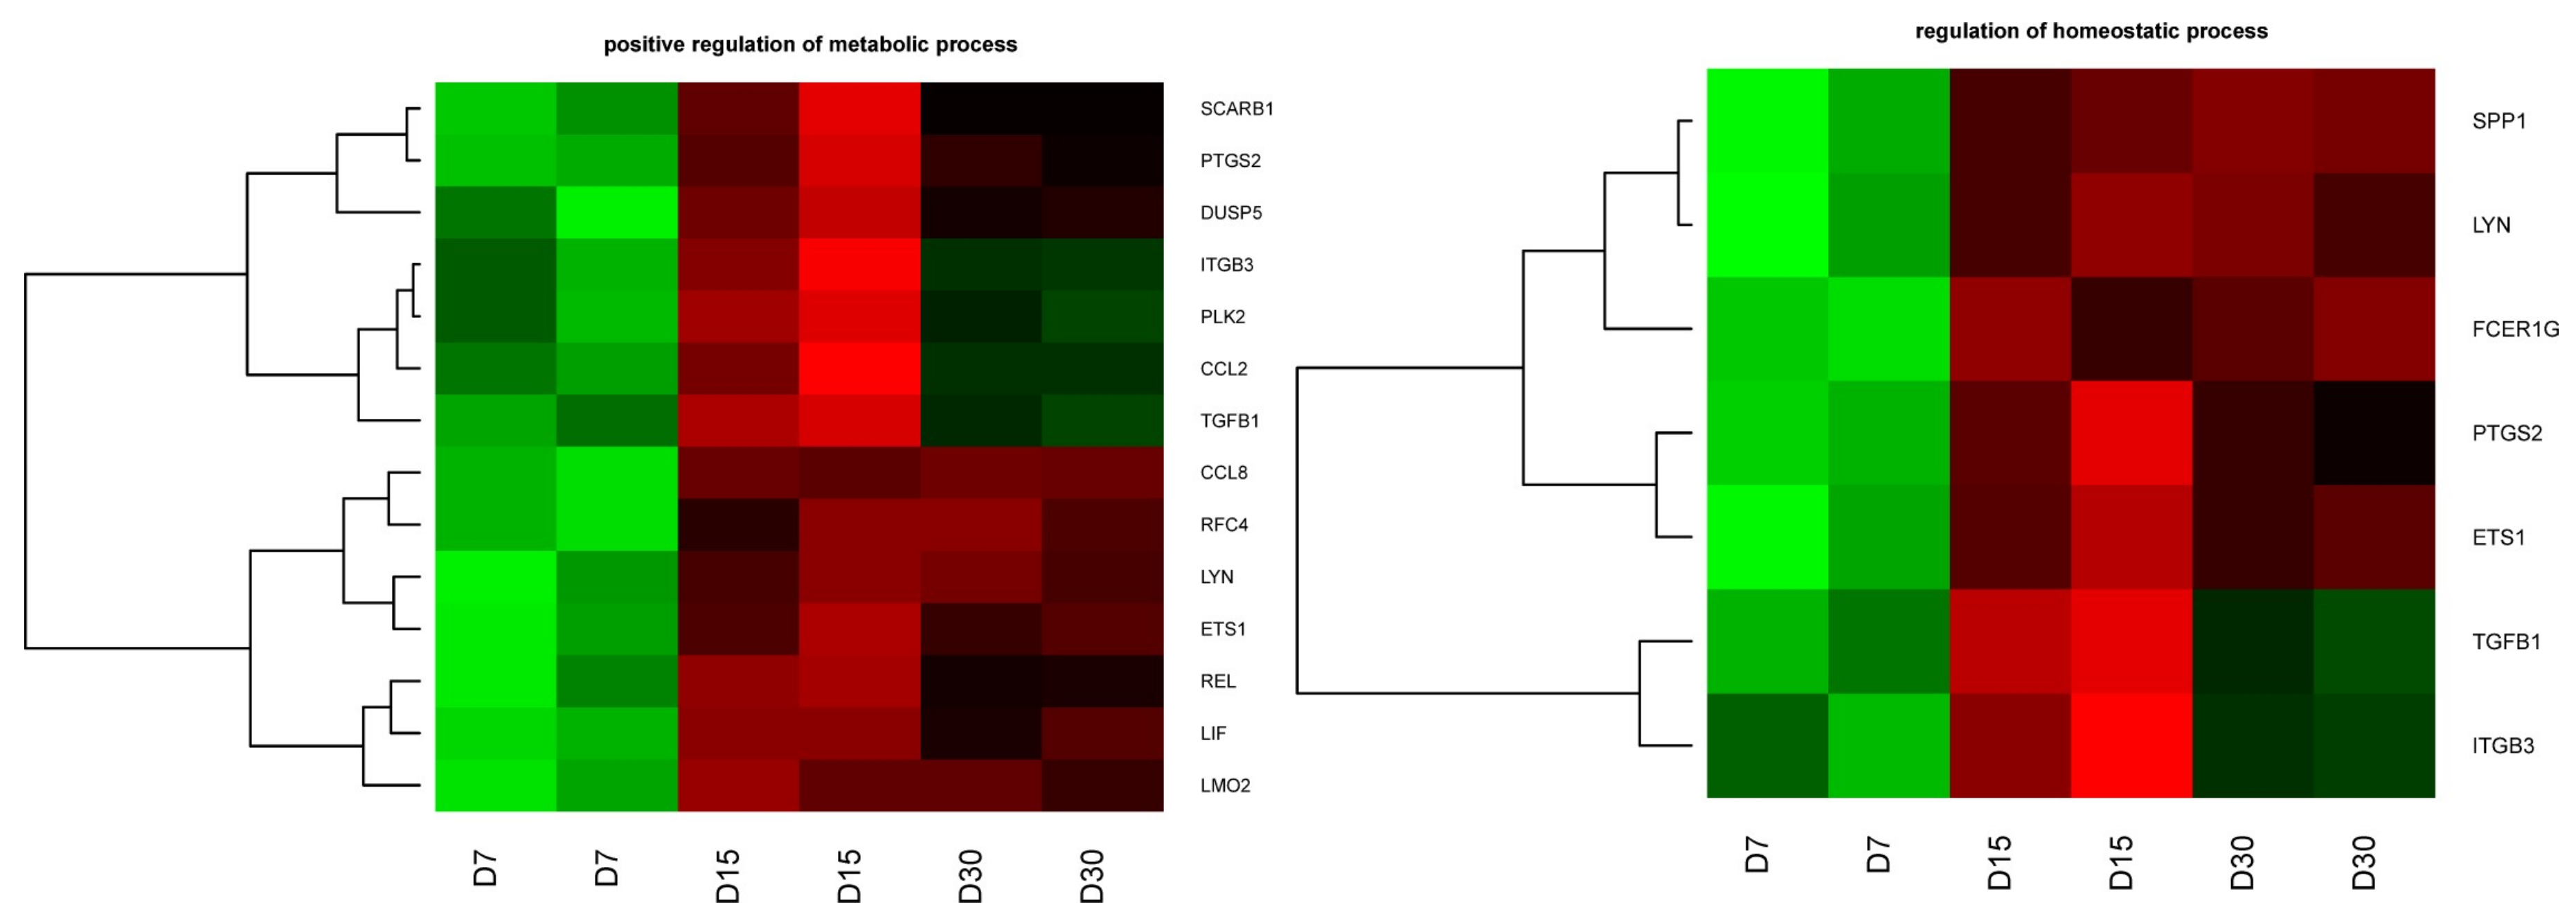
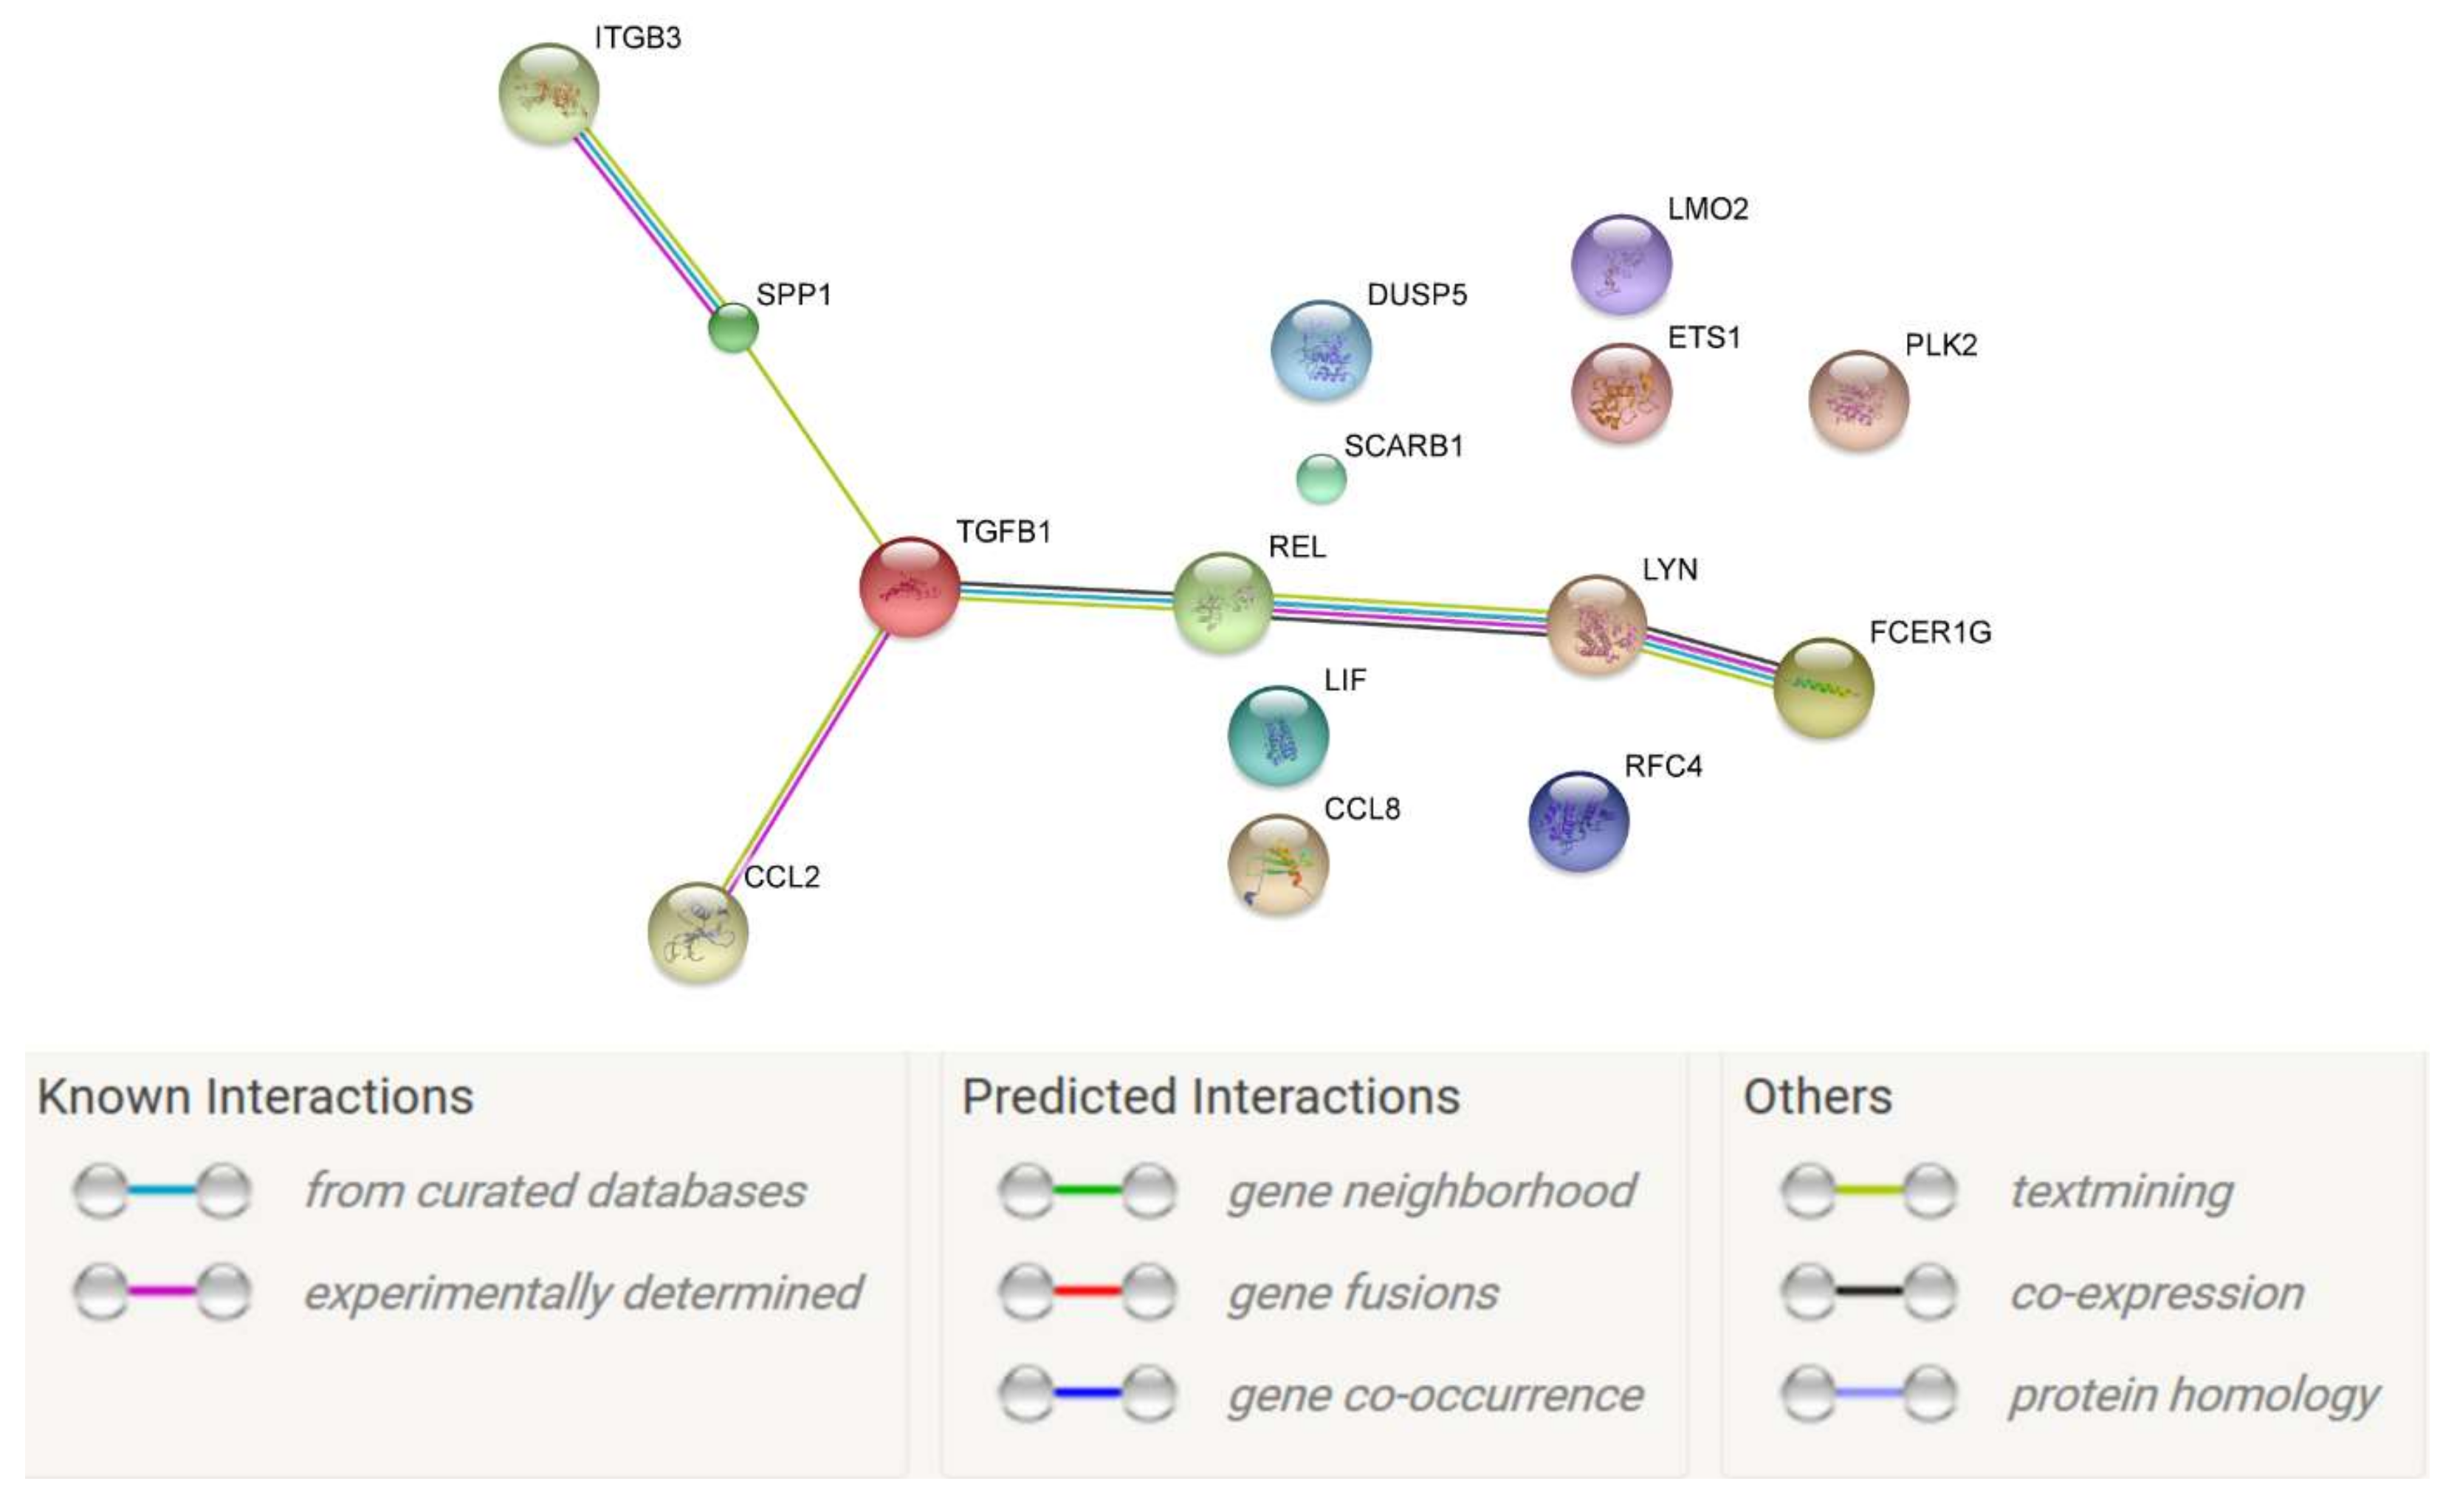
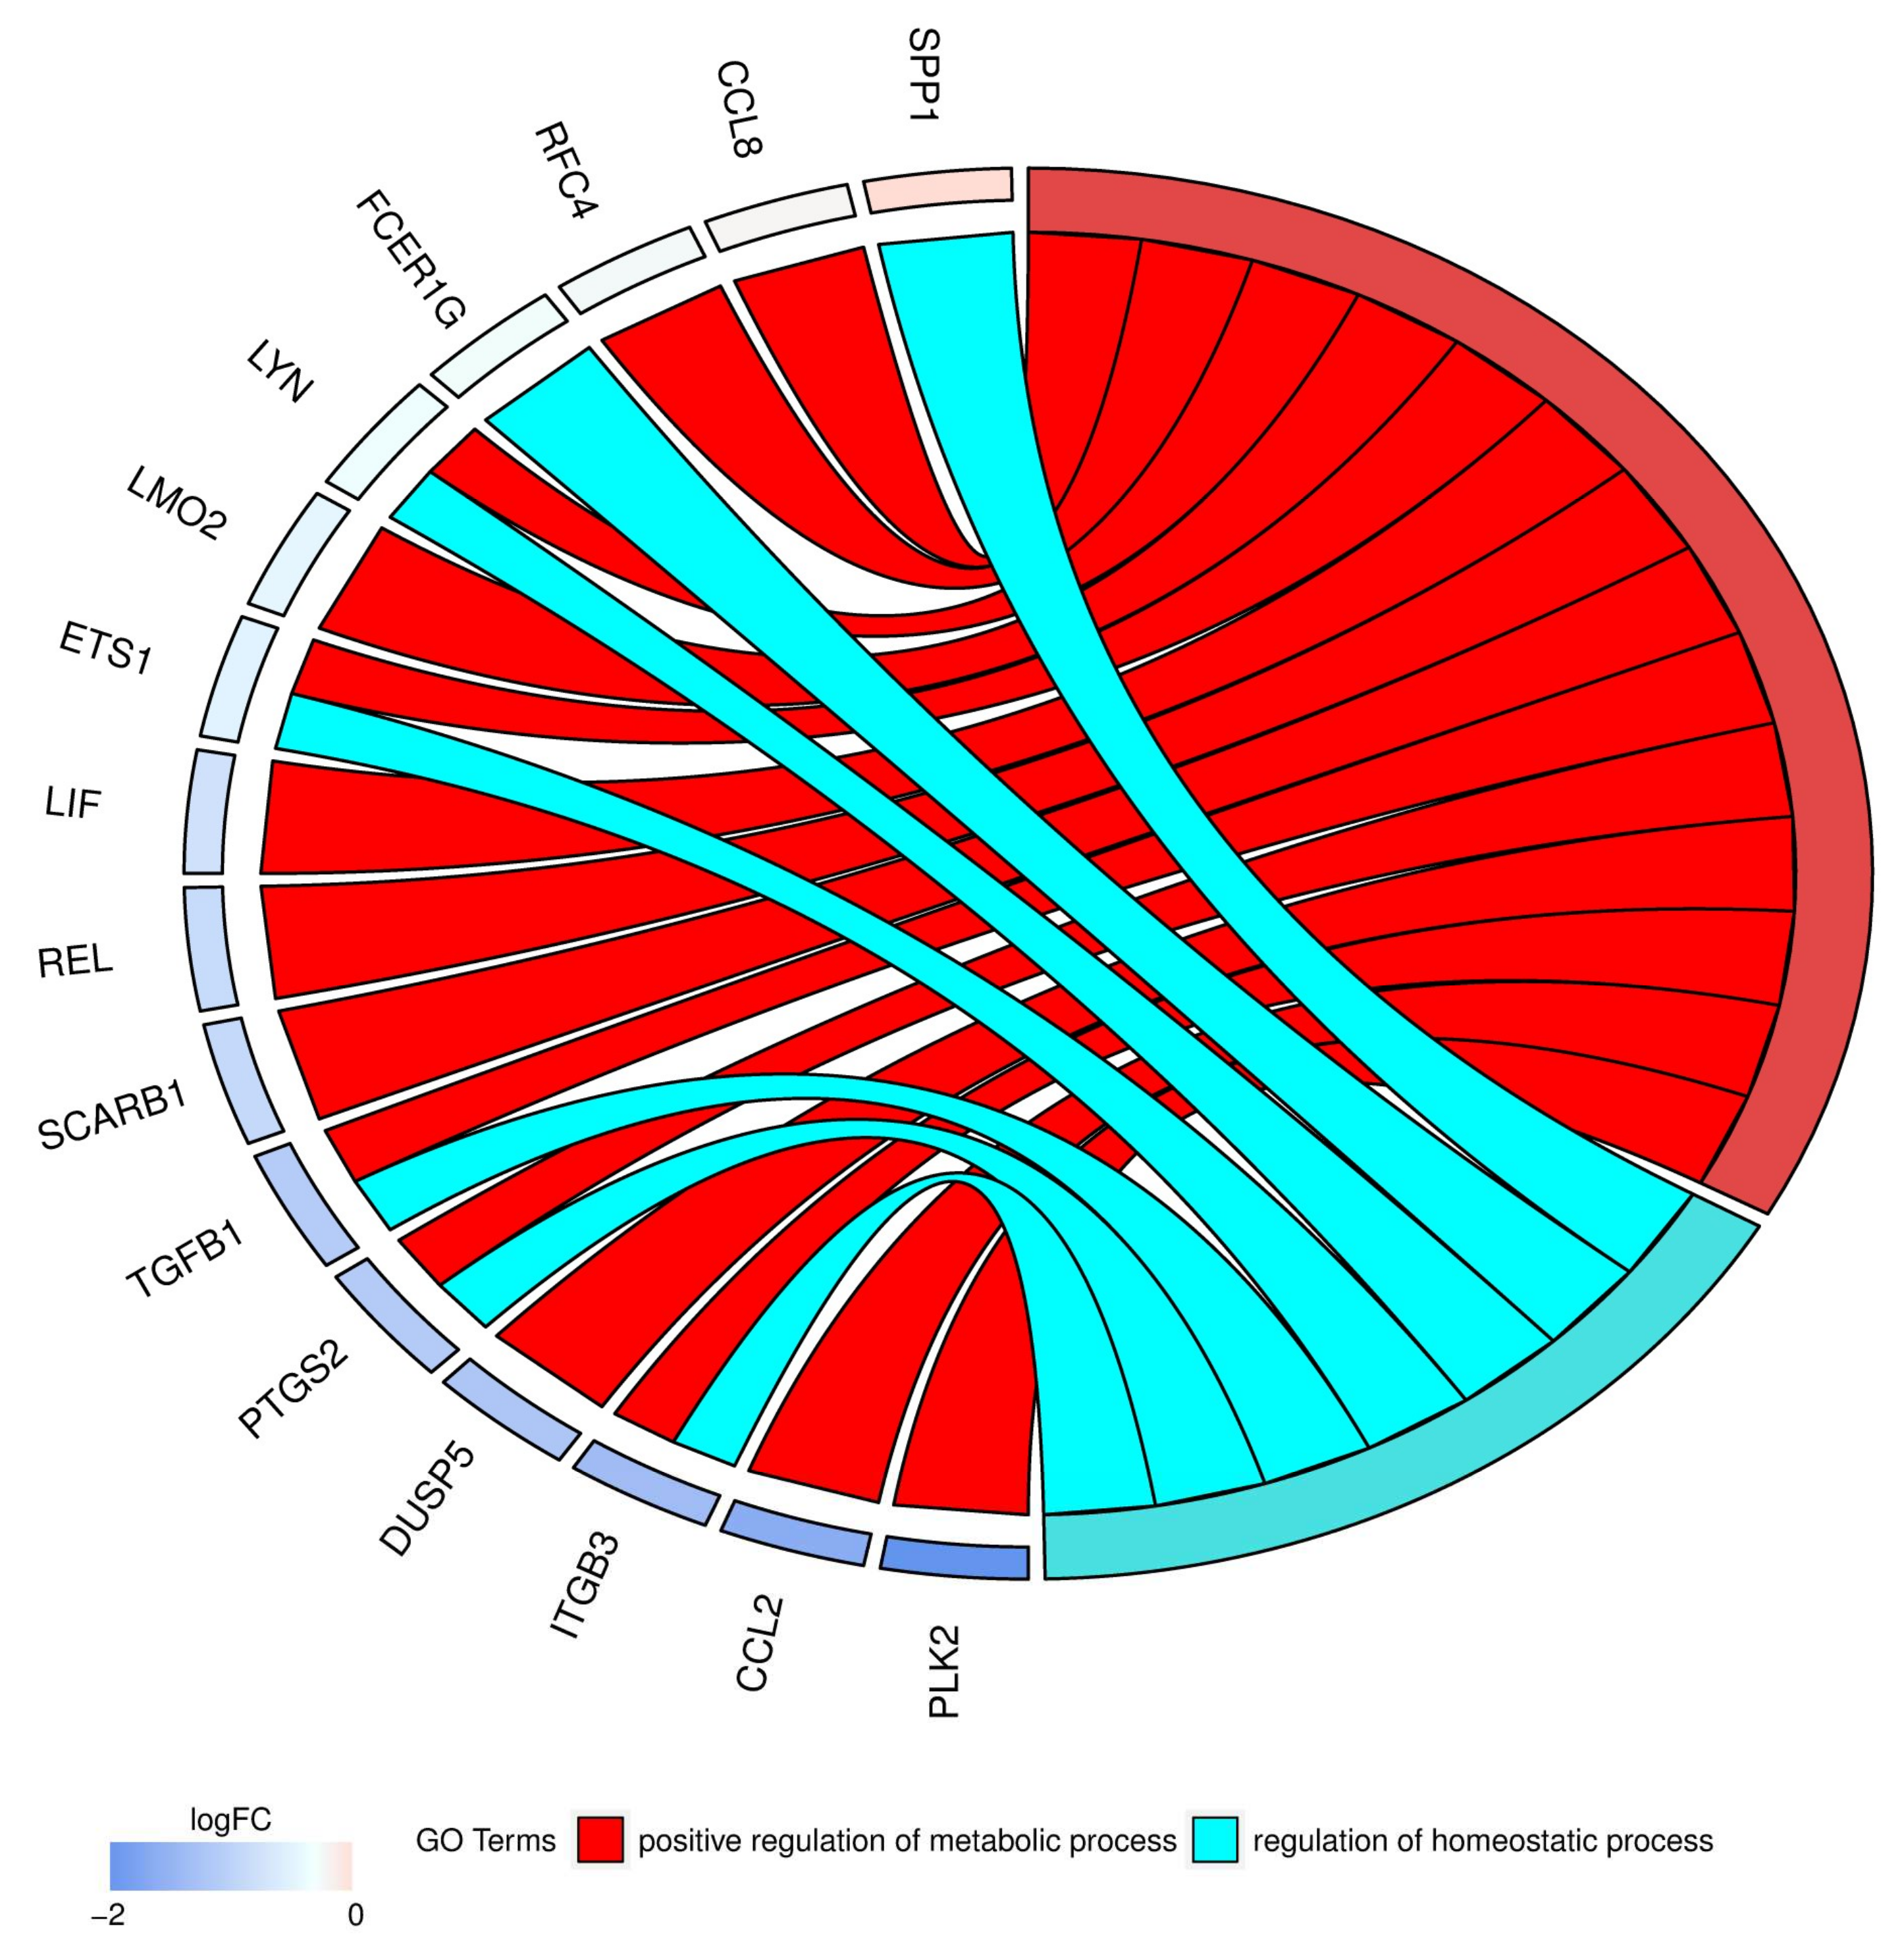
2. Results
3. Discussion
4. Materials and Methods
4.1. Animals
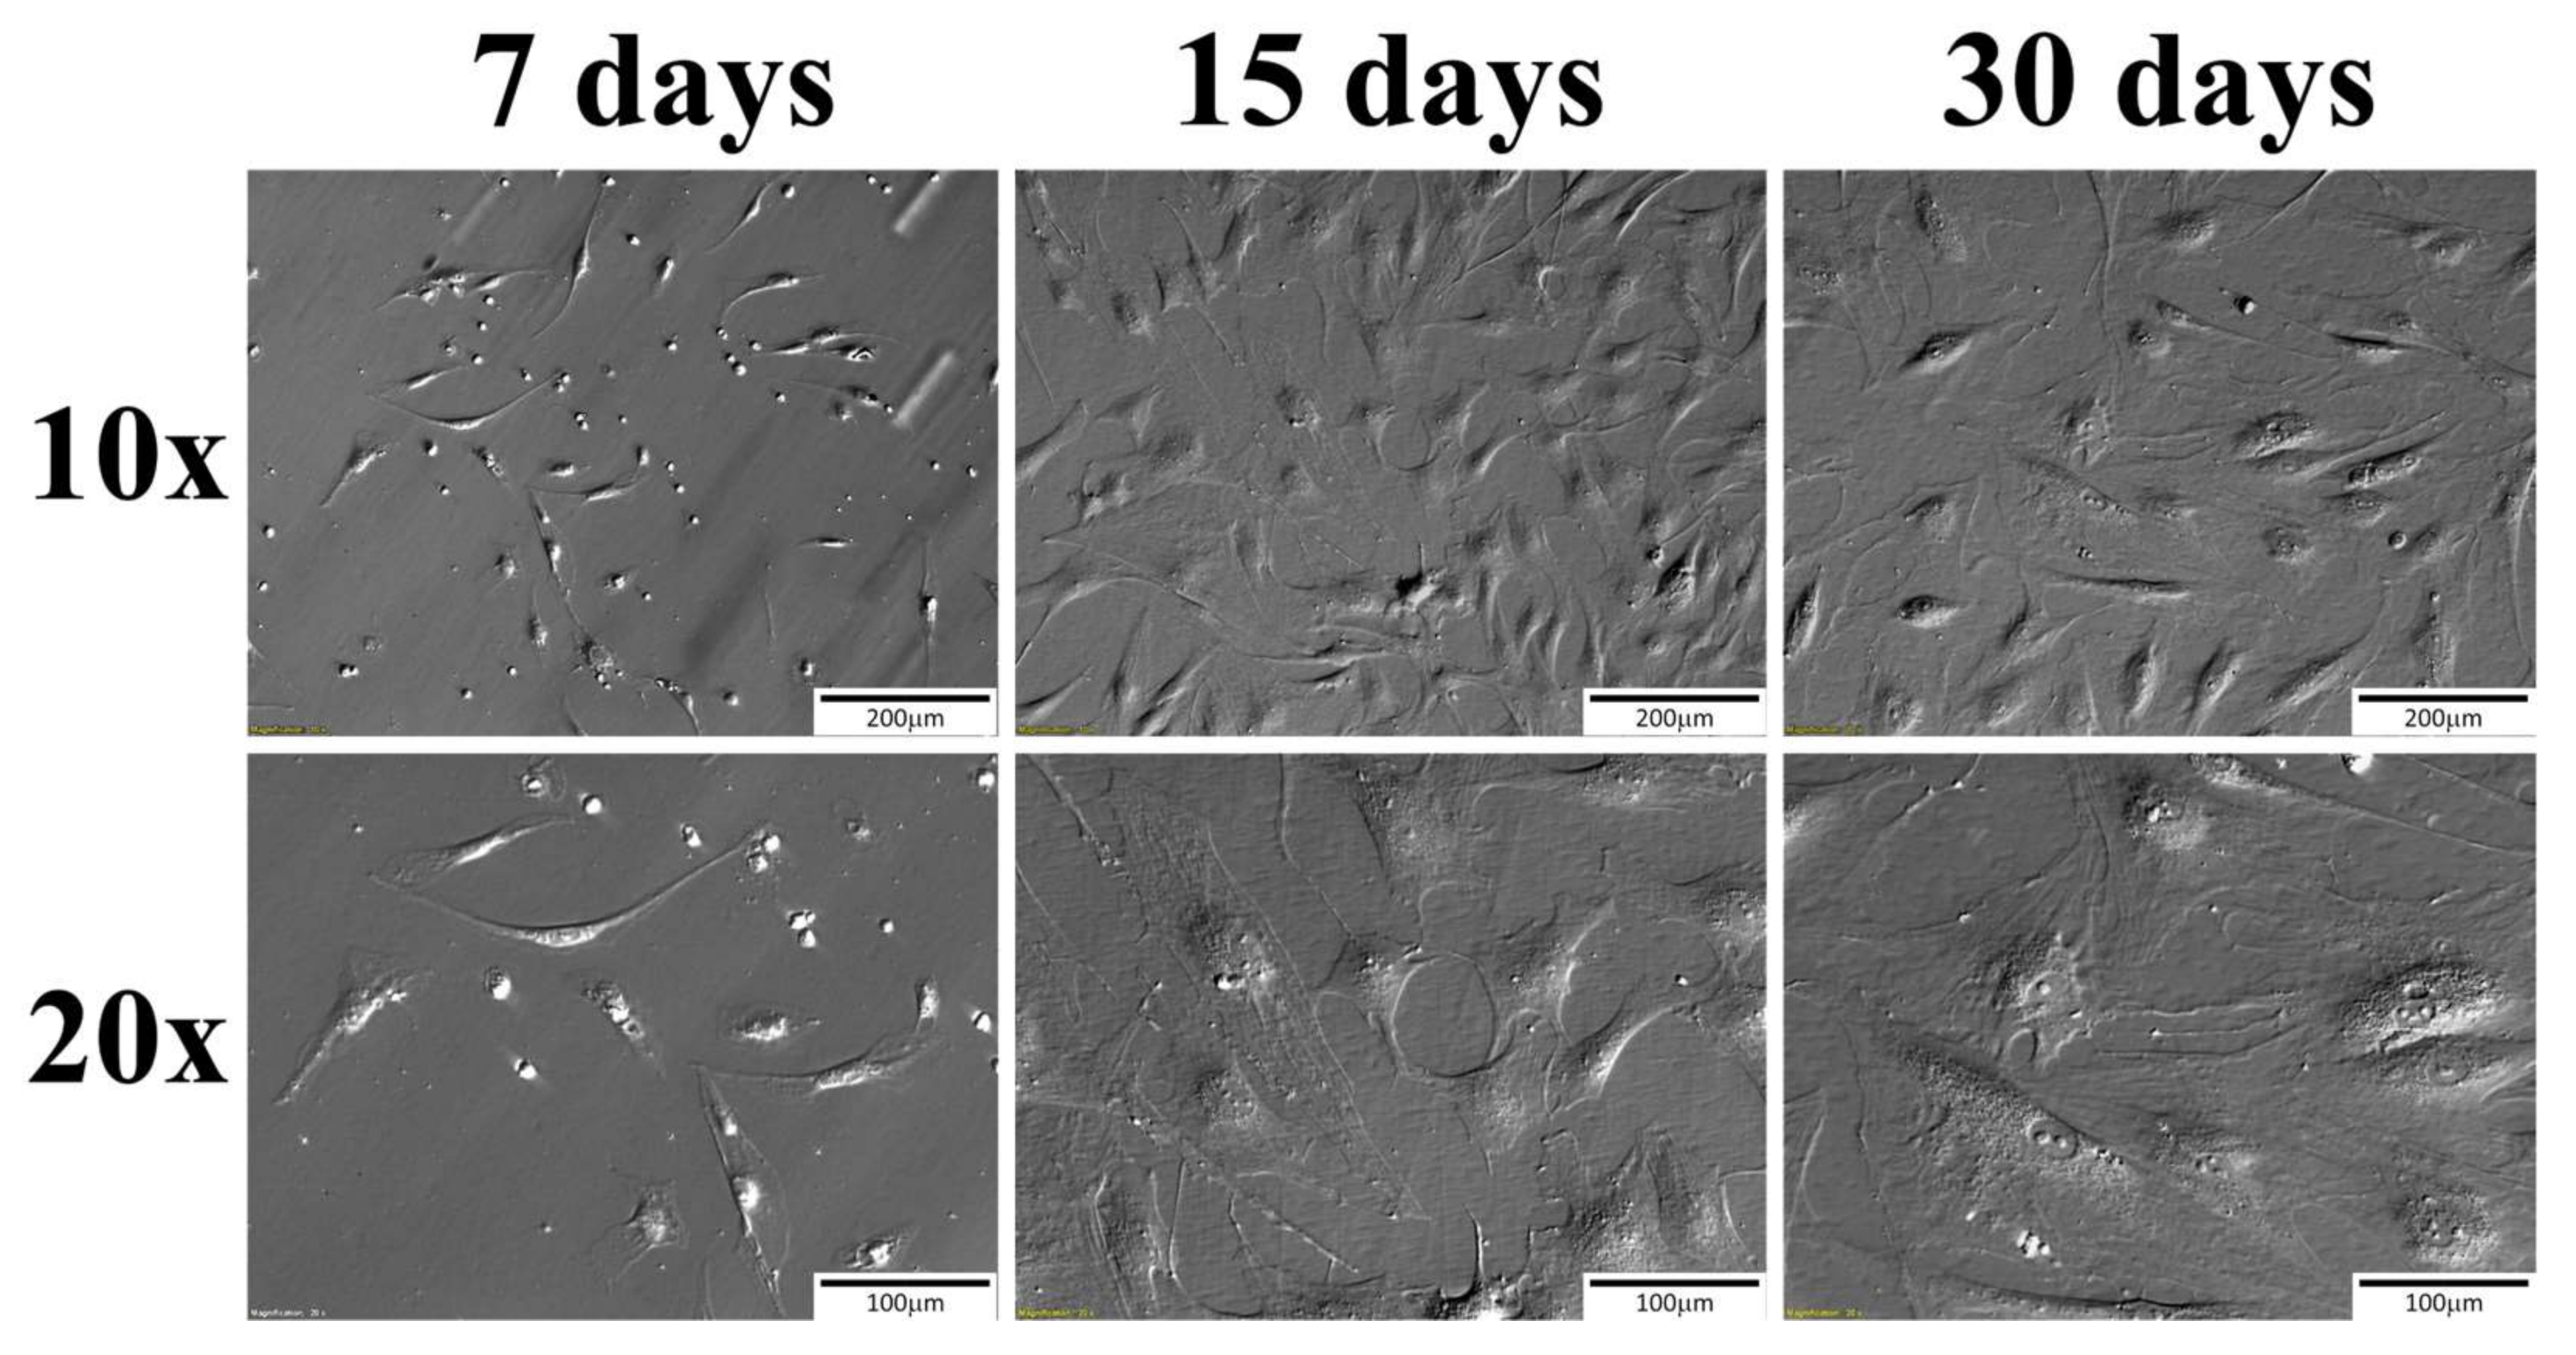
4.2. Cell Isolation and Culture
4.3. Microarray Expression Analysis and Statistics
4.4. Real Time q-PCR Analysis
Author Contributions
Conflicts of Interest
References
- Borys, S.; Khozmi, R.; Kranc, W.; Bryja, A.; Dyszkiewicz-Konwińska, M.; Jeseta, M.; Kempisty, B. Recent findings of the types of programmed cell death. Adv. Cell Biol. 2017, 5, 43–49. [Google Scholar] [CrossRef]
- Bryja, A.; Dyszkiewicz-Konwińska, M.; Budna, J.; Ciesiółka, S.; Kranc, W.; Borys, S.; Jeseta, M.; Urbaniak, O.; Bukowska, D.; Antosik, P.; et al. Expression of cell mitotic progression proteins and keratinocyte markers in porcine buccal pouch mucosal cells during short-term, real-time primary culture. J. Biol. Regul. Homeost. Agents 2017, 31, 297–309. [Google Scholar] [PubMed]
- Bryja, A.; Dyszkiewicz-Konwińska, M.; Budna, J.; Kranc, W.; Chachuła, A.; Borys, S.; Ciesiółka, S.; Ciesiółka, J.; Prylinski, M.; Prylinski, D.; et al. The biomedical aspects of oral mucosal epithelial cell culture in mammals. J. Biol. Regul. Homeost. Agents 2017, 31, 81–85. [Google Scholar] [PubMed]
- Bryja, A.; Dyszkiewicz-Konwińska, M.; Chachuła, A.; Ciesiółka, S.; Kranc, W.; Bukowska, D.; Antosik, P.; Bruska, M.; Nowicki, M.; Zabel, M.; et al. Differential expression and distribution of cytokeratins and vimentin in buccal pouch mucosal cells during real-time cell proliferation: Research based on a porcine model. J. Biol. Regul. Homeost. Agents 2016, 30, 951–960. [Google Scholar] [PubMed]
- Kranc, W.; Celichowski, P.; Budna, J.; Khozmi, R.; Bryja, A.; Ciesiółka, S.; Rybska, M.; Borys, S.; Jeseta, M.; Bukowska, D.; et al. Positive Regulation of Macromolecule Metabolic Process Belongs to the Main Mechanisms Crucial for Porcine Ooocytes Maturation. Adv. Cell Biol. 2017, 5, 15–31. [Google Scholar] [CrossRef]
- Nawrocki, M.J.; Budna, J.; Celichowski, P.; Khozmi, R.; Bryja, A.; Kranc, W.; Borys, S.; Ciesiółka, S.; Ciesiółka, S.; Jeseta, M.; et al. Analysis of fructose and mannose—Regulatory peptides signaling pathway in porcine epithelial oviductal cells (OECs) primary cultured long-term in vitro. Adv. Cell Biol. 2017, 5, 129–135. [Google Scholar] [CrossRef]
- Nawrocki, M.J.; Celichowski, P.; Budna, J.; Bryja, A.; Kranc, W.; Ciesiółka, S.; Borys, S.; Knap, S.; Jeseta, M.; Khozmi, R.; et al. The blood vessels development, morphogenesis and blood circulation are three ontologic groups highly up-regulated in porcine oocytes before in vitro maturation. Adv. Cell Biol. 2017, 5, 135–142. [Google Scholar] [CrossRef]
- Sawada, A.; Wakabayashi, N.; Ona, M.; Suzuki, T. Viscoelasticity of Human Oral Mucosa. J. Dent. Res. 2011, 90, 590–595. [Google Scholar] [CrossRef] [PubMed]
- Chen, J.; Ahmad, R.; Li, W.; Swain, M.; Li, Q. Biomechanics of oral mucosa. J. R. Soc. Interface 2015, 12, 20150325. [Google Scholar] [CrossRef] [PubMed]
- Bryja, A.; Dyszkiewicz-Konwińska, M.; Budna, J.; Kranc, W.; Chachuła, A.; Ciesiółka, S.; Sumelka, E.; Krajecki, M.; Bukowska, D.; Antosik, P.; et al. Carcinogenesis in mammalian oral mucosa from the perspective of biomedical research. Med. Weter. 2017, 73, 82–87. [Google Scholar] [CrossRef]
- Rolin, G.; Placet, V.; Jacquet, E.; Tauzin, H.; Robin, S.; Pazart, L.; Viennet, C.; Saas, P.; Muret, P.; Binda, D.; et al. Development and characterization of a human dermal equivalent with physiological mechanical properties. Skin Res. Technol. 2012, 18, 251–258. [Google Scholar] [CrossRef] [PubMed]
- Davis, N.G.; Phillips, A.; Becker, D.L. Connexin dynamics in the privileged wound healing of the buccal mucosa. Wound Repair Regen. 2013, 21, 571–578. [Google Scholar] [CrossRef] [PubMed]
- Guzmán-Uribe, D.; Alvarado-Estrada, K.N.; Pierdant-Pérez, M.; Torres-Álvarez, B.; Sánchez-Aguilar, J.M.; Rosales-Ibáñez, R. Oral mucosa: An alternative epidermic cell source to develop autologous dermal-epidermal substitutes from diabetic subjects. J. Appl. Oral Sci. 2017, 25, 186–195. [Google Scholar] [CrossRef] [PubMed]
- Dyszkiewicz-Konwińska, M.; Bryja, A.; Jopek, K.; Budna, J.; Bukowska, D.; Antosik, P.; Bruska, M.; Nowicki, M.; Zabel, M.; Kempisty, B. Expression of connexins in porcine buccal pouch mucosa cells during real-time long-term cells proliferation in vitro—A primary culture approache. J. Biol. Regul. Homeost. Agents 2017, 31, 567–577. [Google Scholar] [PubMed]
- Huveneers, S.; Truong, H.; Danen, E.H.J. Integrins: Signaling, disease, and therapy. Int. J. Radiat. Biol. 2007, 83, 743–751. [Google Scholar] [CrossRef] [PubMed]
- Li, R.; Pendergast, A.M. Arg kinase regulates epithelial cell polarity by targeting β1-integrin and small GTPase pathways. Curr. Biol. 2011, 21, 1534–1542. [Google Scholar] [CrossRef] [PubMed]
- Lee, J.L.; Streuli, C.H. Integrins and epithelial cell polarity. J. Cell Sci. 2014, 127, 3217–3225. [Google Scholar] [CrossRef] [PubMed]
- Akhtar, N.; Streuli, C.H. An integrin–ILK–microtubule network orients cell polarity and lumen formation in glandular epithelium. Nat. Cell Biol. 2013, 15, 17–27. [Google Scholar] [CrossRef] [PubMed]
- Lee, M.; Vasioukhin, V. Cell polarity and cancer—Cell and tissue polarity as a non-canonical tumor suppressor. J. Cell Sci. 2008, 121, 1141–1150. [Google Scholar] [CrossRef] [PubMed]
- Feigin, M.E.; Muthuswamy, S.K. Polarity proteins regulate mammalian cell-cell junctions and cancer pathogenesis. Curr. Opin. Cell Biol. 2009, 21, 694–700. [Google Scholar] [CrossRef] [PubMed]
- Zovein, A.C.; Luque, A.; Turlo, K.A.; Hofmann, J.J.; Yee, K.M.; Becker, M.S.; Fassler, R.; Mellman, I.; Lane, T.F.; LuisaIruela-Arispe, M.; et al. β1 Integrin Establishes Endothelial Cell Polarity and Arteriolar Lumen Formation via a Par3-Dependent Mechanism. Dev. Cell 2010, 18, 39–51. [Google Scholar] [CrossRef] [PubMed]
- Yu, W.; Datta, A.; Leroy, P.; O’Brien, L.E.; Mak, G.; Jou, T.S.; Matlin, K.S.; Mostov, K.E.; Zegers, M.M. 1-Integrin Orients Epithelial Polarity via Rac1 and Laminin. Mol. Biol. Cell 2004, 16, 433–445. [Google Scholar] [CrossRef] [PubMed]
- Gómez-Lamarca, M.J.; Cobreros-Reguera, L.; Ibáñez-Jiménez, B.; Palacios, I.M.; Martín-Bermudo, M.D. Integrins regulate epithelial cell differentiation by modulating Notch activity. J. Cell Sci. 2014, 127, 4667–4678. [Google Scholar] [CrossRef] [PubMed]
- Sarrazy, V.; Datta, A.; Leroy, P.; O’Brien, L.E.; Mak, G.; Jou, T.S.; Matlin, K.S.; Mostov, K.E.; Zegers, M.M. Integrins αvβ5 and αvβ3 promote latent TGF-β1 activation by human cardiac fibroblast contraction. Cardiovasc. Res. 2014, 102, 407–417. [Google Scholar] [CrossRef] [PubMed]
- Li, W.; Zhang, B.; Li, H.; Zhao, C.; Zhong, Y.; Sun, J.; Lv, S. TGF β1 Mediates Epithelial Mesenchymal Transition via β6 Integrin Signaling Pathway in Breast Cancer. Cancer Investig. 2014, 32, 409–415. [Google Scholar] [CrossRef] [PubMed]
- Diegelmann, R.F.; Evans, M.C. Wound healing: An overview of acute, fibrotic and delayed healing. Front. Biosci. 2004, 9, 283–289. [Google Scholar] [CrossRef] [PubMed]
- Massagué, J. TGFβ signalling in context. Nat. Rev. Mol. Cell Biol. 2012, 13, 616–630. [Google Scholar] [CrossRef] [PubMed]
- Cirillo, N.; Hassona, Y.; Celentano, A.; Lim, K.P.; Manchella, S.; Parkinson, E.K.; Prime, S.S. Cancer-associated fibroblasts regulate keratinocyte cell–cell adhesion via TGF-β-dependent pathways in genotype-specific oral cancer. Carcinogenesis 2017, 38, 76–85. [Google Scholar] [CrossRef] [PubMed]
- Kamath, V.; Krishnamurthy, S.; Satelur, K.; Rajkumar, K. Transforming growth factor-β1 and TGF-β2 act synergistically in the fibrotic pathway in oral submucous fibrosis: An immunohistochemical observation. Indian J. Med. Paediatr. Oncol. 2015, 36, 111. [Google Scholar] [CrossRef] [PubMed]
- Maria, S.; Kamath, V.; Satelur, K.; Rajkumar, K. Evaluation of transforming growth factor beta1 gene in oral submucous fibrosis induced in Sprague-Dawley rats by injections of areca nut and pan masala (commercial areca nut product) extracts. J. Cancer Res. Ther. 2016, 12, 379. [Google Scholar] [PubMed]
- Rajalalitha, P.; Vali, S. Molecular pathogenesis of oral submucous fibrosis—A collagen metabolic disorder. J. Oral Pathol. Med. 2005, 34, 321–328. [Google Scholar] [CrossRef] [PubMed]
- Yang, H.; Fang, L.; Zhan, R.; Hegarty, J.M.; Ren, J.; Hsiai, T.K.; Gleeson, J.G.; Miller, Y.I.; Trejo, J.; Chi, N.C. Polo-like kinase 2 regulates angiogenic sprouting and blood vessel development. Dev. Biol. 2015, 404, 49–60. [Google Scholar] [CrossRef] [PubMed]
- Lowell, C. Src-family kinases: Rheostats of immune cell signaling. Mol. Immunol. 2004, 41, 631–643. [Google Scholar] [CrossRef] [PubMed]
- Xu, Y.; Harder, K.W.; Huntington, N.D.; Hibbs, M.L.; Tarlinton, D.M. Lyn Tyrosine Kinase: Accentuating the Positive and the Negative. Immunity 2005, 22, 9–18. [Google Scholar] [CrossRef] [PubMed]
- Lim, Y.J.; Koo, J.E.; Hong, E.H.; Park, Z.Y.; Lim, K.M.; Bae, O.N.; Lee, J.Y. A Src-family-tyrosine kinase, Lyn, is required for efficient IFN-β expression in pattern recognition receptor, RIG-I, signal pathway by interacting with IPS-1. Cytokine 2015, 72, 63–70. [Google Scholar] [CrossRef] [PubMed]
- Chen, D.; Yang, K.; Zhang, G.; Mei, J.; Xiang, L. Screen and analysis of key disease genes for precancerous lesions of oral buccal mucosa induced by DMBA in golden hamsters. Oncol. Lett. 2011, 2, 265–271. [Google Scholar] [CrossRef] [PubMed][Green Version]
- Garrett-Sinha, L.A. Review of Ets1 structure, function, and roles in immunity. Cell. Mol. Life Sci. 2013, 70, 3375–3390. [Google Scholar] [CrossRef] [PubMed]
- Mayeux, J.; Skaug, B.; Luo, W.; Russell, L.M.; John, S.; Saelee, P.; Abbasi, H.; Li, Q.-Z.; Garrett-Sinha, L.A.; Satterthwaite, A.B. Genetic Interaction between Lyn, Ets1, and Btk in the Control of Antibody Levels. J. Immunol. 2015, 195, 1955–1963. [Google Scholar] [CrossRef] [PubMed]
- Oikawa, T.; Yamada, T. Molecular biology of the Ets family of transcription factors. Gene 2003, 303, 11–34. [Google Scholar] [CrossRef]
- Vairaktaris, E.; Spyridonidou, S.; Goutzanis, L.; Vylliotis, A.; Lazaris, A.; Donta, I.; Perrea, D.; Yapijakis, C.; Patsouris, E. Diabetes and oral oncogenesis. Anticancer Res. 2007, 27, 4185–4193. [Google Scholar] [PubMed]
- Vairaktaris, E.; Spyridonidou, S.; Papakosta, V.; Vylliotis, A.; Lazaris, A.; Perrea, D.; Yapijakis, C.; Patsouris, E. The hamster model of sequential oral oncogenesis. Oral Oncol. 2008, 44, 315–324. [Google Scholar] [CrossRef] [PubMed]
- Wang, D.; Dubois, R.N. Prostaglandins and cancer. Gut 2006, 55, 115–122. [Google Scholar] [CrossRef] [PubMed]
- Yip-Schneider, M.T.; Barnard, D.S.; Billings, S.D.; Cheng, L.; Heilman, D.K.; Lin, A.; Marshall, S.J.; Crowell, P.L.; Marshall, M.S.; Sweeney, C.J. Cyclooxygenase-2 expression in human pancreatic adenocarcinomas. Carcinogenesis 2000, 21, 139–146. [Google Scholar] [CrossRef] [PubMed]
- Lee, L.M.; Pan, C.C.; Cheng, C.J.; Chi, C.W.; Liu, T.Y. Expression of cyclooxygenase-2 in prostate adenocarcinoma and benign prostatic hyperplasia. Anticancer Res. 2001, 21, 1291–1294. [Google Scholar] [PubMed]
- Byatnal, A.A.; Byatnal, A.; Sen, S.; Guddattu, V.; Solomon, M.C. Cyclooxygenase-2—An Imperative Prognostic Biomarker in Oral Squamous Cell Carcinoma—An Immunohistochemical Study. Pathol. Oncol. Res. 2015, 21, 1123–1131. [Google Scholar] [CrossRef] [PubMed]
- Seyedmajidi, M.; Shafaee, S.; Siadati, S.; Khorasani, M.; Bijani, A.; Ghasemi, N. Cyclo-oxygenase-2 expression in oral squamous cell carcinoma. J. Cancer Res. Ther. 2014, 10, 1024. [Google Scholar] [CrossRef] [PubMed]
- Mauro, A.; Lipari, L.; Leone, A.; Tortorici, S.; Burruano, F.; Provenzano, S.; Gerbino, A.; Buscemi, M. Expression of cyclooxygenase-1 and cyclooxygenase-2 in normal and pathological human oral mucosa. Folia Histochem. Cytobiol. 2011, 48, 555–563. [Google Scholar] [CrossRef] [PubMed]
- Huang, D.W.; Sherman, B.T.; Tan, Q.; Kir, J.; Liu, D.; Bryant, D.; Guo, Y.; Stephens, R.; Baseler, M.W.; Lane, H.C.; et al. DAVID Bioinformatics Resources: Expanded annotation database and novel algorithms to better extract biology from large gene lists. Nucleic Acids Res. 2007, 35, W169–W175. [Google Scholar] [CrossRef] [PubMed]
- Von Mering, C.; Jensen, L.J.; Snel, B.; Hooper, S.D.; Krupp, M.; Foglierini, M.; Jouffre, N.; Huynen, M.A.; Bork, P. STRING: Known and predicted protein-protein associations, integrated and transferred across organisms. Nucleic Acids Res. 2005, 33, D433–D437. [Google Scholar] [CrossRef] [PubMed]
- Kamburov, A.; Pentchev, K.; Galicka, H.; Wierling, C.; Lehrach, H.; Herwig, R. ConsensusPathDB: Toward a more complete picture of cell biology. Nucleic Acids Res. 2011, 39, D712–D717. [Google Scholar] [CrossRef] [PubMed]
- Walter, W.; Sánchez-Cabo, F.; Ricote, M. GOplot: An R package for visually combining expression data with functional analysis: Fig. 1. Bioinformatics 2015, 31, 2912–2914. [Google Scholar] [CrossRef] [PubMed]


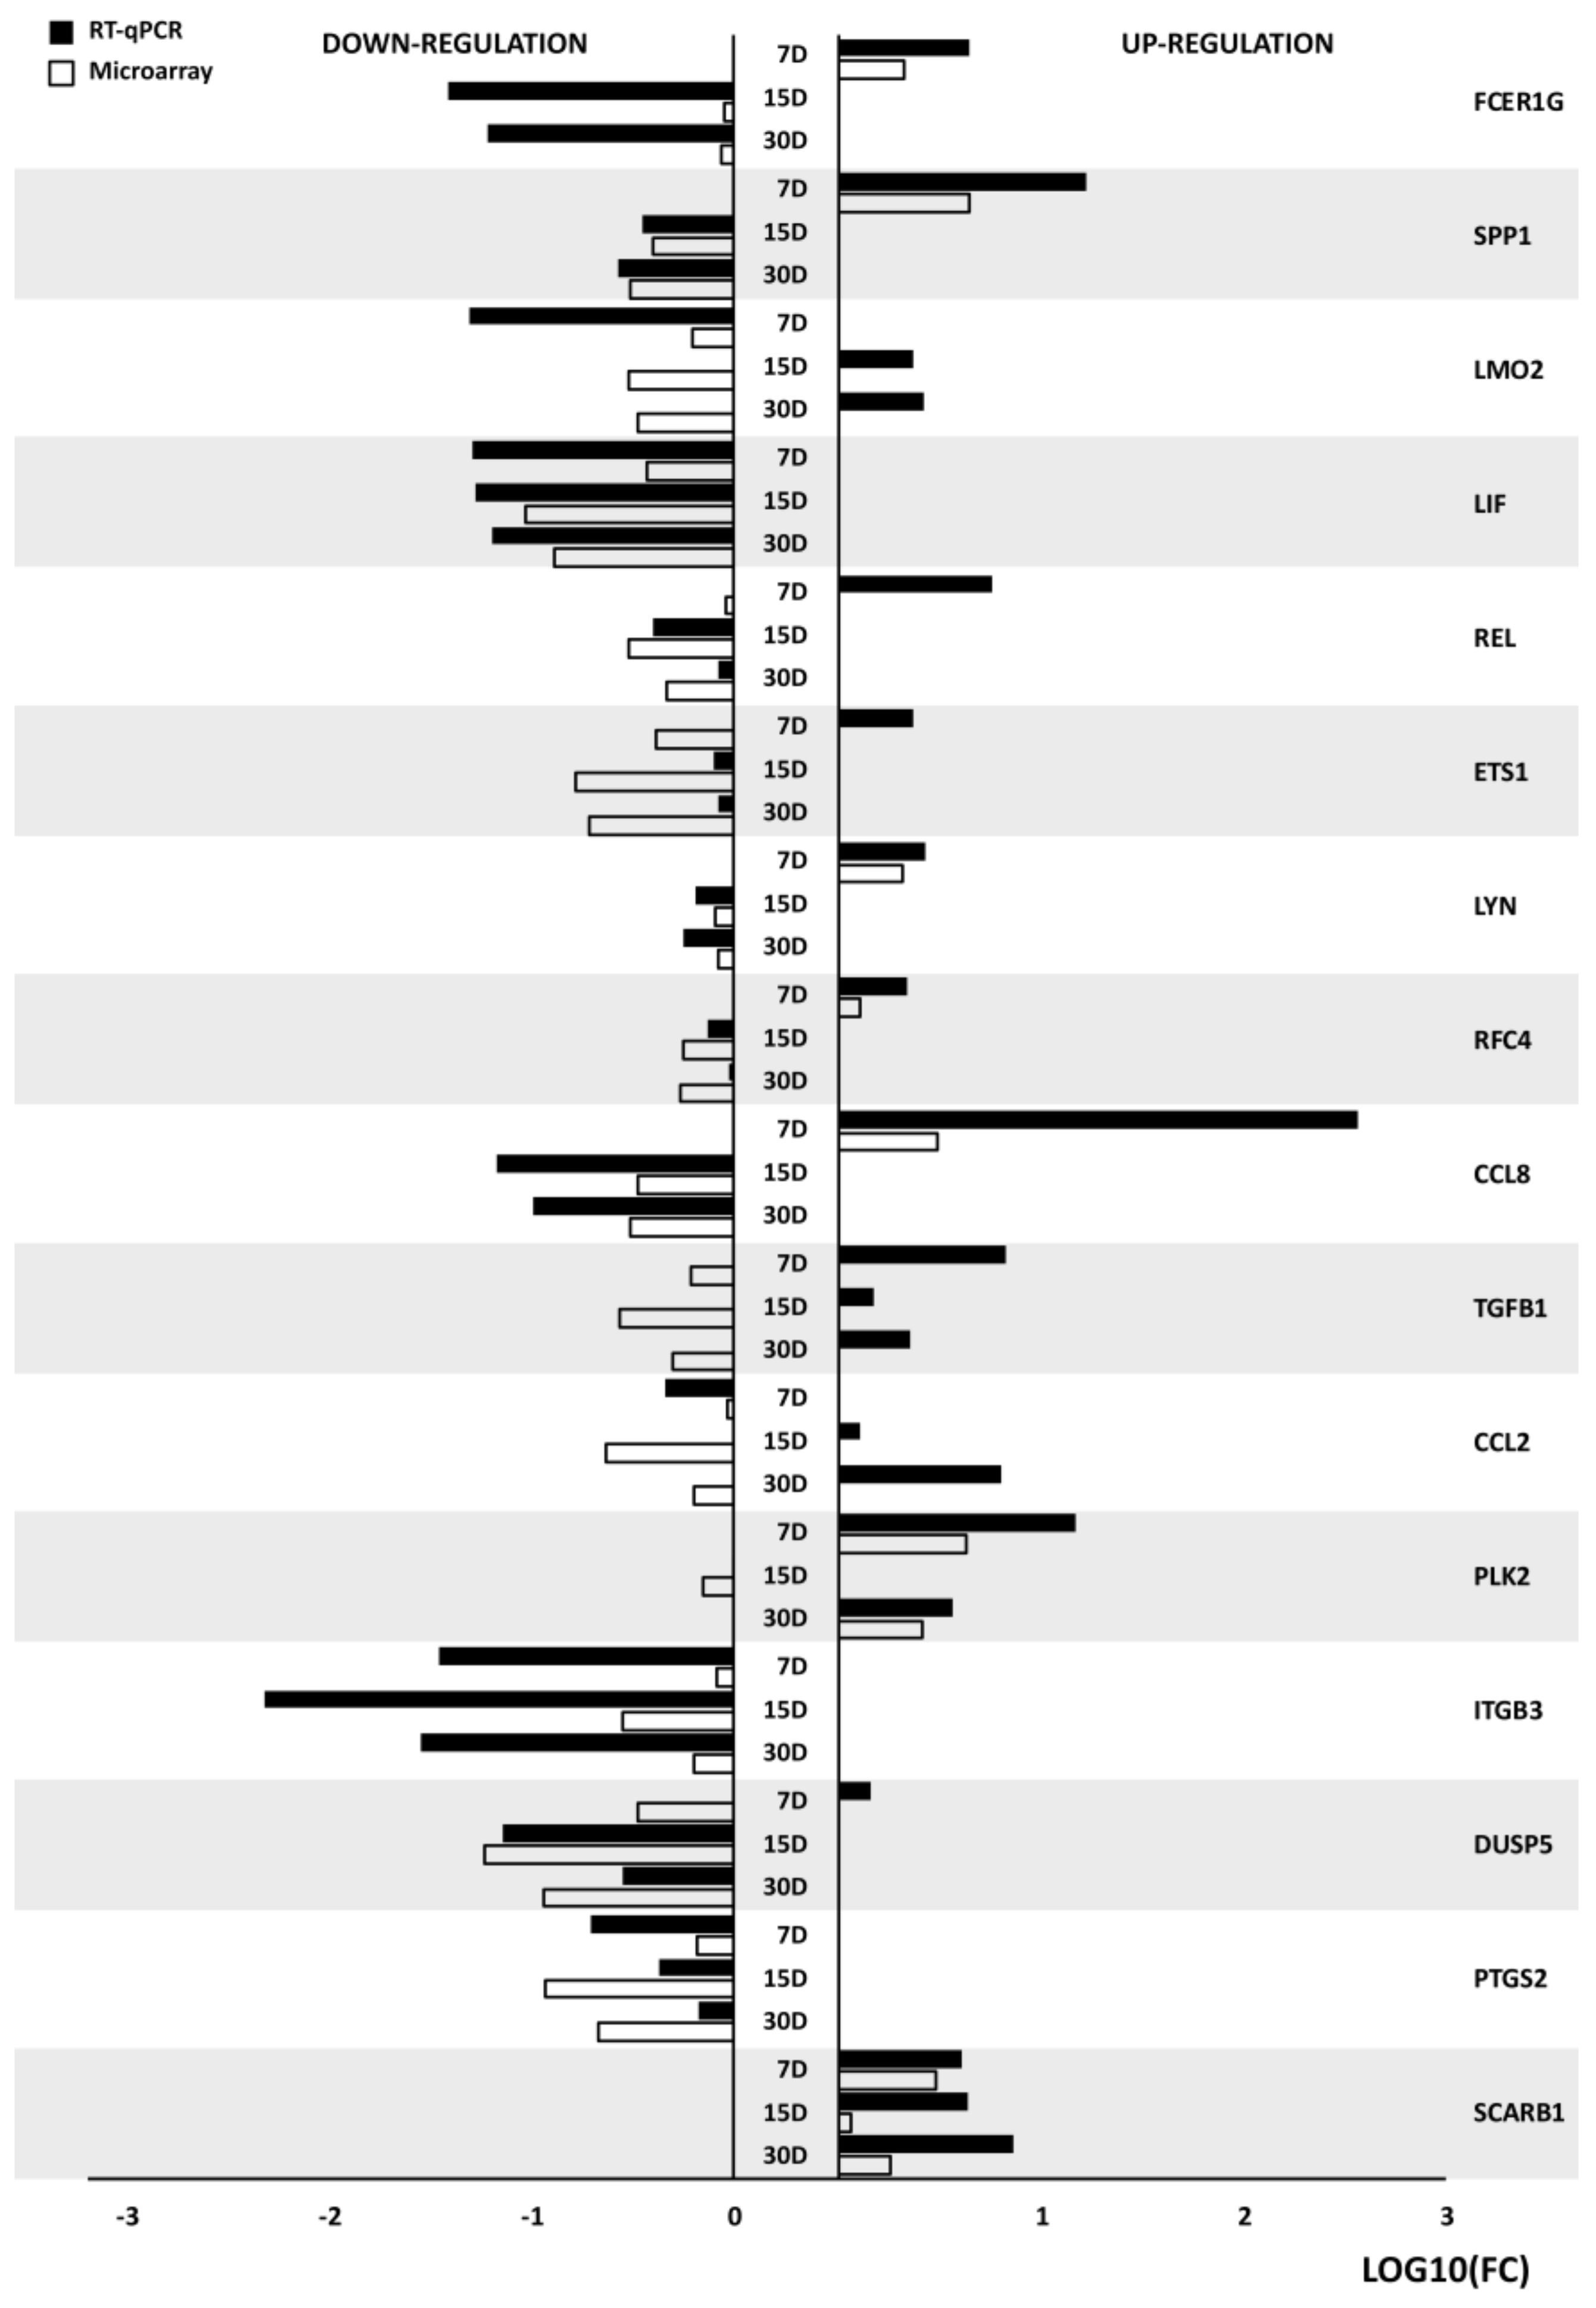
| Official Gene Symbol | Fold Change D7/D1 | Fold Change D15/D1 | Fold Change D30/D1 | Fold Change D7/D15 | Fold Change D7/D30 | Fold Change D15/D30 | ENTREZ GENE ID |
|---|---|---|---|---|---|---|---|
| LMO2 | 0.62 (0.004) | 0.30 (0.0001) | 0.33 (0.0002) | 0.48 (0.03) | 0.54 (0.03) | 1.11 (0.74) | 4005 |
| LIF | 0.37 (0.005) | 0.09 (4.45 × 10⁻⁵) | 0.13 (5.79 × 10⁻⁵) | 0.25 (0.01) | 0.35 (0.02) | 1.40 (0.33) | 3976 |
| REL | 0.91 (0.49) | 0.30 (0.0004) | 0.46 (0.002) | 0.33 (0.02) | 0.51 (0.06) | 1.53 (0.38) | 5966 |
| ETS1 | 0.41 (0.002) | 0.16 (0.0001) | 0.19 (0.0002) | 0.40 (0.03) | 0.46 (0.05) | 1.17 (0.75) | 2113 |
| LYN | 2.04 (0.005) | 0.81 (0.20) | 0.83 (0.25) | 0.40 (0.03) | 0.41 (0.04) | 1.03 (0.98) | 4067 |
| RFC4 | 1.27 (0.11) | 0.57 (0.006) | 0.54 (0.004) | 0.45 (0.03) | 0.43 (0.04) | 0.95 (0.94) | 5984 |
| CCL8 | 3.04 (0.0005) | 0.33 (0.0004) | 1.30 (0.0003) | 0.11 (0.01) | 0.10 (0.01) | 0.92 (0.86) | 6355 |
| TGFB1 | 0.61 (0.002) | 0.27 (8.78 × 10⁻⁵) | 0.50 (0.0005) | 0.44 (0.01) | 0.81 (0.22) | 1.84 (0.07) | 7040 |
| PLK2 | 4.25 (0.002) | 0.71 (0.20) | 2.59 (0.01) | 0.17 (0.03) | 0.61 (0.31) | 3.67 (0.19) | 10,769 |
| ITGB3 | 0.82 (0.32) | 0.28 (0.001) | 0.63 (0.04) | 0.34 (0.04) | 0.77 (0.42) | 2.22 (0.23) | 3690 |
| DUSP5 | 0.34 (0.01) | 0.06 (0.0004) | 0.11 (0.0009) | 0.17 (0.04) | 0.34 (0.12) | 1.97 (0.46) | 1847 |
| PTGS2 | 0.66 (0.16) | 0.12 (0.0007) | 0.22 (0.002) | 0.18 (0.03) | 0.33 (0.09) | 1.86 (0.45) | 5743 |
| SCARB1 | 3.01 (0.001) | 1.14 (0.40) | 1.79 (0.01) | 0.38 (0.03) | 0.59 (0.13) | 1.56 (0.36) | 949 |
| FCER1G | 2.09 (0.001) | 0.89 (0.32) | 0.87 (0.24) | 0.42 (0.03) | 0.41 (0.02) | 0.98 (0.98) | 2207 |
| SPP1 | 4.35 (0.002) | 0.40 (0.01) | 0.30 (0.005) | 0.09 (0.02) | 0.07 (0.02) | 0.76 (0.77) | 6696 |
| CCL2 | 0.92 (0.75) | 0.23 (0.002) | 0.63 (0.09) | 0.25 (0.04) | 0.69 (0.40) | 2.71 (0.23) | 6347 |
| p-Value | q-Value | Complex_Name | Source | Members_Input_Overlap | Members_Input_Overlap_Geneids | Size | Effective_Size |
|---|---|---|---|---|---|---|---|
| 5.51 × 10⁻⁶ | 2.94 × 10⁻⁵ | αv/β3 Integrin/Osteopontin | PID | ITGB3; SPP1 | 3690; 6696 | 3 | 3 |
| 1.10 × 10⁻⁵ | 2.94 × 10⁻⁵ | GPVI:FceRI γ:FYN:LYN | Reactome | FCER1G; LYN | 2207; 4067 | 4 | 4 |
| 1.10 × 10⁻⁵ | 2.94 × 10⁻⁵ | αv/β3 Integrin/Osteopontin/Src | PID | ITGB3; SPP1 | 3690; 6696 | 4 | 4 |
| 1.83 × 10⁻⁵ | 2.94 × 10⁻⁵ | Fc epsilon receptor I/LYN/SYK | BioCarta | FCER1G; LYN | 2207; 4067 | 5 | 5 |
| 1.83 × 10⁻⁵ | 2.94 × 10⁻⁵ | GPVI:phosphorylated Fc Epsilon R1 γ:FYN:LYN:Collagen type I:SYK | Reactome | FCER1G; LYN | 2207; 4067 | 5 | 5 |
| 2.75 × 10⁻⁵ | 3.67 × 10⁻⁵ | Antigen/IgE/Fc epsilon R1/LYN/SYK | PID | FCER1G; LYN | 2207; 4067 | 6 | 6 |
| 3.85 × 10⁻⁵ | 4.40 × 10⁻⁵ | Antigen/IgE/Fc epsilon R1/LYN/SYK/WIP | PID | FCER1G; LYN | 2207; 4067 | 7 | 7 |
| Gene | Number | Product Length (bp) | 3′-5′ | 5′-3′ |
|---|---|---|---|---|
| SCARB1 | NM_213967.1 | 242 | ccccatcgtctaccagatcc | agtcctgaagaagtggggtg |
| PTGS2 | NM_214321 | 202 | aaaggcctcaatcgaccaga | atctgggcgaggcttttcta |
| DUSP5 | XM_003359366 | 250 | tgcacgacccacctacacta | gcgagatcacactcctcctc |
| ITGB3 | NM_214002.1 | 231 | ctcatcggccttgctactct | agagacacccacaatcctgg |
| PLK2 | XM_003133981 | 205 | agcctgcttccagacaaaaa | gaaggaggtagagccgaggt |
| CCL2 | NM_214214.1 | 112 | gaagagtcaccagcagcaag | tggcttatggagtcctggac |
| TGFB1 | NM_214015.2 | 208 | accatgccaatttctgcctg | gaacgcacgatcatgttgga |
| CCL8 | NM_001164515.1 | 206 | caatggaaagatccccttca | ctcgcagtccaggtaggaag |
| RFC4 | XM_013988325 | 169 | atgcatctgatgaacgtgga | cgtcttaaagctgcctgagc |
| LYN | XM_021089363.1 | 248 | agaggccatcaacttcggat | tctgcaggtagtcgaaggtg |
| ETS1 | NM_001162886.1 | 166 | atcagctggacaggagatgg | gtttacccgccgtcttgtg |
| REL | XM_005662527.3 | 238 | ccagaaactgtggcaggatt | aggctgaggtaccattgtgg |
| LIF | NM_214402.2 | 209 | gtgccaacgccctctttatt | attgaggctcctttggtccc |
| SPP1 | NM_214023 | 82 | agaagttccgcagatccgaa | tccgtctcctcactttccac |
| FCR1G | NM_001001265.1 | 111 | accctcctctactgtcgact | ataagtctcctggttccggg |
© 2018 by the authors. Licensee MDPI, Basel, Switzerland. This article is an open access article distributed under the terms and conditions of the Creative Commons Attribution (CC BY) license (http://creativecommons.org/licenses/by/4.0/).
Share and Cite
Dyszkiewicz-Konwińska, M.; Nawrocki, M.J.; Huang, Y.; Bryja, A.; Celichowski, P.; Jankowski, M.; Błochowiak, K.; Mehr, K.; Bruska, M.; Nowicki, M.; et al. New Gene Markers for Metabolic Processes and Homeostasis in Porcine Buccal Pouch Mucosa during Cells Long Term-Cultivation—A Primary Culture Approach. Int. J. Mol. Sci. 2018, 19, 1027. https://doi.org/10.3390/ijms19041027
Dyszkiewicz-Konwińska M, Nawrocki MJ, Huang Y, Bryja A, Celichowski P, Jankowski M, Błochowiak K, Mehr K, Bruska M, Nowicki M, et al. New Gene Markers for Metabolic Processes and Homeostasis in Porcine Buccal Pouch Mucosa during Cells Long Term-Cultivation—A Primary Culture Approach. International Journal of Molecular Sciences. 2018; 19(4):1027. https://doi.org/10.3390/ijms19041027
Chicago/Turabian StyleDyszkiewicz-Konwińska, Marta, Mariusz J. Nawrocki, Yan Huang, Artur Bryja, Piotr Celichowski, Maurycy Jankowski, Katarzyna Błochowiak, Katarzyna Mehr, Małgorzata Bruska, Michał Nowicki, and et al. 2018. "New Gene Markers for Metabolic Processes and Homeostasis in Porcine Buccal Pouch Mucosa during Cells Long Term-Cultivation—A Primary Culture Approach" International Journal of Molecular Sciences 19, no. 4: 1027. https://doi.org/10.3390/ijms19041027
APA StyleDyszkiewicz-Konwińska, M., Nawrocki, M. J., Huang, Y., Bryja, A., Celichowski, P., Jankowski, M., Błochowiak, K., Mehr, K., Bruska, M., Nowicki, M., Zabel, M., & Kempisty, B. (2018). New Gene Markers for Metabolic Processes and Homeostasis in Porcine Buccal Pouch Mucosa during Cells Long Term-Cultivation—A Primary Culture Approach. International Journal of Molecular Sciences, 19(4), 1027. https://doi.org/10.3390/ijms19041027