In Vivo Evaluation of Cerebral Hemodynamics and Tissue Morphology in Rats during Changing Fraction of Inspired Oxygen Based on Spectrocolorimetric Imaging Technique

 and
and 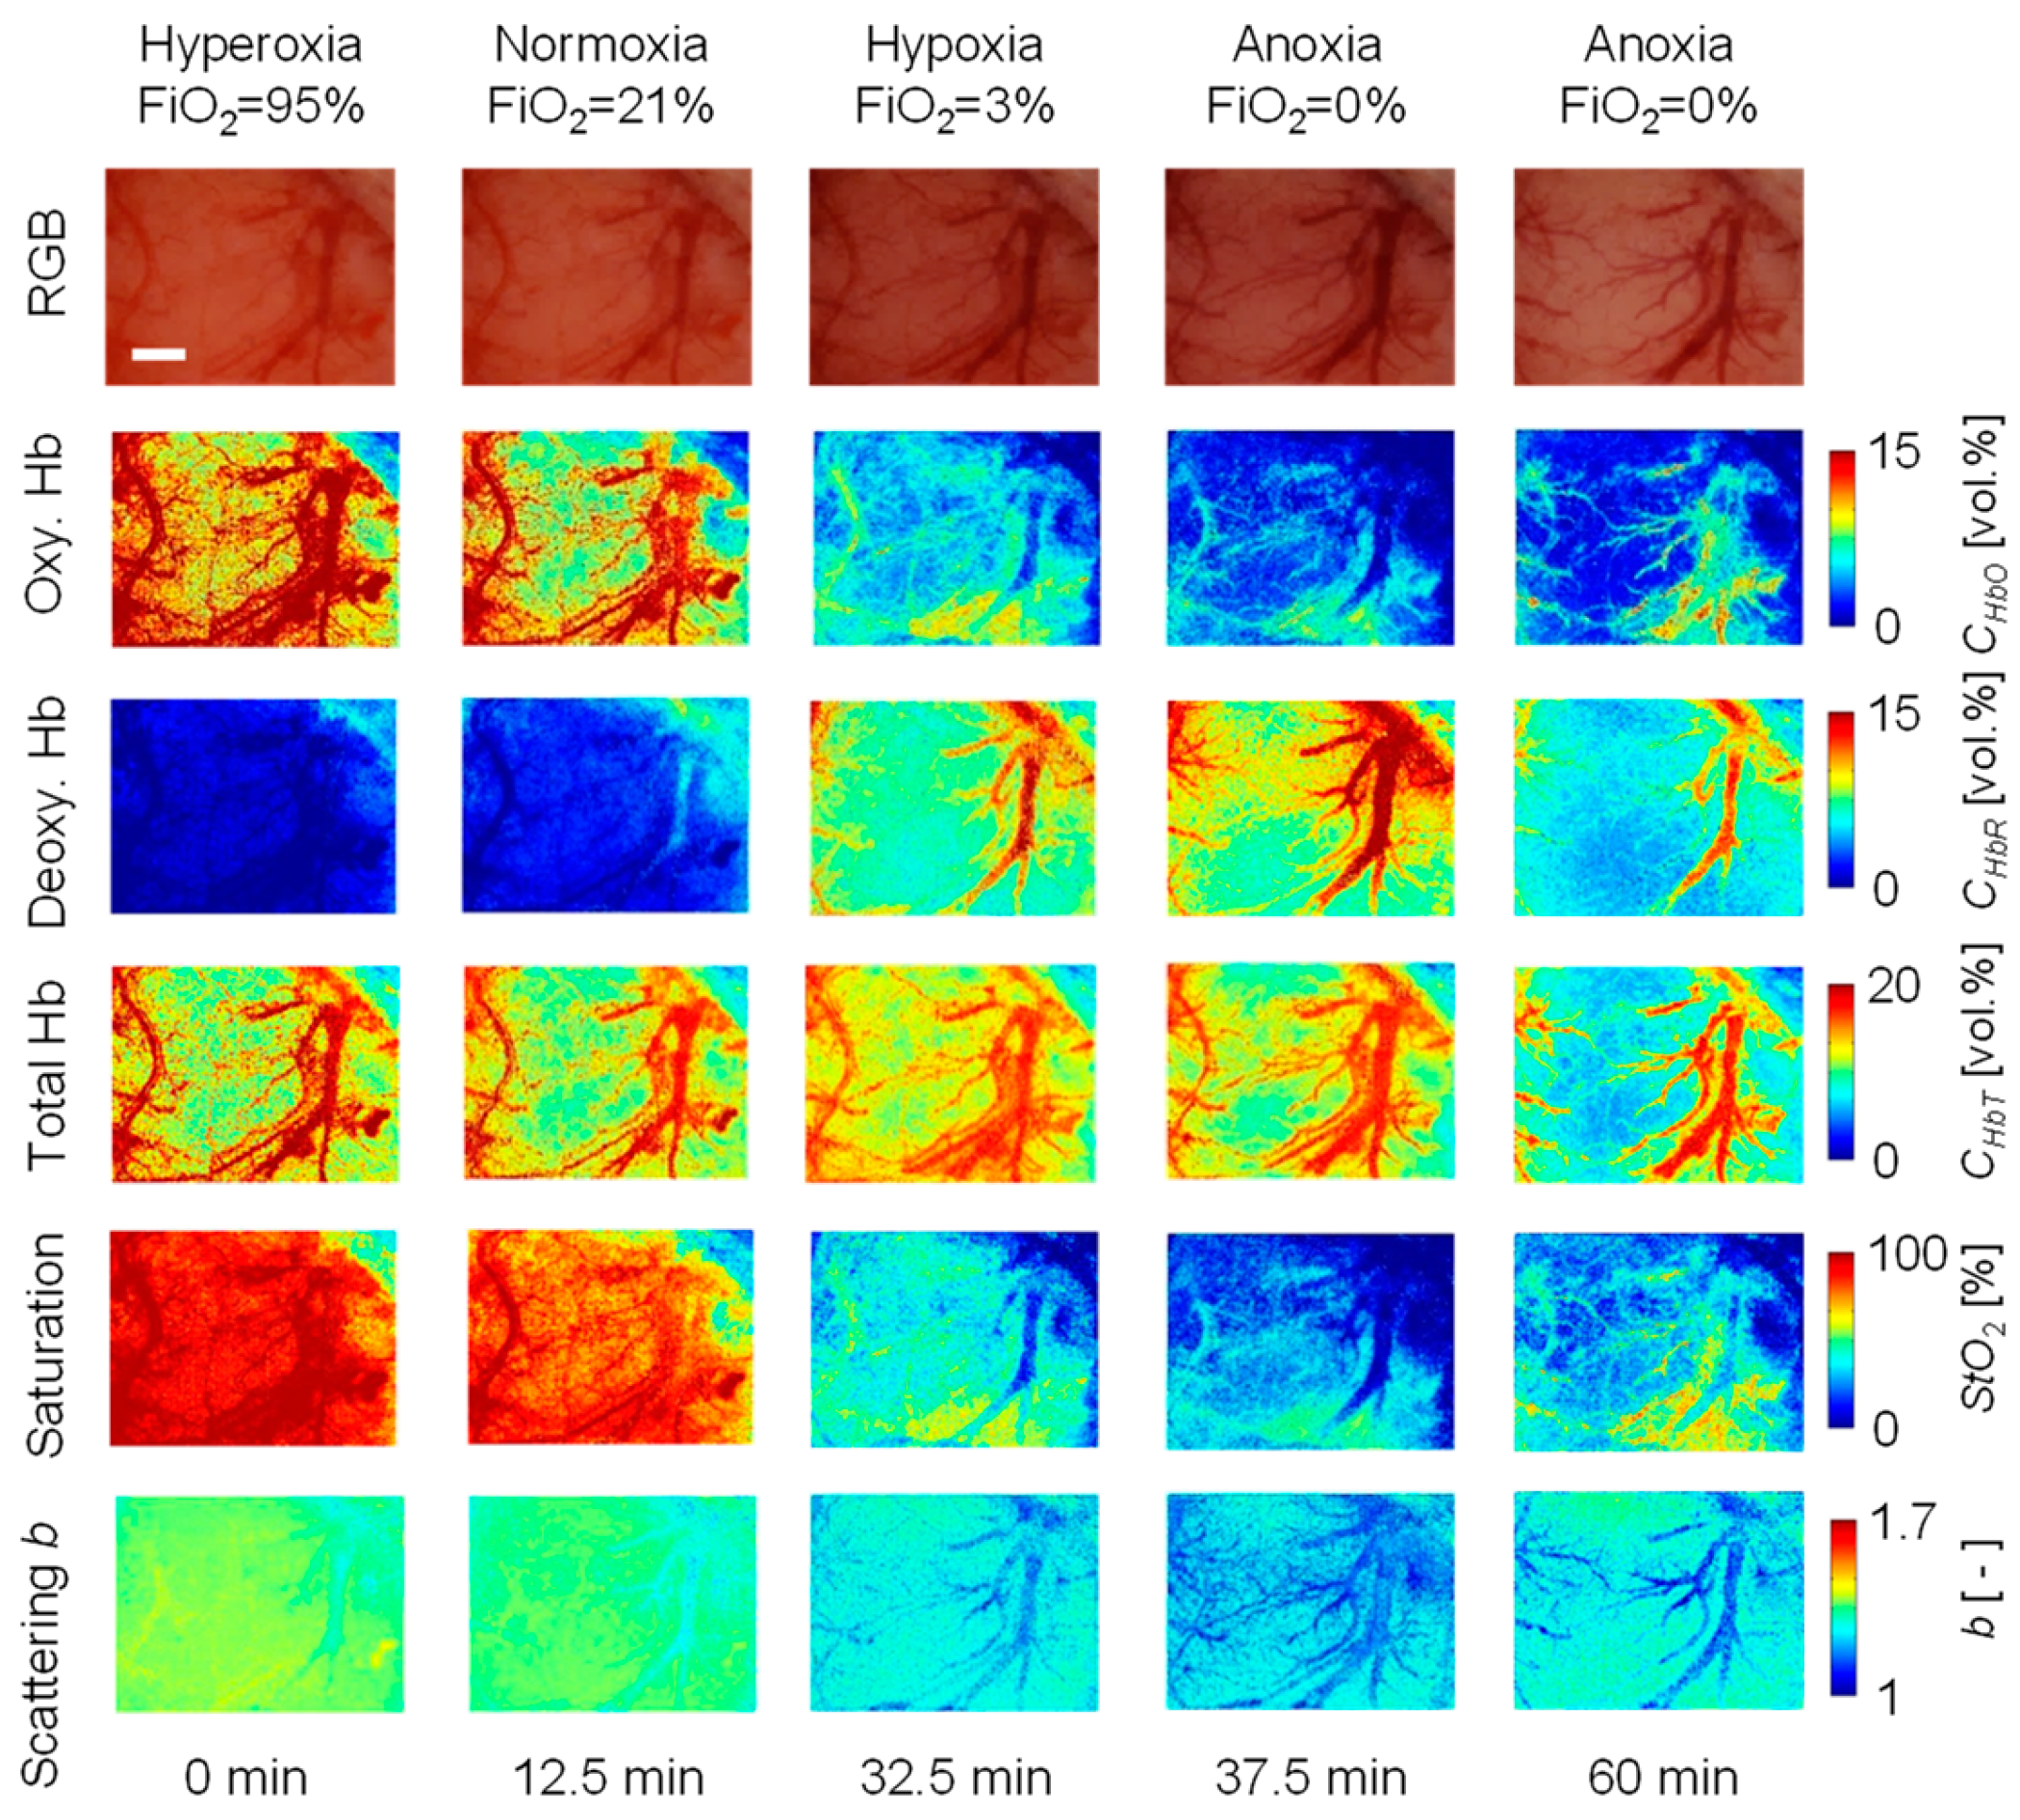
Abstract
:1. Introduction
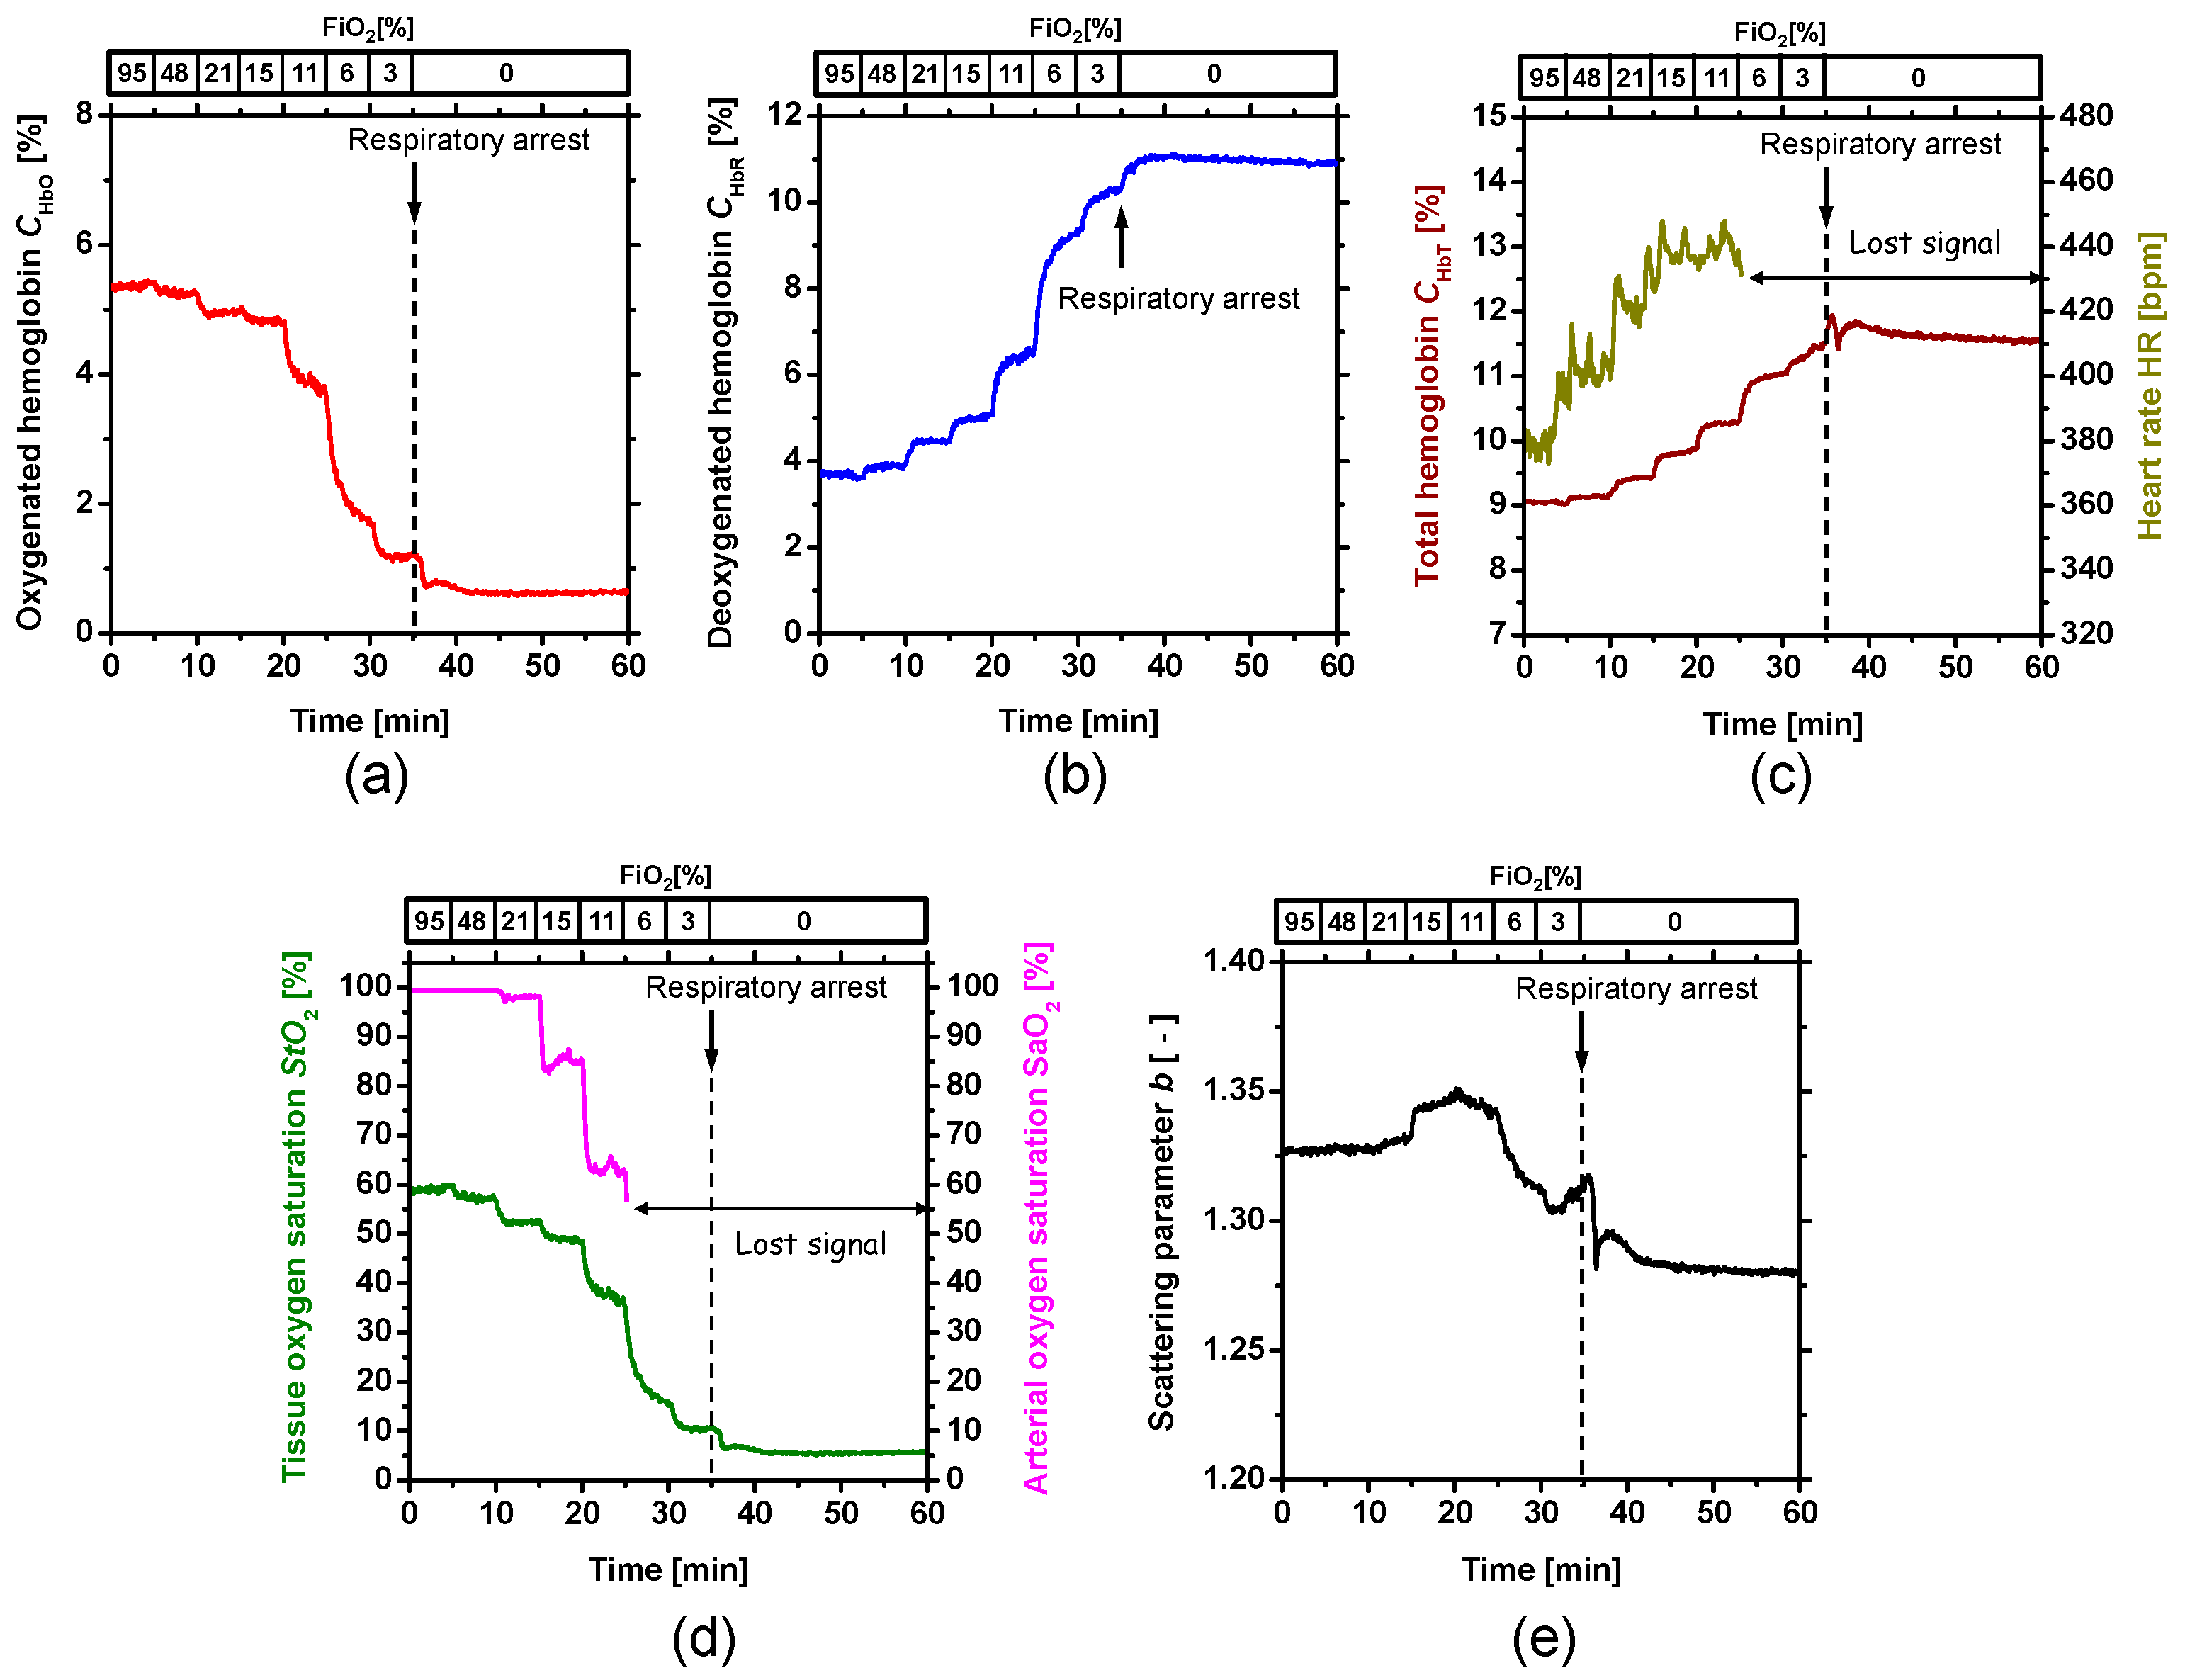
2. Results and Discussion
3. Materials and Methods
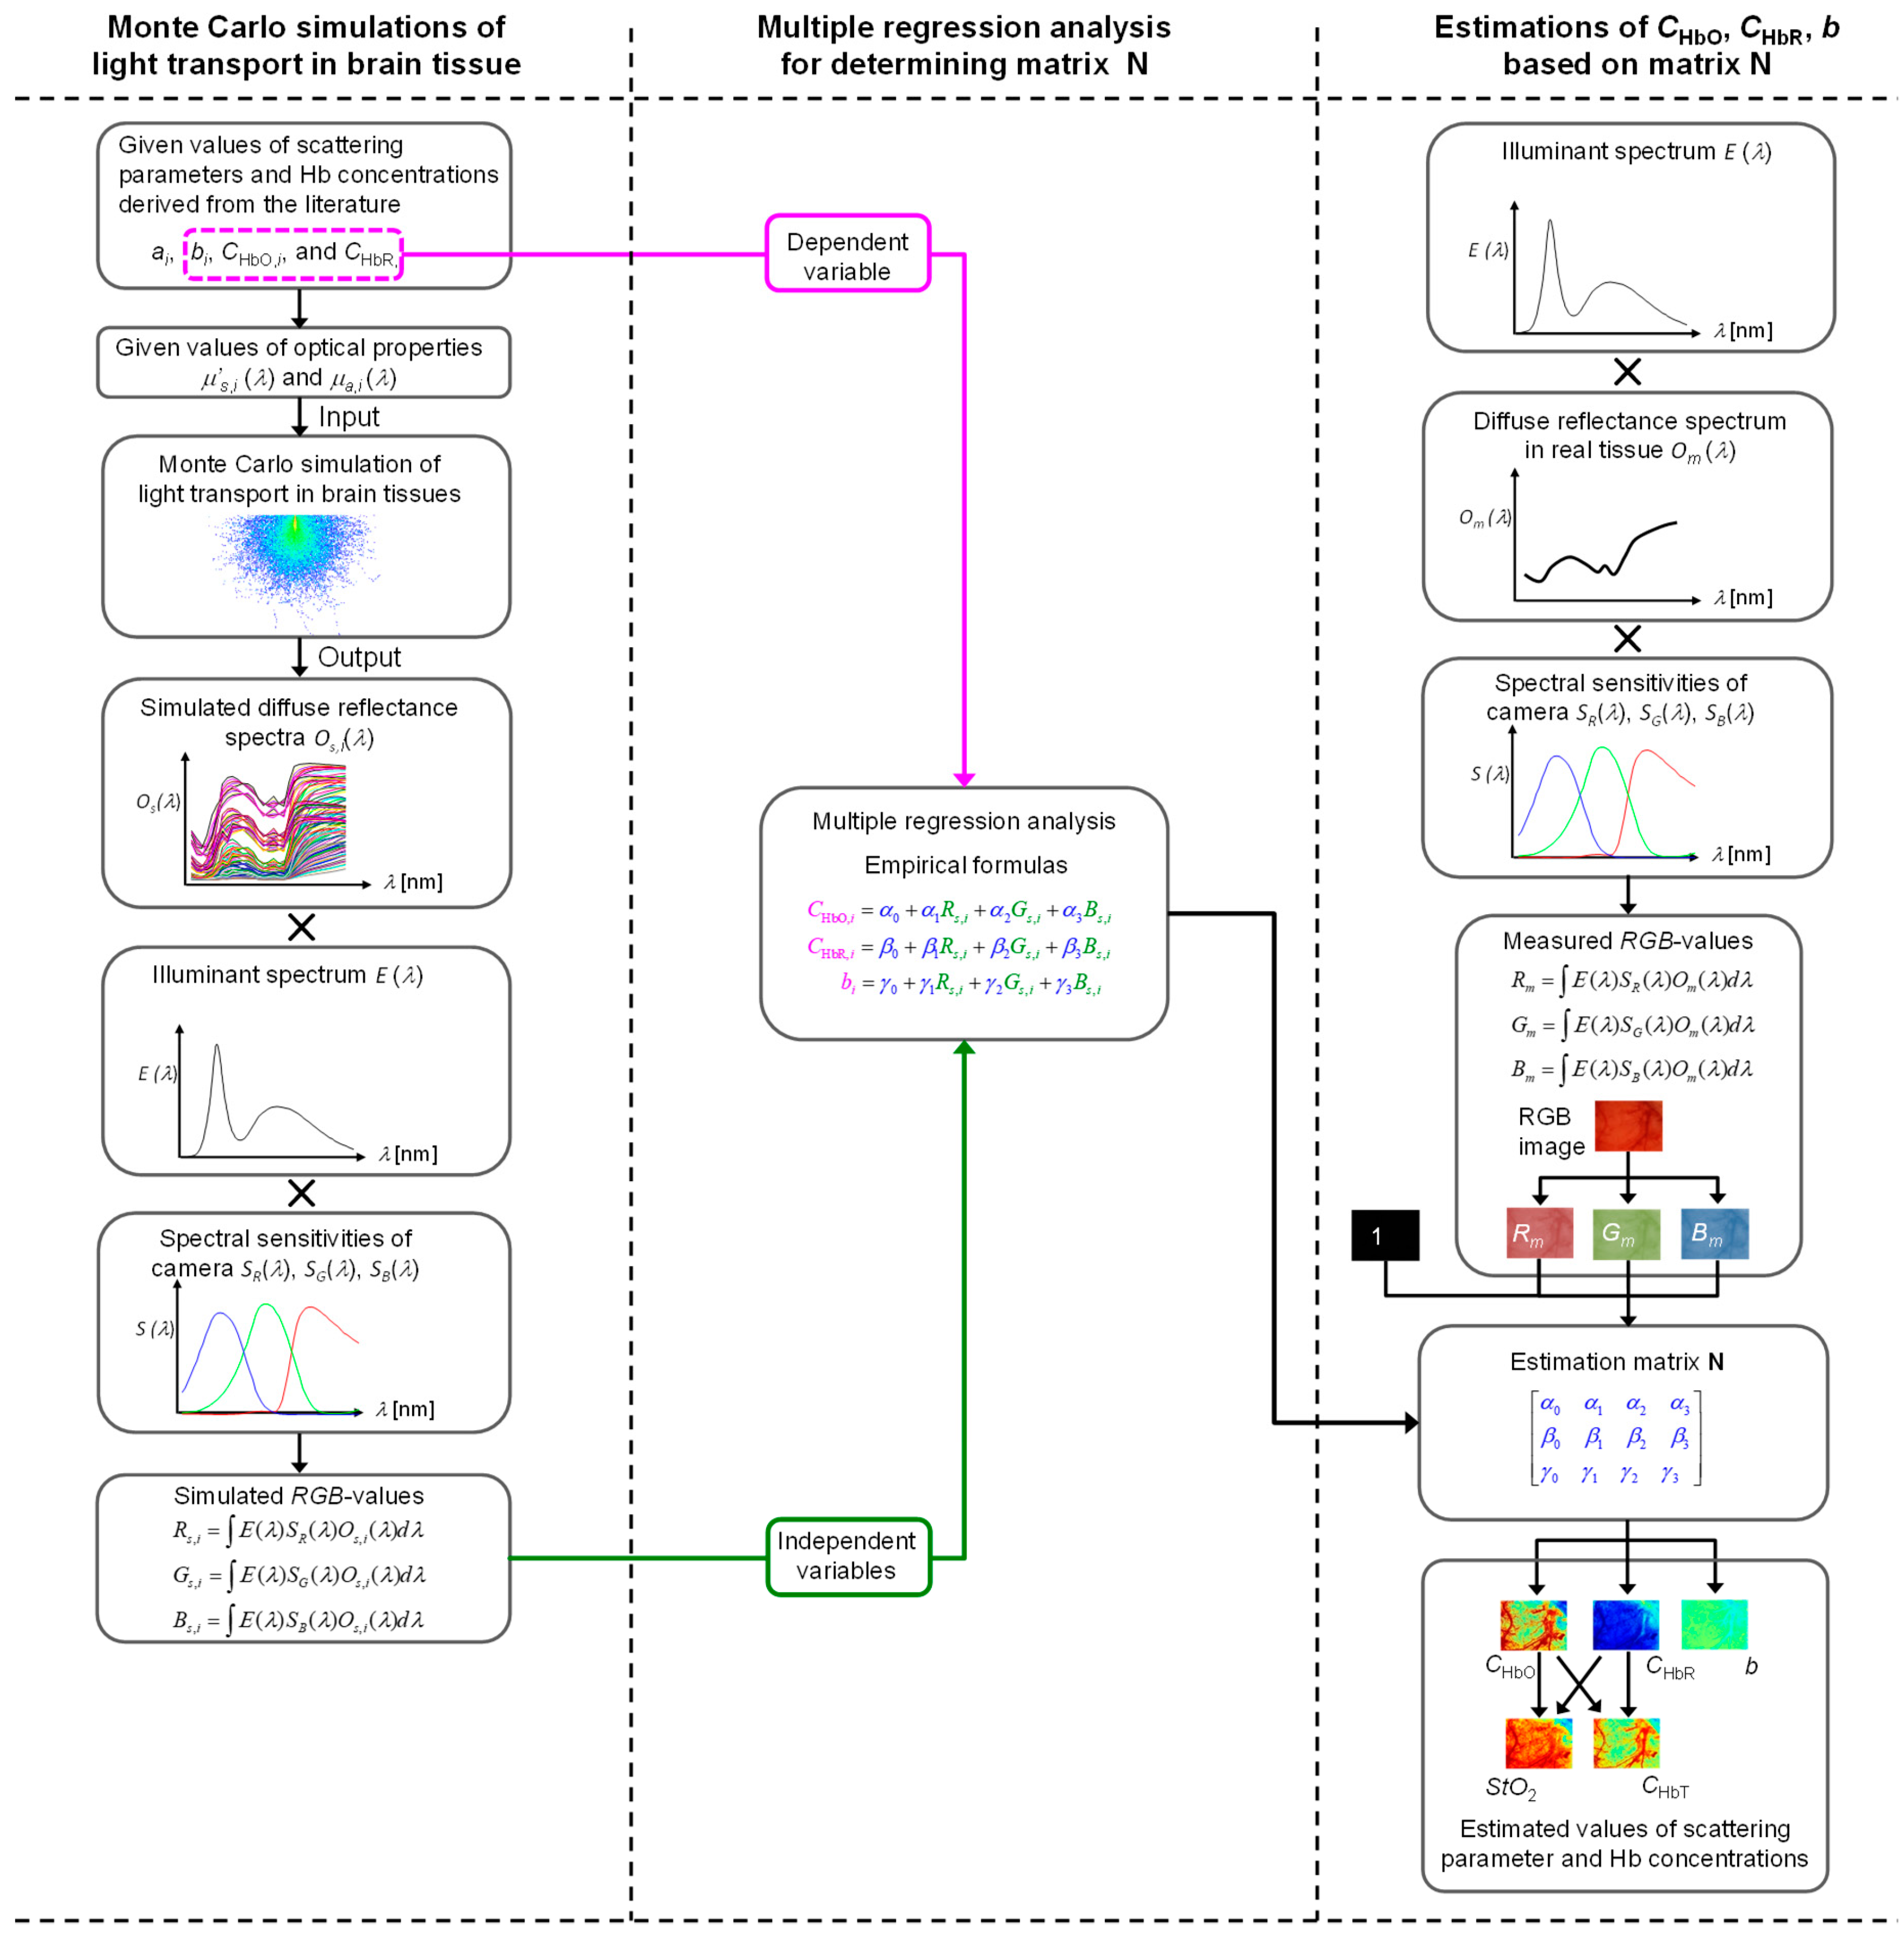
3.1. Relationship between Red-Green-Blue (RGB) Values and Optical Properties of Cerebral Tissue
3.2. Estimation of Hemoglobin Concentrations and Scattering Parameter Based on RGB Images
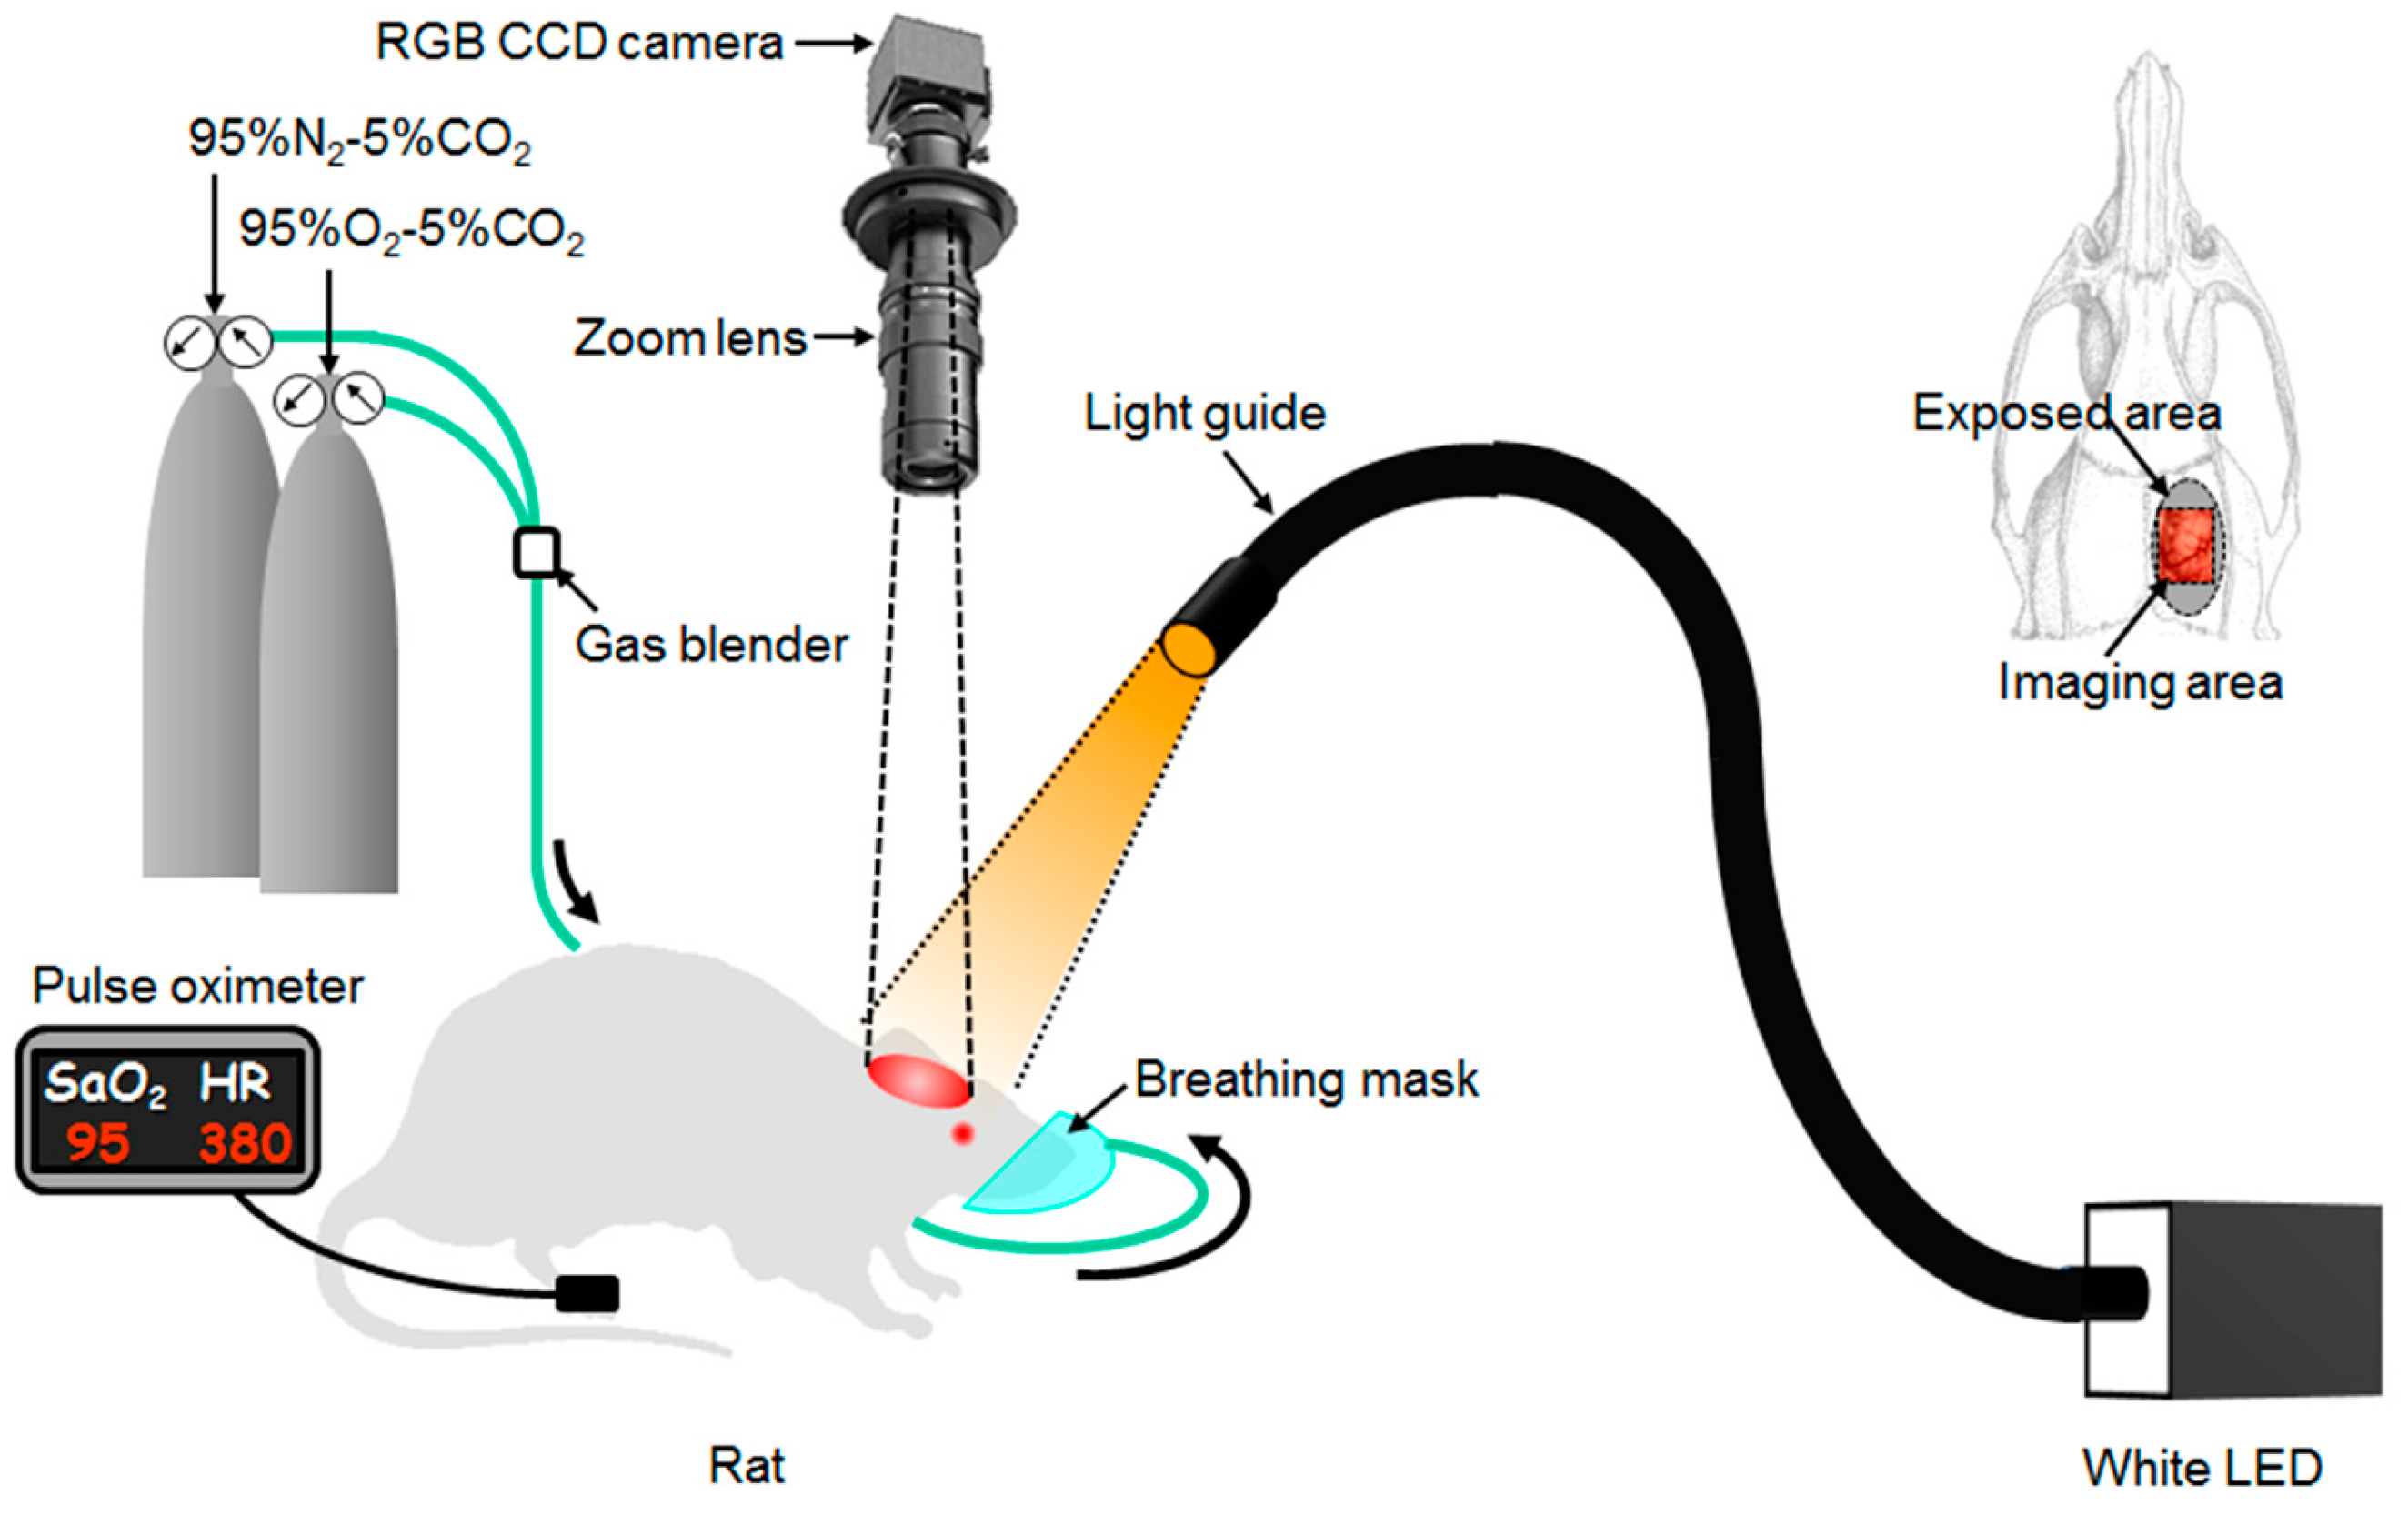
3.3. Imaging System
3.4. Animal Experiments
3.5. Statistical Considerations
4. Conclusions
Acknowledgments
Author Contributions
Conflicts of Interest
References
- Mathers, C.; Stevens, G.; Mahanani, W.R.; Ho, J.; Fat, D.M.; Hogan, D. WHO Methods and Data Sources for Country—Level Causes of Death 2000–2015; Global Health Estimates Technical Paper WHO/HIS/IER/GHE/2016.3; World Health Organization: Geneva, Switzerland, 2017. [Google Scholar]
- Sims, N.R.; Muyderman, H. Mitochondria, oxidative metabolism and cell death in stroke. Biochim. Biophys. Acta 2010, 1802, 80–91. [Google Scholar] [CrossRef] [PubMed]
- Bonhoeffer, T.; Grinvald, A. Brain Mapping: The Methods; Academic Press: San Diego, CA, USA, 1996. [Google Scholar]
- Tuchin, V. Tissue Optics: Light Scattering Methods and Instruments for Medical Diagnosis, 2nd ed.; SPIE Press: Bellingham, WA, USA, 2007. [Google Scholar]
- Mourant, J.R.; Freyer, J.P.; Hielscher, A.H.; Eick, A.A.; Shen, D.; Johnson, T.M. Mechanism of light scattering from biological cells relevant to noninvasive optical-tissue diagnostics. Appl. Opt. 1998, 37, 3586–3593. [Google Scholar] [CrossRef] [PubMed]
- Abookasis, D.; Lay, C.C.; Mathews, M.S.; Linskey, M.E.; Frostig, R.D.; Tromberg, B.J. Imaging cortical absorption, scattering, and hemodynamic response during ischemic stroke using specially modulated near-infrared illumination. J. Biomed. Opt. 2009, 14, 024033. [Google Scholar] [CrossRef] [PubMed]
- Wang, X.; Pogue, B.W.; Jiang, S.; Song, X.; Paulsen, K.D.; Kogel, C.; Poplack, S.P.; Wells, W.A. Approximation of Mie scattering parameters in near-infrared tomography of normal breast tissue in vivo. J. Biomed. Opt. 2005, 10, 051704. [Google Scholar] [CrossRef] [PubMed]
- Mourant, J.R.; Fuselier, T.; Boyer, J.; Johnson, T.M.; Bigio, I.J. Predictions and measurements of scattering and absorption over broad wavelength ranges in tissue phantoms. Appl. Opt. 1997, 36, 949–957. [Google Scholar] [CrossRef] [PubMed]
- Nishidate, I.; Yoshida, K.; Sato, M. Changes in optical properties of rat cerebral cortical slices during oxygen glucose deprivation. Appl. Opt. 2010, 49, 6617–6623. [Google Scholar] [CrossRef] [PubMed]
- Ishimaru, A. Wave Propagation and Scattering in Random Media; Academic Press: New York, NY, USA, 1978. [Google Scholar]
- Prahl, S.A.; van Gemert, M.J.; Welch, A.J. Determining the Optical Properties of Turbid Media by Using the Adding-Doubling Method. Appl. Opt. 1993, 32, 559–568. [Google Scholar] [CrossRef] [PubMed]
- Wang, L.-H.; Jacques, S.L.; Zheng, L.-Q. MCML-Monte Carlo modeling of photon transport in multi-layered tissues. Comput. Methods Programs Biomed. 1995, 47, 131–146. [Google Scholar] [CrossRef]
- Patterson, M.S.; Chance, B.; Wilson, B.C. Time resolved reflectance and transmittance for the noninvasive measurement of tissue optical properties. Appl. Opt. 1989, 28, 2331–2336. [Google Scholar] [CrossRef] [PubMed]
- Fishkin, J.B.; Coquoz, O.; Anderson, E.R.; Brenner, M.; Tromberg, B.J. Frequency-domain photon migration measurements of normal and malignant tissue optical properties in a human subject. Appl. Opt. 1997, 36, 10–20. [Google Scholar] [CrossRef] [PubMed]
- Farrell, T.J.; Patterson, M.S.; Wilson, B. A diffusion theory model of spatially resolved, steady-state diffuse reflectance for the noninvasive determination of tissue optical properties in vivo. Med. Phys. 1992, 19, 879–888. [Google Scholar] [CrossRef] [PubMed]
- Jacques, S.L.; Gutsche, A.; Schwartz, J.A.; Wang, L.-H.; Tittel, F.K. Medical Optical Tomography: Functional Imaging and Monitoring. In SPIE Institute Series, Society of Photo-Optical Instrumentation Engineers; SPIE: Bellingham, WA, USA, 1993; pp. 211–226. [Google Scholar]
- Wang, L.; Jacques, S.L. Use of a laser beam with an oblique angle on incidence to measure the reduced scattering coefficient of a turbid medium. Appl. Opt. 1995, 34, 2362–2366. [Google Scholar] [CrossRef] [PubMed]
- Kienle, A.; Lilge, L.; Patterson, M.S.; Hibst, R.; Steiner, R.; Wilson, B.C. Spatially resolved absolute diffuse reflectance measurements for noninvasive determination of the optical scattering and absorption coefficients of biological tissue. Appl. Opt. 1996, 35, 2304–2314. [Google Scholar] [CrossRef] [PubMed]
- Lin, S.-P.; Wang, L.-H.; Jacques, S.L.; Tittel, F.K. Measurement of tissue optical properties by the use of oblique-incidence optical fiber reflectometry. Appl. Opt. 1997, 36, 136–143. [Google Scholar] [CrossRef] [PubMed]
- Utzinger, U.; Richards-Kortum, R.R. Fiber optic probes for biomedical optical spectroscopy. J. Biomed. Opt. 2003, 8, 121–147. [Google Scholar] [CrossRef] [PubMed]
- Bargo, P.R.; Prahl, S.A.; Goodell, T.T.; Sleven, R.A.; Koval, G.; Blair, G.; Jacques, S.L. In vivo determination of optical properties of normal and tumor tissue with white light reflectance and empirical light transport model during endoscopy. J. Biomed. Opt. 2005, 10, 034018. [Google Scholar] [CrossRef] [PubMed]
- Rajaram, N.; Nguyen, T.H.; Tunnell, J.W. Lookup table-based inverse model for determining optical properties of turbid media. J. Biomed. Opt. 2008, 13, 050501. [Google Scholar] [CrossRef] [PubMed]
- Yu, B.; Lo, J.Y.; Kuech, T.F.; Palmer, G.M.; Bender, J.E.; Ramanujam, N. Cost-effective diffuse reflectance spectroscopy device for quantifying tissue absorption and scattering in vivo. J. Biomed. Opt. 2008, 13, 060505. [Google Scholar] [CrossRef] [PubMed]
- Nichols, B.S.; Rajaram, N.; Tunnel, J.W. Performance of a lookup table-based approach for measuring tissue optical properties with diffuse optical spectroscopy. J. Biomed. Opt. 2012, 17, 057001. [Google Scholar] [CrossRef] [PubMed]
- Hennessy, R.; Lim, S.L.; Markey, M.K.; Tunnel, J.W. Monte Carlo lookup table-based inverse model for extracting optical properties from tissue-simulating phantoms using diffuse reflectance spectroscopy. J. Biomed. Opt. 2013, 18, 037003. [Google Scholar] [CrossRef] [PubMed]
- Jones, P.B.; Shin, H.K.; Boas, D.A.; Hyman, B.T.; Moskowitz, M.A.; Ayata, C.; Dunn, A.K. Simultaneous multispectral reflectance imaging and laser speckle flowmetry of cerebral blood flow and oxygen metabolism in focal cerebral ischemia. J. Biomed. Opt. 2008, 13, 044007. [Google Scholar] [CrossRef] [PubMed]
- Ba, A.M.; Guiou, M.; Pouratian, N.; Muthialu, A.; Rex, D.E.; Cannestra, A.F.; Chen, J.W.Y.; Toga, A.W. Multiwavelength optical intrinsic signal imaging of cortical spreading depression. J. Neurophysiol. 2001, 88, 2726–2735. [Google Scholar] [CrossRef] [PubMed]
- Chen, S.; Feng, Z.; Li, P.; Jacques, S.L.; Zeng, S.; Luo, Q. In vivo optical reflectance imaging of spreading depression waves in rat brain with and without focal cerebral ischemia. J. Biomed. Opt. 2006, 11, 034002. [Google Scholar] [CrossRef] [PubMed]
- Yin, C.; Zhou, F.; Wang, Y.; Luo, W.; Luo, Q.; Li, P. Simultaneous detection of hemodynamics, mitochondrial metabolism and light scattering changes during cortical spreading depression in rats based on multi-spectral optical imaging. NeuroImage 2013, 76, 70–80. [Google Scholar] [CrossRef] [PubMed]
- Kawauchi, S.; Nishidate, I.; Uozumi, Y.; Nawashiro, H.; Ashida, H.; Sato, S. Diffuse light reflectance signals as potential indicators of loss of viability in brain tissue due to hypoxia: Charge-coupled-device-based imaging and fiber-based measurement. J. Biomed. Opt. 2013, 18, 015003. [Google Scholar] [CrossRef] [PubMed]
- Nishidate, I.; Ishizuka, T.; Mustari, A.; Yoshida, K.; Kawauchi, S.; Sato, S.; Sato, M. Evaluation of cerebral hemodynamics and tissue morphology of in vivo rat brain using spectral diffuse reflectance imaging. Appl. Spectrosc. 2017, 71, 866–878. [Google Scholar] [CrossRef] [PubMed]
- Arnold, T.; De Biasio, M.; Leitner, R. Hyperspectral video endoscope for intra-surgery tissue classification using auto-fluorescence and reflectance spectroscopy. In Proceedings of the European Conference on Biomedical Optics, Munich, Germany, 22–26 May 2011. [Google Scholar]
- Basiri, A.; Nabili, M.; Mathews, S.; Libin, A.; Groah, S.; Noordmans, H.J.; Ramella-Roman, J.C. Use of a multi-spectral camera in the characterization of skin wounds. Opt. Express 2010, 18, 3244–3257. [Google Scholar] [CrossRef] [PubMed]
- Yoshida, K.; Nishidate, I.; Ishizuka, T.; Kawauchi, S.; Sato, S.; Sato, M. Multispectral imaging of absorption and scattering properties of in vivo exposed rat brain using a digital red-green-blue camera. J. Biomed. Opt. 2015, 20, 051026. [Google Scholar] [CrossRef] [PubMed]
- Sato, S.; Kawauchi, S.; Okuda, W.; Nishidate, I.; Nawashiro, H.; Tsumatori, G. Real-time optical diagnosis of the rat brain exposed to a Laser-induced shock wave: Observation of spreading depolarization, vasoconstriction and hypoxemia-oligemia. PLoS ONE 2014, 9, e82891. [Google Scholar] [CrossRef] [PubMed]
- Hansen, A.J. Effect of anoxia on ion distribution in the brain. Physiol. Rev. 1985, 65, 101–148. [Google Scholar] [CrossRef] [PubMed]
- Lipton, P. Ischemic cell death in brain neuron. Physiol. Rev. 1999, 79, 1432–1568. [Google Scholar] [CrossRef] [PubMed]
- Jarvis, C.R.; Anderson, T.R.; Andrew, R.D. Anoxic depolarization mediates acute damage independent of glutamate in neocortical brain slices. Cereb. Cortex 2011, 11, 249–259. [Google Scholar] [CrossRef]
- Joshi, I.; Andrew, R.D. Imaging anoxic depolarization during ischemia-like conditions in the mouse hemi-brain slice. J. Neurophysiol. 2001, 85, 414–424. [Google Scholar] [CrossRef] [PubMed]
- Hansen, A.J.; Olsen, C.E. Brain extracellular space during spreading depression and ischemia. Acta Physiol. 1980, 108, 355–365. [Google Scholar] [CrossRef] [PubMed]
- Friebel, M.; Helfmann, J.; Netz, U.; Meinke, M. Influence of oxygen saturation on the optical scattering properties of human red blood cells in the spectral range 250 to 2000 nm. J. Biomed. Opt. 2009, 14, 034001. [Google Scholar] [CrossRef] [PubMed]
- Gould, I.G.; Tsai, P.; Klenfeld, D.; Linninger, A. The capillary bed offers the largest hemodynamic resistance to the cortical blood supply. J. Cereb. Blood Flow Metab. 2017, 37, 52–68. [Google Scholar] [CrossRef] [PubMed]
- Tabulated Molar Extinction Coefficient for Hemoglobin in Water. Available online: http://omlc.ogi.edu/spectra/hemoglobin/summary.html (accessed on 28 November 2017).


© 2018 by the authors. Licensee MDPI, Basel, Switzerland. This article is an open access article distributed under the terms and conditions of the Creative Commons Attribution (CC BY) license (http://creativecommons.org/licenses/by/4.0/).
Share and Cite
Mustari, A.; Kanie, T.; Kawauchi, S.; Sato, S.; Sato, M.; Kokubo, Y.; Nishidate, I. In Vivo Evaluation of Cerebral Hemodynamics and Tissue Morphology in Rats during Changing Fraction of Inspired Oxygen Based on Spectrocolorimetric Imaging Technique. Int. J. Mol. Sci. 2018, 19, 491. https://doi.org/10.3390/ijms19020491
Mustari A, Kanie T, Kawauchi S, Sato S, Sato M, Kokubo Y, Nishidate I. In Vivo Evaluation of Cerebral Hemodynamics and Tissue Morphology in Rats during Changing Fraction of Inspired Oxygen Based on Spectrocolorimetric Imaging Technique. International Journal of Molecular Sciences. 2018; 19(2):491. https://doi.org/10.3390/ijms19020491
Chicago/Turabian StyleMustari, Afrina, Takuya Kanie, Satoko Kawauchi, Shunichi Sato, Manabu Sato, Yasuaki Kokubo, and Izumi Nishidate. 2018. "In Vivo Evaluation of Cerebral Hemodynamics and Tissue Morphology in Rats during Changing Fraction of Inspired Oxygen Based on Spectrocolorimetric Imaging Technique" International Journal of Molecular Sciences 19, no. 2: 491. https://doi.org/10.3390/ijms19020491