Article

Identification of a Prognostic Hypoxia-Associated Gene Set in IDH-Mutant Glioma

1
Department of Neurosurgery, Division of Experimental Neurosurgery, Heidelberg University Hospital, Im Neuenheimer Feld 400, 69120 Heidelberg, Germany
2
Medical Clinic VII, Sports Medicine, Heidelberg University Hospital, 69120 Heidelberg, Germany
3
Department of Neuropathology, Institute of Pathology, Heidelberg University Hospital, 69120 Heidelberg, Germany
4
German Consortium of Translational Cancer Research (DKTK), 69120 Heidelberg, Germany
*
Author to whom correspondence should be addressed.
Int. J. Mol. Sci. 2018, 19(10), 2903; https://doi.org/10.3390/ijms19102903
Submission received: 18 August 2018 / Revised: 15 September 2018 / Accepted: 20 September 2018 / Published: 25 September 2018

Abstract

:
Glioma growth is often accompanied by a hypoxic microenvironment favorable for the induction and maintenance of the glioma stem cell (GSC) phenotype. Due to the paucity of cell models of Isocitrate Dehydrogenase 1 mutant (IDH1mut) GSCs, biology under hypoxic conditions has not been sufficiently studied as compared to IDH1 wildtype (IDH1wt) GSCs. We therefore grew well-characterized IDH1mut (n = 4) and IDH1wt (n = 4) GSC lines under normoxic (20%) and hypoxic (1.5%) culture conditions and harvested mRNA after 72 h. Transcriptome analyses were performed and hypoxia regulated genes were further analyzed using the expression and clinical data of the lower grade glioma cohort of The Cancer Genome Atlas (LGG TCGA) in a confirmatory approach and to test for possible survival associations. Results show that global expression changes were more pronounced in IDH1wt than in IDH1mut GSCs. However, when focusing on known hypoxia-regulated gene sets, enrichment analyses showed a comparable regulation in both IDH1mut and IDH1wt GSCs. Of 272 significantly up-regulated genes under hypoxic conditions in IDH1mut GSCs a hypoxia-related survival score (HRS-score) of five genes (LYVE1, FAM162A, WNT6, OTP, PLOD1) was identified by the Least Absolute Shrinkage and Selection Operator (LASSO) algorithm which was able to predict survival independent of age, 1p19q co-deletion status and WHO grade (II vs. III) in the LGG TCGA cohort and in the Rembrandt dataset. Altogether, we were able to identify and validate a novel hypoxia-related survival score in IDH1mut GSCs consisting of five hypoxia-regulated genes which was significantly associated with patient survival independent of known prognostic confounders.

1. Introduction

The discrimination of glioma into IDH1wt and IDH1mut tumors has marked an important milestone due to its profound clinical impact [1]. Whereas patients developing glioblastoma (GBM), the most common and malignant glioma in adults, have a dismal prognosis and usually die after about 15 months with the current standard of care (maximal safe surgical resection, followed by radiotherapy plus concomitant and adjuvant chemotherapy with temozolomide), lower grade glioma (LGG) patients show a much better clinical course [2,3,4,5]. To understand the differences in underlying tumor biology the international consortium ‘The Cancer Genome Atlas’ (TCGA) used genome-wide data from multiple platforms to identify molecular subtypes for GBM and LGG with prognostic relevance [6,7]. The main distinction is the IDH mutation which has a very high incidence within LGG patients of up to 80% and is virtually absent in primary GBM [7]. This gain of function mutation leads to the production of the onco-metabolite 2-hydroxyglutarate (2HG) which interferes with many pathways and its opposing appearance suggests that IDHmut and IDH1wt glioma are in fact biologically different tumor types [8,9].
As a consequence, the traditional WHO classification has been revisited in 2016 and has implemented molecular markers in addition to histology [10]. Among IDHmut gliomas, the WHO classification system distinguishes three grades (°II-IV) based on histopathologic features. Within each grade, IDHmut gliomas have a significantly better prognosis compared with their IDHwt counterparts. Although the underlying mechanisms have not been fully elucidated the discovery of the IDH mutation had a fundamental impact on glioma research [7,11,12,13].
There is a large body of evidence that a subpopulation of tumor cells which are reminiscent of normal neural stem cells and therefore called glioma stem cells (GSCs) are driving tumor formation and resistance to chemoradiation [14,15,16,17]. Moreover, their microenvironment seems to profoundly contribute to the observed treatment resistance which especially applies to the effect of low oxygen tension [18]. Hypoxia has been shown to promote and stabilize stem cell-like properties, such as invasiveness, differentiation, proliferation, self-renewal capacity, and resistance to radiochemotherapy and is found in solid tumors where growth outruns vessel supply and oxygenation [19,20,21,22,23,24,25]. This translates into a significant survival disadvantage in cancers of the uterine cervix, head and neck, and soft tissue sarcomas [26,27,28,29,30]. In lower and high grade-glioma stratification for IDH1 status showed conflicting results. While some investigators report a transcriptional activation of hypoxia-related genes, others describe the opposite effect most likely due to different methodological approaches [31,32,33,34,35]. Since IDH1 is part of the tricarboxylic acid (TCA) cycle and plays a major role in energy and oxygen metabolism, it is crucial to understand how hypoxia alters the phenotype of IDHmut glioma cells as compared to its wildtype counterpart [9].
In the present study we cultivated GSCs derived from human IDH1mut and IDHwt tumor tissues instead of cells where IDH mutations were artificially introduced and thus did not represent the natural genetic background. This allowed us to gain relevant insights on a whole transcriptomic level and to identify a gene set of five hypoxia-regulated genes in IDHmut GSCs prognosticating patient survival independent of known confounders such as age, codel-subtype or WHO grade.

2. Results

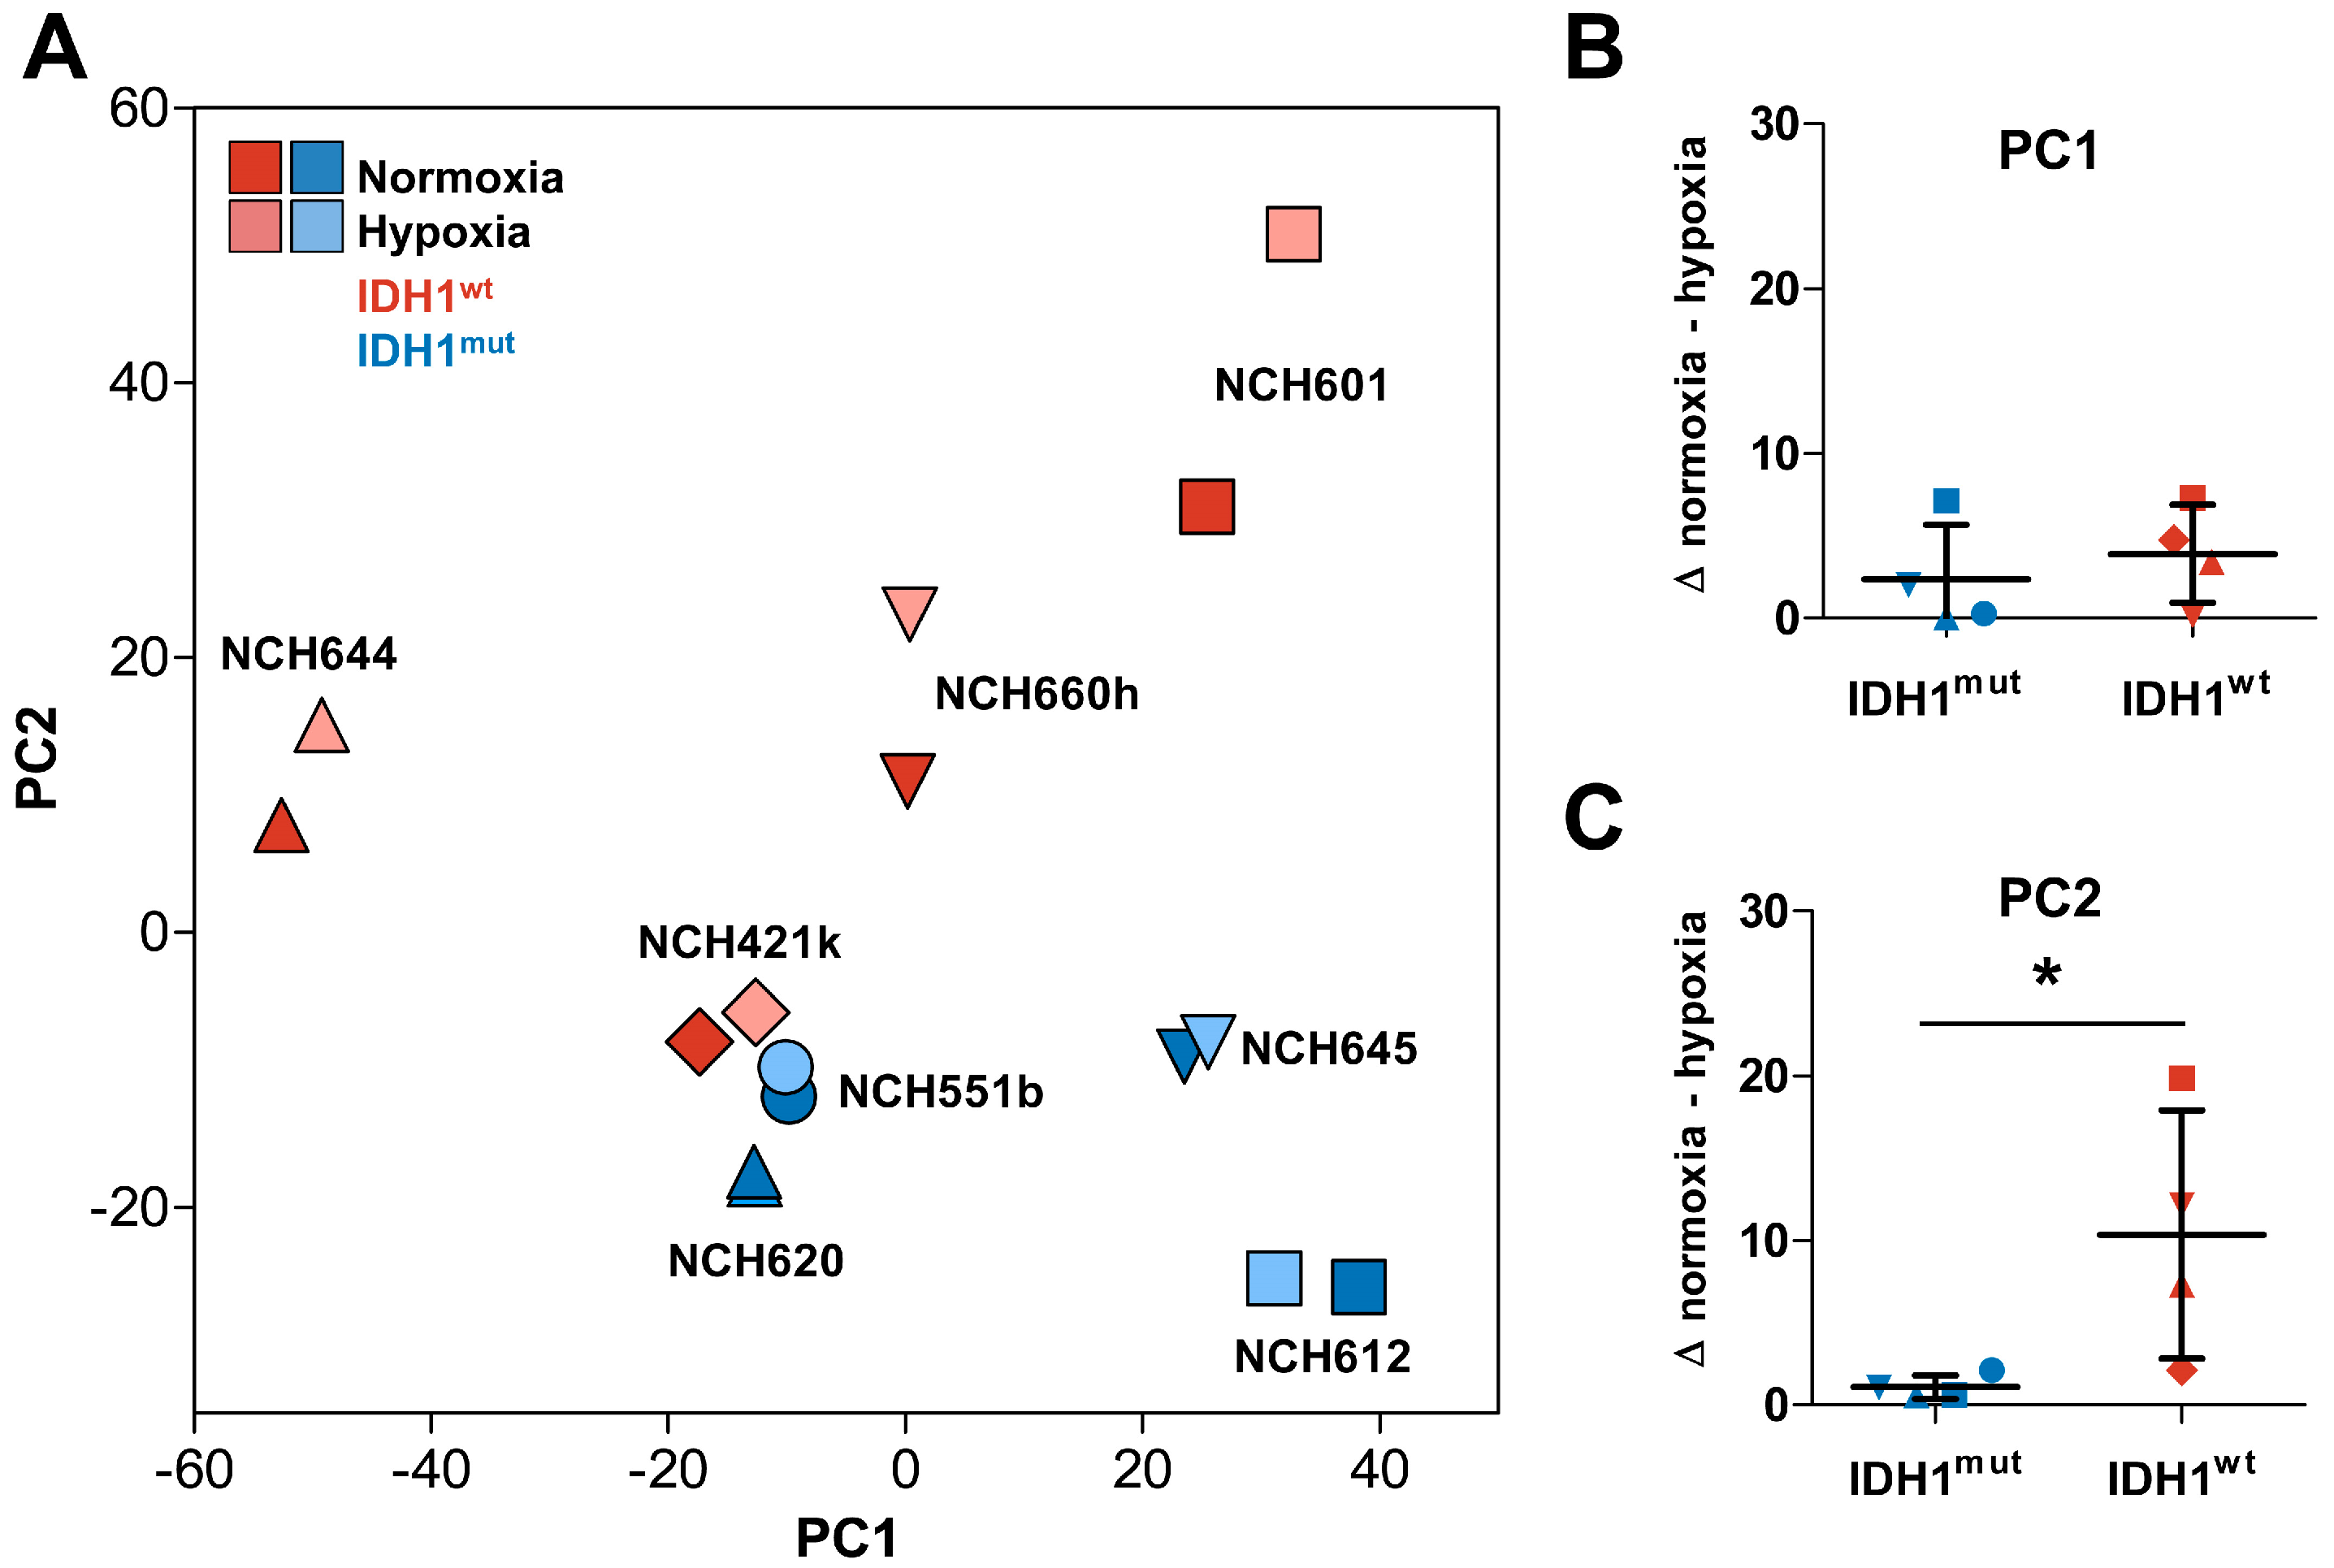
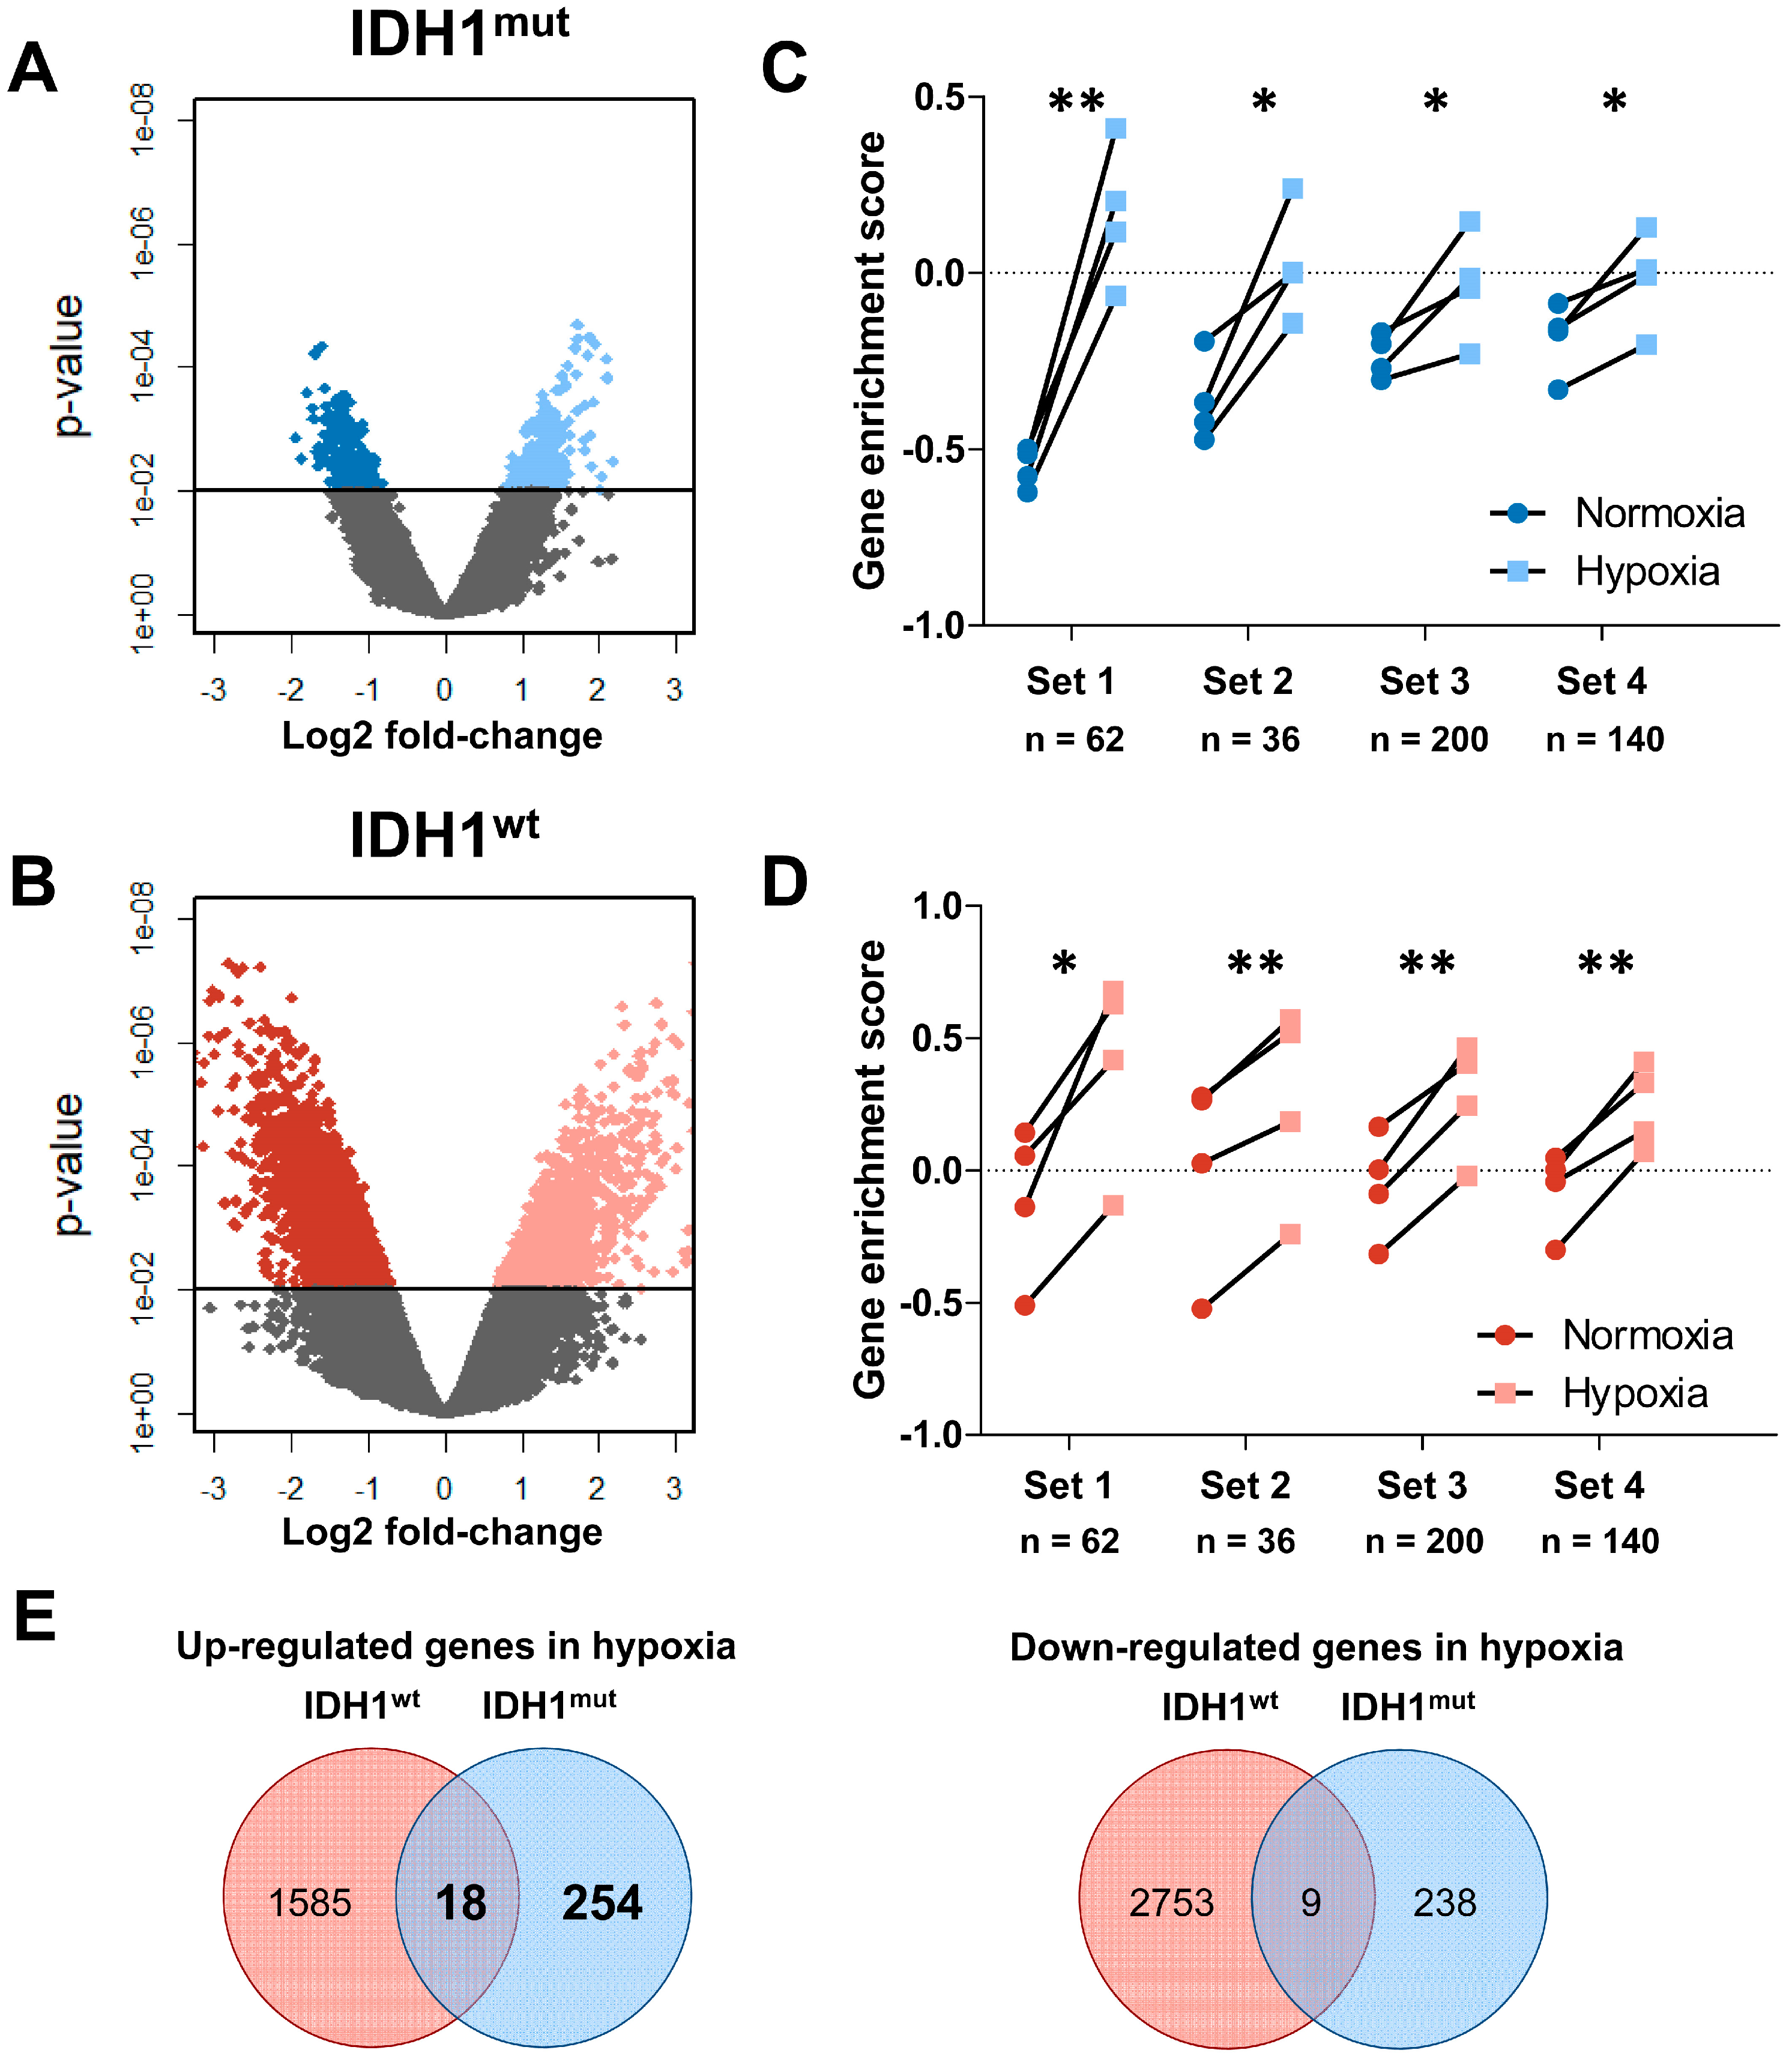
2.1. Distinct Response to Hypoxia of IDH1mut and IDH1wt Glioma Stem Cells

To analyze the effect of hypoxia on the transcriptome of IDH1mut glioma in comparison to IDH1wt GBM we made use of human IDH1wt (n = 4) as well as of IDH1mut (n = 4) GSC lines (Supplementary Materials Figure S1, Table 1). All four IDH1wt GSCs were derived from primary GBM. As for IDH1mut GSCs, one cell line was established from an anaplastic oligodendroglioma and three from secondary GBM. A maintained 2HG secretion in the supernatant of all IDH1mut GSCs as a result of the IDH1 mutation could be confirmed by an enzymatic assay with concentrations ranging from 9.4–1792.1 µM, whereas in IDH1wt GSCs 2HG levels were below the detection limit (Table 1) [36]. To induce hypoxic conditions, we cultivated the cells for 72 h under oxygen deprivation (1.5% O2) while cultivating control cells under standard normoxic conditions (~20% O2).
To analyze the transcriptome changes in response to hypoxia we conducted mRNA microarrays followed by a principal component analysis (PCA, Figure 1A). Interestingly, the hypoxic as well as the normoxic samples of the same GSC line showed only small differences in the principal component (PC) 1, which represents the highest variance in the data, regardless of their IDH1 status. This suggests that the individual genetic background of each glioma cell line causes larger transcriptomic changes than the IDH1 status or the oxygen levels (Figure 1B). Nevertheless, PC2 clearly distinguishes IDH1mut (upper area) and IDH1wt cells (lower area). However, when analyzing the difference in the PC2 we found a uniform increase of PC2 in hypoxia in IDH1wt cells, whereas IDH1mut cells showed only a small shift which was significantly lower as compared to IDH1wt GSCs (Figure 1C, p = 0.028). This suggests that the global transcriptome of IDH1mut GSCs seems to react to oxygen levels to a much lesser extent than in IDH1wt GSCs. This hypothesis was sustained when we analyzed the differentially regulated genes in response to hypoxia in IDH1mut and IDH1wt GSCs (Figure 2A,B). Here, we found 519 hypoxia-regulated genes in IDH1mut GSCs (p = 0.01, n = 272 up, n = 247 down, Figure 2E) while in IDH1wt GSCs as much as 4365 genes were regulated under hypoxic conditions (n = 1603 up, n = 2762 down, Figure 2E).
Next we used gene set enrichment analyses (GSEA) to test if we can reproduce the low hypoxic response of IDH1mut GSCs by analyzing published hypoxia gene signatures. To this end we assessed the concerted change of functionally related genes forming a set by the Gene Set Variation Analysis (GSVA) algorithm which computes enrichment scores for every sample (Table 2, Figure 2C,D). Interestingly, this analysis revealed in IDH1wt and IDH1mut GSCs, in contrast to the PCA and the numbers of differentially expressed genes, a comparable response to hypoxia in all four previously published hypoxia associated gene sets [37,38,39,40]. This finding suggests that even though response to hypoxia of IDH1mut GSCs is indeed less pronounced on the transcriptome level those genes that have been observed to be regulated are specific for hypoxic conditions. However, the intersection study of the regulated genes revealed only a small overlap of differentially expressed genes between IDH1mut and IDH1wt GSCs (Figure 2E). Only 18/1857 (1.0%) were commonly up- and 9/3000 (0.3%) commonly downregulated. These results again highlight the fundamental difference in biology of IDH1mut and IDH1wt gliomas.

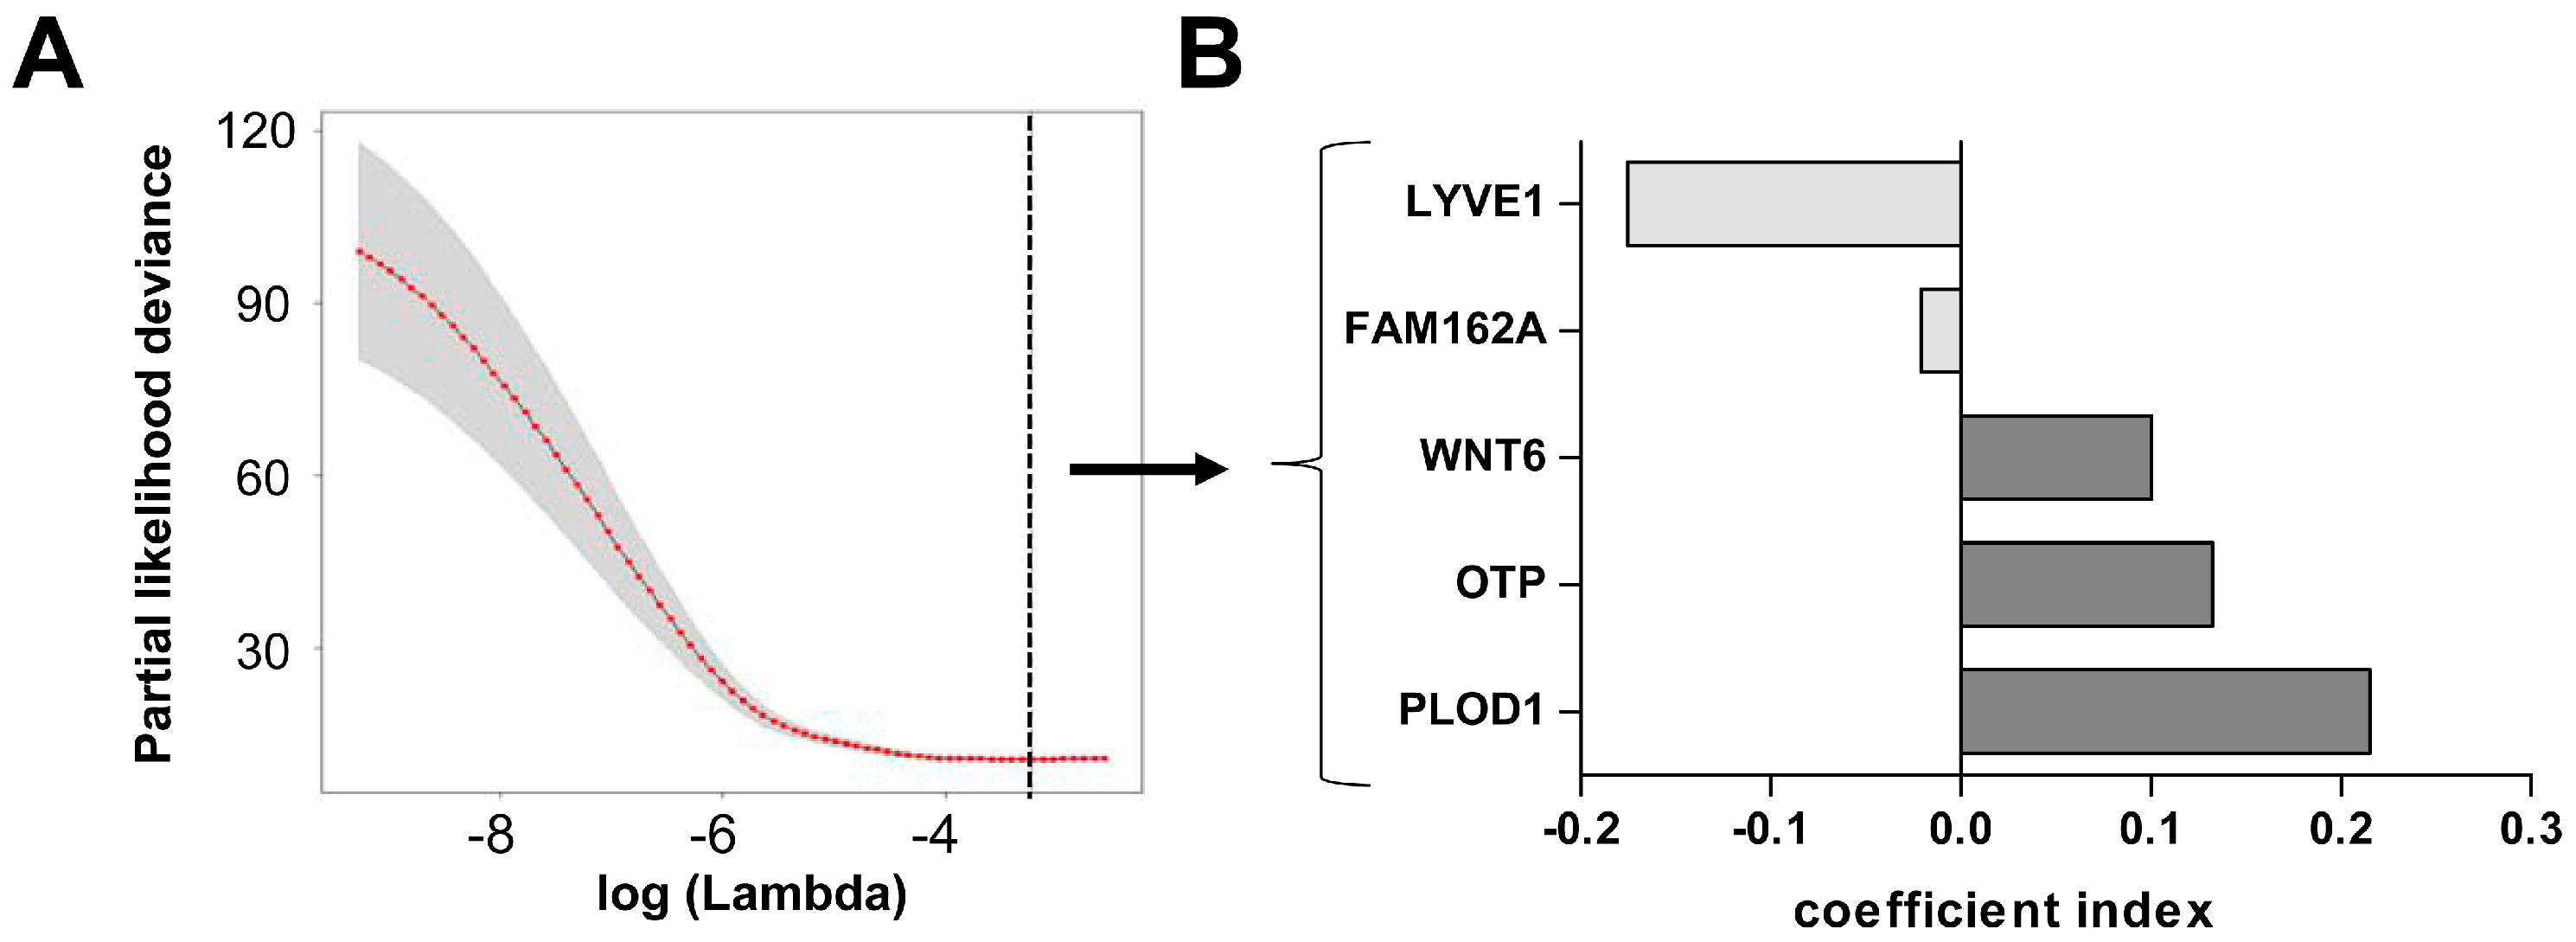
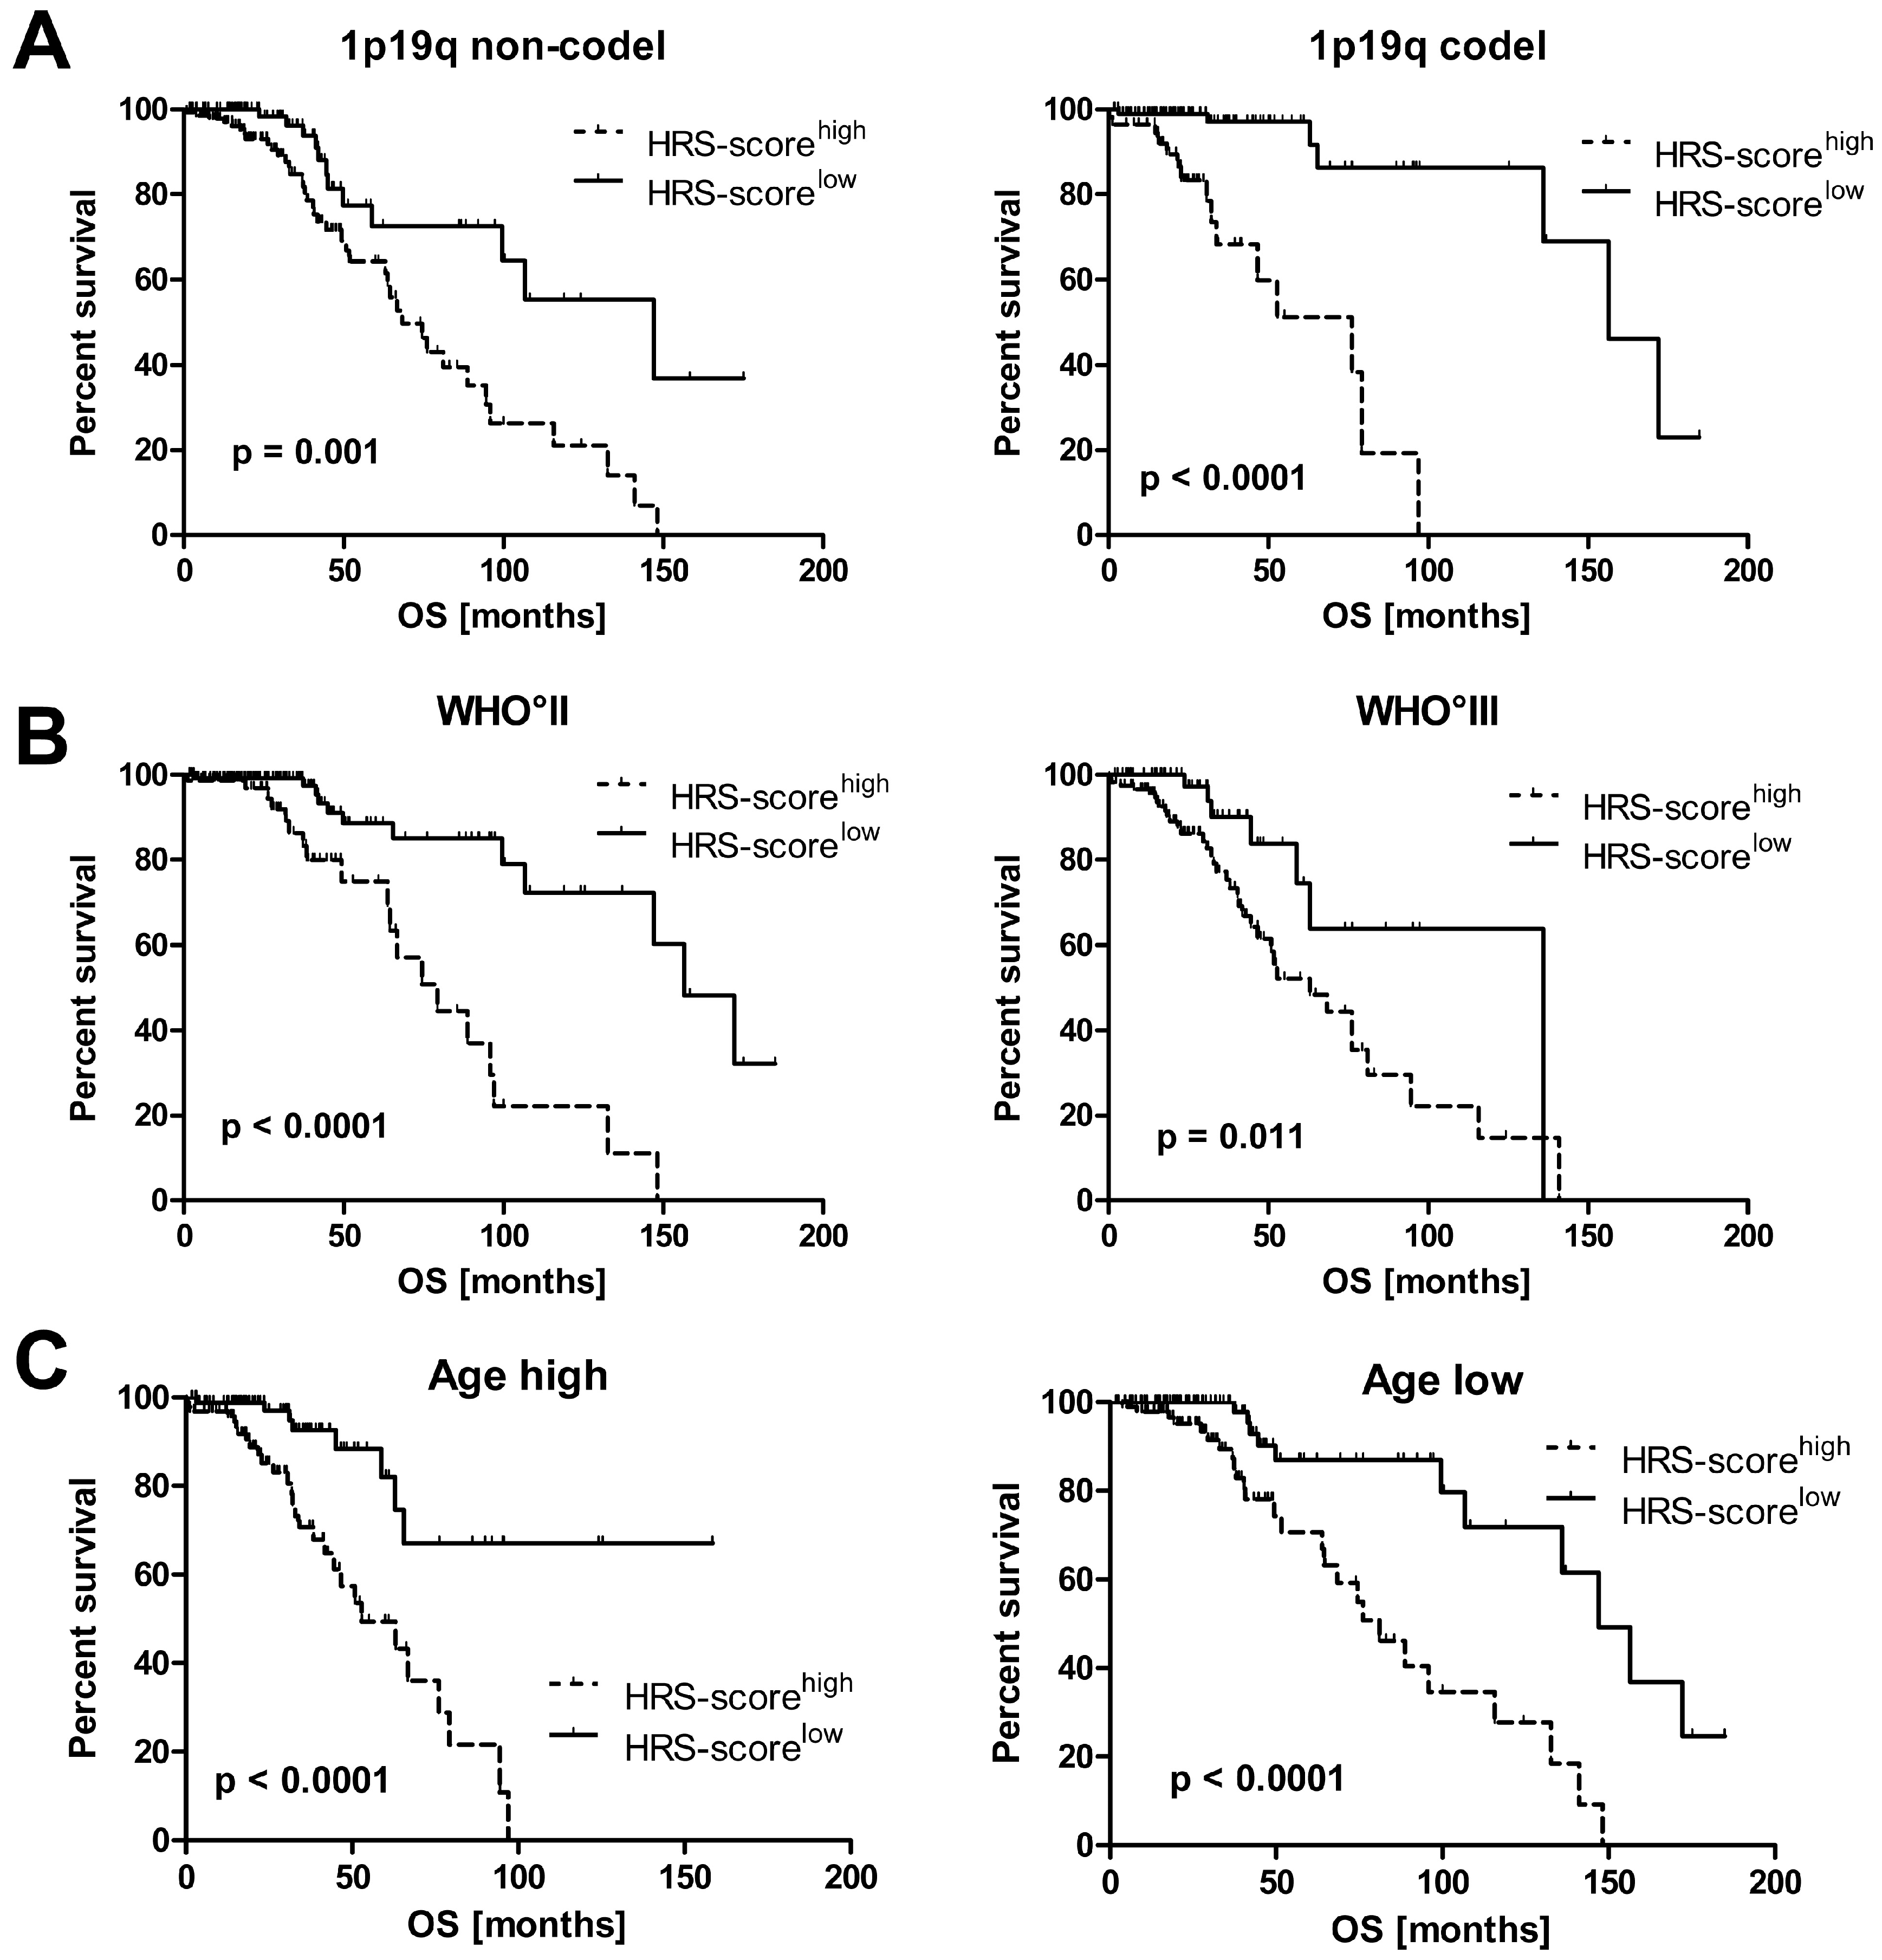
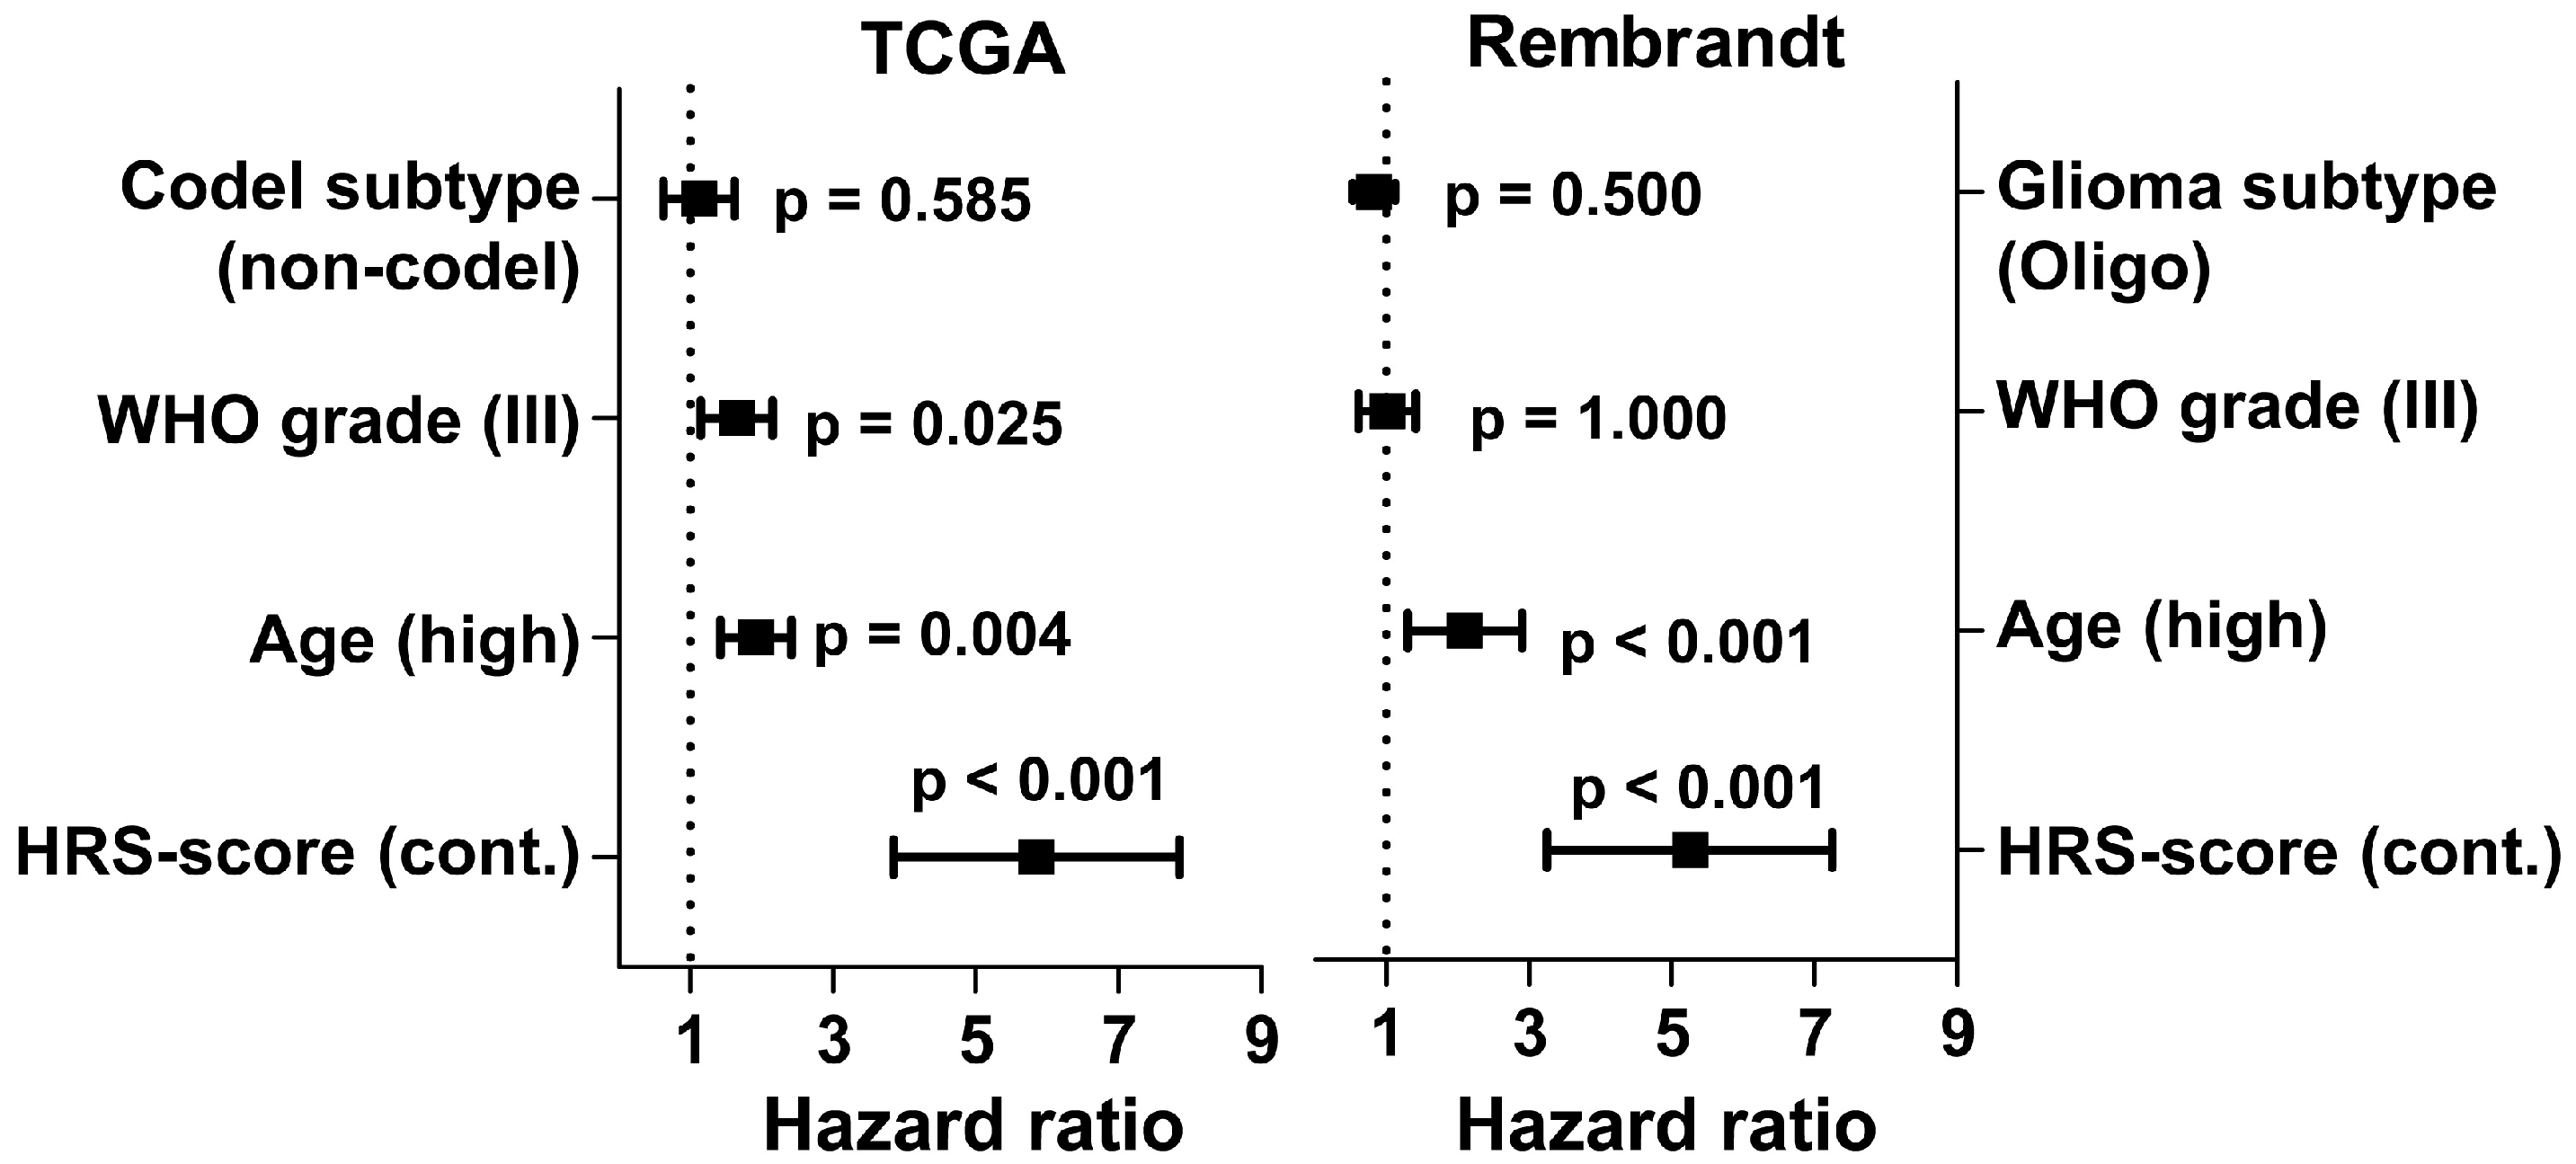
2.2. Hypoxia Score Prognosticates Survival in LGG Patients Independent of 1p19q Co-Deletion Status, WHO Grade and Age

Since hypoxia has often been related to the outcome of patients we sought to develop a hypoxia-related gene signature in LGG patients. Because this has already been extensively studied in IDH1wt GSCs we solely focused on the 272 genes up-regulated in hypoxia in IDH1mut GSCs (Supplementary Materials Table S1). To this end, we used the machine learning technique LASSO which at the same time selects unsupervised from the 272 input genes the most informative ones and fits a Cox ph regression model with an optimal prediction power for all 395 IDH1mut patients in the LGG TCGA dataset, regardless of their 1p19q co-deletion status and WHO grade (II and III). The process of elimination of non-informative genes is visualized by the cross-validation error curve in Figure 3A, where all genes are included on the left side and the prediction error drops to a minimum (black dotted line) with only the five most important genes left in the model (Figure 3A).
Interestingly, LASSO selected genes with negative and positive coefficients implicating that namely LYVE1 and FAM162A are associated with a better survival when up-regulated, whereas WNT6, OTP, and PLOD1 are associated with a worse survival (Figure 3B). We could not find classical hypoxia response elements in the promoter sequences of these genes, but CHIPseq analysis to identify HIF2a binding sites revealed an association to OTP [41]. Noteworthy, PLOD1, mediating crosslinking of collagen fibers, is the only commonly up-regulated gene in both IDHmut and IDH1wt GSCs under hypoxia and has shown to be regulated by HIF1alpha in breast cancer cells leading to increased invasion and metastasis [42]. The survival associations could be validated on a single gene level by log-rank tests after classifying the patients into high or low mRNA expression according to the median (Supplementary Materials Figure S2). Based on these selected genes we created a hypoxia-related survival score (HRS-score), which incorporates the expression changes of all five candidate genes to prognosticate the survival for a given patient.
Next, we confirmed in univariate Kaplan-Meier analyses that the HRS-score predicts the survival of IDHmut LGG patients independent of molecular and clinical covariates such as 1p19q co-deletion status, WHO grade (II and III) and patient age at diagnosis for the used LGG TCGA cohort (Figure 4).
When including age, codel subtype and WHO grade in a multivariate Cox ph analysis we found that a high HRS-score is a highly significant predictor of shorter patient survival independent of age, codel status and WHO grade (Figure 5; HR 5.85 [95% CI 2.89, 11.83] vs. 1.92 [1.16, 3.17], 1.12 [0.65, 1.93], and 1.65 [0.96, 2,82], respectively). To validate the HRS-score in an independent dataset we applied it to 120 IDHmut LGG patients from the Rembrandt database. Here, we could again confirm the prognostic value of the HRS-score (Figure 5; HR 5.25 (95% CI 0.64, 1.59) vs. 2.1 (1.36, 3.25), 0.83 (0.49, 1.40), and 1.01 (0.64, 1.59), respectively).
Taken together, the analysis of differentially expressed genes under hypoxia in IDHmut GSCs yielded five genes, whose incorporation into the HRS-score could predict patient survival in the LGG TCGA and Rembrandt cohort independent of prognostic confounders.

3. Discussion

The discovery of mutations in IDH genes in glioma as compared to their IDH wildtype counterpart has marked a fundamental milestone in the understanding of glioma biology [1]. While different oxygen tensions have been extensively studied in IDH1wt glioma cells, due to the wide availability of cell culture models, there is a paucity of IDH1mut glioma models limiting the analysis of hypoxic conditions profoundly. Most experimental models have synthetically introduced the IDH1 mutation into commonly used IDHwt cell lines such as U87MG or U251. A subsequent increase in HIF1alpha expression suggests a possible oncogenic mechanism of the IDH1 mutation by mimicking the tumorigenic effect of the hypoxic microenvironment [31,32,33,43]. In contrast, other groups have demonstrated that HIF1alpha or HIF1alpha-responsive genes are either not affected by an IDH mutation or even showed a decrease in the mRNA or protein expression [34,35,44,45,46]. Regarding these heterogeneous results, we sought to add further knowledge by culturing human IDH1mut and IDH1wt GSCs in hypoxia and analyze their transcriptome in their natural genomic background.
Comparative differential gene expression analysis between IDH1wt and IDH1mut GSCs suggested that hypoxia has a bigger impact on IDH1wt GSC on the whole transcriptome than on IDH1mut GSCs. However, after having performed a gene set enrichment analysis of several well-established hypoxia gene signatures, a significant and specific enrichment has been found in IDH1mut GSCs similar to IDH1wt GSCs. This finding suggests that IDH1mut GSCs seem to react to changes in oxygen level in a more specific way than IDH1wt GSCs do. Interestingly, when looking at the list of differentially regulated genes of IDH1mut and IDH1wt GSCs, only 18/1857 (1.0%) were commonly up- and 9/3000 (0.3%) commonly downregulated. The fact that there is only a small fraction of overlapping regulated genes shared by IDH1mut and IDH1wt GSCs further corroborates fundamental differences in their biology.
To clarify the clinical relevance of hypoxia in IDHmut glioma, we further assessed whether the differentially up-regulated genes in GSCs in hypoxia translate into useful clinical parameters using the LGG TCGA dataset. Using the LASSO algorithm, we were able to create a hypoxia-related survival score incorporating the regulation of five genes, whose upregulation (WNT6, OTP, and PLOD1) and downregulation (LYVE1 and FAM162A) show a worse survival in all molecular and histological subgroups (1p19q co-deletion status and WHO II/III, Supplementary Materials Figure S2). Among these, FAM162A and PLOD1 have been listed in the aforementioned gene sets by Fardin et al. (Set 1) and additionally in the gene sets of Liberzon et al. (Set 3) and Qi et al. (Set 4) respectively. FAM162A has further been shown to be HIF1alpha responsive and a mediator of the mitochondrial apoptotic pathway [47]. Its elevated expression has been observed in gastric and uterine carcinoma [48,49,50]. PLOD1, the only commonly up-regulated gene in IDH1mut and IDH1wt GSCs under hypoxia, mediates crosslinking of collagen fibers and has shown to be regulated by HIF1alpha in breast cancer cells leading to increased invasion and metastasis [42]. The combination of WNT6 expression with the expression of hypoxia pathway proteins identified a subgroup of hepatocellular carcinoma patients predictive of poor survival [51]. LYVE1 is known to be an endothelial receptor crucial for dendritic cells to enter lymph vessels by hyaluronan-mediated docking. Targeted deletion of LYVE1 resulted in a decrease of the capability of dendritic cells to prime CD8+ T cell responses in skin-draining lymph nodes [52]. OTP has shown to play an important role in the development of the neurosecretory system in the hypothalamus and in terminal differentiation of neuroblasts [53]. Only recently, OTP has been found to be a highly specific marker for pulmonary carcinoid tumors [54,55,56]. As for both LYVE1 and OTP, to our knowledge this study presents the first evidence of hypoxia-related regulation and clinical correlation in IDH1mut glioma patients.
Most importantly in the multivariate analysis the continuous HRS-score proved to be more robust in prognosticating survival than WHO grade or 1p19q co-deletion subtype in the LGG TCGA cohort as well as in the Rembrandt validation cohort. Despite these encouraging results, a limitation of the present study might be that the transfer of our in vitro results to expression data of the LGG TCGA cohort does not represent the oxygenation status of the tumors in vivo. But since we established our cell culture models unbiased from synthetic genetic alterations, we believe that this study was able to reflect hypoxic areas of the tumor as close as an in vitro study can offer and therefore might be of value in better understanding IDH1mut glioma biology in the context of hypoxia. However, functional experiments investigating selected genes for their causality to tumorigenesis or the IDH mutation would be highly interesting and should be addressed in further studies. Taken together, this study presents five hypoxia-associated genes whose expression can be incorporated in a novel HRS-score with profound prognostic implications for the survival of IDHmut glioma patients. We hope that the HRS-score could be used to further stratify IDH1mut glioma patients into high and low risk patients in order to better guide treatment timing and estimate their aggressiveness.

4. Materials and Methods

4.1. Glioma Stem Cell Culture

Four IDH1wt and four IDH1mut patient-derived GSC lines were cultivated as described (Table 1) [54]. In brief, cells were grown as floating neurospheres in DMEM/F-12 medium containing 20% BIT serum-free supplement, basic fibroblast growth factor (bFGF) and epidermal growth factor (EGF) at 20 ng/mL each (all Provitro, Berlin, Germany). To study expression changes, IDH1mut and IDH1wt GSCs were grown under normoxic (~20% O2) and hypoxic conditions (1.5% O2) as previously reported [24,57]. Hypoxic conditions (1.5% O2, 5% CO2, 93.5% N2) were established in an O2- and CO2-controlled tissue culture incubator (Nunc, Langenselbold, Germany) as previously described [58]. mRNA was harvested after 72 h using the Qiagen Allprep RNA isolation kit according to the manufacturer’s instructions.
The expression of several stem cell markers including CD133, SOX2, CD44, CSPG4, CD90, and nestin in the IDH1mut GSCs has been shown by Kohanbash et al. [59]. Also for IDH1wt GSCs elevated clonogeneity as well as expression of certain stem cell markers has been shown in previous publications from our laboratory [19,60].

4.2. (D)-2-Hydroxyglutarate Measurements

(D)-2-hydroxyglutarate levels were measured in the cell culture supernatant of IDH1mut GSCs as decribed by Balss et al. [36]. In brief (d)-2-hydroxyglutarate dehydrogenase (HGDH) catalyzes the reduction of NAD+ to NADH by oxidation of (d)-2-hydroxyglutarate to α-ketoglutarate. NADH is then detected by a diaphorase/resazurin system which in turn can be measured by the fluorescent product resorufin which is exited at 540 nm and detected at 610 nm.

4.3. Microarray Analysis and Data Normalization

1 μg of total RNA from normoxic and hypoxic cells was submitted to the Genomics Core Facilities of the German Cancer Research Center (DKFZ, Heidelberg, Germany) for microarray analysis. After purification, reverse transcription into cDNA and labeling according to the Illumina protocol, samples were hybridized to Human HT-12 V.4.0 arrays (Illumina, San Diego, CA, USA). Raw data can be accessed in the NCBI GEO repository under the accession number GSE118683. Raw intensity data were obtained after image analysis of the fluorescent spot intensity reads. All preprocessing and normalization steps were performed in the “R” programming environment (available online: www.r-project.org). Inter-array normalization was conducted using vsn normalization in the vsn package. Differential gene expression was assessed by a paired test with the limma package. Survival analysis was conducted within the survival package. Gene set enrichment analysis for hypoxia related gene sets in the C2 (curated gene sets) and C5 (GO gene sets) collections of the MSigDB library was conducted by the GSVA package.

4.4. Lower Grade Glioma TCGA and Rembrandt Datasets

RNAseq data from the TCGA Lower Grade Glioma cohort were downloaded from firehose (available online: https://gdac.broadinstitute.org). Raw data were voom normalized by the help of the limma package. Of 515 patients, only IDHmut cases were considered for further clinical analysis (n = 395). In line with The Cancer Genome Atlas Research Network, we analyzed survival in the following IDH mutated subgroups: LGG with 1p/19q co-deletion (n = 159), LGG without 1p19q co-deletion (n = 236) and LGG WHO° II (n = 214) and WHO° III (n = 181) (Supplementary Materials Figure S3). The microarray raw data of Rembrandt were downloaded from the ArrayExpress archive (accession number: E-MTAB-3073). CEL files were processed with the affy package and vsn normalized in R. Clinical annotation data were retrieved from the G-DOC database (available online: https://gdoc.georgetown.edu/gdoc/). Based on the clinical data we selected patients with either astrocytoma or oligodendroglioma and completed survival data.

4.5. Statistics

LASSO (least absolute shrinkage and selection operator) is a linear regression which performs both, variable selection and regularization in a given dataset to fit a model that describes a linear correlation of a response variable (here survival) and several explanatory variables (here genes) [61]. This machine learning algorithm is very powerful and fits better models than conventional Cox ph analyses if there are many explanatory variables and a relatively low amount of samples. Nowadays this represents a typical problem for datasets generated by high throughput techniques [62]. The assumption of LASSO is that there is a reduced subset of explanatory variables within the population of all explanatory variables which is highly informative to model the dependent variable. To select this subset LASSO starts a process in which it iterates over a range of penalty factors (lambda) which is applied to the coefficients of the explanatory variables. This forces some of the coefficients to become zero which removes them effectively from the linear equation leading to the result of such a model [61]. To find the best value of lambda, LASSO is used in combination with the widely used cross-validation, which divides a population into training and test samples. The training samples are used to fit a model whose prediction accuracy is then tested on the test samples. The lambda with the lowest prediction error represents the best model and remaining explanatory variables and their respective coefficients can be extracted [61].
Furthermore, LASSO was adopted to fit Cox ph survival models and is implemented in the broadly used glmnet package within the statistical software environment R [62]. Gene selection for survival prediction of LGG TCGA patients was done by the cv.glmnet function within the glmnet package (family = cox, alpha = 1). 20-fold cross-validation was used to assess the prediction error for the regularization path. As recommended in the glmnet vignette we used the minimum of the prediction error curve to select lambda and extracted the corresponding genes and their coefficients [63]. Expression data were z-normalized prior to LASSO regression using the scale function. Hypoxia-related survival scores (HRS-score) of TCGA and Rembrandt samples were predicted using the predict.cv.glmnet function of the glmnet package based on the previously fitted model as follows:
HRS-score = ZLYVE1 × − 0.175 + ZFAM162A × − 0.021 + ZWNT6 × 0.100 + ZOTP × 0.132 + ZPLOD1 × 0.132
“Z” depicts the z-normalized raw expression values obtained by subtracting the population mean from an individual expression value and then dividing the difference by the population standard deviation.
Statistical analyses in boxplots were performed using the “Prism 5” software (GraphPad, La Jolla, California). p values for differences in survival between the groups were calculated with the log-rank (Mantel Cox) test, whereas the median of expression was used to dichotomize the cohort and to define “high” vs. “low”. Univariate and multivariate Cox regression analyses were performed to determine the prognostic significance of selected candidate genes and the hypoxia score. A p-value ≤ 0.05 was considered significant. Student’s t-Test was performed for the gene set enrichment analysis between GSCs cultured in normoxia and hypoxia for IDH1mut and IDH1wt.

Supplementary Materials

Supplementary materials can be found at https://www.mdpi.com/1422-0067/19/10/2903/s1.

Author Contributions

Conceptualization, P.D.T. and R.W.; Methodology, P.D.T., R.W., S.R., S.P. and H.M.; Software, R.W.; Validation, R.W.; Formal Analysis, P.D.T. and R.W.; Investigation, P.D.T. and R.W.; Resources, A.U. and C.H.-M.; Data Curation, R.W.; Writing—Original Draft Preparation, P.D.T.; Writing—Review & Editing, C.H.-M. and R.W.; Visualization, P.D.T. and S.R.; Supervision, C.H.-M.; Project Administration, C.H.-M.; Funding Acquisition, C.H.-M.

Funding

This research received funding from the Anni Hofmann Foundation.

Acknowledgments

The results published here are in part based upon data generated by the TCGA Research Network: http://cancergenome.nih.gov/.

Conflicts of Interest

The authors declare no conflict of interest.

Abbreviations

2HG2-hydroxyglutarate
GBM Glioblastoma
Cox phCox proportional hazard
GSCGliom stem cells
GSEAGene set enrichment analysis
HRHazard ratio
HRS-scoreHypoxia-related survival score
IDH(1)mutIsocitrate Dehydrogenase (1) mutated
IDH(1)wtIsocitrate Dehydrogenase (1) wildtype
LASSOLeast Absolute Shrinkage and Selection Operator
LGGLower grade glioma
OSOverall Survival
PC1/2Principal Component 1/2
PCAPrincipal Component Analysis
RembrandtREpository for Molecular BRAin Neoplasia DaTa
TCGAThe Cancer Genome Atlas

References

  1. Weller, M.; Wick, W.; von Deimling, A. Isocitrate dehydrogenase mutations: A challenge to traditional views on the genesis and malignant progression of gliomas. Glia 2011, 59, 1200–1204. [Google Scholar] [CrossRef] [PubMed]
  2. Ostrom, Q.T.; Gittleman, H.; Fulop, J.; Liu, M.; Blanda, R.; Kromer, C.; Wolinsky, Y.; Kruchko, C.; Barnholtz-Sloan, J.S. CBTRUS Statistical Report: Primary Brain and Central Nervous System Tumors Diagnosed in the United States in 2008–2012. Neuro Oncol. 2015, 17, iv1–iv62. [Google Scholar] [CrossRef] [PubMed]
  3. Stummer, W.; Reulen, H.-J.; Meinel, T.; Pichlmeier, U.; Schumacher, W.; Tonn, J.-C.; Rohde, V.; Oppel, F.; Turowski, B.; Woiciechowsky, C.; et al. Extent of Resection and survival in Glioblastoma Multiforme: Identification of and Adjustment for Bias. Neurosurgery 2008, 62, 564–576. [Google Scholar] [CrossRef] [PubMed]
  4. Li, Y.M.; Suki, D.; Hess, K.; Sawaya, R. The influence of maximum safe resection of glioblastoma on survival in 1229 patients: Can we do better than gross-total resection? J. Neurosurg. 2015, 1–12. [Google Scholar] [CrossRef] [PubMed]
  5. Stupp, R.; Mason, W.P.; van den Bent, M.J.; Weller, M.; Fisher, B.; Taphoorn, M.J.B.; Belanger, K.; Brandes, A.A.; Marosi, C.; Bogdahn, U.; et al. The European Organisation for Research and Treatment of Cancer Brain Tumor and Radiotherapy Groups and the National Cancer Institute of Canada Clinical Trials Group Radiotherapy plus Concomitant and Adjuvant Temozolomide for Glioblastoma. N. Engl. J. Med. 2005, 352, 987–996. [Google Scholar] [CrossRef] [PubMed]
  6. Brennan, C.W.; Verhaak, R.G.; McKenna, A.; Campos, B.; Noushmehr, H.; Salama, S.R.; Zheng, S.; Chakravarty, D.; Sanborn, J.Z.; Berman, S.H.; et al. The Somatic Genomic Landscape of Glioblastoma. Cell 2013, 155, 462–477. [Google Scholar] [CrossRef] [PubMed] [Green Version]
  7. Brat, D.J.; Verhaak, R.G.W.; Aldape, K.D.; Yung, W.K.A.; Salama, S.R.; Cooper, L.A.D.; Rheinbay, E.; Miller, C.R.; Vitucci, M.; Morozova, O.; et al. Comprehensive, Integrative Genomic Analysis of Diffuse Lower-Grade Gliomas. N. Engl. J. Med. 2015, 372, 2481–2498. [Google Scholar] [CrossRef] [PubMed] [Green Version]
  8. Dang, L.; White, D.W.; Gross, S.; Bennett, B.D.; Bittinger, M.A.; Driggers, E.M.; Fantin, V.R.; Jang, H.G.; Jin, S.; Keenan, M.C.; et al. Cancer-associated IDH1 mutations produce 2-hydroxyglutarate. Nature 2009, 462, 739. [Google Scholar] [CrossRef] [PubMed]
  9. Parker, S.J.; Metallo, C.M. Metabolic consequences of oncogenic IDH mutations. Pharmacol. Ther. 2015, 152, 54–62. [Google Scholar] [CrossRef] [PubMed] [Green Version]
  10. Louis, D.N.; Perry, A.; Reifenberger, G.; von Deimling, A.; Figarella-Branger, D.; Cavenee, W.K.; Ohgaki, H.; Wiestler, O.D.; Kleihues, P.; Ellison, D.W. The 2016 World Health Organization Classification of Tumors of the Central Nervous System: A summary. Acta Neuropathol. 2016, 131, 803–820. [Google Scholar] [CrossRef] [PubMed]
  11. Nobusawa, S.; Watanabe, T.; Kleihues, P.; Ohgaki, H. IDH1 Mutations as Molecular Signature and Predictive Factor of Secondary Glioblastomas. Clin. Cancer Res. 2009, 15, 6002–6007. [Google Scholar] [CrossRef] [PubMed] [Green Version]
  12. Lai, A.; Kharbanda, S.; Pope, W.B.; Tran, A.; Solis, O.E.; Peale, F.; Forrest, W.F.; Pujara, K.; Carrillo, J.A.; Pandita, A.; et al. Evidence for Sequenced Molecular Evolution of IDH1 Mutant Glioblastoma from a Distinct Cell of Origin. JCO 2011, 29, 4482–4490. [Google Scholar] [CrossRef] [PubMed]
  13. Weller, M.; Weber, R.G.; Willscher, E.; Riehmer, V.; Hentschel, B.; Kreuz, M.; Felsberg, J.; Beyer, U.; Löffler-Wirth, H.; Kaulich, K.; et al. Molecular classification of diffuse cerebral WHO grade II/III gliomas using genome- and transcriptome-wide profiling improves stratification of prognostically distinct patient groups. Acta Neuropathol. 2015, 129, 679–693. [Google Scholar] [CrossRef] [PubMed] [Green Version]
  14. Singh, S.K.; Hawkins, C.; Clarke, I.D.; Squire, J.A.; Bayani, J.; Hide, T.; Henkelman, R.M.; Cusimano, M.D.; Dirks, P.B. Identification of human brain tumour initiating cells. Nature 2004, 432, 396–401. [Google Scholar] [CrossRef] [PubMed]
  15. Singh, S.K.; Clarke, I.D.; Terasaki, M.; Bonn, V.E.; Hawkins, C.; Squire, J.; Dirks, P.B. Identification of a Cancer Stem Cell in Human Brain Tumors. Cancer Res. 2003, 63, 5821–5828. [Google Scholar] [PubMed]
  16. Bao, S.; Wu, Q.; McLendon, R.E.; Hao, Y.; Shi, Q.; Hjelmeland, A.B.; Dewhirst, M.W.; Bigner, D.D.; Rich, J.N. Glioma stem cells promote radioresistance by preferential activation of the DNA damage response. Nature 2006, 444, 756–760. [Google Scholar] [CrossRef] [PubMed]
  17. Liu, G.; Yuan, X.; Zeng, Z.; Tunici, P.; Ng, H.; Abdulkadir, I.; Lu, L.; Irvin, D.; Black, K.; Yu, J. Analysis of gene expression and chemoresistance of CD133+ cancer stem cells in glioblastoma. Mol. Cancer 2006, 5, 67. [Google Scholar] [CrossRef] [PubMed]
  18. Cabarcas, S.M.; Mathews, L.A.; Farrar, W.L. The cancer stem cell niche—There goes the neighborhood? Int. J. Cancer 2011, 129, 2315–2327. [Google Scholar] [CrossRef] [PubMed]
  19. Campos, B.; Herold-Mende, C.C. Insight into the complex regulation of CD133 in glioma. Int. J. Cancer 2011, 128, 501–510. [Google Scholar] [CrossRef] [PubMed]
  20. Mohyeldin, A.; Garzón-Muvdi, T.; Quiñones-Hinojosa, A. Oxygen in Stem Cell Biology: A Critical Component of the Stem Cell Niche. Cell Stem Cell 2010, 7, 150–161. [Google Scholar] [CrossRef] [PubMed]
  21. Das, B.; Tsuchida, R.; Malkin, D.; Koren, G.; Baruchel, S.; Yeger, H. Hypoxia Enhances Tumor Stemness by Increasing the Invasive and Tumorigenic Side Population Fraction. Stem Cells 2008, 26, 1818–1830. [Google Scholar] [CrossRef] [PubMed] [Green Version]
  22. Platet, N.; Liu, S.Y.; Atifi, M.E.; Oliver, L.; Vallette, F.M.; Berger, F.; Wion, D. Influence of oxygen tension on CD133 phenotype in human glioma cell cultures. Cancer Lett. 2007, 258, 286–290. [Google Scholar] [CrossRef] [PubMed] [Green Version]
  23. Soeda, A.; Park, M.; Lee, D.; Mintz, A.; Androutsellis-Theotokis, A.; McKay, R.D.; Engh, J.; Iwama, T.; Kunisada, T.; Kassam, A.B.; et al. Hypoxia promotes expansion of the CD133-positive glioma stem cells through activation of HIF-1[alpha]. Oncogene 2009, 28, 3949–3959. [Google Scholar] [CrossRef] [PubMed]
  24. Heddleston, J.M.; Li, Z.; McLendon, R.E.; Hjelmeland, A.B.; Rich, J.N. The hypoxic microenvironment maintains glioblastoma stem cells and promotes reprogramming towards a cancer stem cell phenotype. Cell Cycle 2009, 8, 3274–3284. [Google Scholar] [CrossRef] [PubMed] [Green Version]
  25. Pistollato, F.; Abbadi, S.; Rampazzo, E.; Persano, L.; Puppa, A.D.; Frasson, C.; Sarto, E.; Scienza, R.; D’avella, D.; Basso, G. Intratumoral Hypoxic Gradient Drives Stem Cells Distribution and MGMT Expression in Glioblastoma. Stem Cells 2010, 28, 851–862. [Google Scholar] [CrossRef] [PubMed]
  26. Rischin, D.; Fisher, R.; Peters, L.; Corry, J.; Hicks, R. Hypoxia in head and neck cancer: Studies with hypoxic positron emission tomography imaging and hypoxic cytotoxins. Int. J. Radiat. Oncol. Biol. Phys. 2007, 69, S61–S63. [Google Scholar] [CrossRef] [PubMed]
  27. Vaupel, P.; Mayer, A. Hypoxia in cancer: Significance and impact on clinical outcome. Cancer Metast. Rev. 2007, 26, 225–239. [Google Scholar] [CrossRef] [PubMed]
  28. Birner, P.; Gatterbauer, B.; Oberhuber, G.; Schindl, M.; Rössler, K.; Prodinger, A.; Budka, H.; Hainfellner, J.A. Expression of hypoxia-inducible factor-1 alpha in oligodendrogliomas: Its impact on prognosis and on neoangiogenesis. Cancer 2001, 92, 165–171. [Google Scholar] [CrossRef]
  29. Mashiko, R.; Takano, S.; Ishikawa, E.; Yamamoto, T.; Nakai, K.; Matsumura, A. Hypoxia-inducible factor 1α expression is a prognostic biomarker in patients with astrocytic tumors associated with necrosis on MR image. J. Neurooncol. 2010, 102, 43–50. [Google Scholar] [CrossRef] [PubMed]
  30. Flynn, J.R.; Wang, L.; Gillespie, D.L.; Stoddard, G.J.; Reid, J.K.; Owens, J.; Ellsworth, G.B.; Salzman, K.L.; Kinney, A.Y.; Jensen, R.L. Hypoxia-regulated protein expression, patient characteristics, and preoperative imaging as predictors of survival in adults with glioblastoma multiforme. Cancer 2008, 113, 1032–1042. [Google Scholar] [CrossRef] [PubMed] [Green Version]
  31. Zhao, S.; Lin, Y.; Xu, W.; Jiang, W.; Zha, Z.; Wang, P.; Yu, W.; Li, Z.; Gong, L.; Peng, Y.; et al. Glioma-Derived Mutations in IDH1 Dominantly Inhibit IDH1 Catalytic Activity and Induce HIF-1α. Science 2009, 324, 261–265. [Google Scholar] [CrossRef] [PubMed]
  32. Wang, G.; Sai, K.; Gong, F.; Yang, Q.; Chen, F.; Lin, J. Mutation of isocitrate dehydrogenase 1 induces glioma cell proliferation via nuclear factor-κB activation in a hypoxia-inducible factor 1-α dependent manner. Mol. Med. Rep. 2014. [Google Scholar] [CrossRef] [PubMed]
  33. Nie, Q.; Guo, P.; Guo, L.; Lan, J.; Lin, Y.; Guo, F.; Zhou, S.; Ge, J.; Mao, Q.; Li, X.; et al. Overexpression of isocitrate dehydrogenase-1R132H enhances the proliferation of A172 glioma cells via aerobic glycolysis. Mol. Med. Rep. 2015. [Google Scholar] [CrossRef] [PubMed]
  34. Koivunen, P.; Lee, S.; Duncan, C.G.; Lopez, G.; Lu, G.; Ramkissoon, S.; Losman, J.A.; Joensuu, P.; Bergmann, U.; Gross, S.; et al. Transformation by the (R)-enantiomer of 2-hydroxyglutarate linked to EGLN activation. Nature 2012, 483, 484–488. [Google Scholar] [CrossRef] [PubMed] [Green Version]
  35. Kickingereder, P.; Sahm, F.; Radbruch, A.; Wick, W.; Heiland, S.; von Deimling, A.; Bendszus, M.; Wiestler, B. IDH mutation status is associated with a distinct hypoxia/angiogenesis transcriptome signature which is non-invasively predictable with rCBV imaging in human glioma. Sci. Rep. 2015, 5, 16238. [Google Scholar] [CrossRef] [PubMed] [Green Version]
  36. Balss, J.; Pusch, S.; Beck, A.-C.; Herold-Mende, C.; Krämer, A.; Thiede, C.; Buckel, W.; Langhans, C.-D.; Okun, J.G.; von Deimling, A. Enzymatic assay for quantitative analysis of (d)-2-hydroxyglutarate. Acta Neuropathol. 2012, 124, 883–891. [Google Scholar] [CrossRef] [PubMed]
  37. Fardin, P.; Barla, A.; Mosci, S.; Rosasco, L.; Verri, A.; Versteeg, R.; Caron, H.N.; Molenaar, J.J.; Øra, I.; Eva, A.; et al. A biology-driven approach identifies the hypoxia gene signature as a predictor of the outcome of neuroblastoma patients. Mol. Cancer 2010, 9, 185. [Google Scholar] [CrossRef] [PubMed] [Green Version]
  38. Liberzon, A.; Birger, C.; Thorvaldsdóttir, H.; Ghandi, M.; Mesirov, J.P.; Tamayo, P. The Molecular Signatures Database (MSigDB) hallmark gene set collection. Cell Syst. 2015, 1, 417–425. [Google Scholar] [CrossRef] [PubMed]
  39. Semenza, G.L. Hypoxia-inducible factor 1: Oxygen homeostasis and disease pathophysiology. Trends Mol. Med. 2001, 7, 345–350. [Google Scholar] [CrossRef]
  40. Qi, J.; Nakayama, K.; Cardiff, R.D.; Borowsky, A.D.; Kaul, K.; Williams, R.; Krajewski, S.; Mercola, D.; Carpenter, P.M.; Bowtell, D.; et al. Siah2-dependent concerted activity of HIF and FoxA2 regulates formation of neuroendocrine phenotype and neuroendocrine prostate tumors. Cancer Cell 2010, 18, 23–38. [Google Scholar] [CrossRef] [PubMed]
  41. Lee, M.-C.; Huang, H.-J.; Chang, T.-H.; Huang, H.-C.; Hsieh, S.-Y.; Chen, Y.-S.; Chou, W.-Y.; Chiang, C.-H.; Lai, C.-H.; Shiau, C.-Y. Genome-wide analysis of HIF-2α chromatin binding sites under normoxia in human bronchial epithelial cells (BEAS-2B) suggests its diverse functions. Sci. Rep. 2016, 6. [Google Scholar] [CrossRef] [PubMed]
  42. Gilkes, D.M.; Bajpai, S.; Wong, C.C.; Chaturvedi, P.; Hubbi, M.E.; Wirtz, D.; Semenza, G.L. Procollagen lysyl hydroxylase 2 is essential for hypoxia-induced breast cancer metastasis. Mol. Cancer Res. 2013, 11, 456–466. [Google Scholar] [CrossRef] [PubMed]
  43. Fu, Y.; Zheng, S.; Zheng, Y.; Huang, R.; An, N.; Liang, A.; Hu, C. Glioma derived isocitrate dehydrogenase-2 mutations induced up-regulation of HIF-1α and β-catenin signaling: Possible impact on glioma cell metastasis and chemo-resistance. Int. J. Biochem. Cell Biol. 2012, 44, 770–775. [Google Scholar] [CrossRef] [PubMed]
  44. Metellus, P.; Colin, C.; Taieb, D.; Guedj, E.; Nanni-Metellus, I.; de Paula, A.M.; Colavolpe, C.; Fuentes, S.; Dufour, H.; Barrie, M.; et al. IDH mutation status impact on in vivo hypoxia biomarkers expression: New insights from a clinical, nuclear imaging and immunohistochemical study in 33 glioma patients. J. Neurooncol. 2011, 105, 591–600. [Google Scholar] [CrossRef] [PubMed]
  45. Williams, S.C.; Karajannis, M.A.; Chiriboga, L.; Golfinos, J.G.; von Deimling, A.; Zagzag, D. R132H-mutation of Isocitrate Dehydrogenase-1 is not Sufficient for HIF-1α Upregulation in Adult Glioma. Acta Neuropathol. 2011, 121, 279–281. [Google Scholar] [CrossRef] [PubMed]
  46. Chesnelong, C.; Chaumeil, M.M.; Blough, M.D.; Al-Najjar, M.; Stechishin, O.D.; Chan, J.A.; Pieper, R.O.; Ronen, S.M.; Weiss, S.; Luchman, H.A.; et al. Lactate dehydrogenase A silencing in IDH mutant gliomas. Neuro Oncol. 2014, 16, 686–695. [Google Scholar] [CrossRef] [PubMed]
  47. Lee, M.-J.; Kim, J.-Y.; Suk, K.; Park, J.-H. Identification of the hypoxia-inducible factor 1 alpha-responsive HGTD-P gene as a mediator in the mitochondrial apoptotic pathway. Mol. Cell. Biol. 2004, 24, 3918–3927. [Google Scholar] [CrossRef] [PubMed]
  48. Cho, Y.-E.; Kim, J.-Y.; Kim, Y.-W.; Park, J.-H.; Lee, S. Expression and prognostic significance of human growth and transformation-dependent protein in gastric carcinoma and gastric adenoma. Hum. Pathol. 2009, 40, 975–981. [Google Scholar] [CrossRef] [PubMed]
  49. Cho, Y.-E.; Kim, J.-Y.; Kim, Y.-J.; Kim, Y.-W.; Lee, S.; Park, J.-H. Expression and clinicopathological significance of human growth and transformation-dependent protein (HGTD-P) in uterine cervical cancer. Histopathology 2010, 57, 479–482. [Google Scholar] [CrossRef] [PubMed]
  50. Tang, B.; Qu, Y.; Zhao, F.; Mao, M.; Tang, J.; Li, X.; Ferriero, D.; Mu, D. In vitro effects of hypoxia-inducible factor 1alpha on the biological characteristics of the SiHa uterine cervix cancer cell line. Int. J. Gynecol. Cancer 2009, 19, 898–904. [Google Scholar] [CrossRef] [PubMed]
  51. Srivastava, S.; Thakkar, B.; Yeoh, K.G.; Ho, K.Y.; Teh, M.; Soong, R.; Salto-Tellez, M. Expression of proteins associated with hypoxia and Wnt pathway activation is of prognostic significance in hepatocellular carcinoma. Virchows Arch. 2015, 466, 541–548. [Google Scholar] [CrossRef] [PubMed]
  52. Johnson, L.A.; Banerji, S.; Lawrance, W.; Gileadi, U.; Prota, G.; Holder, K.A.; Roshorm, Y.M.; Hanke, T.; Cerundolo, V.; Gale, N.W.; et al. Dendritic cells enter lymph vessels by hyaluronan-mediated docking to the endothelial receptor LYVE-1. Nat. Immunol. 2017, 18, 762–770. [Google Scholar] [CrossRef] [PubMed]
  53. Wang, W.; Lufkin, T. The murine Otp homeobox gene plays an essential role in the specification of neuronal cell lineages in the developing hypothalamus. Dev. Biol. 2000, 227, 432–449. [Google Scholar] [CrossRef] [PubMed]
  54. Swarts, D.R.A.; Henfling, M.E.R.; Van Neste, L.; van Suylen, R.-J.; Dingemans, A.-M.C.; Dinjens, W.N.M.; Haesevoets, A.; Rudelius, M.; Thunnissen, E.; Volante, M.; et al. CD44 and OTP are strong prognostic markers for pulmonary carcinoids. Clin. Cancer Res. 2013, 19, 2197–2207. [Google Scholar] [CrossRef] [PubMed]
  55. Nonaka, D.; Papaxoinis, G.; Mansoor, W. Diagnostic Utility of Orthopedia Homeobox (OTP) in Pulmonary Carcinoid Tumors. Am. J. Surg. Pathol. 2016, 40, 738–744. [Google Scholar] [CrossRef] [PubMed]
  56. Hanley, K.Z.; Dureau, Z.J.; Cohen, C.; Shin, D.M.; Owonikoko, T.K.; Sica, G.L. Orthopedia homeobox is preferentially expressed in typical carcinoids of the lung. Cancer Cytopathol 2018, 126, 236–242. [Google Scholar] [CrossRef] [PubMed]
  57. Campos, B.; Zeng, L.; Daotrong, P.H.; Eckstein, V.; Unterberg, A.; Mairbäurl, H.; Herold-Mende, C. Expression and regulation of AC133 and CD133 in glioblastoma. Glia 2011, 59, 1974–1986. [Google Scholar] [CrossRef] [PubMed]
  58. Baloglu, E.; Ke, A.; Abu-Taha, I.H.; Bartsch, P.; Mairbaurl, H. In vitro hypoxia impairs {beta}2-adrenergic receptor signaling in primary rat alveolar epithelial cells. Am. J. Physiol. Lung Cell Mol. Physiol. 2009, 296, L500–L509. [Google Scholar] [CrossRef] [PubMed]
  59. Kohanbash, G.; Carrera, D.A.; Shrivastav, S.; Ahn, B.J.; Jahan, N.; Mazor, T.; Chheda, Z.S.; Downey, K.M.; Watchmaker, P.B.; Beppler, C.; et al. Isocitrate dehydrogenase mutations suppress STAT1 and CD8+ T cell accumulation in gliomas. J. Clin. Investig. 2017, 127, 1425–1437. [Google Scholar] [CrossRef] [PubMed] [Green Version]
  60. Campos, B.; Gal, Z.; Baader, A.; Schneider, T.; Sliwinski, C.; Gassel, K.; Bageritz, J.; Grabe, N.; von Deimling, A.; Beckhove, P.; et al. Aberrant self-renewal and quiescence contribute to the aggressiveness of glioblastoma. J. Pathol. 2014, 234, 23–33. [Google Scholar] [CrossRef] [PubMed]
  61. Tibshirani, R. Regression Shrinkage and Selection via the Lasso. J. R. Stat. Soc. Ser. B 1996, 58, 267–288. [Google Scholar]
  62. Simon, N.; Friedman, J.; Hastie, T.; Tibshirani, R. Regularization Paths for Cox’s Proportional Hazards Model via Coordinate Descent. J. Stat. Softw. 2011, 39, 1–13. [Google Scholar] [CrossRef] [PubMed]
  63. Tibshirani, R. The lasso method for variable selection in the Cox model. Stat. Med. 1997, 16, 385–395. [Google Scholar] [CrossRef]
Figure 1. Transcriptome analysis of IDH1mut and IDH1wt glioma stem cells (GSCs) cultured in normoxia and hypoxia. (A) Principal component analysis of global expression changes of IDH1mut (blue symbols) and IDH1wt (red symbols) GSCs. Different geometric forms (triangles, squares, diamonds, circles) represent different cell lines. Hypoxia: light, normoxia: dark colors. (B) Absolute difference between hypoxic and normoxic samples in PC1 and (C) significant larger difference in PC2 in IDH1wt cells compared to IDH1mut GSCs (* p < 0.028).
Ijms 19 02903 g001
Figure 2. (A,B) Volcano plots of differentially up- and downregulated genes in IDH1mut (blue) and IDH1wt (red) GSCs. (C,D) Gene set enrichment analysis (GSE) of known hypoxia signatures as published by Fardin et al. (Set 1) [37], Semenza et al. (Set 2) [39], Liberzon et al. (Set 3) [38], and Qi et al. (Set 4) [40] for IDH1mut (blue) and IDH1wt (red) GSCs. A higher GSE score indicates a better correlation with the published gene set and considered significant if p < 0.05 (paired Student’s t-Test, * p < 0.05; ** p < 0.01) (n = number of genes in set). (E) Venn diagrams showing the overlap of differentially expressed genes in hypoxia of IDHmut and IDH1wt GSCs.
Ijms 19 02903 g002
Figure 3. Development of a five gene hypoxia score in the lower grade glioma cohort of The Cancer Genome Atlas (LGG TCGA) dataset. (A) The cross-validation error curve shows the regularization path of the Least Absolute Shrinkage and Selection Operator (LASSO) algorithm. The elimination of non-informative genes is visualized by the decreasing prediction error to a minimum (black dotted line) with only the five most important genes left in the Cox ph model (grey shaded area = 5–95% confidence interval). (B) These five genes have negative and positive coefficients, implicating that namely LYVE1 and FAM162A correlate with a better survival when up-regulated, whereas WNT6, OTP, and PLOD1 correlate with a worse survival.
Ijms 19 02903 g003
Figure 4. Survival analysis of the LGG TCGA cohort when median splitting the following subgroups into HRS-scorehigh and HRS-scorelow: (A) 1p19q co-deletion status, (B) WHO grade II and III, (C) Age high and low (median splitted) (ticks = censored events, OS: overall survival).
Ijms 19 02903 g004
Figure 5. Clinical, histological and molecular confounders were analyzed together with the continuous HRS-score in a multivariate Cox ph model in the TCGA and Rembrandt dataset. A high HRS-score proved to be a highly significant predictor of shorter patient survival independent of age, histology, codel status, and WHO grade in both datasets.
Ijms 19 02903 g005
Table 1. Description of glioma stem cell lines.
GSC LineHistologyIDH1 Status2HG (µM)GenderAge
NCH551bsGBMmut139.6m48
NCH612Oligo IIImut40.2m47
NCH620sGBMmut9.4f35
NCH645sGBMmut1792.1m66
NCH421kpGBMwtb.d.l.m77
NCH601pGBMwtb.d.l.m84
NCH644pGBMwtb.d.l.f74
NCH660hpGBMwtb.d.l.f81
p/sGBM = primary/secondary glioblastoma, Oligo = Oligodendroglioma, mut = mutant, wt = wildtype, m = male, f = female, b.d.l. = below detection limit.
Table 2. Gene set enrichment analysis (GSEA) by known hypoxia sets.
Gene Enrichment SetFardin (n = 62)Semenza (n = 36)Liberzon (n = 200)Qi (n = 140)
IDH1mutmean normoxia−0.553−0.364−0.236−0.185
mean hypoxia0.1660.024−0.036−0.018
difference in mean−0.719−0.389−0.200−0.167
p-value0.0030.0210.0480.031
IDH1wtmean normoxia−0.1120.012−0.060−0.073
mean hypoxia0.3980.2580.2730.239
difference in mean−0.510−0.246−0.333−0.313
p-value0.0170.0050.0060.008
n = number of genes in signature.

