Chronic Insulin Infusion Down-Regulates Circulating and Urinary Nitric Oxide (NO) Levels Despite Molecular Changes in the Kidney Predicting Greater Endothelial NO Synthase Activity in Mice

 and
and
Abstract
:1. Introduction
2. Results
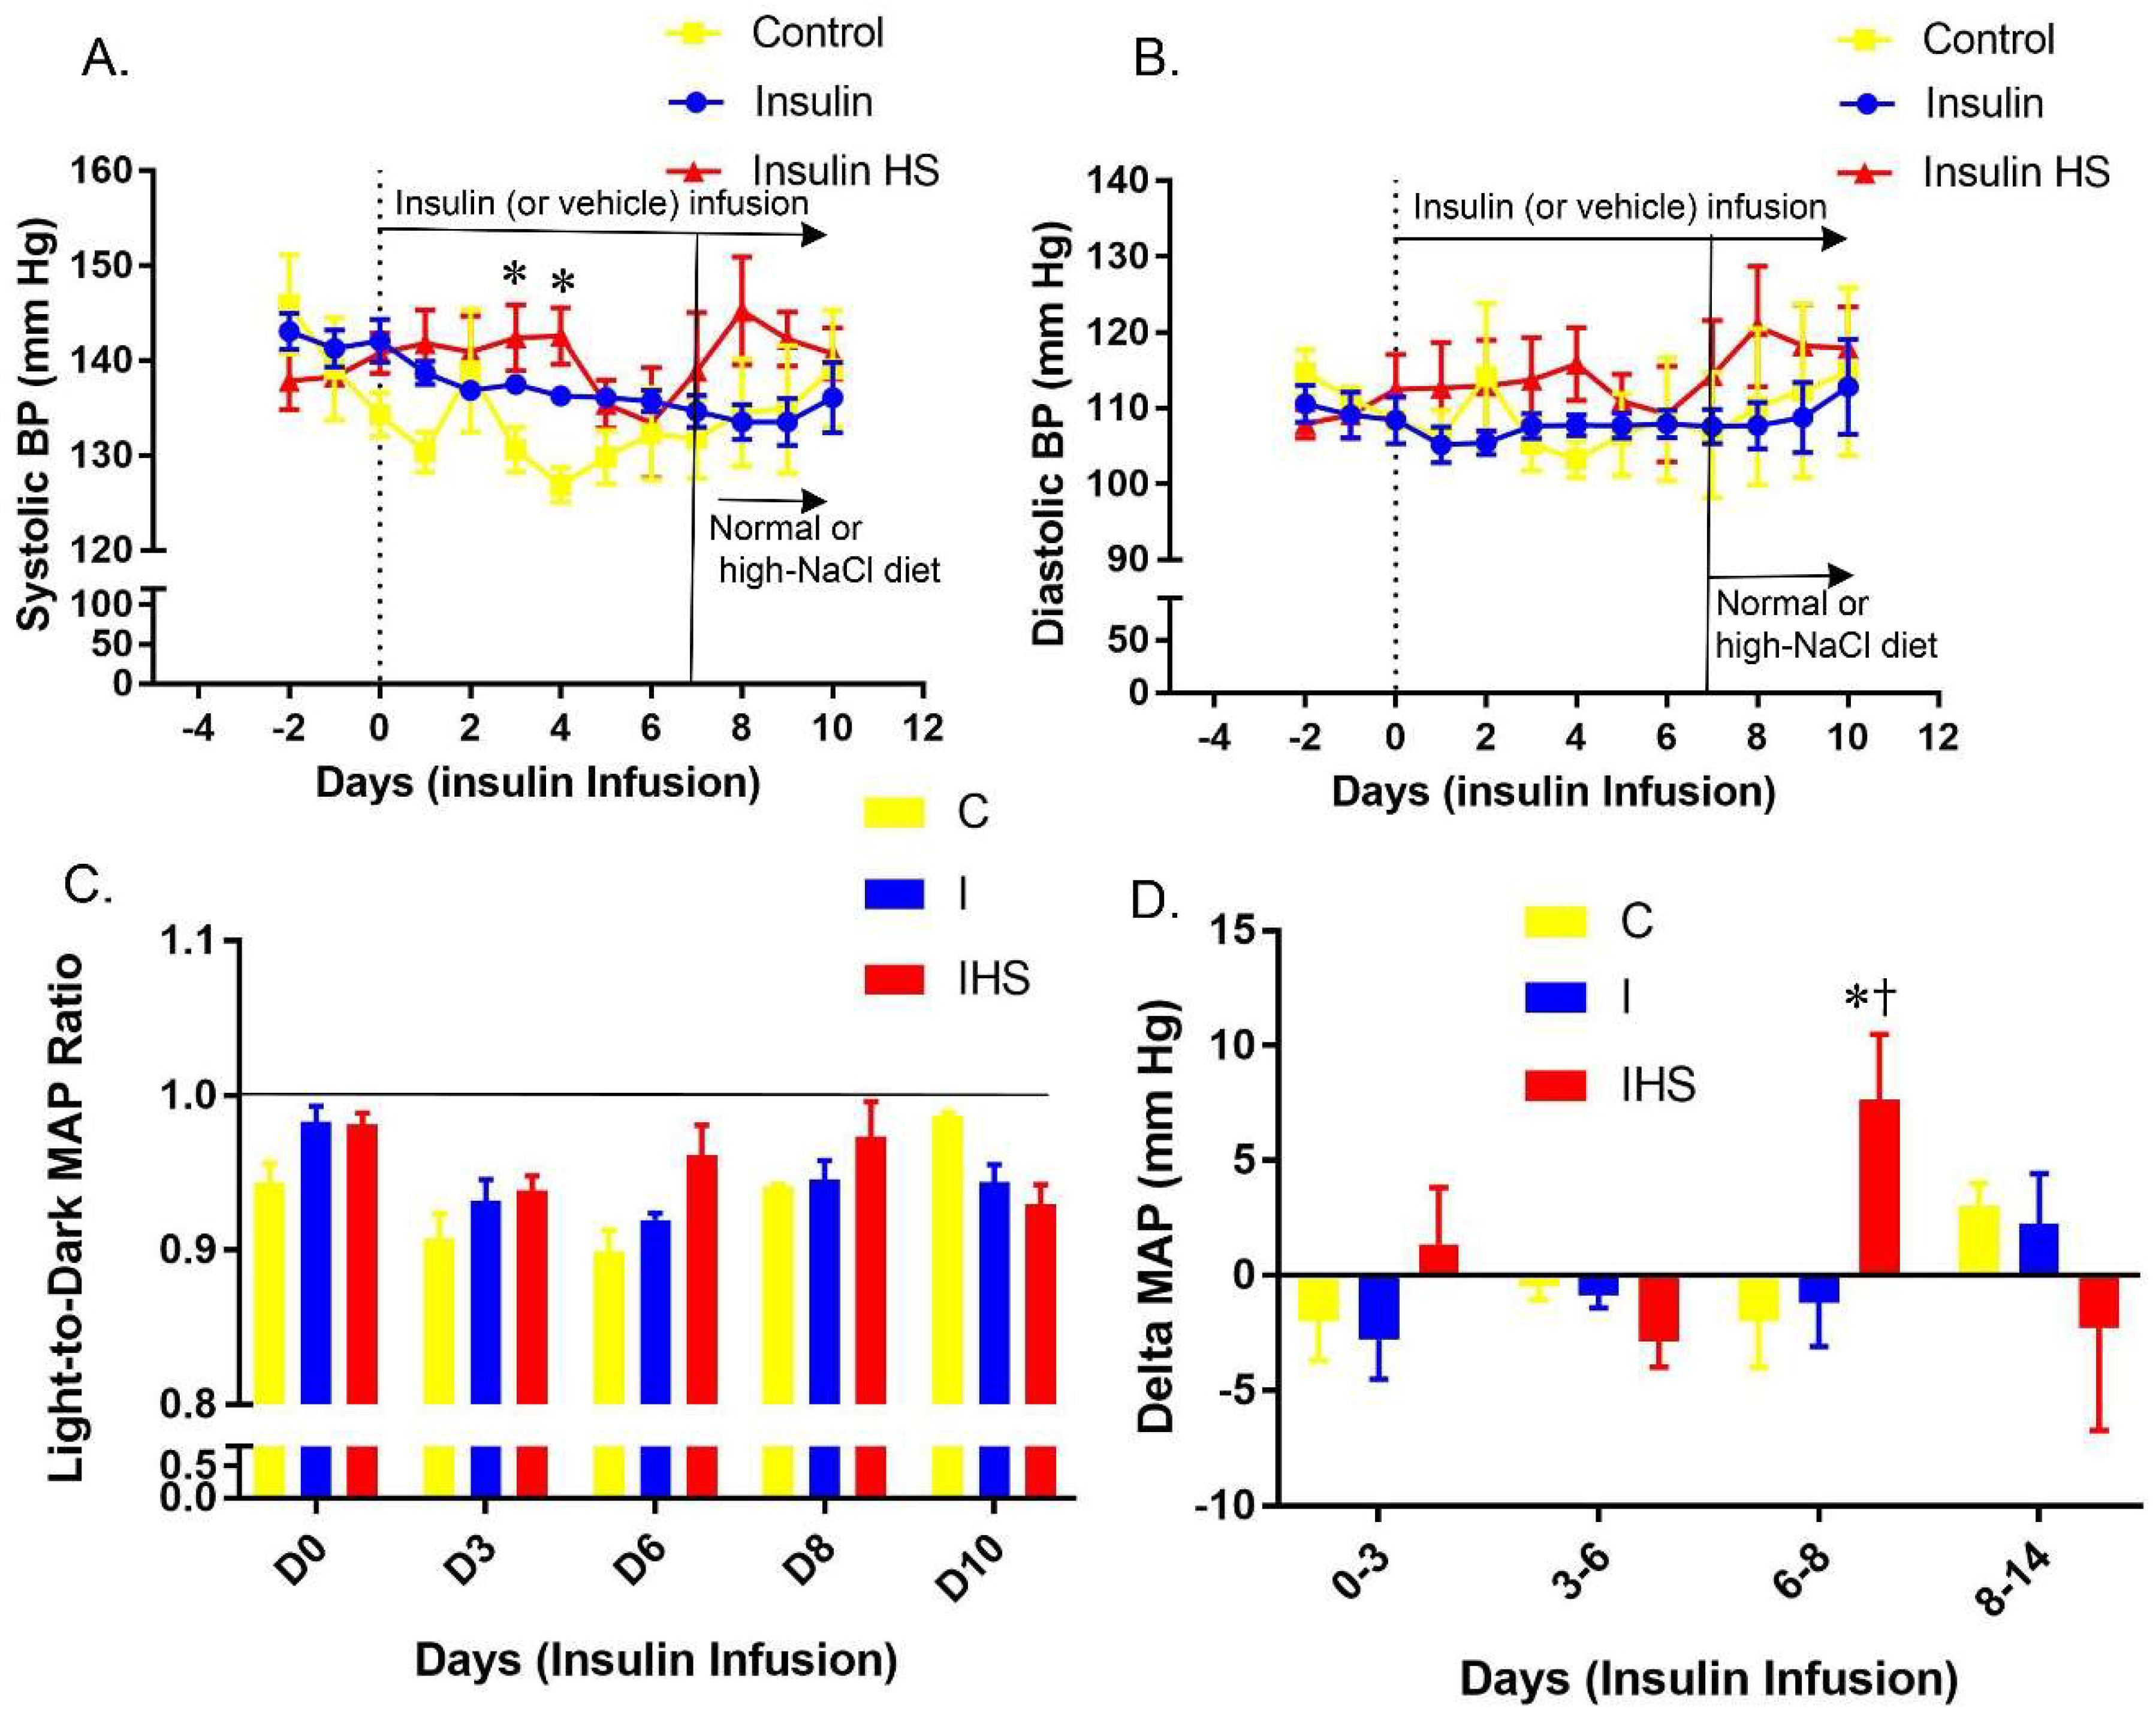
2.1. Blood Pressure
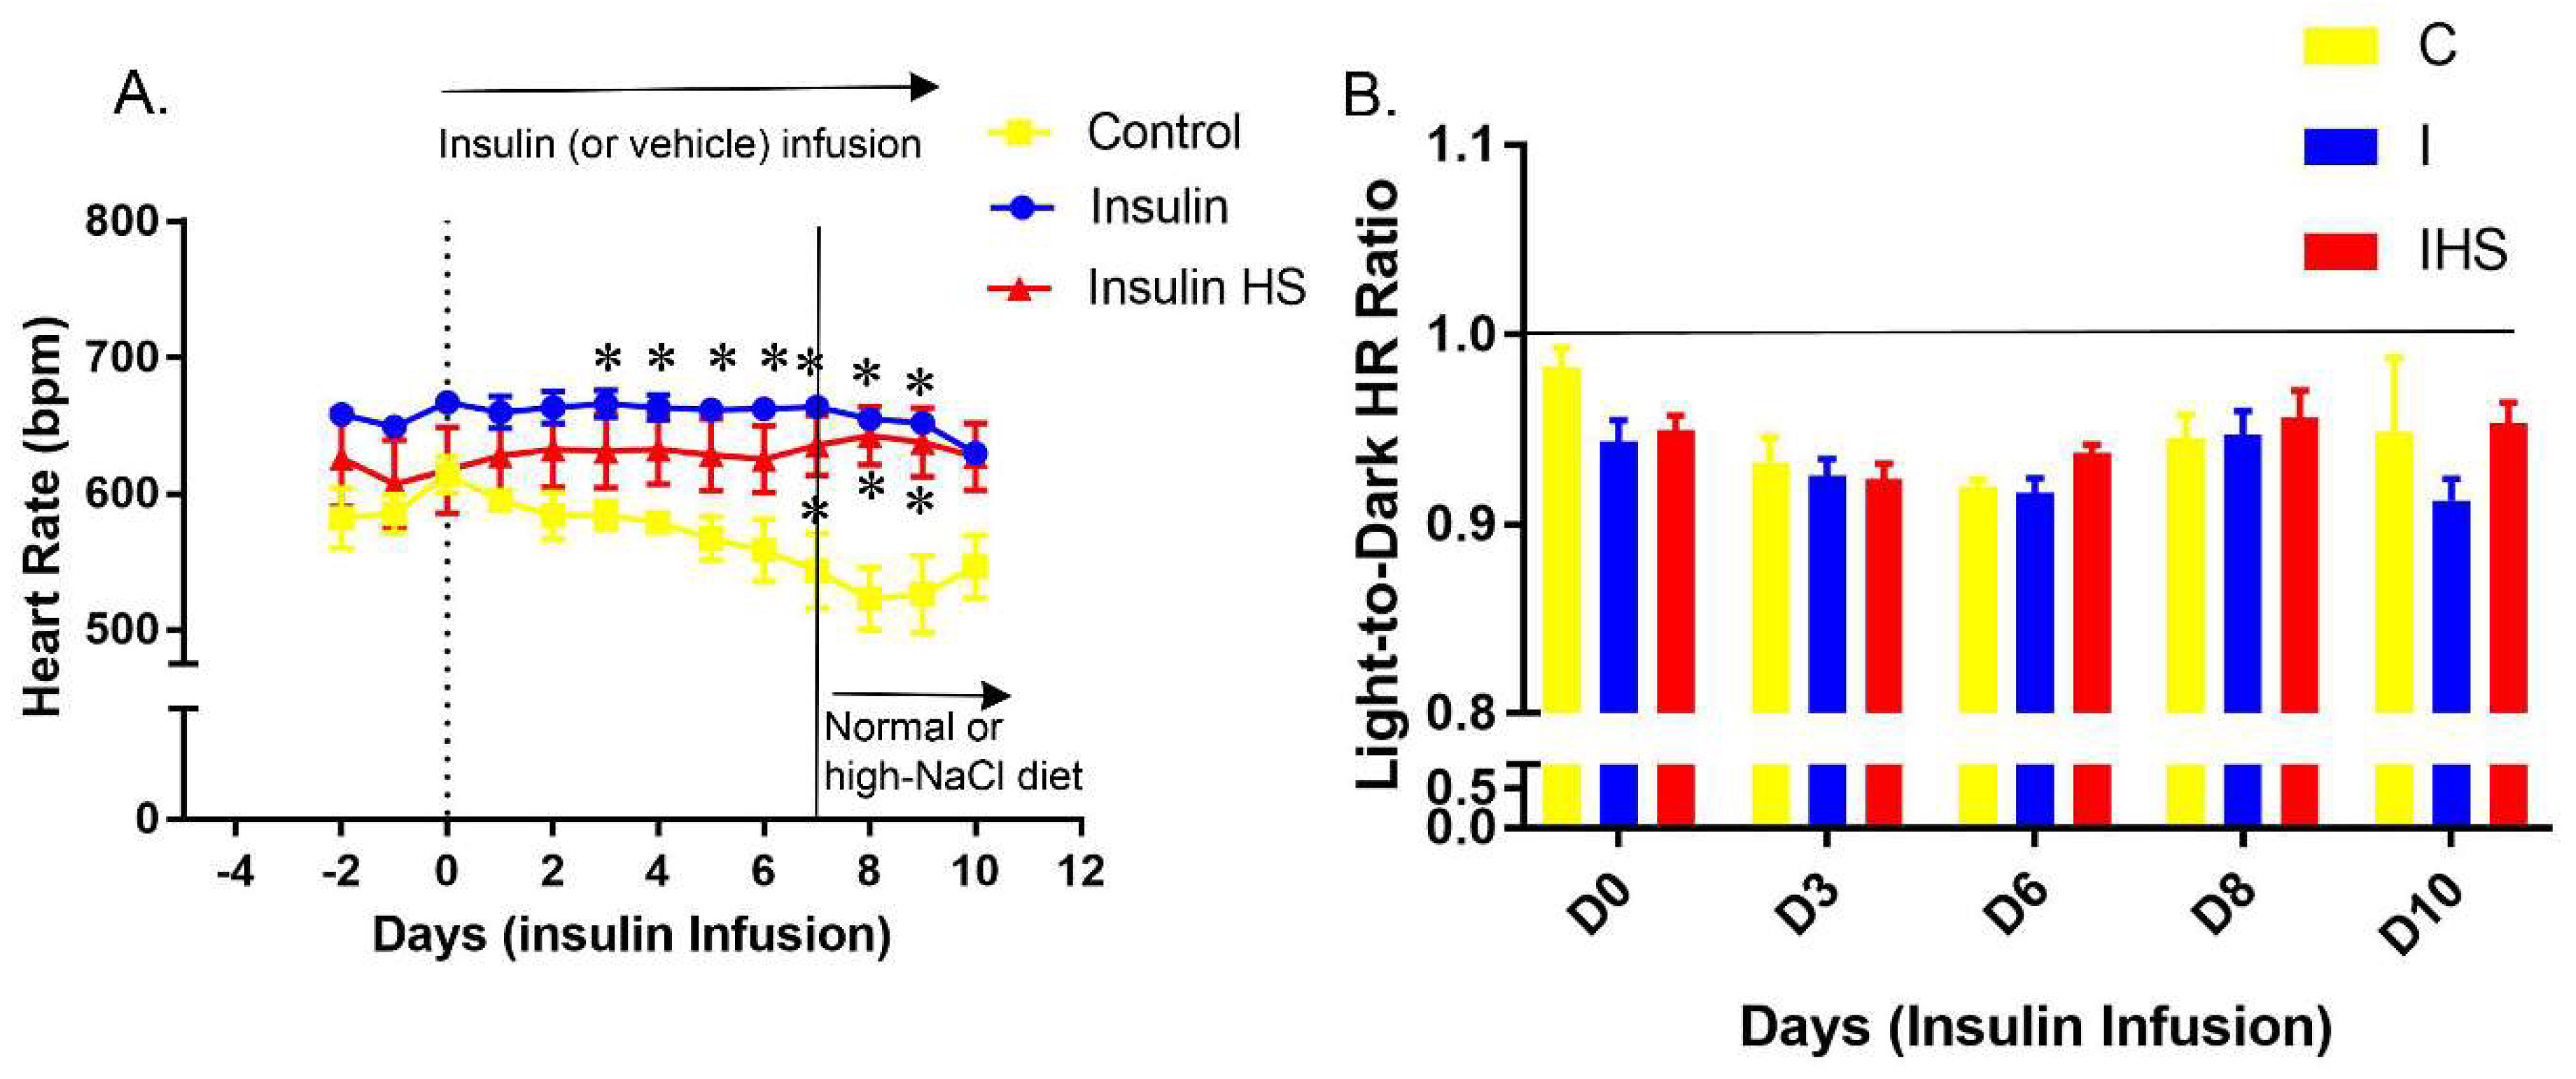
2.2. Heart Rate
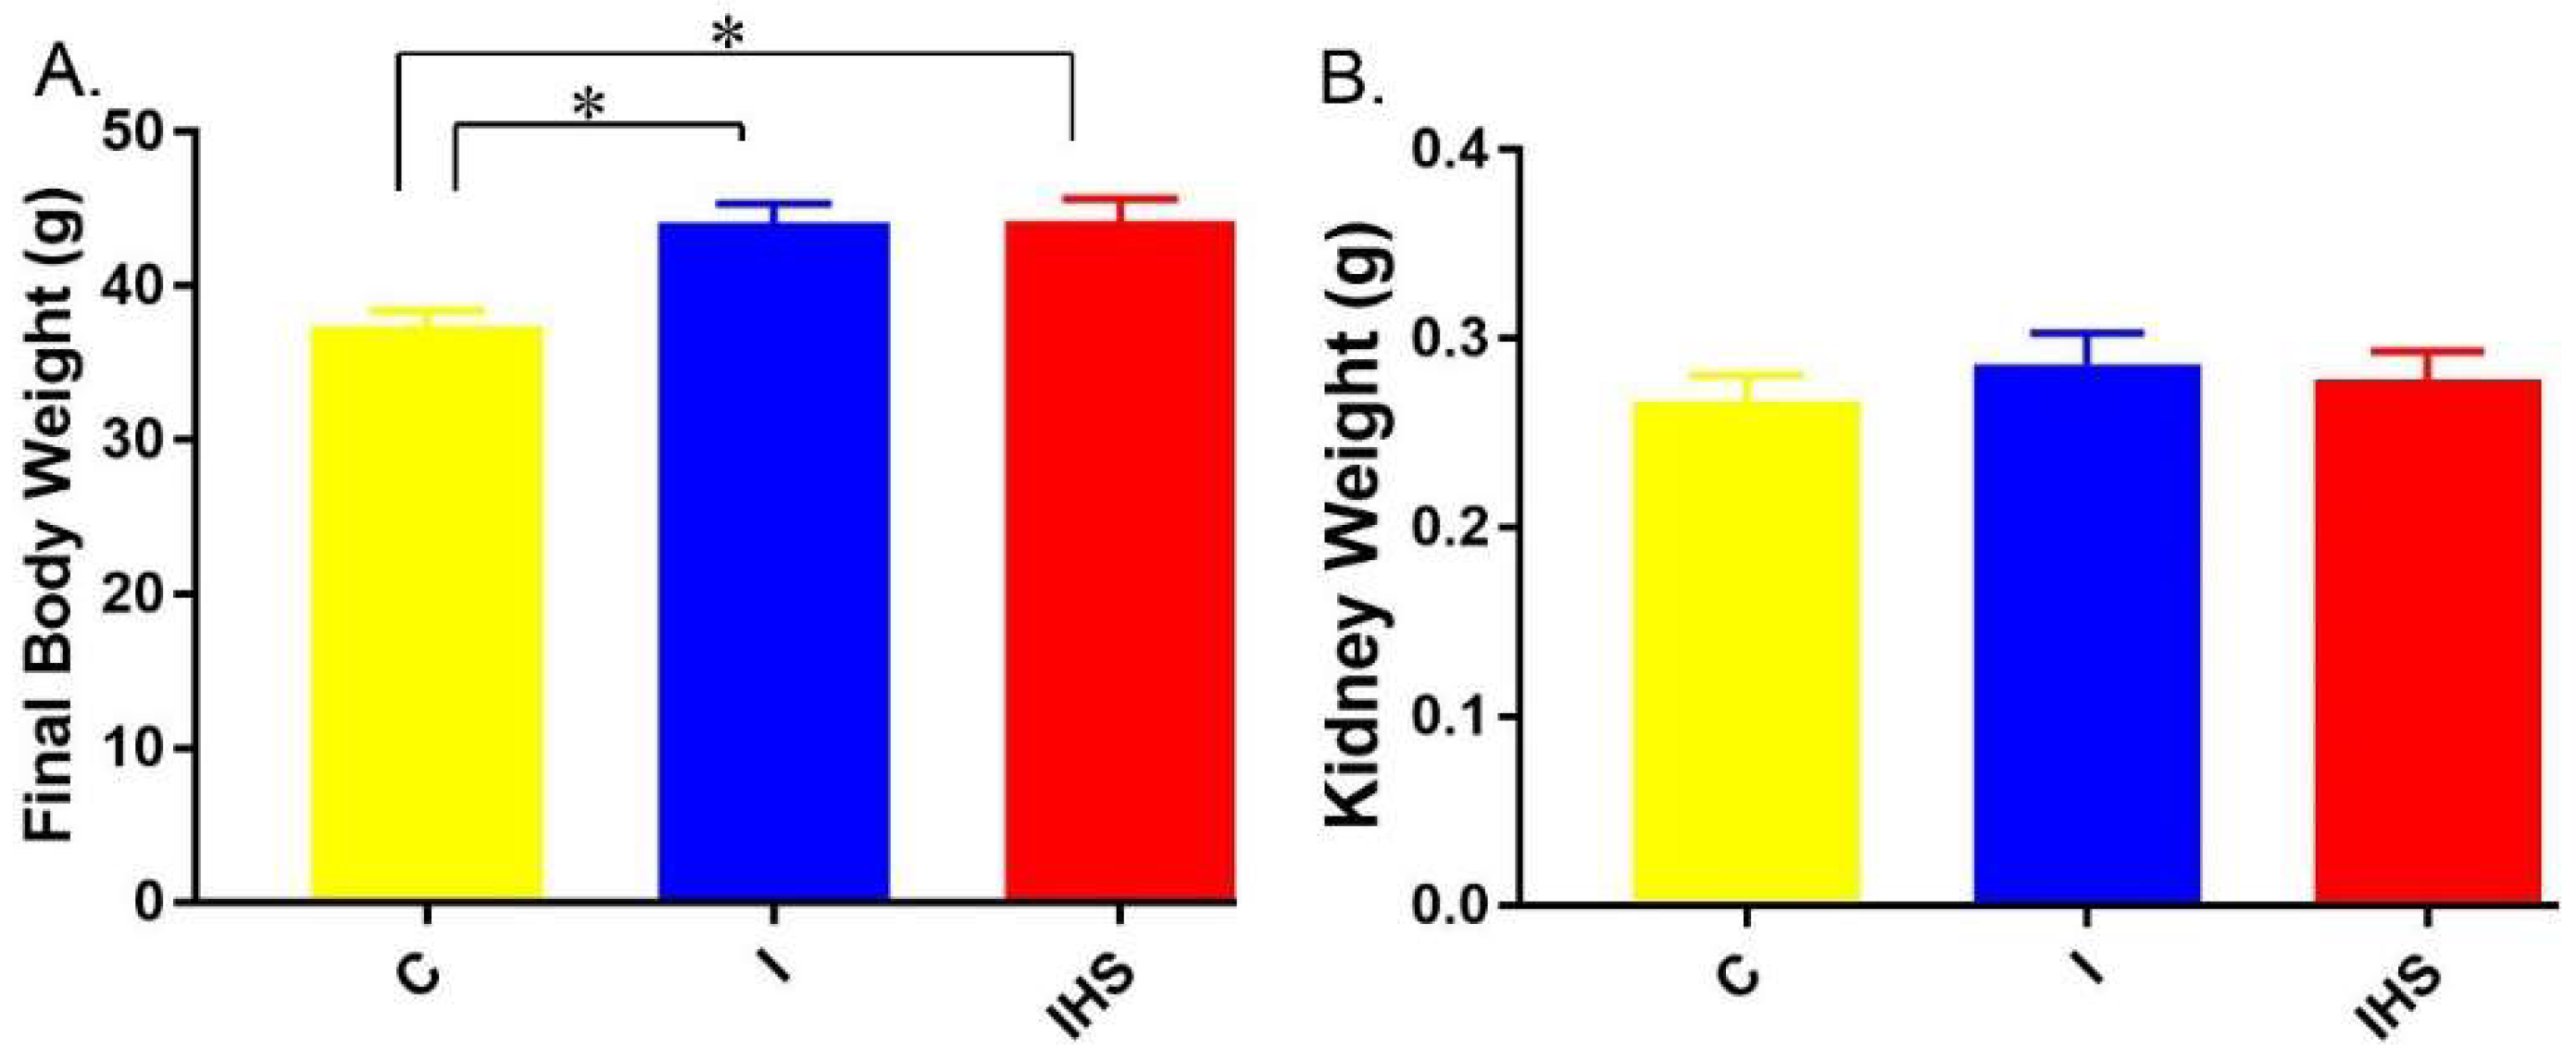
2.3. Physiological Parameters and Blood Chemistry
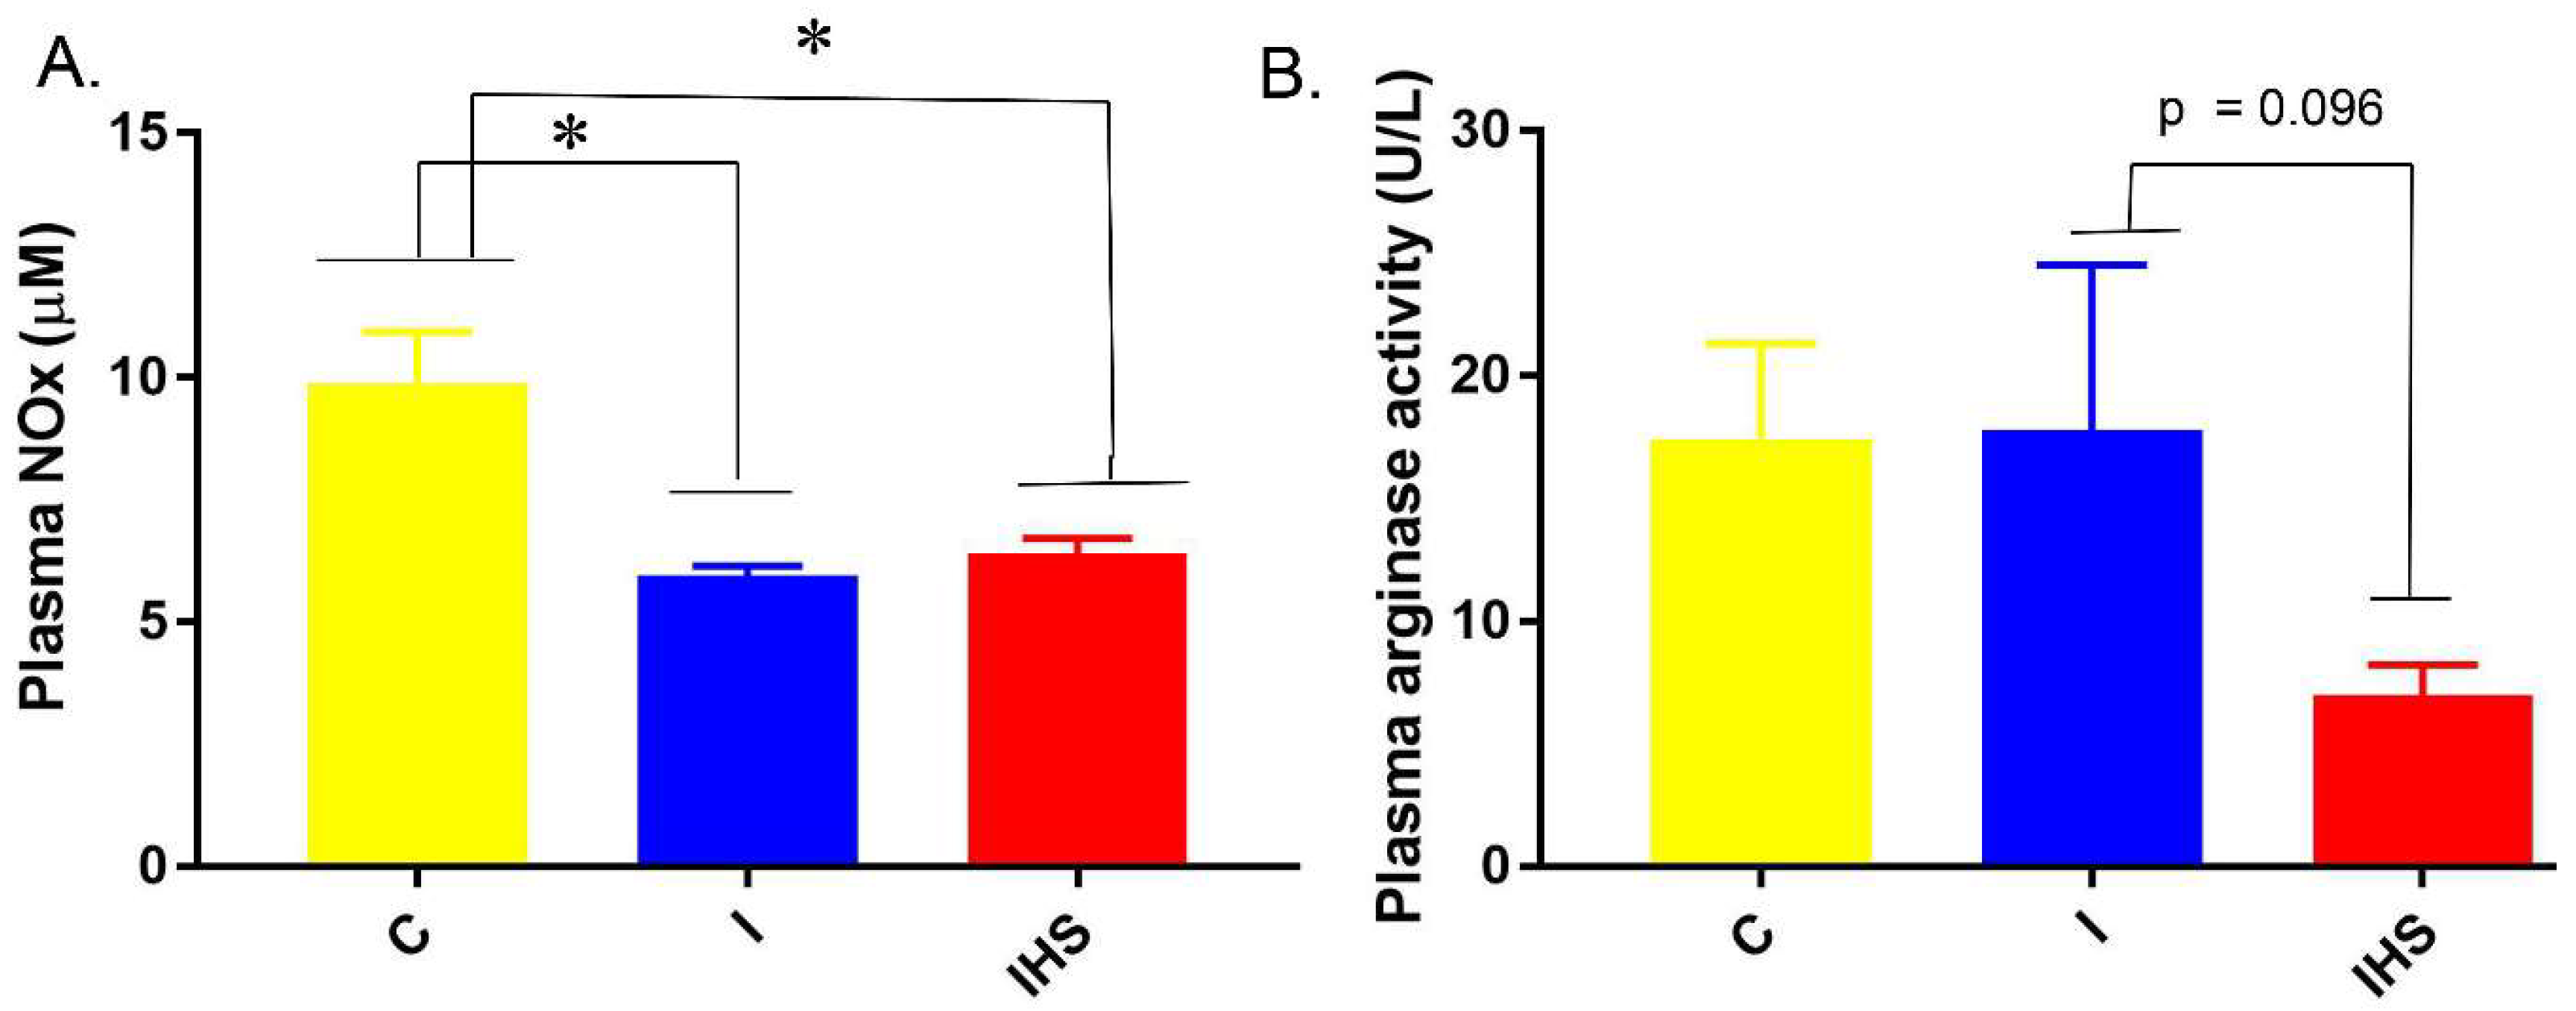
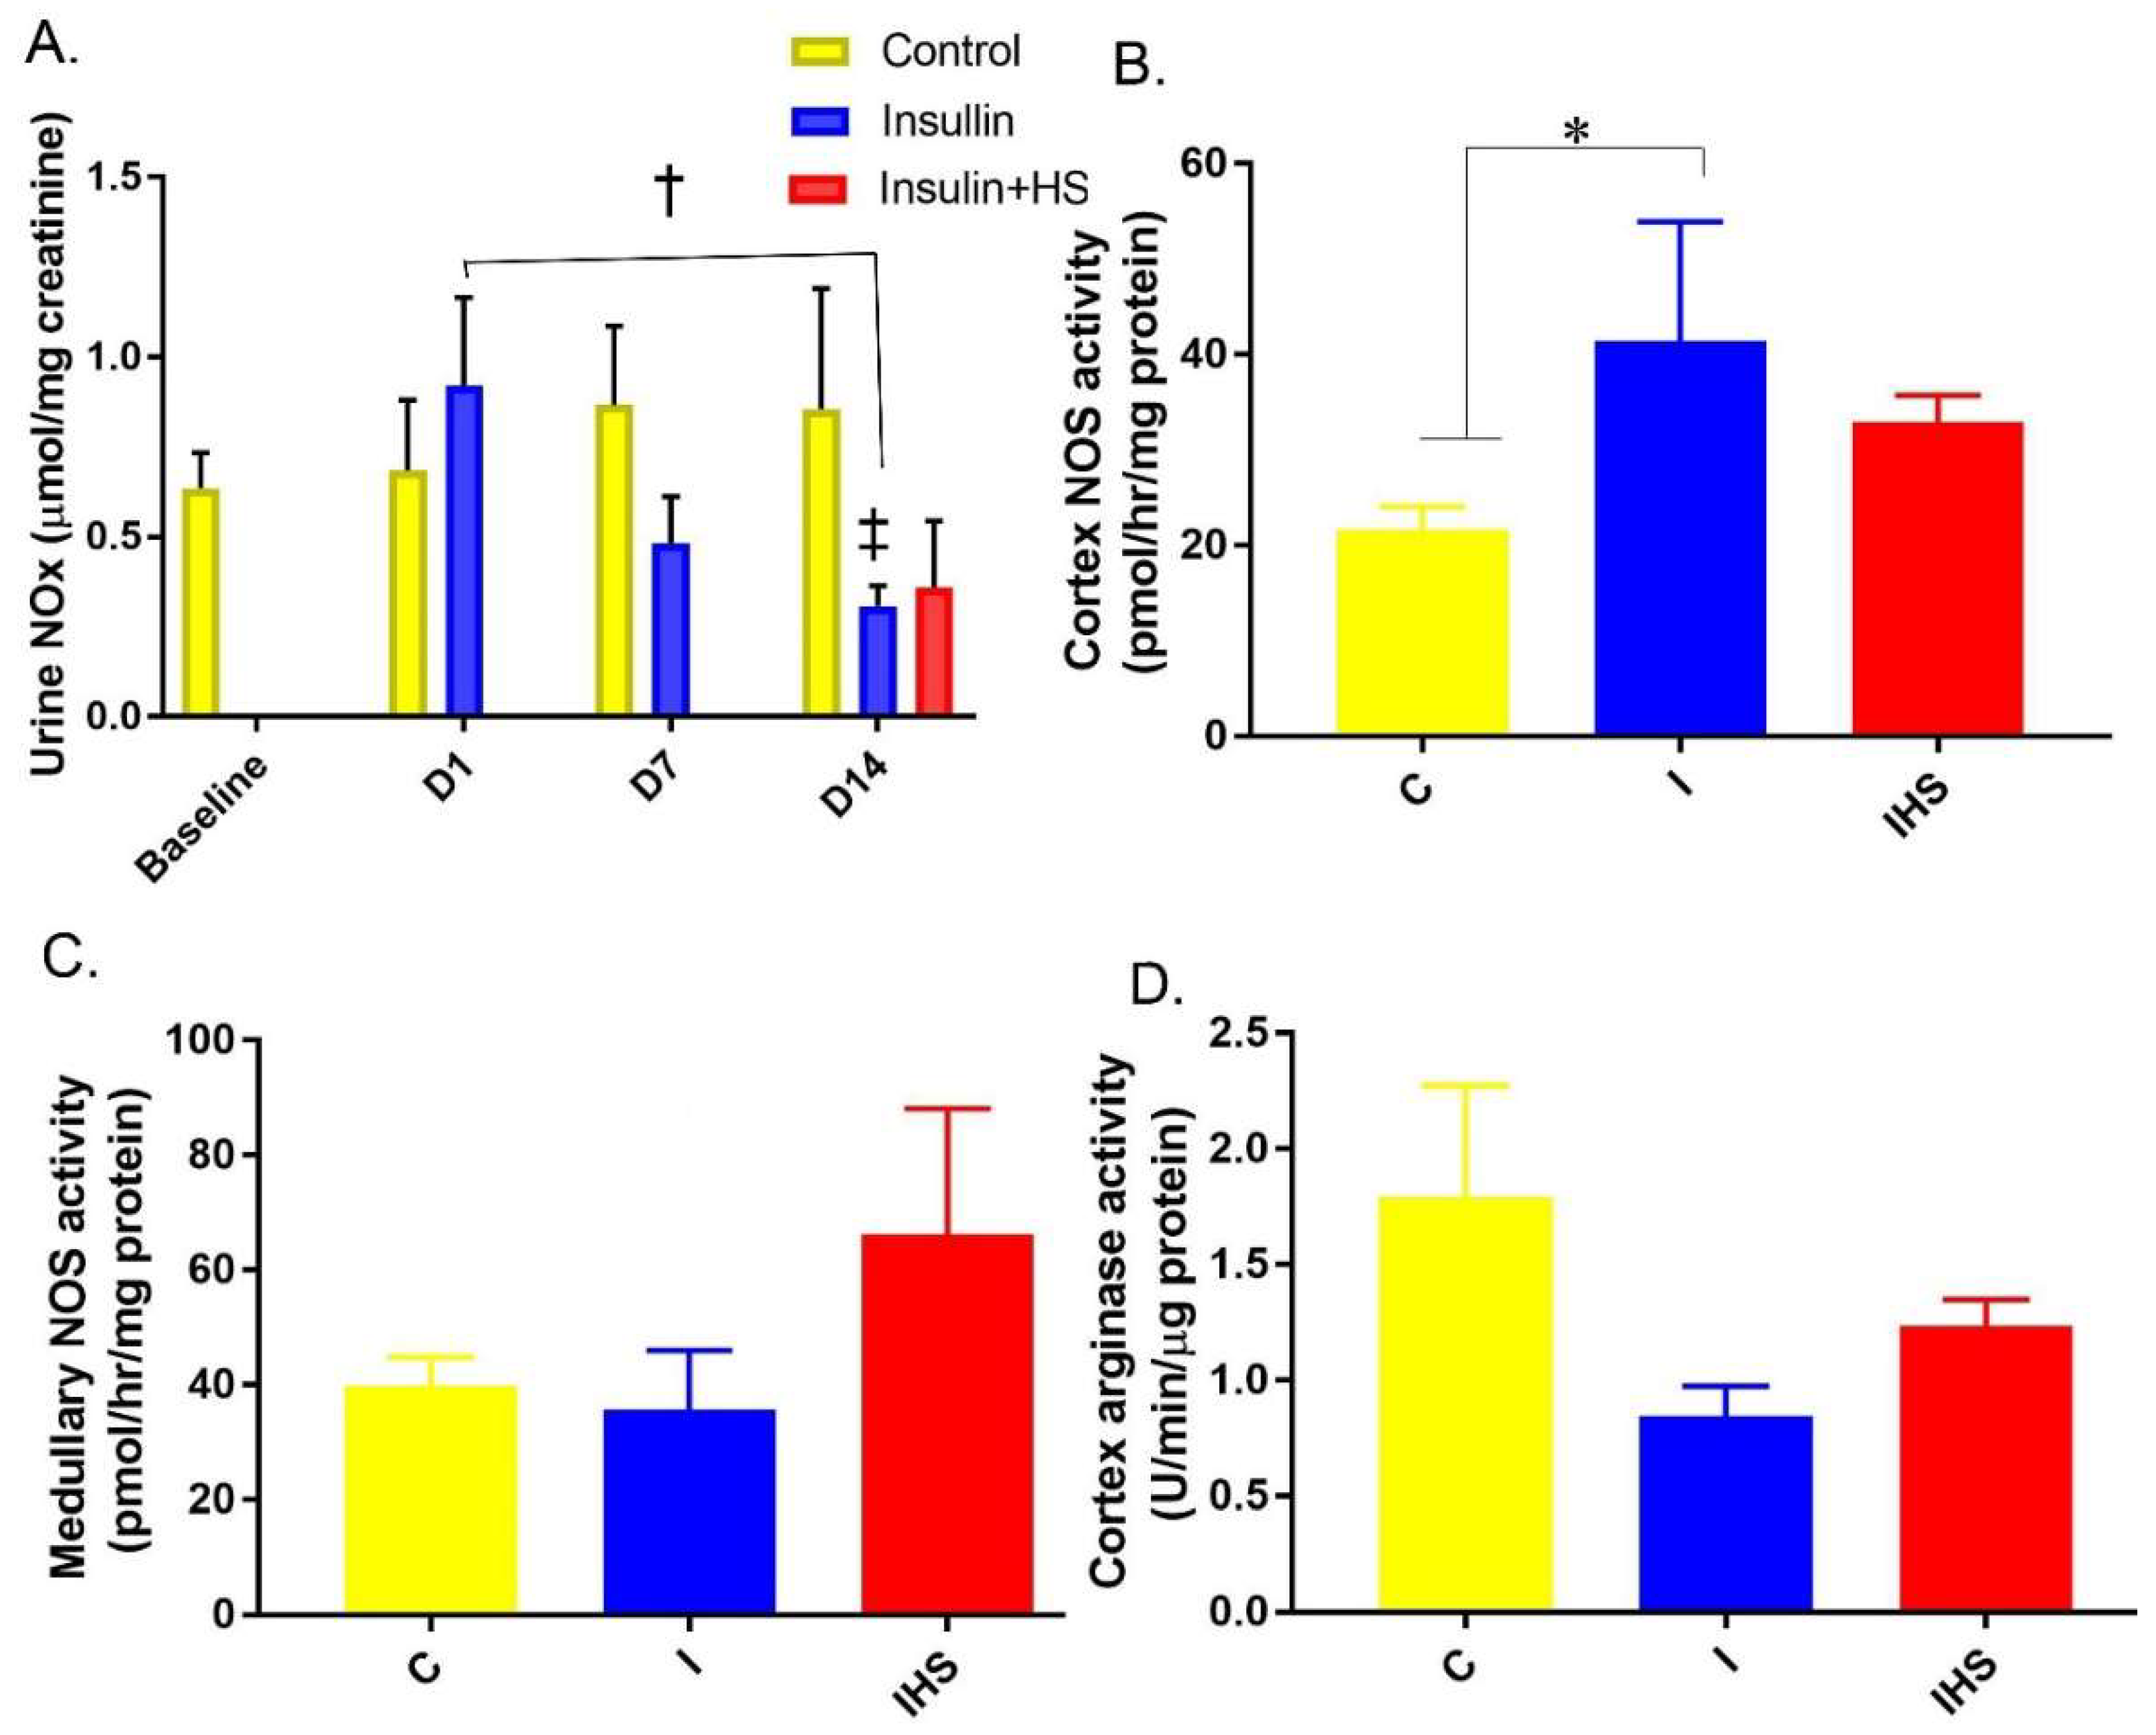
2.4. Plasma Insulin, NOx, and Arginase Activity
2.5. Urine and Kidney NO Regulation
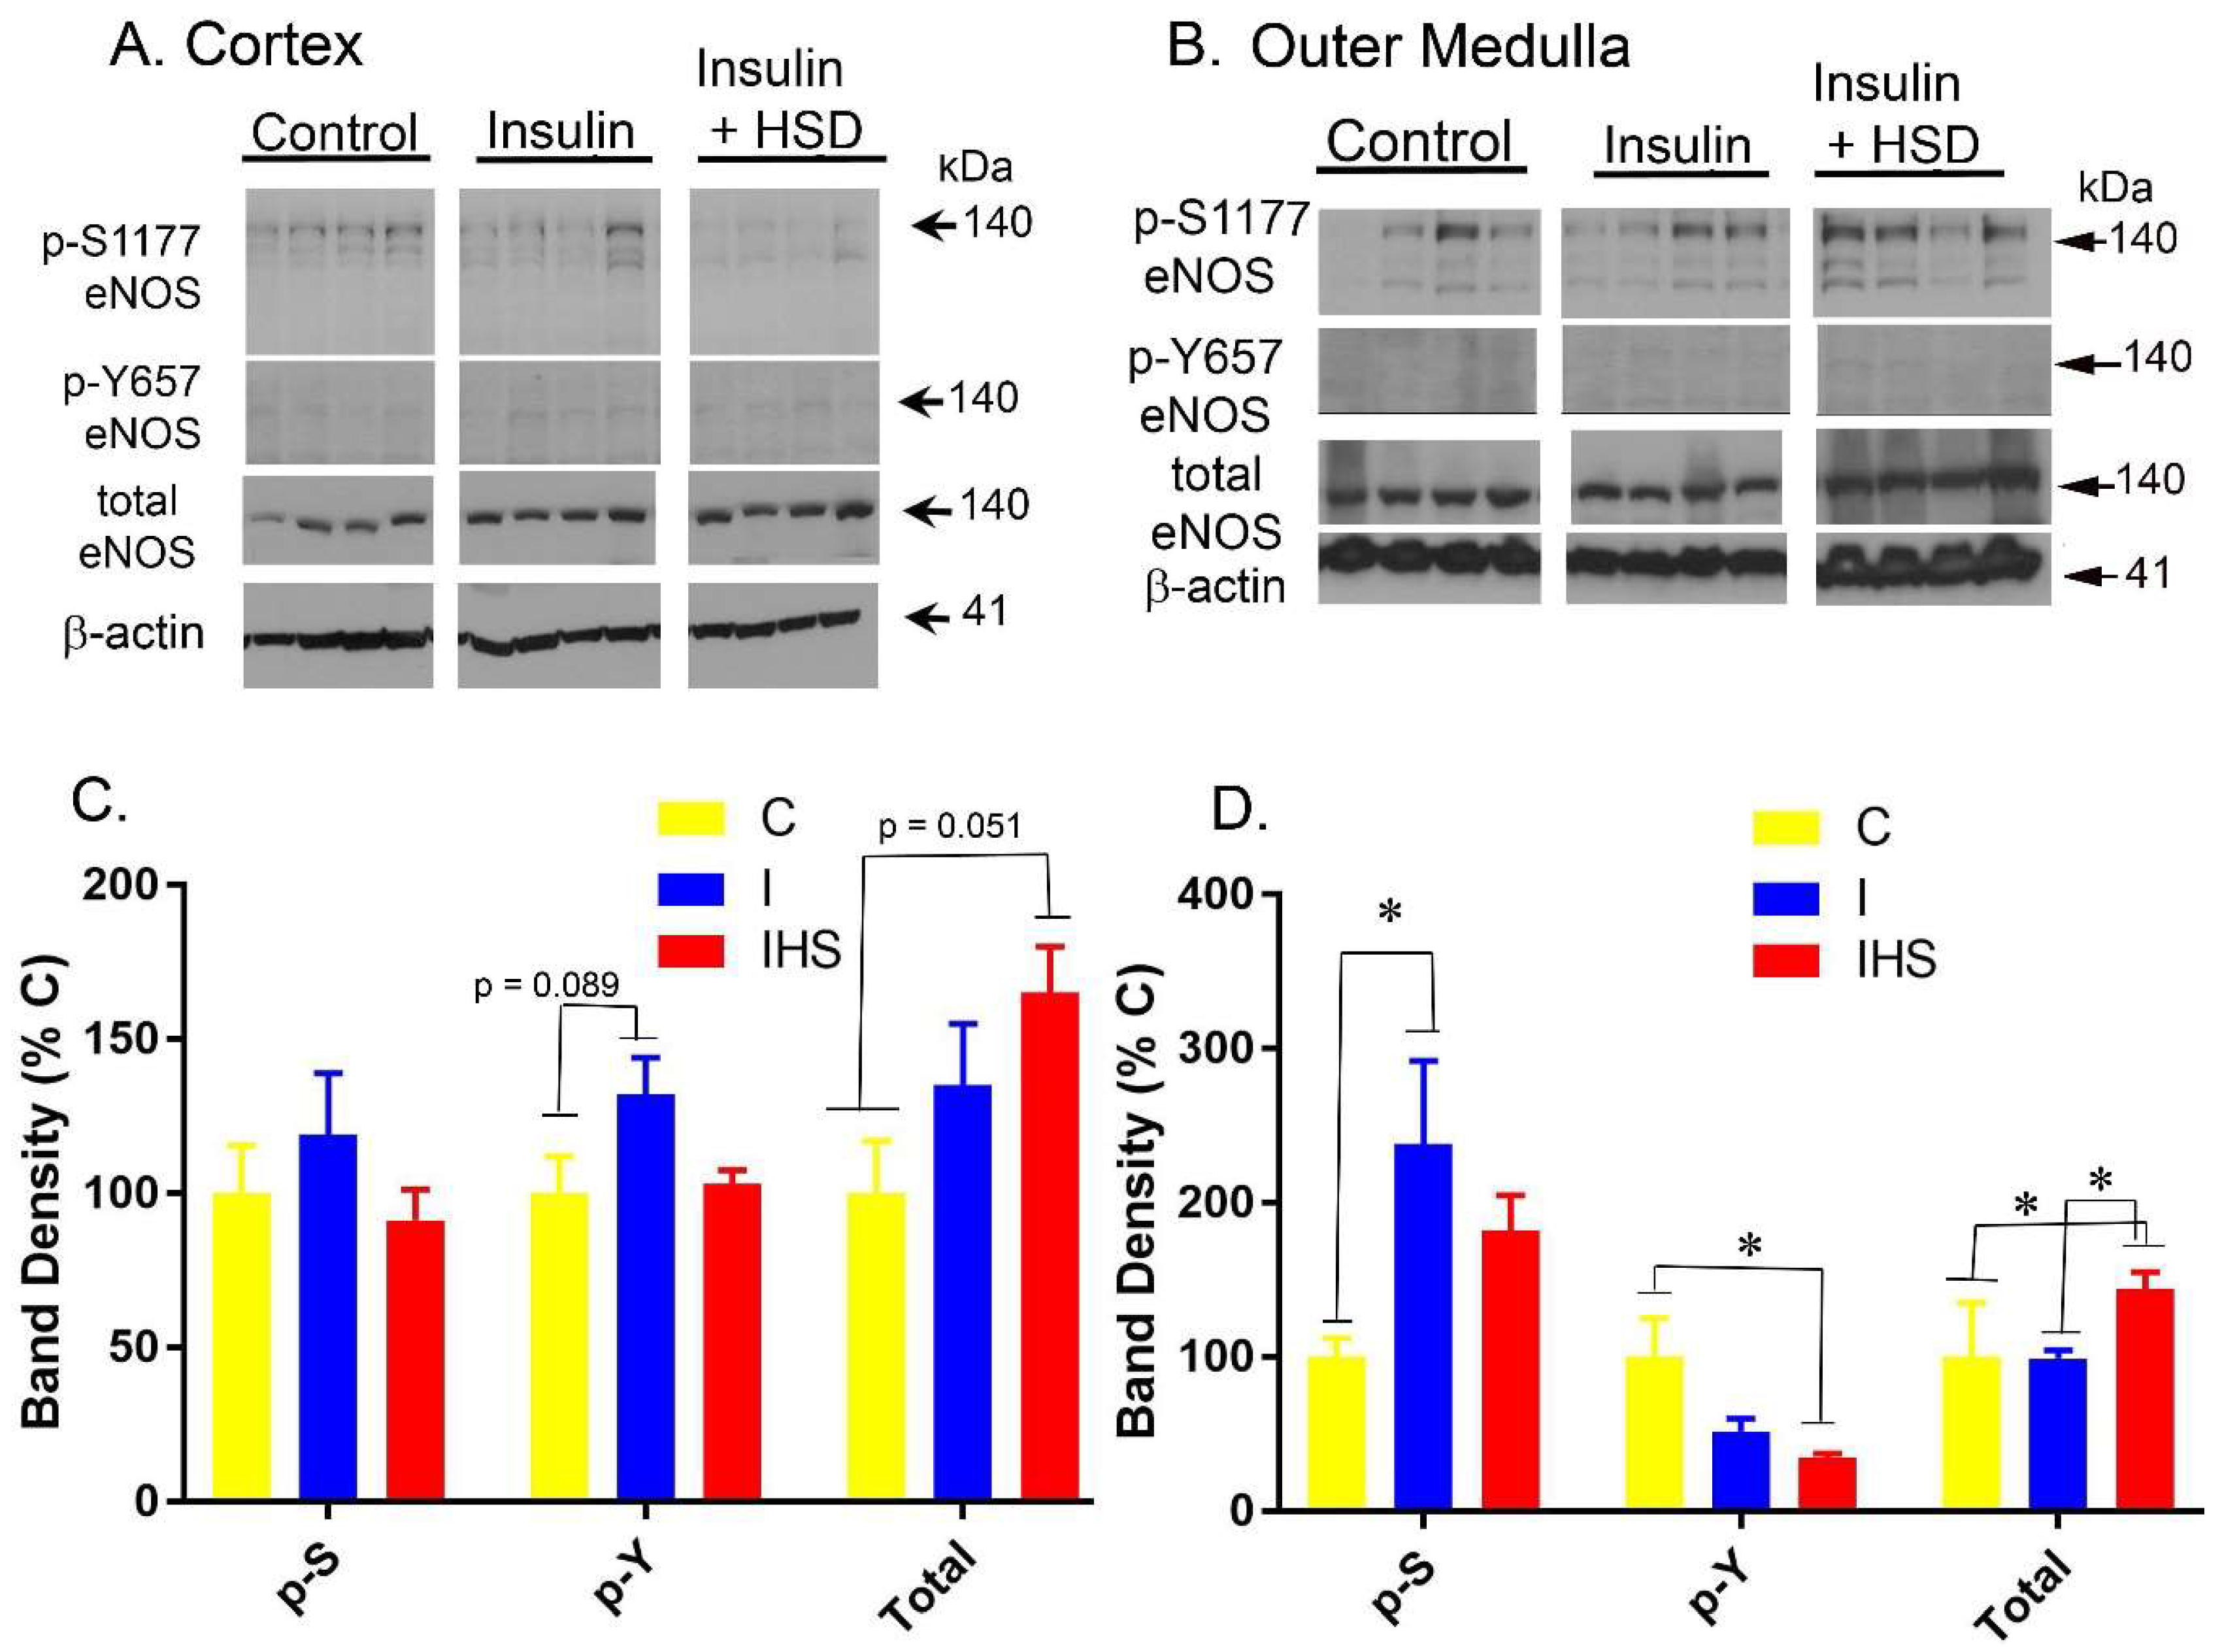
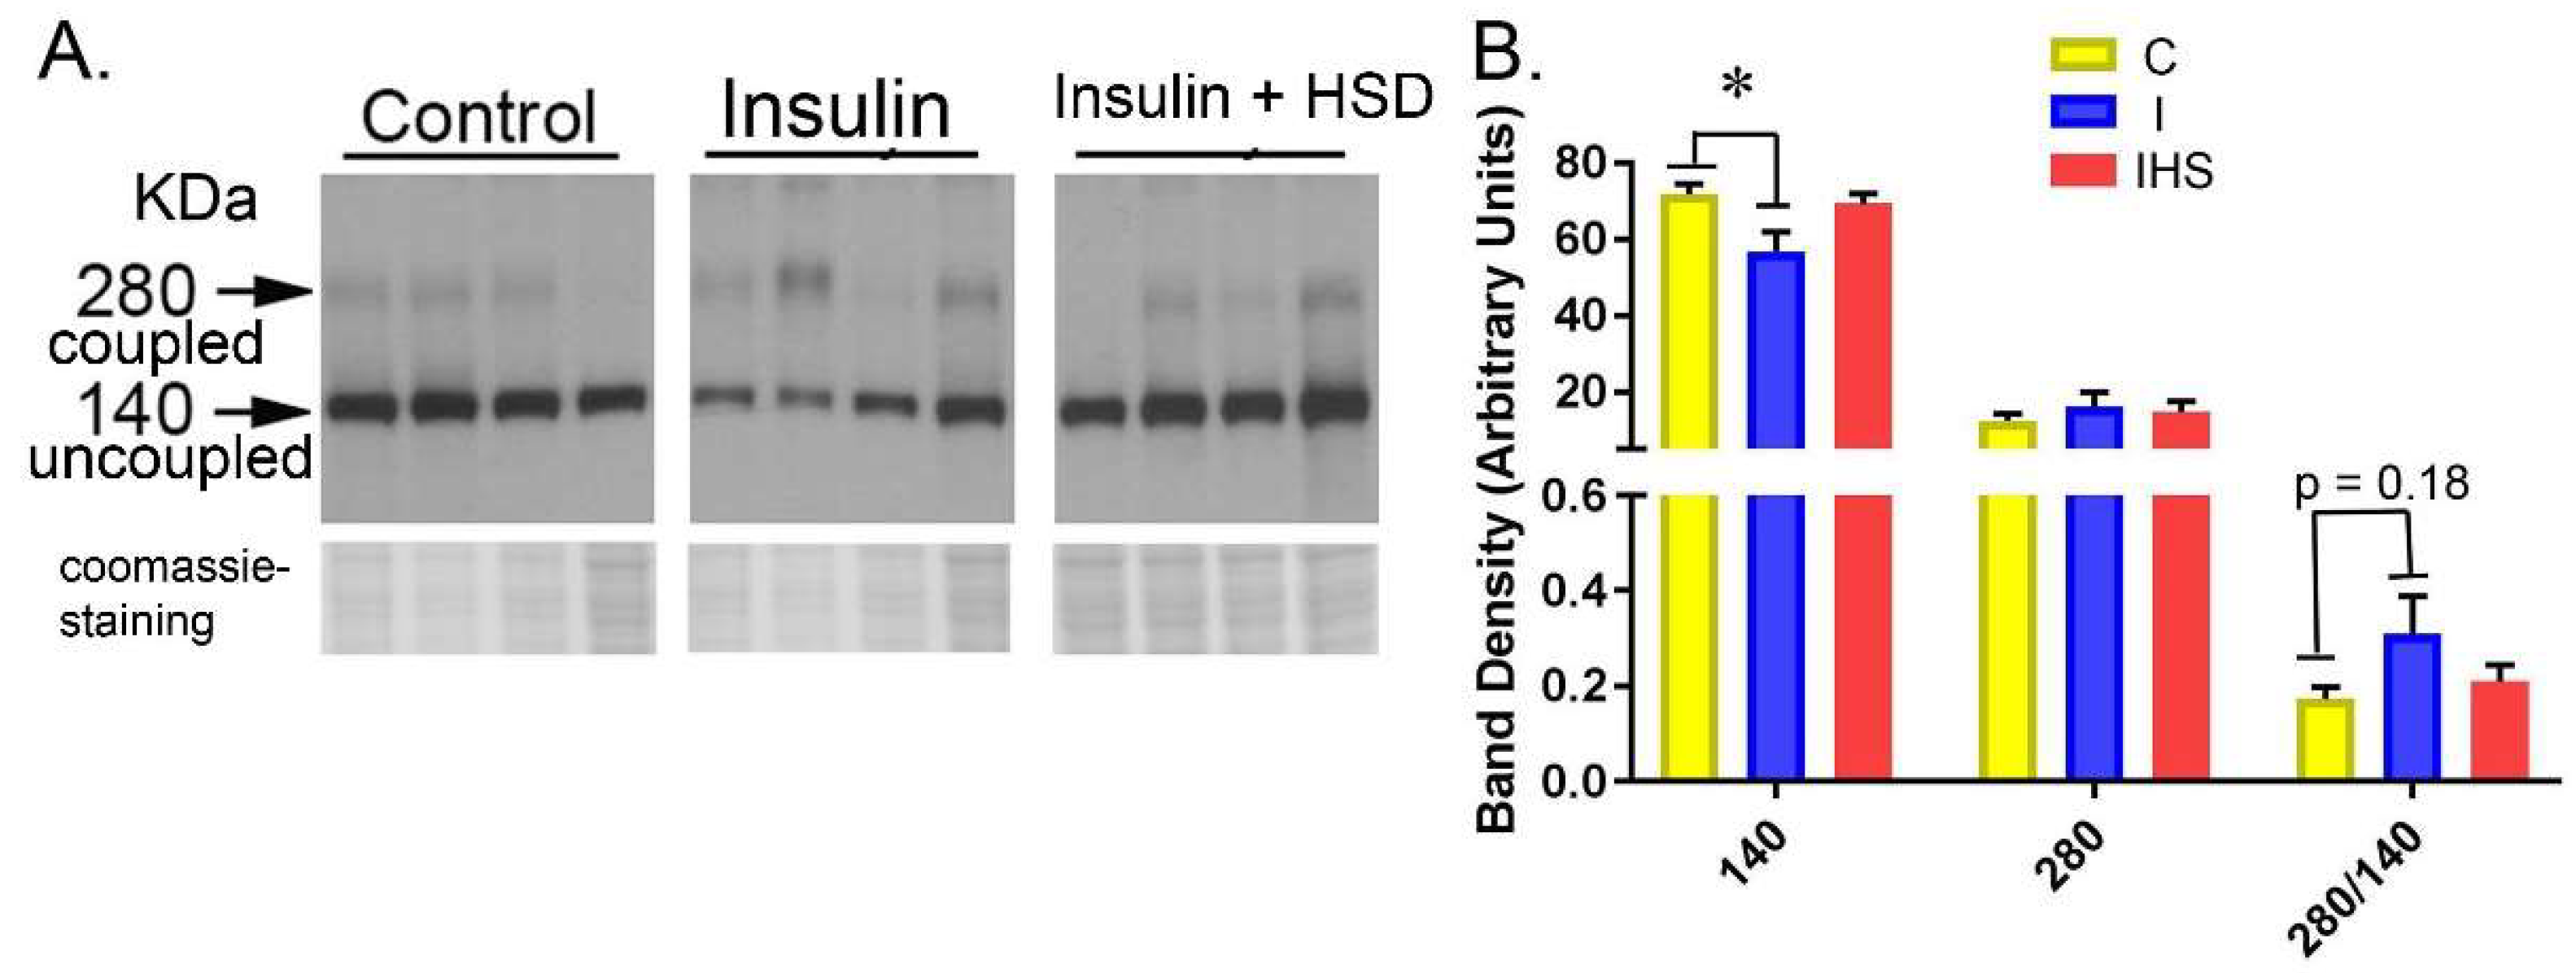
2.6. Kidney eNOS Protein
3. Discussion
4. Materials and Methods
4.1. Animal Protocols
4.2. Radiotelemetry
4.3. Blood, Plasma, and Urine Analysis
4.4. Western Blotting
4.5. Nitric Oxide Synthase (NOS) and Arginase Activity
4.6. Statistics
Author Contributions
Funding
Acknowledgments
Conflicts of Interest
References
- Brands, M.W.; Hildebrandt, D.A.; Mizelle, H.L.; Hall, J.E. Sustained hyperinsulinemia increases arterial pressure in conscious rats. Am. J. Physiol. 1991, 260, R764–R768. [Google Scholar] [CrossRef] [PubMed]
- Brands, M.W.; Hildebrandt, D.A.; Mizelle, H.L.; Hall, J.E. Hypertension during chronic hyperinsulinemia in rats is not salt-sensitive. Hypertension 1992, 19, I83–I89. [Google Scholar] [CrossRef] [PubMed]
- Hall, J.E.; Brands, M.W.; Mizelle, H.L.; Gaillard, C.A.; Hildebrandt, D.A. Chronic intrarenal hyperinsulinemia does not cause hypertension. Am. J. Physiol. 1991, 260, F663–F669. [Google Scholar] [CrossRef] [PubMed]
- Song, J.; Hu, X.; Riazi, S.; Tiwari, S.; Wade, J.B.; Ecelbarger, C.A. Regulation of blood pressure, the epithelial sodium channel (ENaC), and other key renal sodium transporters by chronic insulin infusion in rats. Am. J. Physiol. Renal Physiol. 2006, 290, F1055–F1064. [Google Scholar] [CrossRef] [PubMed]
- Pandey, G.; Makhija, E.; George, N.; Chakravarti, B.; Godbole, M.M.; Ecelbarger, C.M.; Tiwari, S. Insulin regulates nitric oxide production in the kidney collecting duct cells. J. Biol. Chem. 2015, 290, 5582–5591. [Google Scholar] [CrossRef] [PubMed]
- Tiwari, S.; Sharma, N.; Gill, P.S.; Igarashi, P.; Kahn, C.R.; Wade, J.B.; Ecelbarger, C.M. Impaired sodium excretion and increased blood pressure in mice with targeted deletion of renal epithelial insulin receptor. Proc. Natl. Acad. Sci. USA 2008, 105, 6469–6474. [Google Scholar] [CrossRef] [PubMed] [Green Version]
- Li, L.; Garikepati, R.M.; Tsukerman, S.; Kohan, D.; Wade, J.B.; Tiwari, S.; Ecelbarger, C.M. Reduced ENaC activity and blood pressure in mice with genetic knockout of the insulin receptor in the renal collecting duct. Am. J. Physiol. Renal Physiol. 2013, 304, F279–F288. [Google Scholar] [CrossRef] [PubMed]
- Gonzalez-Rodriguez, E.; Gaeggeler, H.P.; Rossier, B.C. IGF-1 vs insulin: Respective roles in modulating sodium transport via the PI-3 kinase/Sgk1 pathway in a cortical collecting duct cell line. Kidney Int. 2007, 71, 116–125. [Google Scholar] [CrossRef] [PubMed]
- Staruschenko, A.; Pochynyuk, O.; Vandewalle, A.; Bugaj, V.; Stockand, J.D. Acute regulation of the epithelial Na+ channel by phosphatidylinositide 3-OH kinase signaling in native collecting duct principal cells. J. Am. Soc. Nephrol. 2007, 18, 1652–1661. [Google Scholar] [CrossRef] [PubMed]
- Brands, M.W.; Harrison, D.L.; Keen, H.L.; Gardner, A.; Shek, E.W.; Hall, J.E. Insulin-induced hypertension in rats depends on an intact renin-angiotensin system. Hypertension 1997, 29, 1014–1019. [Google Scholar] [CrossRef] [PubMed]
- Artunc, F.; Schleicher, E.; Weigert, C.; Fritsche, A.; Stefan, N.; Häring, H.U. The impact of insulin resistance on the kidney and vasculature. Nat. Rev. Nephrol. 2016, 12, 721–737. [Google Scholar] [CrossRef] [PubMed]
- Wu, F.; Park, F.; Cowley, A.W., Jr.; Mattson, D.L. Quantification of nitric oxide synthase activity in microdissected segments of the rat kidney. Am. J. Physiol. 1999, 276, F874–F881. [Google Scholar] [CrossRef] [PubMed]
- Fulton, D.; Gratton, J.P.; McCabe, T.J.; Fontana, J.; Fujio, Y.; Walsh, K.; Franke, T.F.; Papapetropoulos, A.; Sessa, W.C. Regulation of endothelium-derived nitric oxide production by the protein kinase Akt. Nature 1999, 399, 597–601. [Google Scholar] [CrossRef] [PubMed]
- Fisslthaler, B.; Loot, A.E.; Mohamed, A.; Busse, R.; Fleming, I. Inhibition of endothelial nitric oxide synthase activity by proline-rich tyrosine kinase 2 in response to fluid shear stress and insulin. Circ. Res. 2008, 102, 1520–1528. [Google Scholar] [CrossRef] [PubMed]
- Siragusa, M.; Fleming, I. The eNOS signalosome and its link to endothelial dysfunction. Pflugers Arch. 2016, 468, 1125–1137. [Google Scholar] [CrossRef] [PubMed]
- Denvir, J.; Boskovic, G.; Fan, J.; Primerano, D.A.; Parkman, J.K.; Kim, J.H. Whole genome sequence analysis of the TALLYHO/Jng mouse. BMC Genomics 2016, 17, 907. [Google Scholar] [CrossRef] [PubMed]
- Sechi, L.A.; Bartoli, E. Molecular mechanisms of insulin resistance in arterial hypertension. Blood Press. Suppl. 1996, 1, 47–54. [Google Scholar] [PubMed]
- Catena, C.; Giacchetti, G.; Novello, M.; Colussi, G.; Cavarape, A.; Sechi, L.A. Cellular mechanisms of insulin resistance in rats with fructose-induced hypertension. Am. J. Hypertens. 2003, 16, 973–978. [Google Scholar] [CrossRef]
- Muntzel, M.S.; Crespo, R.; Joseph, T.; Onwumere, O. Dietary salt loading exacerbates the increase in sympathetic nerve activity caused by intravenous insulin infusion in rats. Metabolism 2007, 56, 373–379. [Google Scholar] [CrossRef] [PubMed]
- Hall, J.E.; do Carmo, J.M.; da Silva, A.A.; Wang, Z.; Hall, M.E. Obesity-induced hypertension: Interaction of neurohumoral and renal mechanisms. Circ. Res. 2015, 116, 991–1006. [Google Scholar] [CrossRef] [PubMed]
- Brands, M.W.; Manhiani, M.M. Sodium-retaining effect of insulin in diabetes. Am. J. Physiol. Regul. Integr. Comp. Physiol. 2012, 303, R1101–R1109. [Google Scholar] [CrossRef] [PubMed] [Green Version]
- Kim, J.H.; Saxton, A.M. The TALLYHO mouse as a model of human type 2 diabetes. Methods Mol. Biol. 2012, 933, 75–87. [Google Scholar] [PubMed]
- Salvetti, A.; Brogi, G.; Di Legge, V.; Bernini, G.P. The inter-relationship between insulin resistance and hypertension. Drugs 1993, 46 (Suppl. 2), 149–159. [Google Scholar] [CrossRef] [PubMed]
- Liu, M.; Takahashi, H.; Morita, Y.; Maruyama, S.; Mizuno, M.; Yuzawa, Y.; Watanabe, M.; Toriyama, T.; Kawahara, H.; Matsuo, S. Non-dipping is a potent predictor of cardiovascular mortality and is associated with autonomic dysfunction in haemodialysis patients. Nephrol. Dial. Transplant. 2003, 18, 563–569. [Google Scholar] [CrossRef] [PubMed] [Green Version]
- Ford, E.S.; Giles, W.H.; Dietz, W.H. Prevalence of the metabolic syndrome among US adults: Findings from the third National Health and Nutrition Examination Survey. JAMA 2002, 287, 356–359. [Google Scholar] [CrossRef] [PubMed]
- Horita, S.; Seki, G.; Yamada, H.; Suzuki, M.; Koike, K.; Fujita, T. Insulin resistance, obesity, hypertension, and renal sodium transport. Int. J. Hypertens. 2011, 2011, 391762. [Google Scholar] [CrossRef] [PubMed]
- Tomiyama, H.; Motobe, K.; Zaydun, G.; Koji, Y.; Yambe, M.; Arai, T.; Kushiro, T.; Yamashina, A. Insulin sensitivity and endothelial function in hypertension: A comparison of temocapril and candesartan. Am. J. Hypertens. 2005, 18, 178–182. [Google Scholar] [CrossRef] [PubMed]
- Kina-Tanada, M.; Sakanashi, M.; Tanimoto, A.; Kaname, T.; Matsuzaki, T.; Noguchi, K.; Uchida, T.; Nakasone, J.; Kozuka, C.; Ishida, M.; et al. Long-term dietary nitrite and nitrate deficiency causes the metabolic syndrome, endothelial dysfunction and cardiovascular death in mice. Diabetologia 2017, 60, 1138–1151. [Google Scholar] [CrossRef] [PubMed] [Green Version]
- Park, K.; Li, Q.; Evcimen, N.D.; Rask-Madsen, C.; Maeda, Y.; Maddaloni, E.; Yokomizo, H.; Shinjo, T.; St-Louis, R.; Fu, J.; et al. Exogenous Insulin Infusion Can Decrease Atherosclerosis in Diabetic Rodents by Improving Lipids, Inflammation, and Endothelial Function. Arterioscler. Thromb. Vasc. Biol. 2018, 38, 92–101. [Google Scholar] [CrossRef] [PubMed]
- Rafikov, R.; Fonseca, F.V.; Kumar, S.; Pardo, D.; Darragh, C.; Elms, S.; Fulton, D.; Black, S.M. eNOS activation and NO function: Structural motifs responsible for the posttranslational control of endothelial nitric oxide synthase activity. J. Endocrinol. 2011, 210, 271–284. [Google Scholar] [CrossRef] [PubMed] [Green Version]
- Wilcox, C.S.; Deng, X.; Welch, W.J. NO generation and action during changes in salt intake: Roles of nNOS and macula densa. Am. J. Physiol. 1998, 274, R1588–R1593. [Google Scholar] [CrossRef] [PubMed]
- Chen, G.D.; Zhang, J.L.; Chen, Y.T.; Zhang, J.X.; Wang, T.; Zeng, Q.Y. Insulin alleviates mitochondrial oxidative stress involving upregulation of superoxide dismutase 2 and uncoupling protein 2 in septic acute kidney injury. Exp. Ther. Med. 2018, 15, 3967–3975. [Google Scholar] [CrossRef] [PubMed]
- Pudlo, M.; Demougeot, C.; Girard-Thernier, C. Arginase Inhibitors: A Rational Approach Over One Century. Med. Res. Rev. 2017, 37, 475–513. [Google Scholar] [CrossRef] [PubMed]
- Abramowitz, M.K.; Hostetter, T.H.; Melamed, M.L. Lower serum bicarbonate and a higher anion gap are associated with lower cardiorespiratory fitness in young adults. Kidney Int. 2012, 81, 1033–1042. [Google Scholar] [CrossRef] [PubMed] [Green Version]
- Tiwari, S.; Nordquist, L.; Halagappa, V.K.; Ecelbarger, C.A. Trafficking of ENaC subunits in response to acute insulin in mouse kidney. Am. J. Physiol. Renal Physiol. 2007, 293, F178–F185. [Google Scholar] [CrossRef] [PubMed]


| Blood Chemistry ¥ | ||||
|---|---|---|---|---|
| Parameter | Control | Insulin | Insulin + HSD | One-Way ANOVA p-Value |
| Insulin (nM) | 0.66 ± 0.23 | 2.37 ± 0.54 | 2.58 ± 0.56 | 0.015 |
| Na+ (mM) | 144 ± 0.7 | 149 ± 1.9 * | 146 ± 0.6 | 0.030 |
| K+ (mM) | 4.6 ± 0.1 | 4.6 ± 0.2 | 4.4 ± 0.2 | 0.64 |
| Cl− (mM) | 116 ± 0.9 | 115 ± 0.8 | 112 ± 0.7 † | 0.012 |
| TCO2 (mM) | 31.8 ± 0.9 | 27.8 ± 1.8 | 31.6 ± 0.8 | 0.058 |
| BUN (mg/dL) | 21.3 ± 0.7 | 6.9 ± 0.8 * | 7.4 ± 0.7 * | <0.0001 |
| Glucose (mg/dL) | 201 ± 6 | 254 ± 36 | 226 ± 24 | 0.33 |
| Hct (%) | 31.9 ± 0.7 | 32.9 ± 0.8 | 33.9 ± 0.9 | 0.10 |
| pH(−log10 [H+]) | 7.24 ± 0.02 | 7.11 ± 0.05 * | 7.19 ± 0.01 | 0.027 |
| HCO3− (mM) | 29.6 ± 0.9 | 25.4 ± 2.2 | 29.4 ± 0.9 | 0.10 |
| Beecf (mM) | 2.16 ± 1.24 | −4.10 ± 3.12 | 1.18 ± 1.08 | 0.066 |
| AnGap (mM) | 3.25 ± 1.73 | 14.0± 3.8 * | 8.64 ± 1.15 | 0.02 |
| Hb (g/dL) | 10.8 ± 0.2 | 11.2 ± 0.2 | 11.5 ± 0.3 | 0.20 |
© 2018 by the authors. Licensee MDPI, Basel, Switzerland. This article is an open access article distributed under the terms and conditions of the Creative Commons Attribution (CC BY) license (http://creativecommons.org/licenses/by/4.0/).
Share and Cite
Fluitt, M.B.; Rizvi, S.; Li, L.; Alunan, A.; Lee, H.; Tiwari, S.; Ecelbarger, C.M. Chronic Insulin Infusion Down-Regulates Circulating and Urinary Nitric Oxide (NO) Levels Despite Molecular Changes in the Kidney Predicting Greater Endothelial NO Synthase Activity in Mice. Int. J. Mol. Sci. 2018, 19, 2880. https://doi.org/10.3390/ijms19102880
Fluitt MB, Rizvi S, Li L, Alunan A, Lee H, Tiwari S, Ecelbarger CM. Chronic Insulin Infusion Down-Regulates Circulating and Urinary Nitric Oxide (NO) Levels Despite Molecular Changes in the Kidney Predicting Greater Endothelial NO Synthase Activity in Mice. International Journal of Molecular Sciences. 2018; 19(10):2880. https://doi.org/10.3390/ijms19102880
Chicago/Turabian StyleFluitt, Maurice B., Sophia Rizvi, Lijun Li, Ashley Alunan, Hwal Lee, Swasti Tiwari, and Carolyn M. Ecelbarger. 2018. "Chronic Insulin Infusion Down-Regulates Circulating and Urinary Nitric Oxide (NO) Levels Despite Molecular Changes in the Kidney Predicting Greater Endothelial NO Synthase Activity in Mice" International Journal of Molecular Sciences 19, no. 10: 2880. https://doi.org/10.3390/ijms19102880