Article

Proteomic Analysis and Identification of Possible Allergenic Proteins in Mature Pollen of Populus tomentosa

1
State Key Laboratory of Tree Genetics and Breeding, Key Laboratory of Tree Breeding and Cultivation of the State Forestry Administration, Research Institute of Forestry, Chinese Academy of Forestry, Beijing 100091, China
2
Co-Innovation Center for Sustainable Forestry in Southern China, Nanjing Forestry University, Nanjing 210037, China
*
Author to whom correspondence should be addressed.
These authors contributed equally to this work.
Int. J. Mol. Sci. 2018, 19(1), 250; https://doi.org/10.3390/ijms19010250
Submission received: 26 November 2017 / Revised: 27 December 2017 / Accepted: 9 January 2018 / Published: 16 January 2018
(This article belongs to the Section Molecular Plant Sciences)

Abstract

:
Pollen grains from Populus tomentosa, a widely cultivated tree in northern area of China, are considered to be an important aeroallergen causing severe allergic diseases. To gain insight into their allergenic components, mature Populus tomentosa pollen proteins were analyzed by two-dimensional gel electrophoresis (2-DE) and matrix-assisted laser desorption/ionization-time of flight mass spectrometry (MALDI-TOF/TOF MS). A total of 412 spots from mature pollen were resolved on pH 4–7 immobilized pH gradient (IPG) strips and 159 distinct proteins were identified from 242 spots analyzed. The identified proteins were categorized based on their functional role in the pollen, which included proteins involved in energy regulation, protein fate, protein synthesis and processing, metabolism, defense/stress responses, development and other functional categories. Moreover, among the identified proteins, 27 proteins were identified as putative allergens using the Structural Database of Allergenic Proteins (SDAP) tool and Allergen Online. The expression patterns of these putative allergen genes indicate that several of these genes are highly expressed in pollen. The identified putative allergens have the potential to improve specific diagnosis and can be used to develop vaccines for immunotherapy against poplar pollen allergy.

1. Introduction

Pollen grains are the dispersal agents of sperm cells and play a vital role in sexual reproduction of higher plants. After release from an anther, pollen grains are carried by wind, insects and other agents to the stigma of a carpel, with the primary function of delivering sperm cells to the female gametophyte via the formation of a pollen tube, and subsequent seed and fruit production [1,2]. During the development of pollen, microsporogenesis and microgametogenesis, a large number of genes are coordinated and expressed in different tissues of an anther with designated roles in cell signaling, cytoskeleton formation, cell wall metabolism and vesicle transport [3,4]. Pollen grains have proteins from 2.5% to 61% by dry mass and some of those proteins act as allergens upon inhalation [5]. To date, a large amount of information on pollen allergens in diverse plant species can be found in allergen databases such as the Allergome [6] or Structural Database of Allergenic Proteins (SDAP) [7]. However, pollen allergens are restricted to few protein families and show distinct patterns of species distribution; the major pollen allergen families are composed of profilins, expansins and calcium-binding proteins [8]. In recent years, the incidence and prevalence of pollen allergy has increased worldwide, with deleterious implications for health, such as asthma and allergic rhinitis in sensitized subjects [9,10].
With the completion of many plant species genome sequences and availability of comprehensive public sequence databases, proteomics investigations of pollen have developed rapidly. For example, Dai et al. [11] identified several novel proteins in rice pollen that may be involved in signal transduction, protein synthesis, assembly and degradation, and wall remodeling and metabolism. Proteomic analysis of tomato pollen showed that many of the identified proteins have designated roles in defense mechanisms, energy conversion, pollen germination, and pollen tube growth, and some possibly in sperm cell formation [2]. More recently, Zou et al. [12] reported comparative proteomic analysis of Arabidopsis mature pollen and germinated pollen, and indicated some differentially expressed proteins that are mainly involved in different cellular and metabolic processes, including cell signaling, cellular structure, transport, defense/stress responses, transcription, metabolism and energy production.
In recent years, proteomic technologies have been increasingly employed in the field of allergy, allowing the identification of new allergens by using two-dimensional gel electrophoresis (2-DE) coupled with mass spectrometry (MS) [13,14]. For instance, Akagawa et al. [15] identified flour wheat allergens (serine protease inhibitors (serpin), α-amylase inhibitor, ç-gliadin and low-molecular-weight (LMW) glutenin) and their sequentially homologous proteins as major IgE (Immunoglobulin E)-binding proteins using the allergenomic approach. Mani et al. [14] first identified seven IgE-reactive proteins from L. lucidum pollen by 2-DE immunoblotting and MS. Cocos nucifera (Coconut) pollen proteins were analyzed and within them were identified 12 allergenic proteins by 2-DE, immunoblotted with coconut pollen sensitive patient sera followed by mass spectrometry of IgE-reactive proteins [16]. In addition, Saha et al. [17] first identified ten novel allergens in Phoenix sylvestris pollen using de novo sequencing and homology-based proteomics technologies.
The genus Populus contains approximately 30 species of woody plants and is widely distributed in the Northern hemisphere and is exhibiting some of the fastest growth rates observed for trees growing in temperate climates [18]. In spring, Populus releases large amounts of pollens and these pollens are considered to be an important aeroallergen causing severe allergic diseases in an increasing percentage of hypersensitive individuals. However, research on poplar pollen allergy is limited to its clinical manifestations and basic immunochemical studies. Populus tomentosa is a poplar species and is widely cultivated in northern area of China for shelterbelts and urban afforestation. To understand the allergenic composition and obtain information about allergens from P. tomentosa pollen, we isolated the total protein from mature pollen using the trichloroacetic acid and acetone (TCA-A) method and identified candidate allergenic proteins by 2-DE and MS. Furthermore, the expression patterns of the identified possible allergenic proteins were analyzed in the different tissues. As far as we know, this is the first report of comprehensive proteomic analysis and possible allergenic proteins in mature pollen of P. tomentosa.

2. Results and Discussion

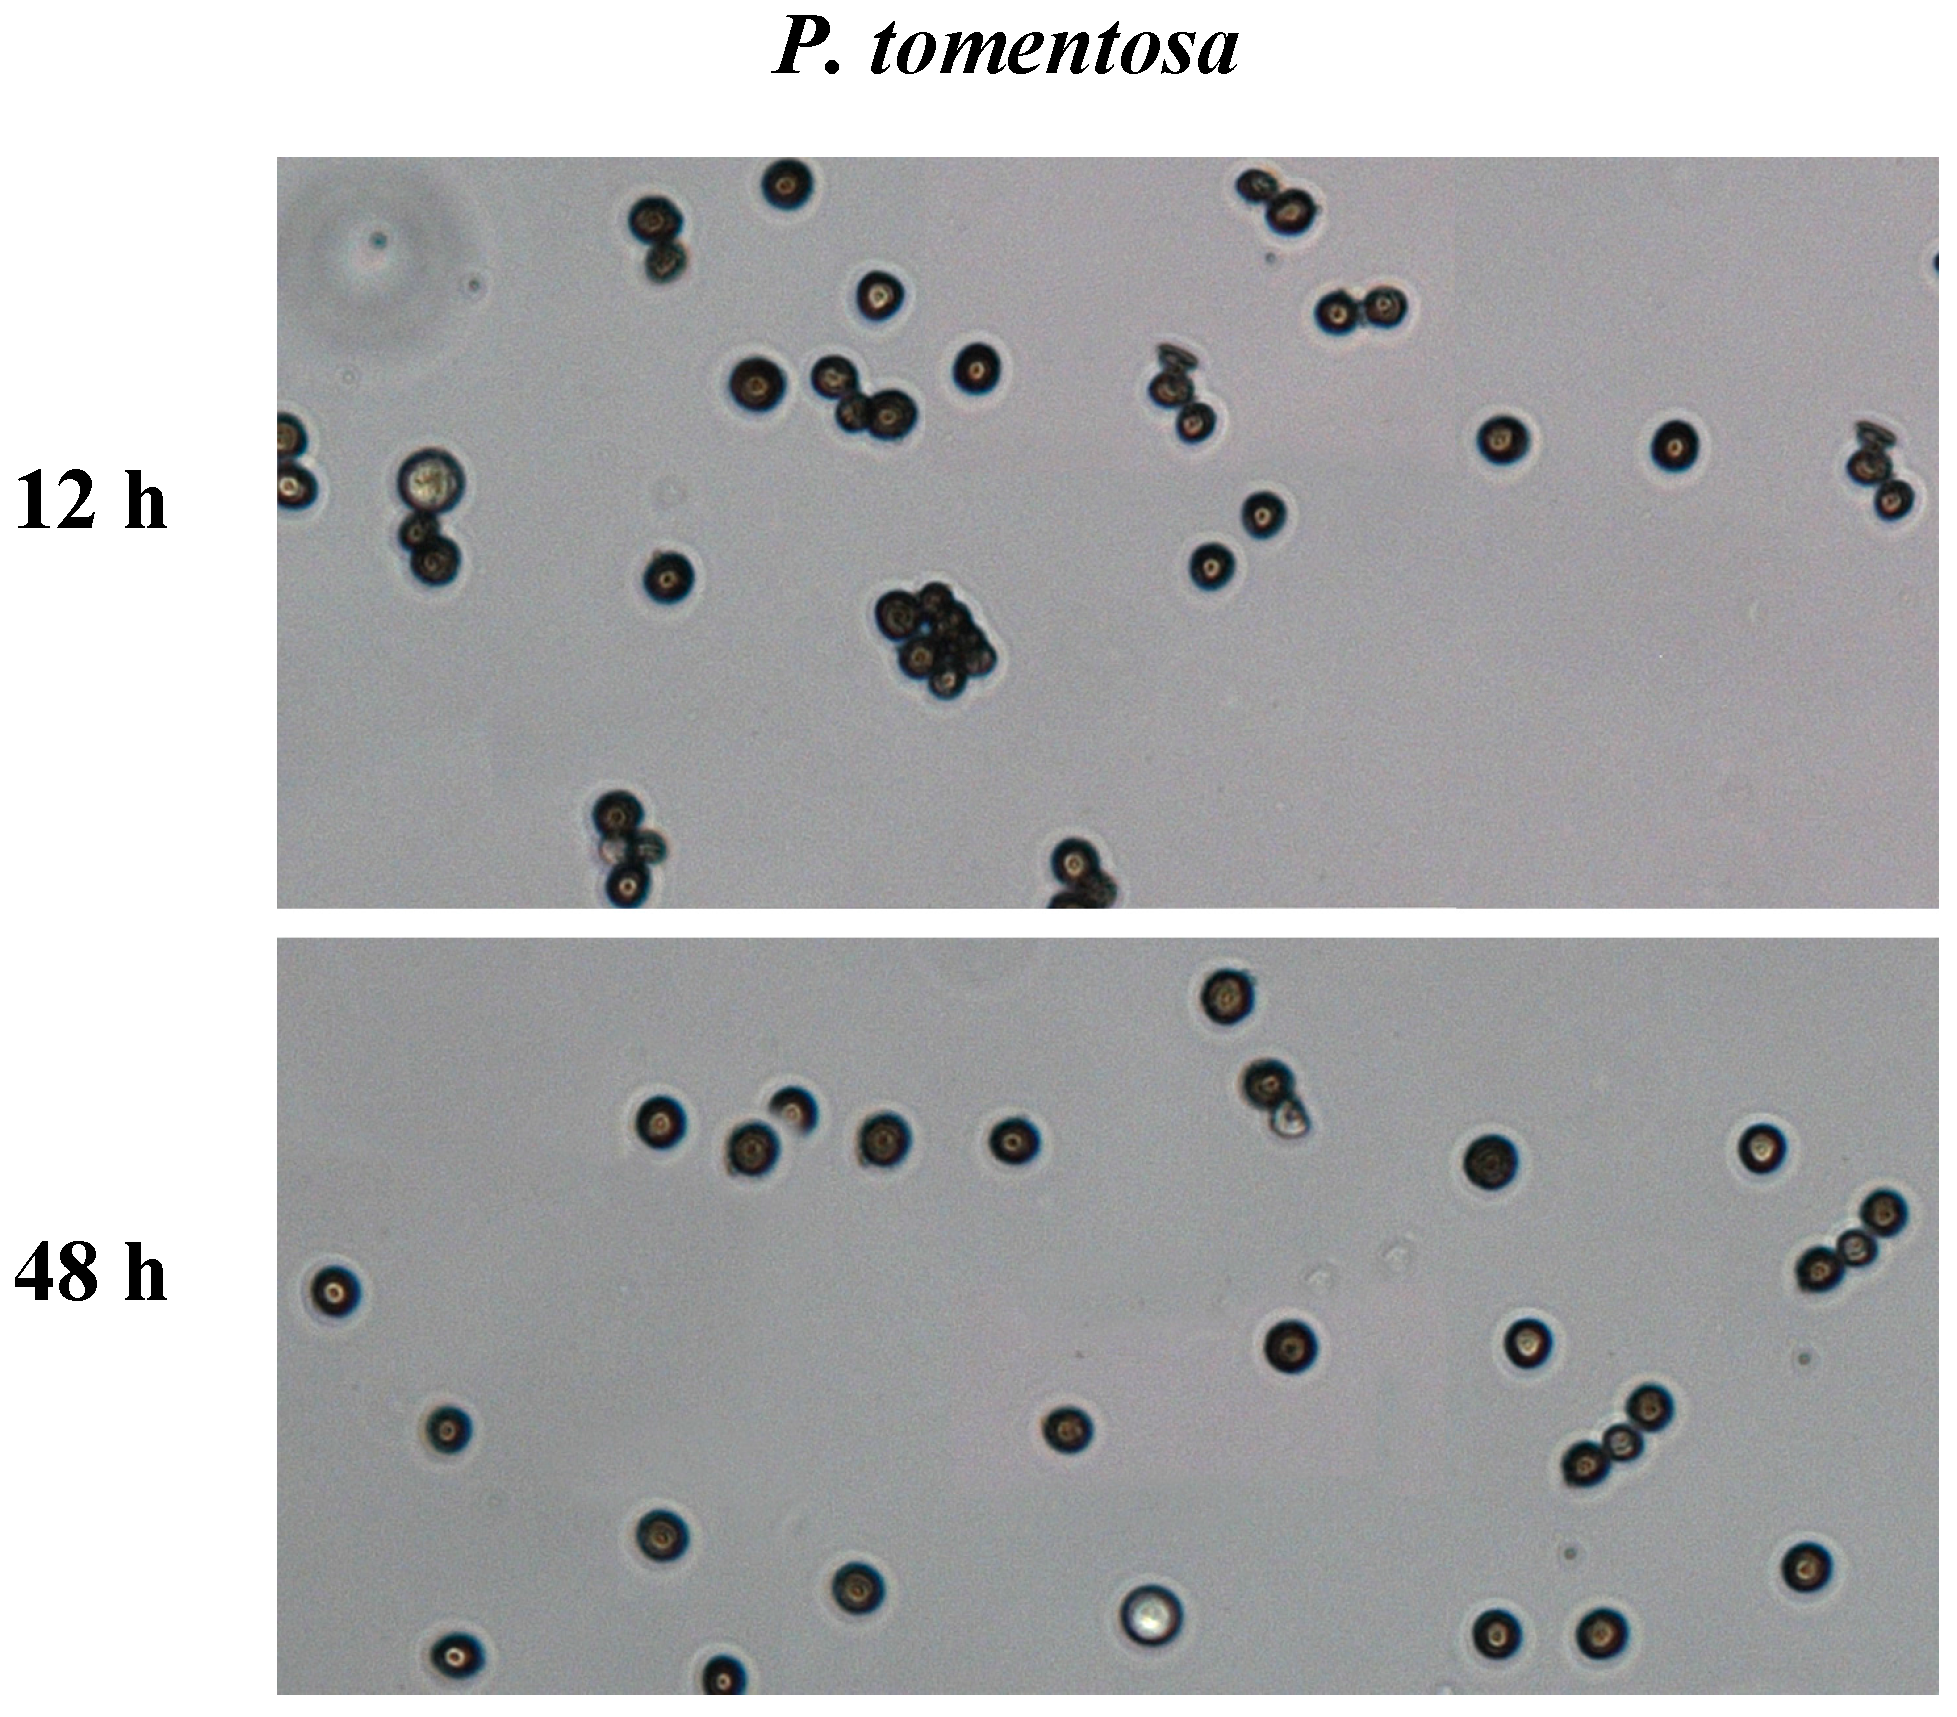
2.1. In Vitro Pollen Germination

Mature pollen grains were harvested from P. tomentosa and sowed on dishes containing liquid germination medium using the “thin liquid layer” germination method. At the same time, the pollen of triploid poplar ‘ZhongHuai1’ (‘ZH1’) and diploid poplar ‘ZhongHuai2’ (‘ZH2’) were conducted in parallel. The pollen of ‘ZH2’ began to germinate after 2 h cultivation and the germination rate was increased with the extending of incubation time. After incubation at 21 °C for 48 h, over 88% pollen of diploid ‘ZH2’ was germinated, while all of the pollen of triploid ‘ZH1’ was not germinated [19]. Consistent with the pollen of triploid ‘ZH1’, the mature pollen grains of P. tomentosa were not germinated at all, indicating that the fast-growing triploid of P. tomentosa is sterile (Figure 1).

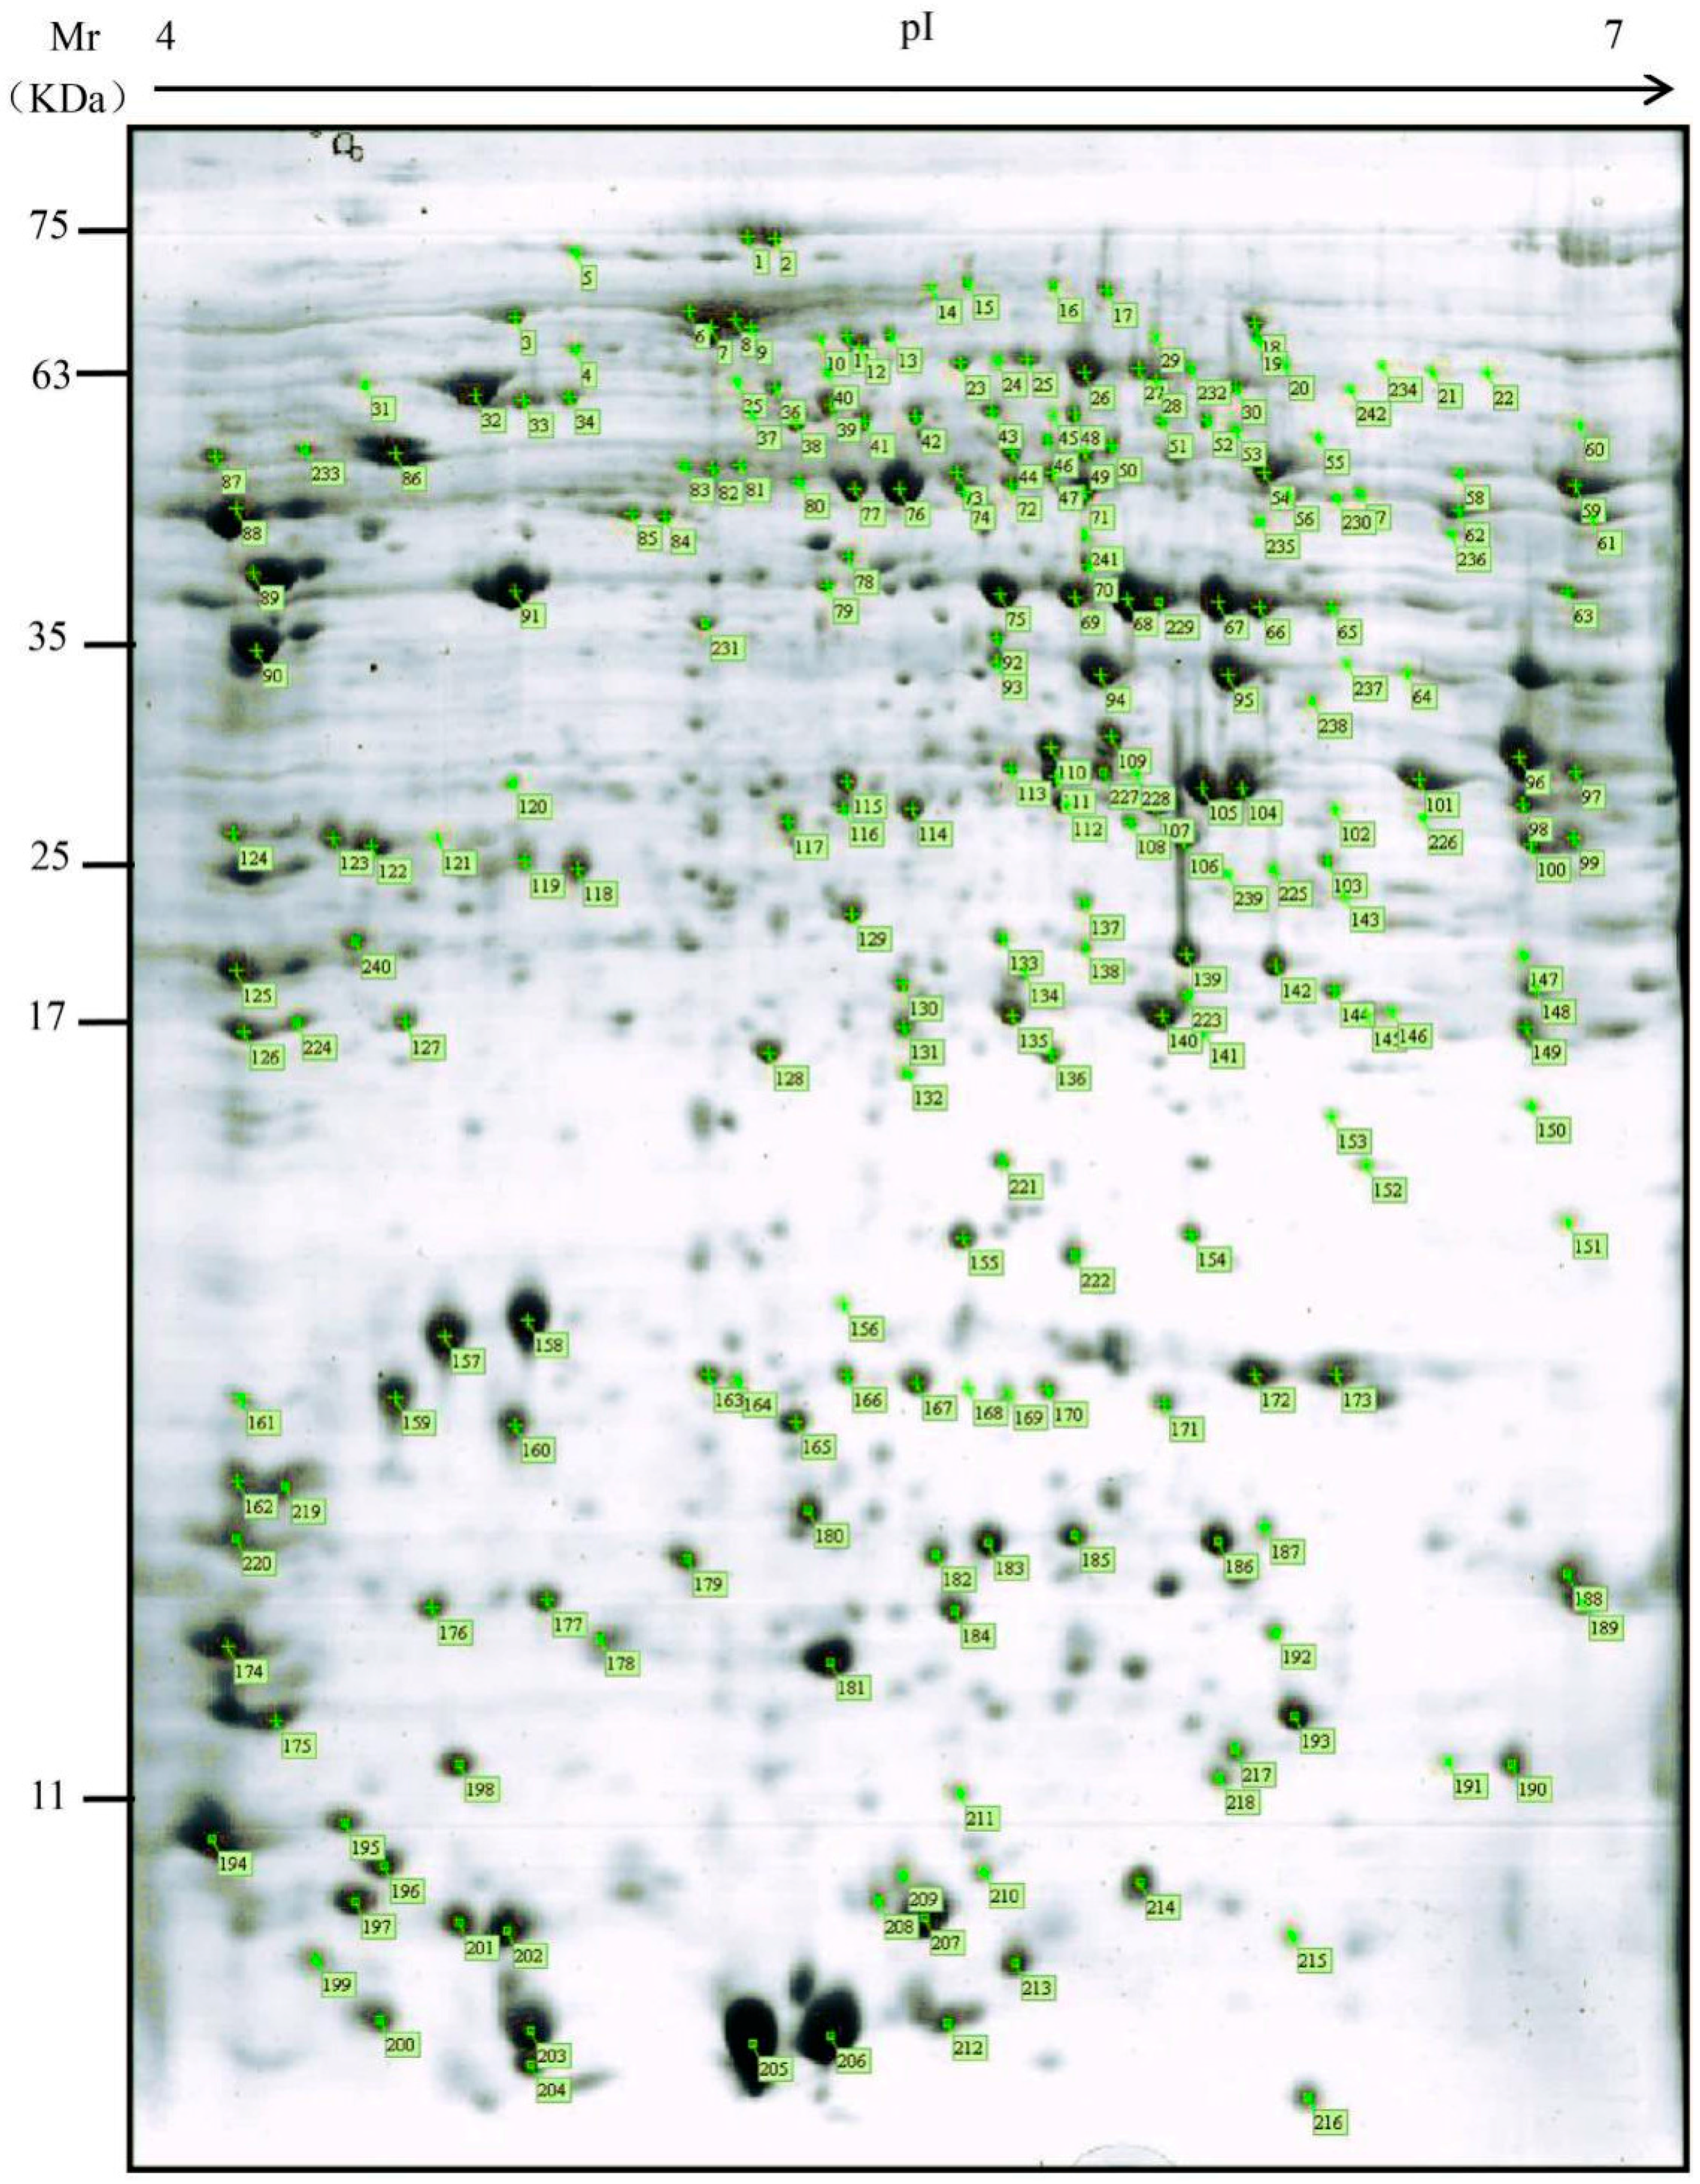
2.2. Proteomic Maps of P. tomentosa Mature Pollen

Total proteins extracted from mature P. tomentosa pollen were subjected to 2-DE stained with CCB using pH 4–7 IPG strips, then the 2-DE gels were aligned and matched. A total of 412 reproducible protein spots were detected in the gels and were resolved at the molecular weight (MW) range from 5 to 120 kDa and isoelectric point (pI) values range from 4 to 7 (Figure 2). All detected protein spots were processed by automated in gel tryptic digestion and MALDI-TOF/TOF MS/MS analysis. 242 protein spots, representing 159 different proteins, were subjected to BLAST against the Populus trichocarpa proteome (v3.0), which was downloaded from the Phytozome 10.3.1 website [20] However, it is noted that there were 83 proteins associated with different spots. The calculated MW of the identified proteins ranged from approximately 8.94 to 199.37 kDa and pI values range from approximately 4.11 to 12.21, the PACid number and corresponding P. trichocarpa gene locus were also listed in Table S1. Most of them are close to the experimental data as judged from the location of the spots on the 2-DE gels. However, it should be noted that the identified proteins did not always have a one-to-one correlation with the spots on the gels and the deviations in molecular mass and pI, which may have resulted from a number of factors. For example, polypeptide variants that present in different spots on the gel, but encoded by the same gene, post-translational modification of the proteins in vivo (e.g., phosphorylation, glycosylation, acetylation, methylation or other groups) that do not significantly affect the MW of a protein but induce a pI shift on the protein spot on the gel [21,22,23], protein translation from alternatively spliced mRNAs [24], partial synthesis of proteins during pollen maturation [25] or chemical modification of the proteins during sample preparation.

2.3. Functional Classification of Identified Proteins

To assign functional information to the identified proteins, we classified them into functional categories according to the gene sequences and a homologic comparison with other known proteins [2,12,26]. The 242 identified proteins were classified into 12 different functional groups (Figure 3, Table S1). Approximately 70% of them were classified into four categories, including energy (23.14%), protein fate (17.77%), protein synthesis and processing (16.12%) and metabolism (12.39%), suggesting a special requirement of these categories of proteins for energy and general metabolism, such as protein synthesis, oxidative phosphorylation, carbohydrate metabolism and sugar metabolism. These proteins were also reported in rice and Arabidopsis pollen [1,11,23]. Although the presence of a high percentage of proteins related to energy metabolism correlates well with the large number of mitochondria observed in mature P. tomentosa pollen, it is well known that the pollen germination and tube growth are high-energy-requiring processes that require most of the proteins for these processes, the P. tomentosa mature pollen was not germinated. The other functional categories were defense/stress responses (7.02%), development (5.37%), cytoskeleton (2.07%), cell fate (2.07%), signal transduction (1.65%), transport (0.83%), cell structure (0.41%) and unclassified proteins (11.16%). There were 27 proteins out of the 242 that could not be functionally classified as they were not observed to contain any known conserved domains.
In addition, gene ontology (GO) assignments were performed to functionally classify these proteins, which provide a dynamic, controlled vocabulary, and hierarchical relationships for the representation of information on the biological process, molecular function and cellular component (Figure 4). In terms of biological process, metabolic process (GO: 0008152, 88 proteins) was the most represented GO term, followed by cellular process (GO: 0009987, 76 proteins) and primary metabolic process (GO: 0044238, 59 proteins). In molecular function, proteins with catalytic activity (GO: 0003824, 77 proteins) and binding (GO: 0005488, 73 proteins) were highly represented. Regarding cellular component, the most represented categories were cell part (GO: 0044464, 38 proteins), cell (GO: 0005623, 38 proteins), intracellular (GO: 0005622, 35 proteins) and intracellular part (GO: 0044424, 33 proteins).

2.4. Prediction of Allergens in P. tomentosa Mature Pollen

Pollens are one of the leading causes of respiratory allergic sensitizations [27]. In spring, poplars release a lot of pollen that might cause the allergenic response. To date, many sequences and structures of pollen allergenic proteins have been characterized and restricted to few protein families [8]. They share common characteristics that contribute to their ability to bind IgE and trigger an allergic reaction [28]. To identify the potential allergen proteins in P. tomentosa mature pollen, the 242 identified proteins were predicted with SDAP tool and Allergen Online. SDAP is a web server that can provide rapid, cross-referenced access to the sequences, structures and IgE epitopes of allergenic proteins [7], and Allergen Online is a better and more frequently updated website. In this study, 27 proteins identified in poplar pollen were predicted as putative allergens (Table 1). For example, eleven heat shock protein 70 (Hsp70) (Spots 4, 5, 7, 8, 9, 10, 11, 12, 13, 21 and 31) and four small Hsps (spots 172, 173, 217 and 218) were identified as corresponding to allergenic molecules. Hsp70 have been demonstrated to bind to human IgE from allergenic patients to cystic echinococcosis [29], corn and barley [30], and antigenic cross-activity of Hsp70 with a 70 kDa component was proved by amino acid sequence alignment in Penicillium citrinum [31]. Class I small heat shock protein (Hsp) detected on a 2D gel have reported that it is one of allergens in soybean [32]. Spots 25, 49, 50, 53, 54, 59, 62, 71, 72, 222, 241 correspond to enolase. It is a ubiquitous glycolytic enzyme that was observed as highly conserved allergens from various fungi and latex, such as Cladosporium herbarum (Cla h 6), Alternaria alternate (Alt a 6), Curvularia lunata (rCur l 2) [33,34]. Spots 156, 159 and 160 were identified as pollen Ole e 1 allergen, which was a well characterized allergenic protein with the relevant (24–34%) homologous amino acid sequence among pollen proteins from maize, tomato, ryegrass, birch, rice, Arabidopsis etc., and was surmised to control pregermination and pollen tube emergence [35]. Spots 55 and 210 were identified as thioredoxin, which is known to act as a novel cross-reactive cereal allergen family that might contribute to the symptoms of baker’s asthma and might be related to grass pollen allergy [36]. Weichel et al. [36] identified wheat thioredoxin hB (Tri a 25) by screening a cDNA phage display library against immobilized serum IgE from 8 bakers with occupational asthma. It shared high homology with maize thioredoxin (ZmTRXh1 and ZmTRXh2) and human thioredoxin and included cross-reactive members that might be of relevance for patients occupationally exposed to inhalant allergens. Spot 197 and 202 respectively correspond to profilin 3 and 5. Profilins are ubiquitous proteins in the vegetal kingdom that act as pan-allergens, and are actin-binding proteins present in all eukaryotic cells. The family of profilin is one of the main causes of cross-reactivity between pollen and vegetable food [37], and their clinical allergenicity, albeit variable, is well recognized both in respiratory and food allergy [38]. Plant profilins present a highly conserved structure that provokes multiple positive sIgE responses in sensitized patients [39]. Spot 145 correspond to triosephosphate isomerase, which described as allergen in wheat, latex and lychee [40] and the remaining allergenic proteins predicted caused allergic reactions still need to be further studied. More importantly, the IgE antibody binding properties of these allergenic proteins should be analyzed using immunoblotting with sera from patients with pollen allergy. This could have confirmed the IgE recognition of the putative allergens as well as confirmed the cross-reactivity to pollen allergens from other species [40]. In our previous study, we identified 28 possible allergenic proteins in P. deltoides CL. ‘2KEN8’ [26]. Here, we compared the overlap of these candidate possible allergenic proteins between P. tomentosa and ‘2KEN8’ (Figure S1) and the results showed that 16 possible allergenic proteins were present in both P. tomentosa and ‘2KEN8’ mature pollen, such as Hsp, enolase, pollen Ole e 1, profilin and thioredoxin. In addition to the 16 allergenic proteins, they have 23 different putative allergens. These differences may be due to the methods of protein extraction, spot selection for analysis and the poplar species.

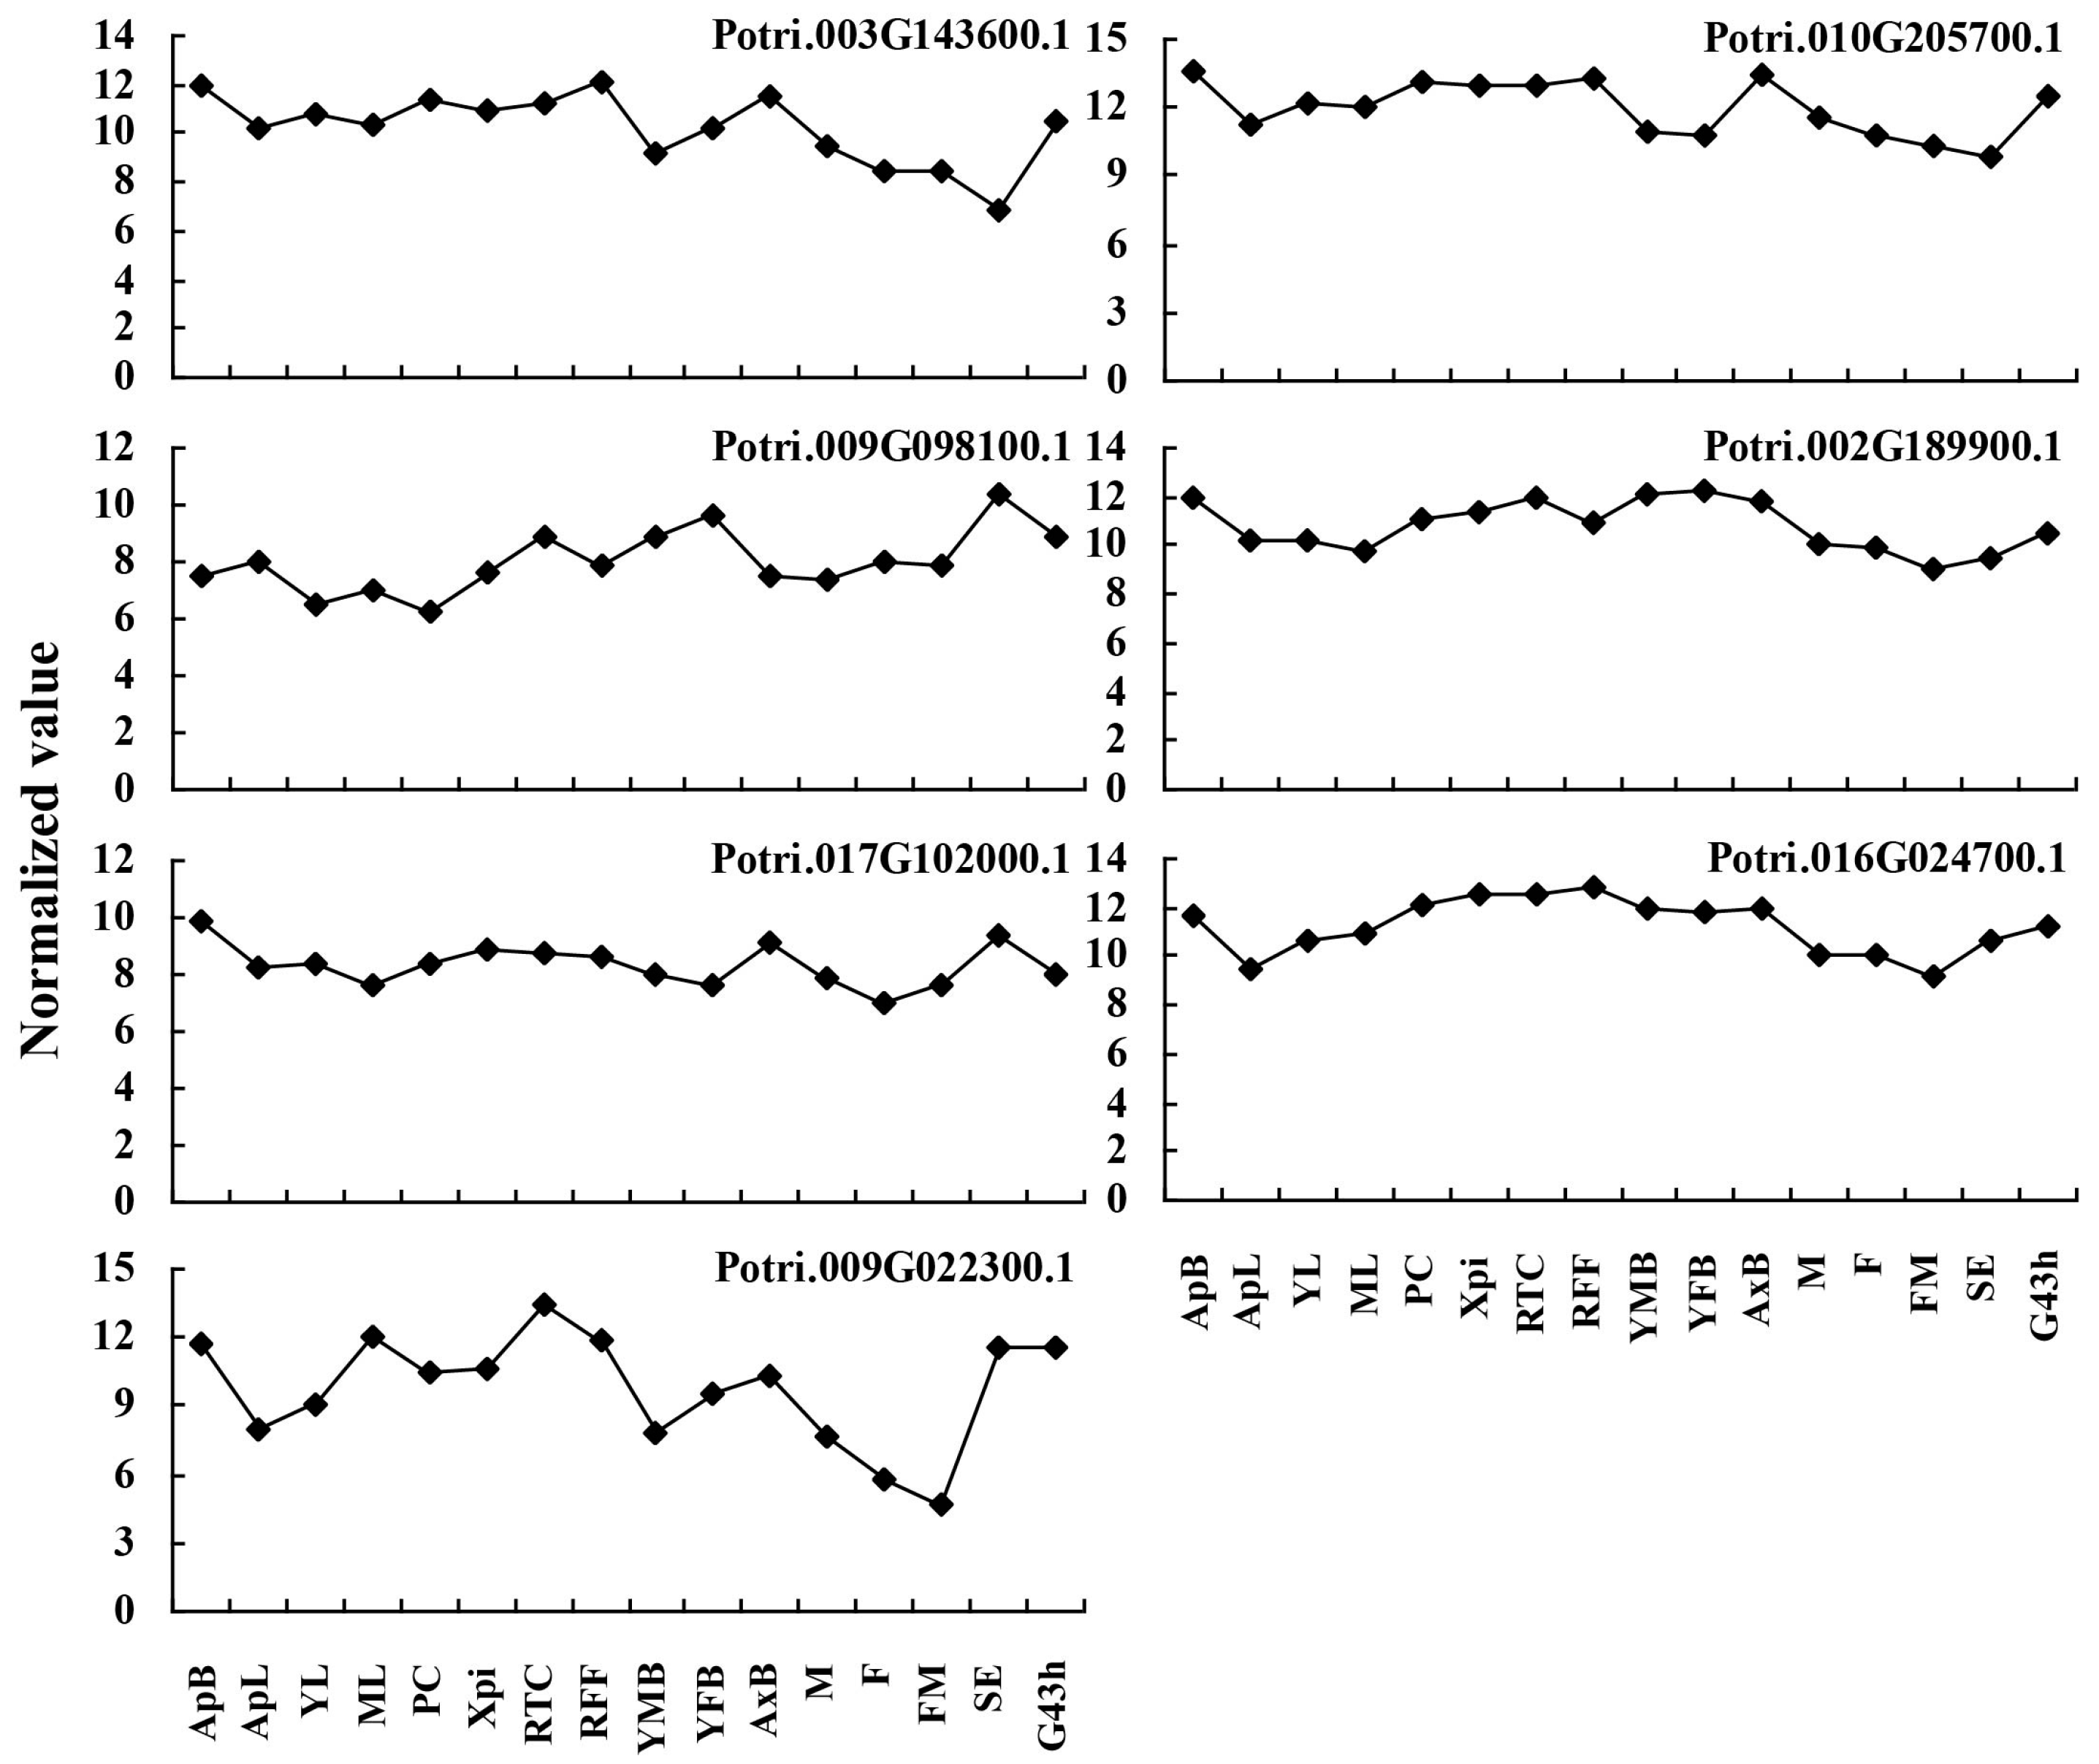
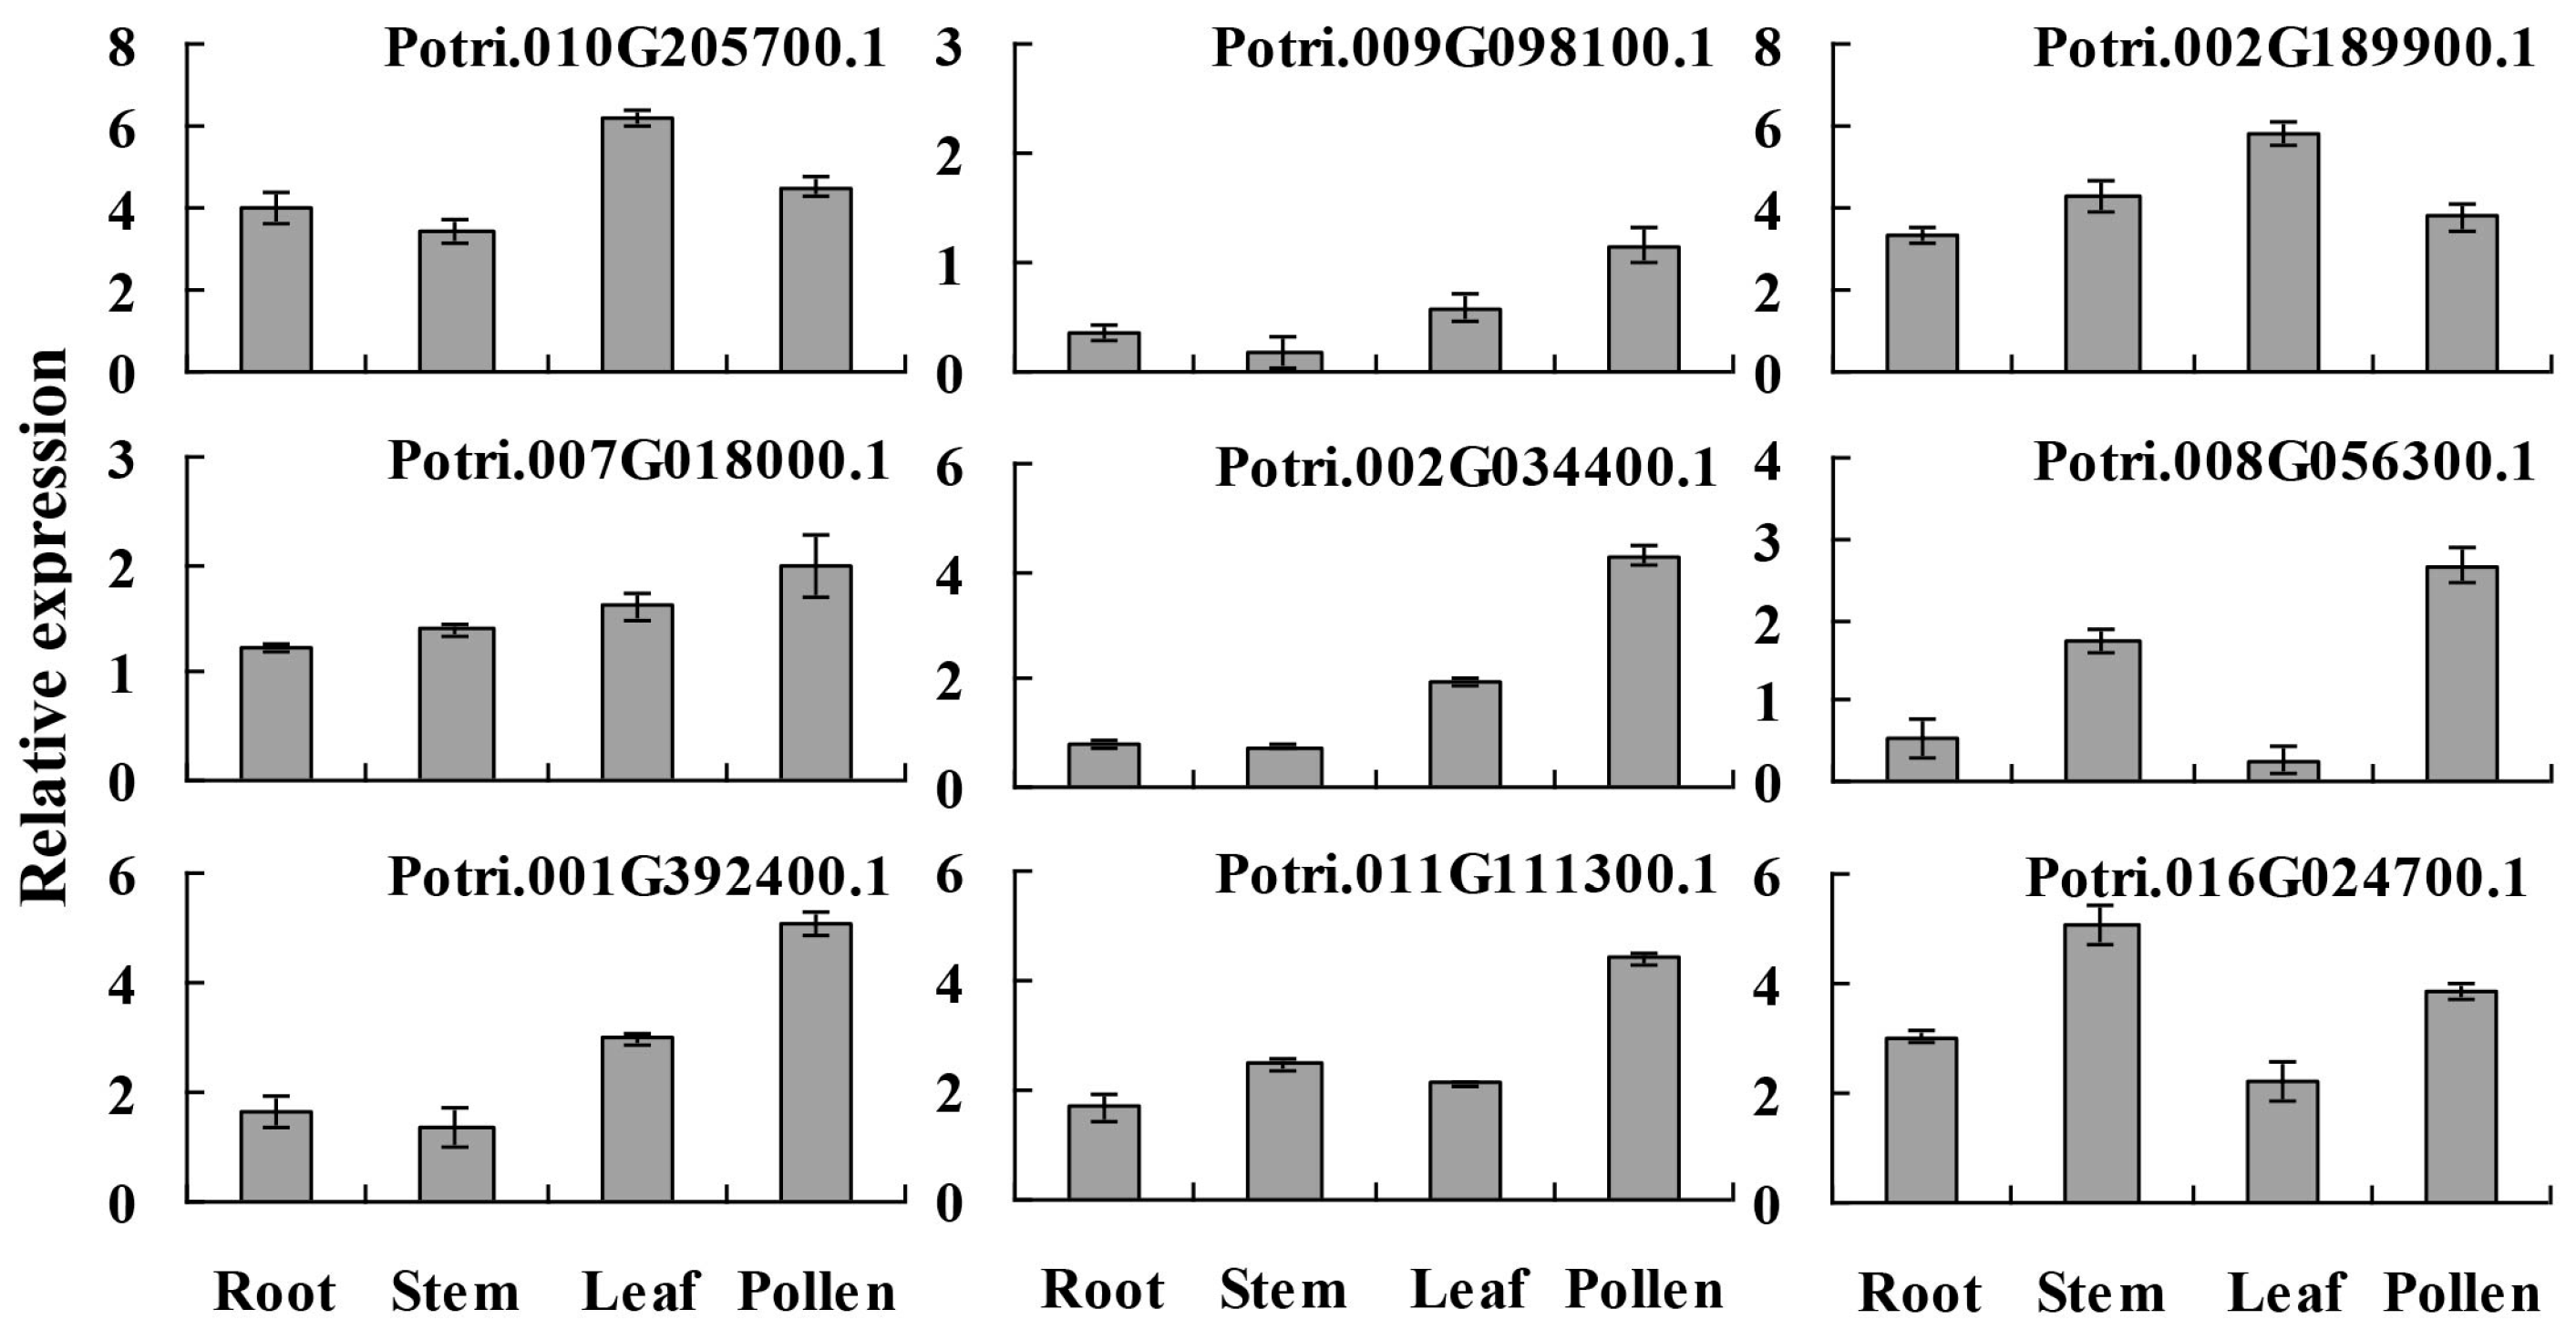
2.5. Expression Profiles of the Predicted Allergen Genes in Different Tissues

To examine whether the predicted pollen-allergen genes presently characterized are expressed in poplar and to study their expression patterns, Zhang et al. [26] previously showed that the global expression patterns of 28 predicted poplar allergen genes (including 16 putative allergen genes presented in both P. tomentosa and ‘2KEN8’ mature pollen) across various tissues based on an Affymetrix microarray data (GSE21481). Among the 16 putative allergen genes, two genes (Potri.001G392400.1 and Potri.011G111300.1) corresponding to spots 156, 159 and 160 (Pollen Ole e 1 allergen and extensin family protein) had high transcript levels in male catkin, suggesting their specific expression in pollen. In this study, we analyzed the expression patterns of the 11 putative allergen genes that only presented in P. tomentosa across various tissues based on this microarray data. However, five poplar allergen genes (Potri.005G015100.1, Potri.013G009500.1, Potri.012G090900.1 and Potri.013G089200.1) did not agree with the corresponding data. The reasons may be due to the improvement of the poplar genome, some genes with the incorrect functional annotation have been removed or others. The expression patterns of the other 7 poplar allergen genes are shown in Figure 5. Three poplar allergen genes corresponding to spots 9 (Potri.010G205700.1, Hsp 70 family protein), 48 (Potri.002G189900.1, Aldehyde dehydrogenase 2B7) and 194 (Potri.016G024700.1, Calmodulin 6) had high transcript levels in the different tissues. One gene (Potri.003G143600.1) corresponding to spots 4, 8 and 21 (Hsp 70 family protein) was highly expressed in RFF and AxB, the other gene (Potri.009G022300.1) corresponding to spots 215 (Cystatin B) was highly expressed in ApB, ML, RTC, RFF, SE and G43h. These potential allergenic protein genes might play important roles in not only reproduction but also vegetative development. Thus, our data contribute to the identification of new pollen allergenic proteins.
To further confirm the expression profiles of the presently characterized predicted allergen genes and verify the reliability of the microarray data, qRT-PCR analysis was performed on root, stem, leaf and pollen for 9 genes, which had high relative expression levels based on microarray data (Figure 6). Meanwhile, the root, stem and leaf were used as control tissues for study the tissue specific expression. In this study, qRT-PCR results show that the Potri.001G392400.1 and Potri.011G111300.1 corresponding to spots 156, 159 and 160 (Pollen Ole e 1 allergen and extensin family protein) were highly expressed in pollen, and microarray data show that these genes were highly expressed in male catkin [26]. Three poplar putative allergen genes (Potri.010G205700.1, Potri.002G189900.1 and Potri.016G024700.1) had high transcript levels in the different tissues. However, some spots were not consistent with microarray data, the reasons may be that pollen used in qRT-PCR was purer than the male catkin used in the microarray analysis in tissue level, different poplar species and others. In general, the present qRT-PCR results were in good agreement with the microarray data sets analyzed in this study.

3. Materials and Methods

3.1. Plant Materials and Pollen Isolation

For biological replicates, three uniformly developed flowering branches were collected from one genotype of P. tomentosa in a nursery of Chinese Academy of Forestry, and then transferred to buckets filling with water and cultured in a greenhouse at average temperature of 22 °C with a relative humidity of 70–75% under 16 h light/18 h darkness photocycle conditions. Mature pollen grains were collected from freshly anther-dehisced flowers by shaking the tassel on a glass petri dish, dried at 37 °C, and any debris removed with a needle. Pollen samples were used immediately or pooled in a tube, then frozen in liquid nitrogen and stored at −80 °C until further study.

3.2. In Vitro Pollen Germination Assay

The viability of each pollen sample was tested using the “thin liquid layer” germination methods with some modifications [41]. Briefly, pollen grains were sowed on the dishes containing the liquid germination medium and incubated at 21 °C in the dark. The liquid germination medium was composed of 15% (w/v) sucrose, 100 mg/L H3BO3, 300 mg/L CaCl2, 200 mg/L MgSO4, 100 mg/L KNO3, and the pH was adjusted to 6.0. After incubation for 2, 4, 8, 12, 24, and 48 h, the rates of pollen grains were calculated to determine under a light microscope when the pollen tube grows longer than the diameter of the pollen grain. Each sample was observed in 5 fields of view. At least 30 pollen grains were analyzed in each field. The experiment was repeated three times and three replicates (dishes) were carried out.

3.3. Preparation of Total Protein Extraction

Total soluble protein from mature pollen was isolated using the trichloroacetic acid and acetone (TCA-A) method with slight modifications [26]. Briefly, the pollen grains were ground in liquid nitrogen into fine powder and transferred to cold protein extraction buffer containing 10% (w/v) TCA and 0.07% (v/v) β-mercaptoethanol in acetone, incubated overnight at −20 °C, and then centrifuged at 14,000 g at 4 °C for 30 min. The precipitate was washed three times with the same cold protein extraction buffer without 10% (w/v) TCA, followed by incubation at −20 °C for 1 h and subsequent centrifugation at 14,000 g at 4 °C for 30 min for each wash. The resulting pellets were vacuum-dried, weighed and stored at −80 °C for further use. Each experiment was carried out by three biological replicates.

3.4. Two-Dimensional Gel Electrophoresis (2-DE)

The vacuum-dried protein samples were dissolved in a lysis buffer containing 7 M urea, 65 mM dithiothreitol (DTT), 4% (w/v) CHAPS, 2 M thiourea, and 0.2% carrier ampholytes for 1 h at room temperature with vortexing every 10 min, the homogenate was centrifuged at 15,000 g for 20 min. The protein concentration of the supernatant was determined by Bradford assay with bovine serum albumin as the standard [42]. 2-DE was performed following the protocol described by Sheoran et al. [1] and Zhang et al. [26]. Briefly, Protein samples (600 µg) were diluted in a rehydration buffer for 12 h. Isoelectric focusing (IEF) was performed using the Ettan III system (GE Healthcare, Chicago, IL, USA) and 18 cm Immobiline Dry Strips (pH 4–7, GE Healthcare). After IEF, the strips were treated in an equilibration buffer, placed on top of the vertical sodium dodecyl sulfate-polyacrylamide gel electrophoresis (SDS-PAGE) gels and sealed with agarose and bromophenol blue. The gels were run with a running buffer in a PROTEAN II XL multi-cell (Bio-Rad, Hercules, CA, USA) electrophoresis tank under 10 mA constant for 30 min, and then 30 mA until the tracking dye reached the bottom of the gels. Three representative gels per sample were used for further analysis.

3.5. Gel Staining and Image Analysis

The gels were fixed in 50% (v/v) ethanol and 10% (v/v) acetic acid for overnight, washed with Milli-Q water three times for 10 min each, and stained with Colloidal Coomassie Blue G-250 (CCB) solution for 12 h [1]. After rinsed with water, the gels were digitized with a calibrated scanner (UMAX Powerlook 2100 XL; UMAX, Taiwan), annotated, analyzed for spot number and spot volume using Image Master 2D Platinum Software (Version 6.0; Amersham Biosciences, Uppsala, Sweden). Three replicate gels were run for each of three different pooled pollen samples, and protein spots observed consistently in replicate gels were selected for further analysis.

3.6. In-Gel Digestion and Mass Spectrometry

After 2-DE, the protein spots were manually cut from the gels and rinsed twice with Milli-Q water, destained with 100 mM Na2S2O3 and 30 mM K3Fe(CN)6, dehydrated with 25 mM NH4HCO3 and 50% (v/v) acetonitrile (ACN), reduced with 10 mM DTT, alkylated with 55 mM iodoacetamide, and then completely dried under vacuum. Protein digestion was performed with trypsin (Mass grade, Promega, Madison, WI, USA) using a MassPREP protein digest station (Micromass, Manchester, UK) and incubated overnight at 37 °C. The resulting tryptic digests were then analyzed by a MALDI-TOF/TOF tandem mass spectrometer ABI 4800 proteomics analyzer (Applied Biosystems, Framingham, MN, USA). To acquire the mass spectra, 0.4 µL samples were mixed with equal volumes of matrix solution containing 0.5 M α-cyano-4-hydroxycinnamic acid (CHCA), 50% (v/v) ACN and 0.05% (v/v) trifluoroacetic acid (TFA) and spotted onto a MALDI plate. Spectra were acquired in the 800–4000 m/z range, analyzed by 4000 Series Explorer Software v3.5 (AB SCIEX, Foster, CA, USA) in batch-processing mode of MS/MS. The intensity peaks were detected on minimum S/N ratio ≥10 and cluster area S/N threshold ≥40 without smoothing and raw spectrum filtering. Peptide precursor ions corresponding to contaminants including keratin and the trypsin autolytic products were excluded in a mass tolerance of 0.5 Da.

3.7. Protein Identification and Allergen Prediction

The peptide mass data were uploaded on the Protein Pilot software v3.0 (Applied Biosystems, Framingham, MN, USA) and MASCOT search engine [43], and subjected to blast against Populus trichocarpa genome database v3.0, NCBI non-redundant protein database and Swiss-Prot database. The following parameters were used for database searching: trypsin as the proteolytic enzyme, allowing for one missed cleavage; carbamidomethylation of cysteine as a fixed modification; oxidation of methionine as a variable modification. All of the positive proteins were identified with a Mowse score greater than 60 and 95% confidence interval. The identified proteins were categorized by function according to data from Blast2GO [44]. The output GO terms were then slimmed in REVIGO and treemaps were produced [45]. Allergen was predicted using the SDAP [7] on the base of sequence similarity (>35%) between presently obtained proteins and reported allergen proteins and the presence of consecutive amino acids (at least eight) in the analyzed protein sequences compared to known allergen proteins [7], and the Allergen Online [6].

3.8. Microarray Data Analyses

The microarray data for various tissues were available at NCBI Gene Expression Omnibus (GEO) database [46]. The series accession numbers GSE21481 (for P. trichocarpa) were used for the tissue-specific expression analysis. Probe sets corresponding to selected genes were identified using the online Probe Match tool POParray. For genes with one or more probe sets, the median of expression values was considered. The expression values were normalized by the Gene Chip Robust Multiarray Analysis (GCRMA) algorithm followed by log transformation and average calculation.

3.9. RNA Extraction and Quantitative Reverse Transcription Polymerase Chain Reaction (qRT-PCR) ANalysis

For RNA isolation and qRT-PCR, the leaves, stems, roots and pollen of P. tomentosa were harvested, immediately frozen in liquid nitrogen and stored at –80 °C for further analysis. Total RNA was isolated using the RNeasy Plant Mini Kit (Qiagen, Hilden, Germany) with on-column treatment using RNase-free DNase I (Qiagen) according to the manufacturer’s instructions to ensure no genomic DNA contamination. First-strand cDNA was synthesized with approximately 1 µg of purified total RNA using the SuperScript III reverse transcription kit (Invitrogen, Carlsbad, CA, USA). qRT-PCR was performed in the LightCycler 480 Detection System (Roche, Penzberg, Germany) with two PtoActin genes as internal reference. The details of the primers used are listed in Table S2. The reaction mixture (20 µL) contained 10 µL 2× SYBR Green Real-time PCR Master Mix (TaKaRa, Dalian, China), 0.5 µM of each of the forward and reverse primers, and 2 µL of cDNA template. The amplification was completed with the following cycling parameters: 95 °C for 30 s; followed by 40 cycles at 95 °C for 5 s, 60 °C for 30 s; 60 °C for 60 s and 50 °C for 30 s. qRT-PCR was carried out in triplicates (technical repeats) to ensure the reproducibility of the results. The relative expression ratios were calculated from the threshold cycle according to the delta-delta CT method [47].

4. Conclusions

In summary, this study presents a comprehensive proteomic analysis and candidates for possible allergenic proteins in mature pollen of P. tomentosa. A total of 412 protein spots were isolated by 2-DE, and 159 different proteins were identified from 242 protein spots using MALDI-TOF/TOF MS/MS analysis. Furthermore, 27 proteins were identified as putative allergens, such as heat shock protein, enolase, pollen Ole e 1 allergen, thioredoxin and profilins, and their expression patterns across different tissues were analyzed based on an Affymetrix microarray data and qRT-PCR results. To our knowledge, this study is the first report on identification of possible allergenic proteins from P. tomentosa pollen. Further studies involving purification, recombinant protein expression, and epitope mapping of the identified putative allergens can be used as potential candidates for the development of hypoallergenic vaccines and innovative methods for immunotherapy and component-resolved diagnosis of P. tomentosa pollen allergy.

Supplementary Materials

The following are available online at www.mdpi.com/1422-0067/19/1/250/s1.

Acknowledgments

This work was supported by the National Nonprofit Institute Research Grant of the Chinese Academy of Forestry (CAFYBB2017ZY008) and Special Fund for Forestry Scientific Research in the Public Interest (201304103-4). We also thank the editor and reviewers for critical comments and thoughtful suggestions.

Author Contributions

Liuqiang Wang, Xiaoling Zhang and Jianjun Hu conceived and designed the experiments; Liuqiang Wang, Xiaoling Zhang, Jin Zhang and Wei Fan performed the experiments, interpreted and analyzed the data; Liuqiang Wang wrote the manuscript; Mengzhu Lu contributed to the revisions of this manuscript. All authors read and approved the manuscript.

Conflicts of Interest

The authors declare no conflict of interest.

Abbreviations

2-DETwo-dimensional gel electrophoresis
ACNAcetonitrile
CCBColloidal coomassie blue g-250
CHAPS3-(3-cholamidopropyl) dimethylammonio-1-propane sulfonate
CHCAα-cyano-4-hydroxycinnamic acid
DTTDithiothreitol
FDAFluorescein diacetate
GCRMAGene chip robust multiarray analysis
GEOGene expression omnibus
GOGene ontology
IEFIsoelectric focusing
IPGimmobilized pH gradient
LC-MS/MSLiquid chromatography coupled to tandem mass spectrometry
MALDI-TOFMatrix-assisted laser desorption/ionization time-of-flight
MSMass spectrometry
MWmolecular weight
pIisoelectric point
PMFPeptide mass fingerprint
SDAPStructural database of allergenic proteins
SDS-PAGESodium dodecyl sulfate-polyacrylamide gel electrophoresis
TFATrifluoroacetic acid

References

  1. Sheoran, I.S.; Sproule, K.A.; Olson, D.J.H.; Ross, A.R.S.; Sawhney, V.K. Proteome profile and functional classification of proteins in Arabidopsis thaliana (Landsberg erecta) mature pollen. Sex. Plant Reprod. 2006, 19, 185–196. [Google Scholar] [CrossRef]
  2. Sheoran, I.S.; Ross, A.R.S.; Olson, D.J.H.; Sawhney, V.K. Proteomic analysis of tomato (Lycopersicon esculentum) pollen. J. Exp. Bot. 2007, 58, 3525–3535. [Google Scholar] [CrossRef] [PubMed]
  3. Ma, H. Molecular genetic analyses of microsporogenesis and microgametogenesis in flowering plants. Annu. Rev. Plant Biol. 2005, 56, 393–434. [Google Scholar] [CrossRef] [PubMed]
  4. Pina, C.; Pinto, F.; Feijó, J.A.; Becker, J.D. Gene family analysis of the Arabidopsis pollen transcriptome reveals biological implications for cell growth, division control, and gene expression regulation. Plant Physiol. 2005, 138, 744–756. [Google Scholar] [CrossRef] [PubMed]
  5. Roulston, T.H.; Cane, J.H. Pollen nutritional content and digestibility for animals. Plant Syst. Evol. 2000, 222, 187–209. [Google Scholar] [CrossRef]
  6. AllergenOnline, the Farrp Allergen Protein Database. Available online: http://www.allergenonline.com/.
  7. Ivanciuc, O.; Schein, C.H.; Braun, W. SDAP: database and computational tools for allergenic proteins. Nucleic Acids Res. 2003, 31, 359–362. [Google Scholar] [CrossRef] [PubMed]
  8. Radauer, C.; Breiteneder, H. Pollen allergens are restricted to few protein families and show distinct patterns of species distribution. J. Allergy Clin. Immunol. 2006, 117, 141–147. [Google Scholar] [CrossRef] [PubMed]
  9. Solomon, P.A. Air pollution and health: Bridging the gap from sources to health outcomes. Environ. Health Perspect. 2011, 119, 156. [Google Scholar] [CrossRef] [PubMed]
  10. Kim, K.H.; Jahan, S.A.; Kabir, E. A review on human health perspective of air pollution with respect to allergies and asthma. Environ. Int. 2013, 59, 41–52. [Google Scholar] [CrossRef] [PubMed]
  11. Dai, S.; Li, L.; Chen, T.; Chong, K.; Xue, Y.; Wang, T. Proteomic analyses of Oryza sativa mature pollen reveal novel proteins associated with pollen germination and tube growth. Proteomics 2006, 6, 2504–2529. [Google Scholar] [CrossRef] [PubMed]
  12. Zou, J.; Song, L.; Zhang, W.; Wang, Y.; Ruan, S.; Wu, W.H. Comparative proteomic analysis of Arabidopsis mature pollen and germinated pollen. J. Integr. Plant Biol. 2009, 51, 438–455. [Google Scholar] [CrossRef] [PubMed]
  13. Nakamura, R.; Teshima, R. Proteomics-based allergen analysis in plants. J. Proteom. 2013, 93, 40–49. [Google Scholar] [CrossRef] [PubMed]
  14. Mani, B.M.; Huerta-Ocampo, J.A.; Garcia-Sanchez, J.R.; Barrera-Pacheco, A.; de la Rosa, A.P.; Teran, L.M. Identification of Ligustrum lucidum pollen allergens using a proteomics approach. Biochem. Biophys. Res. Commun. 2015, 468, 788–792. [Google Scholar] [CrossRef] [PubMed]
  15. Akagawa, M.; Handoyo, T.; Ishii, T.; Kumazawa, S.; Morita, N.; Suyama, K. Proteomic analysis of wheat flour allergens. J. Agric. Food Chem. 2007, 55, 6863–6870. [Google Scholar] [CrossRef] [PubMed]
  16. Saha, B.; Sircar, G.; Pandey, N.; Bhattacharya, S.G. Mining novel allergens from coconut pollen employing manual de novo sequencing and homology-driven proteomics. J. Proteome Res. 2015, 14, 4823–4833. [Google Scholar] [CrossRef] [PubMed]
  17. Saha, B.; Pandey, N.; Bhattacharya, S.G. Charting novel allergens from date palm pollen (Phoenix sylvestris) using homology driven proteomics. J. Proteom. 2017, 165, 1–10. [Google Scholar] [CrossRef] [PubMed]
  18. Taylor, G. Populus: Arabidopsis for forestry. Do we need a model tree? Ann. Bot. 2002, 90, 681–689. [Google Scholar] [CrossRef] [PubMed]
  19. Zhang, X.L.; Zhang, J.; Guo, Y.H.; Sun, P.; Jia, H.X.; Fan, W.; Lu, M.Z.; Hu, J.J. Comparative proteomic analysis of mature pollen in triploid and diploid Populus deltoides. Int. J. Mol. Sci. 2016, 17, 1475. [Google Scholar] [CrossRef] [PubMed]
  20. Tuskan, G.A.; Difazio, S.; Jansson, S.; Bohlmann, J.; Grigoriev, I.; Hellsten, U.; Putnam, N.; Ralph, S.; Rombauts, S.; et al. The genome of black cottonwood, Populus trichocarpa (Torr. & Gray). Science 2006, 313, 1596–1604. [Google Scholar] [PubMed]
  21. Jensen, O.N. Modification-specific proteomics: Characterization of post-translational modifications by mass spectrometry. Curr. Opin. Chem. Biol. 2004, 8, 33–41. [Google Scholar] [CrossRef] [PubMed]
  22. Holmes-Davis, R.; Tanaka, C.K.; Vensel, W.H.; Hurkman, W.J.; McCormick, S. Proteome mapping of mature pollen of Arabidopsis thaliana. Proteomics 2005, 5, 4864–4884. [Google Scholar] [CrossRef] [PubMed]
  23. Noir, S.; Bräutigam, A.; Colby, T.; Schmidt, J.; Panstruga, R. A reference map of the Arabidopsis thaliana mature pollen proteome. Biochem. Biophys. Res. Commun. 2005, 337, 1257–1266. [Google Scholar] [CrossRef] [PubMed]
  24. Brett, D.; Pospisil, H.; Valcárcel, J.; Reich, J.; Bork, P. Alternative splicing and genome complexity. Nat. Genet. 2002, 30, 29–30. [Google Scholar] [CrossRef] [PubMed]
  25. Loraine, A.E.; McCormick, S.; Estrada, A.; Patel, K.; Qin, P. RNA-seq of Arabidopsis pollen uncovers novel transcription and alternative splicing. Plant Physiol. 2013, 162, 1092–1109. [Google Scholar] [CrossRef] [PubMed]
  26. Zhang, J.; Wu, L.S.; Fan, W.; Zhang, X.L.; Jia, H.X.; Li, Y.; Yin, Y.F.; Hu, J.J.; Lu, M.Z. Proteomic analysis and candidate allergenic proteins in Populus deltoides CL. ‘2KEN8’ mature pollen. Front. Plant Sci. 2015, 6, 548. [Google Scholar] [CrossRef] [PubMed]
  27. Burbach, G.J.; Heinzerling, L.M.; Edenharter, G.; Bachert, C.; Bindslev-Jensen, C.; Bonini, S.; Bousquet, J.; Bousquet-Rouanet, L.; Bousquet, P.J.; Bresciani, M.; et al. GA2LEN skin test study II: Clinical relevance of inhalant allergen sensitizations in Europe. Allergy 2009, 64, 1507–1515. [Google Scholar] [CrossRef] [PubMed]
  28. Sicherer, S.H. Clinical implications of cross-reactive food allergens. J. Allergy Clin. Immunol. 2001, 108, 881–890. [Google Scholar] [CrossRef] [PubMed]
  29. Ortona, E.; Margutti, P.; Delunardo, F.; Vaccari, S.; Riganò, R.; Profumo, E.; Buttari, B.; Teggi, A.; Siracusano, A. Molecular and immunological characterization of the C-terminal region of a new Echinococcus granulosus Heat Shock Protein 70. Parasite Immunol. 2003, 25, 119–126. [Google Scholar] [CrossRef] [PubMed]
  30. Chiung, Y.M.; Lin, B.L.; Yeh, C.H.; Lin, C.Y. Heat shock protein (hsp 70)-related epitopes are common allergenic determinants for barley and corn antigens. Electrophoresis 2000, 21, 297–300. [Google Scholar] [CrossRef]
  31. Shen, H.D.; Au, L.C.; Lin, W.L.; Liaw, S.F.; Tsai, J.J.; Han, S.H. Molecular cloning and expression of a Penicillium citrinum allergen with sequence homology and antigenic crossreactivity to a hsp 70 human heat shock protein. Clin. Exp. Allergy 1997, 27, 682–690. [Google Scholar] [CrossRef] [PubMed]
  32. Gagnon, C.; Poysa, V.; Cober, E.R.; Gleddie, S. Soybean allergens affecting North American patients identified by 2D gels and mass spectrometry. Food Anal. Methods 2010, 3, 363–374. [Google Scholar] [CrossRef]
  33. Simon-Nobbe, B.; Probst, G.; Kajava, A.V.; Oberkofler, H.; Susani, M.; Crameri, R.; Ferreira, F.; Ebner, C.; Breitenbach, M. IgE-binding epitopes of enolases, a class of highly conserved fungal allergens. J. Allergy Clin. Immunol. 2000, 106, 887–895. [Google Scholar] [CrossRef] [PubMed]
  34. Sharma, V.; Gupta, R.; Jhingran, A.; Singh, B.P.; Sridhara, S.; Gaur, S.N.; Arora, N. Cloning, recombinant expression and activity studies of a major allergen “enolase” from the fungus Curvularia lunata. J. Clin. Immunol. 2006, 26, 360–369. [Google Scholar] [CrossRef] [PubMed]
  35. Alché, J.D.; M’rani-Alaoui, M.; Castro, A.J.; Rodríguez-García, M.I. Ole e 1, the major allergen from olive (Olea europaea L.) pollen, increases its expression and is released to the culture medium during in vitro germination. Plant Cell Physiol. 2004, 45, 1149–1157. [Google Scholar] [CrossRef] [PubMed]
  36. Weichel, M.; Glaser, A.G.; Ballmer-Weber, B.K.; Schmid-Grendelmeier, P.; Crameri, R. Wheat and maize thioredoxins: A novel cross-reactive cereal allergen family related to baker’s asthma. J. Allergy Clin. Immunol. 2006, 117, 676–681. [Google Scholar] [CrossRef] [PubMed]
  37. Van Ree, R.; Voitenko, V.; van Leeuwen, W.A.; Aalberse, R.C. Profilin is a cross-reactive allergen in pollen and vegetable foods. Int. Arch. Allergy Immunol. 1992, 98, 97–104. [Google Scholar] [CrossRef] [PubMed]
  38. Asero, R.; Jimeno, L.; Barber, D. Preliminary results of a skin prick test-based study of the prevalence and clinical impact of hypersensitivity to pollen panallergens (polcalcin and profilin). J. Investig. Allergol. Clin. Immunol. 2010, 20, 35–38. [Google Scholar] [PubMed]
  39. Alvarado, M.I.; Jimeno, L.; De La Torre, F.; Boissy, P.; Rivas, B.; Lázaro, M.J.; Barber, D. Profilin as a severe food allergen in allergic patients overexposed to grass pollen. Allergy 2014, 69, 1610–1616. [Google Scholar] [CrossRef] [PubMed]
  40. Sander, I.; Flagge, A.; Merget, R.; Halder, T.M.; Meyer, H.E.; Baur, X. Identification of wheat flour allergens by means of 2-dimensional immunoblotting. J. Allergy Clin. Immunol. 2001, 107, 907–913. [Google Scholar] [CrossRef] [PubMed]
  41. Wang, Y.; Zhang, W.Z.; Song, L.F.; Zou, J.J.; Su, Z.; Wu, W.H. Transcriptome analyses show changes in gene expression to accompany pollen germination and tube growth in Arabidopsis. Plant Physiol. 2008, 148, 1201–1211. [Google Scholar] [CrossRef] [PubMed]
  42. Bradford, M.M. A rapid and sensitive method for the quantitation of microgram quantities of protein utilizing the principle of protein-dye binding. Anal. Biochem. 1976, 72, 248–254. [Google Scholar] [CrossRef]
  43. Mascot Server, MASCOT Search Engine. Available online: http://www.matrixscience.com.
  44. Conesa, A.; Götz, S.; García-Gómez, J.M.; Terol, J.; Talón, M.; Robles, M. Blast2GO: A universal tool for annotation, visualization and analysis in functional genomics research. Bioinformatics 2005, 21, 3674–3676. [Google Scholar] [CrossRef] [PubMed]
  45. Supek, F.; Bošnjak, M.; Škunca, N.; Smuc, T. REVIGO summarizes and visualizes long lists of gene ontology terms. PLoS ONE 2011, 6, e21800. [Google Scholar] [CrossRef] [PubMed]
  46. Gene Expression Omnibus. Available online: https://www.ncbi.nlm.nih.gov/geo/ (accessed on 22 March 2012).
  47. Livak, K.J.; Schmittgen, T.D. Analysis of relative gene expression data using real-time quantitative PCR and the 2−ΔΔCT method. Methods 2001, 25, 402–408. [Google Scholar] [CrossRef] [PubMed]
Figure 1. Pollen germination rate of P. tomentosa. The pollen grain suspension with the liquid germination medium was spread on the dishes. After incubation at 21 °C for 12 and 48 h, the pollen germination rate was determined under a light microscope. The experiments were repeated three times and three replicates (dishes) were carried out.
Ijms 19 00250 g001
Figure 2. Colloidal coomassie stained 2-DE gel of P. tomentosa mature pollen. Spot numbers indicated on the gel were subjected to MALDI-TOF/TOF MS/MS analysis. Standard molecular weight markers are shown on the left. All spots with protein identifications are listed in Table S1.
Ijms 19 00250 g002
Figure 3. Functional annotation of identified P. tomentosa pollen proteins. The percentage values indicate the proportion of total number of proteins within that category.
Ijms 19 00250 g003
Figure 4. Gene ontology analysis of identified proteins. Results are summarized for three main GO categories, including biological process (A); molecular function (B) and cellular component (C). The number corresponding to each column indicates the number of proteins in this GO term.
Ijms 19 00250 g004
Figure 5. Expression profiles of genes coding predicted allergen proteins across different tissues. The Affymetrix microarray data (accession number GSE21481) were obtained from NCBI Gene Expression Omnibus (GEO) database. ApB, Shoot apex; ApL, Young leaves at apex; YL, Young leaves plastochron #2; ML, Mature leaves plastochron #5; PC, Phloem and cortex; Xpi, Developing xylem and pith; RTC, Roots from tissue culture; RFF, Roots from field trees; YMB, Male floral bud initials; YFB, Female floral bud initials; AxB, Axillary buds; M, Male catkin-3 stages pooled; F, Female catkin post-pollination; FM, Mature catkin before seed release; SE, Seed; G43 h, Seedling 43 h post-imbibition.
Ijms 19 00250 g005
Figure 6. Expression patterns of putative allergen genes in different tissues. Nine predicted allergen protein genes were randomly selected and the expression levels in leaf, stem, root and pollen were analyzed using qRT-PCR. The error bars were calculated from three replicates.
Ijms 19 00250 g006
Table 1. The basic information of predicted allergenic proteins in the pollen of P. tomentosa.
Spot No.Gene IDProtein DescriptionAmino Acids (aa)Corresponding of Known Allergen
AllergenAccession No.Amino Acids (aa)Bit ScoreE Score
4/8/21Potri.003G143600.1Heat shock protein 70 (Hsp 70) family protein666Cor a 10CAC14168668791.10.0
5/7Potri.003G006300.1Chloroplast heat shock protein 70-2706Cor a 10CAC14168668322.55.0 × 10−89
9Potri.010G205700.1Heat shock protein 70 (Hsp 70) family protein648Cla h 5.0101P40918643605.23.7 × 10−174
10/12/13Potri.009G079700.1Mitochondrial HSO70 2682Cor a 10CAC14168668392.83.4 × 10−110
11Potri.001G285500.1Mitochondrial HSO70 2683Cor a 10CAC14168668400.41.7 × 10−112
25/62/71/72/241Potri.006G116800.1Enolase445Hev b 9Q9LEI9445583.55.6 × 10−168
31Potri.001G087500.1Heat shock protein 70 (Hsp 70) family protein666Cor a 10CAC14168668816.50.0
43Potri.009G098100.1Granulin repeat cysteine protease family protein508Act d 1AAA32629380237.77.0 × 10−64
48Potri.002G189900.1Aldehyde dehydrogenase 2B7540Cla h 10.0101P40108496364.18.8 × 10−102
49/50/53/54/59/222Potri.015G131100.1Enolase445Hev b 9Q9LEJ0445545.71.4 × 10−156
55Potri.007G018000.1Thioredoxin H-type 1122Tri a 25.0101Q9LDX4125114.85.5 × 10−28
88Potri.005G015100.1Calreticulin 1a419Pen ch 31.0101AAX4507255791.67.9 × 10−20
90Potri.013G009500.1Calreticulin 1a360Pen ch 31.0101AAX4507255790.21.9 × 10−19
98/105Potri.002G034400.1NmrA-like negative transcriptional regulator family protein308Bet v 6.0102AAG22740308353.35.3 × 10−99
106Potri.017G102000.1Malate dehydrogenase412Mala f 4AAD25927342244.06.4 × 10−66
122/123Potri.012G090900.1Cysteine proteinases superfamily protein363Act d 1AAA32629380238.23.6 × 10−64
145Potri.008G056300.1Triosephosphate isomerase255Tri a 31.0101CAC14917253332.09.6 × 10−93
156Potri.001G392400.1Pollen Ole e 1 allergen and extensin family protein161Lyc e LAT52CAA33854161118.47.8 × 10−29
159/160Potri.011G111300.1Pollen Ole e 1 allergen and extensin family protein164Lyc e LAT52CAA33854161120.81.5 × 10−29
172/173Potri.013G089200.1HSP20-like chaperones superfamily protein192Cas s 9.0101CAE46905154103.82.1 × 10−24
183Potri.018G083500.1Thioredoxin-dependent peroxidase 1162Cand b 2AAA34357167105.46.6 × 10−25
194Potri.016G024700.1Calmodulin 6149Tyr p 24.0101ACL36923153112.05.8 × 10−27
197Potri.003G047700.1Profilin 3131Hev b 8.0201Q9M7N0131195.62.9 × 10−52
202Potri.001G190800.1Profilin 5133Hev b 8.0201Q9M7N0131144.29.0 × 10−37
210Potri.005G232700.1Thioredoxin H-type 1114Tri a 25.0101Q9LDX4125115.43.3 × 10−28
215Potri.009G022300.1Cystatin B100Act d 4.0101AAR9222311669.12.4 × 10−14
217/218Potri.006G093500.1HSP20-like chaperones superfamily protein140Cas s 9.0101CAE46905154151.47.6 × 10−39

