Article

Expression of the Grape VaSTS19 Gene in Arabidopsis Improves Resistance to Powdery Mildew and Botrytis cinerea but Increases Susceptibility to Pseudomonas syringe pv Tomato DC3000

1
State Key Laboratory of Crop Stress Biology in Arid Areas, College of Horticulture, Northwest A&F University, Yangling 712100, China
2
Key Laboratory of Horticultural Plant Biology and Germplasm Innovation in Northwest China, Ministry of Agriculture, Northwest A&F University, Yangling 712100, China
3
Department of Horticulture, Michigan State University, East Lansing, MI 48824, USA
*
Authors to whom correspondence should be addressed.
Int. J. Mol. Sci. 2017, 18(9), 2000; https://doi.org/10.3390/ijms18092000
Submission received: 21 July 2017 / Revised: 7 September 2017 / Accepted: 12 September 2017 / Published: 17 September 2017
(This article belongs to the Section Molecular Plant Sciences)

Abstract

:
Stilbene synthase (STS) is a key enzyme that catalyzes the biosynthesis of resveratrol compounds and plays an important role in disease resistance. The molecular pathways linking STS with pathogen responses and their regulation are not known. We isolated an STS gene, VaSTS19, from a Chinese wild grape, Vitis amurensis Rupr. cv. “Tonghua-3”, and transferred this gene to Arabidopsis. We then generated VaSTS19-expressing Arabidopsis lines and evaluated the functions of VaSTS19 in various pathogen stresses, including powdery mildew, B. cinerea and Pseudomonas syringae pv. tomato DC3000 (PstDC3000). VaSTS19 enhanced resistance to powdery mildew and B. cinerea, but increased susceptibility to PstDC3000. Aniline blue staining revealed that VaSTS19 transgenic lines accumulated more callose compared to nontransgenic control plants, and showed smaller stomatal apertures when exposed to pathogen-associated molecular patterns (flagellin fragment (flg22) or lipopolysaccharides (LPS)). Analysis of the expression of several disease-related genes suggested that VaSTS19 expression enhanced defense responses though salicylic acid (SA) and/or jasmonic acid (JA) signaling pathways. These findings provide a deeper insight into the function of STS genes in defense against pathogens, and a better understanding of the regulatory cross talk between SA and JA pathways.

Graphical Abstract

1. Introduction

Grapevine (Vitis vinifera L.) is one of the most agriculturally and economically important fruit species, and is widely cultivated around the world [1]. However, plants are exposed to a large variety of pathogens, such as Botrytis cinerea and powdery mildew (Golovinomyces cichoracearum UCSC1 (Erysiphe cichoracearum)), as well as hostile environments, including extremes of temperature, light, and water availability. These biotic and abiotic stresses can severely affect the growth, yield, and fruit quality of cultivated grapevine varieties [2]. In order to improve resistance, effective measures need to be taken to prevent or limit pathogen infection and exposure to adverse environments [3]. Natural resistance of plants to phytopathogens is dependent on a large arsenal of constitutive and inducible defense mechanisms [4]. In grapevine, the best characterized defense mechanisms involve synthesis and accumulation of phytoalexins [5,6].
Phytoalexins are low molecular mass, lipophilic antimicrobial compounds that occur in both dicots and monocots [7,8,9]. The stilbenoid phytoalexin, resveratrol, belongs to a major secondary metabolites class derived from the phenylpropanoid pathway, and plays a vital role in plant protection [10,11,12]. Resveratrols are distributed in a taxonomically broad range of plant species among 31 genera and 12 families, including Fagaceae, Liliaceae, Moraceae, Myrtaceae, Papilionaceae, Pinaceae, and Poaceae. They have been isolated from various plant structures [13,14]. During the past decade, extensive attention has been given to understanding the biological attributes for plant protection and the biosynthetic regulation of resveratrol [15,16,17].
Stilbene synthase (STS) is a key enzyme responsible for the biosynthesis of resveratrols [18], and condenses three molecules of malonyl-CoA (coenzyme A) and one molecule of coumaroyl-CoA to produce resveratrol [19]. STS has become an area of research focus due to its role in disease resistance. Initial identification and cloning of stilbene synthase gene (SbSTS1) from sorghum enabled the transfer of STS into a variety of species in order to enhance biotic stress resistance [13,20]. In grapevine, expression of VaSTS6 significantly improved resistance to powdery mildew [21]. In addition, expression of STS in transgenic rice and tobacco plants enhanced resistance to pathogens [22,23].
The grapevine genome contains a family of 32 preliminarily annotated STS genes [24], but their precise function and the regulatory mechanism of each individual STS gene in response to biotic stresses remains unclear. Previous studies have shown that berries of the Chinese wild grapevine, V. amurensis cv.Tonghua-3, express multiple STS genes and accumulate resveratrol to high levels during development, and that resveratrol concentration is tightly correlated with expression of a specific STS gene, STS19 [25,26].
The objective of this study was to enhance our understanding of the role of VaSTS19 gene in biotic stress responses. We found that expression of VaSTS19 was up-regulated in response to powdery mildew, suggesting that it may be associated with tolerance to biotic stress. We cloned VaSTS19 and transferred it to Arabidopsis to evaluate its role in biotic stress response, specifically in resistance to three pathogenic fungi: powdery mildew, B. cinerea, and Pseudomonas syringae pv. tomato DC3000 (PstDC3000). Effective defense against pathogens is largely associated with active defense responses regulated by the salicylic acid (SA)- and jasmonic acid (JA)-dependent signaling pathways. Therefore, transcriptional expression profiles of several SA- and JA-related genes were analyzed to assess underlying functions of VaSTS19 in plant defense. In addition, we analyzed stomatal aperture and callose accumulation in epidermal peels of plants exposed to flagellin fragment (flg22) or lipopolysaccharides (LPS).

2. Results

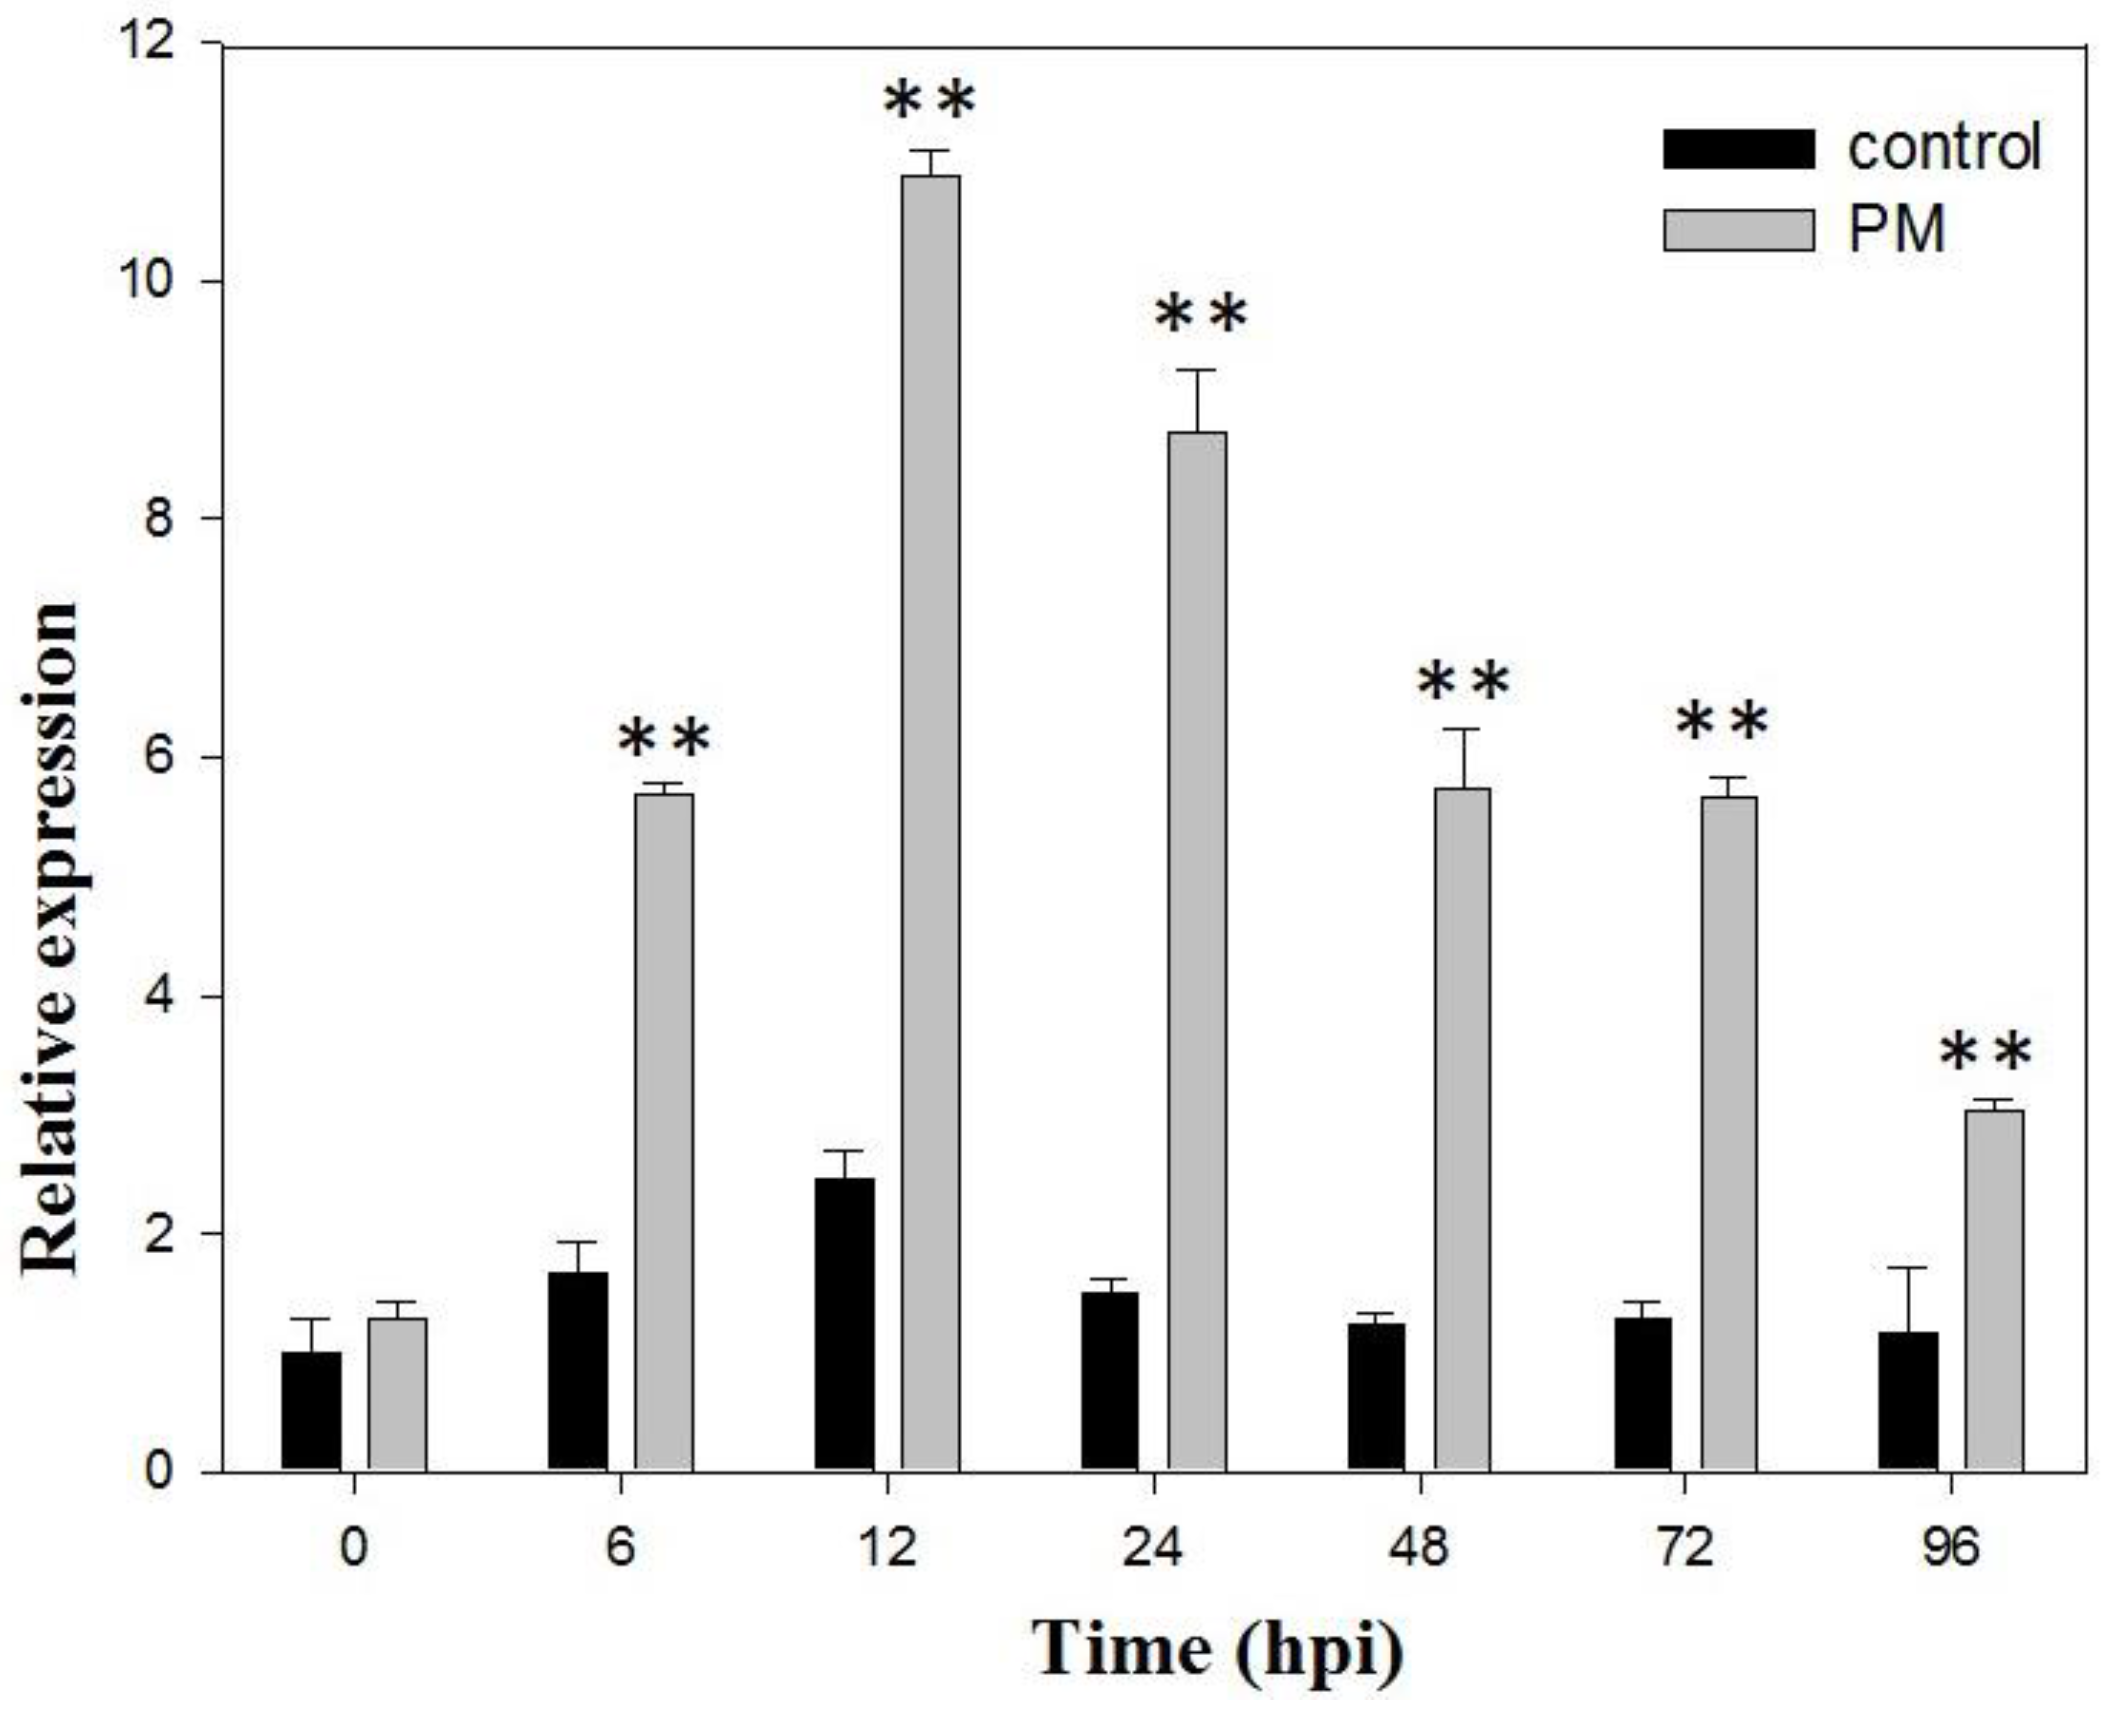
2.1. VaSTS19 Expression is Induced in Grape Following Powdery Mildew Infection

To evaluate expression of VaSTS19 in response to powdery mildew, quantitative real-time PCR (qRT-PCR) was used to quantify VaSTS19 transcripts following inoculation of plants with powdery mildew. As shown in Figure 1, VaSTS19 expression was induced within 6 h upon infection (hours post-infection; hours post-inoculation (hpi)). Expression peaked at 12 hpi, after which it decreased for the next 84 h. As such, we selected the VaSTS19 gene for all further function analyses in this study.

2.2. Analysis of VaSTS19-Expressing Transgenic Arabidopsis Lines

To evaluate the potential function of VaSTS19 in powdery mildew resistance in a heterologous system, we first engineered a VaSTS19 cDNA to be expressed in the plant over-expression vector, pCambia 2300 and introduced this construction into Arabidopsis. A total of 50 independent transgenic lines were generated, and the three with the strongest apparent resistance to powdery mildew (designated L1, L2 and L3) were selected to generate homozygous T3 lines, which were used for all further analyses. Measurement of VaSTS19 expression by qRT-PCR in the three lines following powdery mildew infection (Figure 2) revealed that the transcript levels at 24, 72, and 120 hpi increased 5–10 times when compared with levels at 0 hpi.

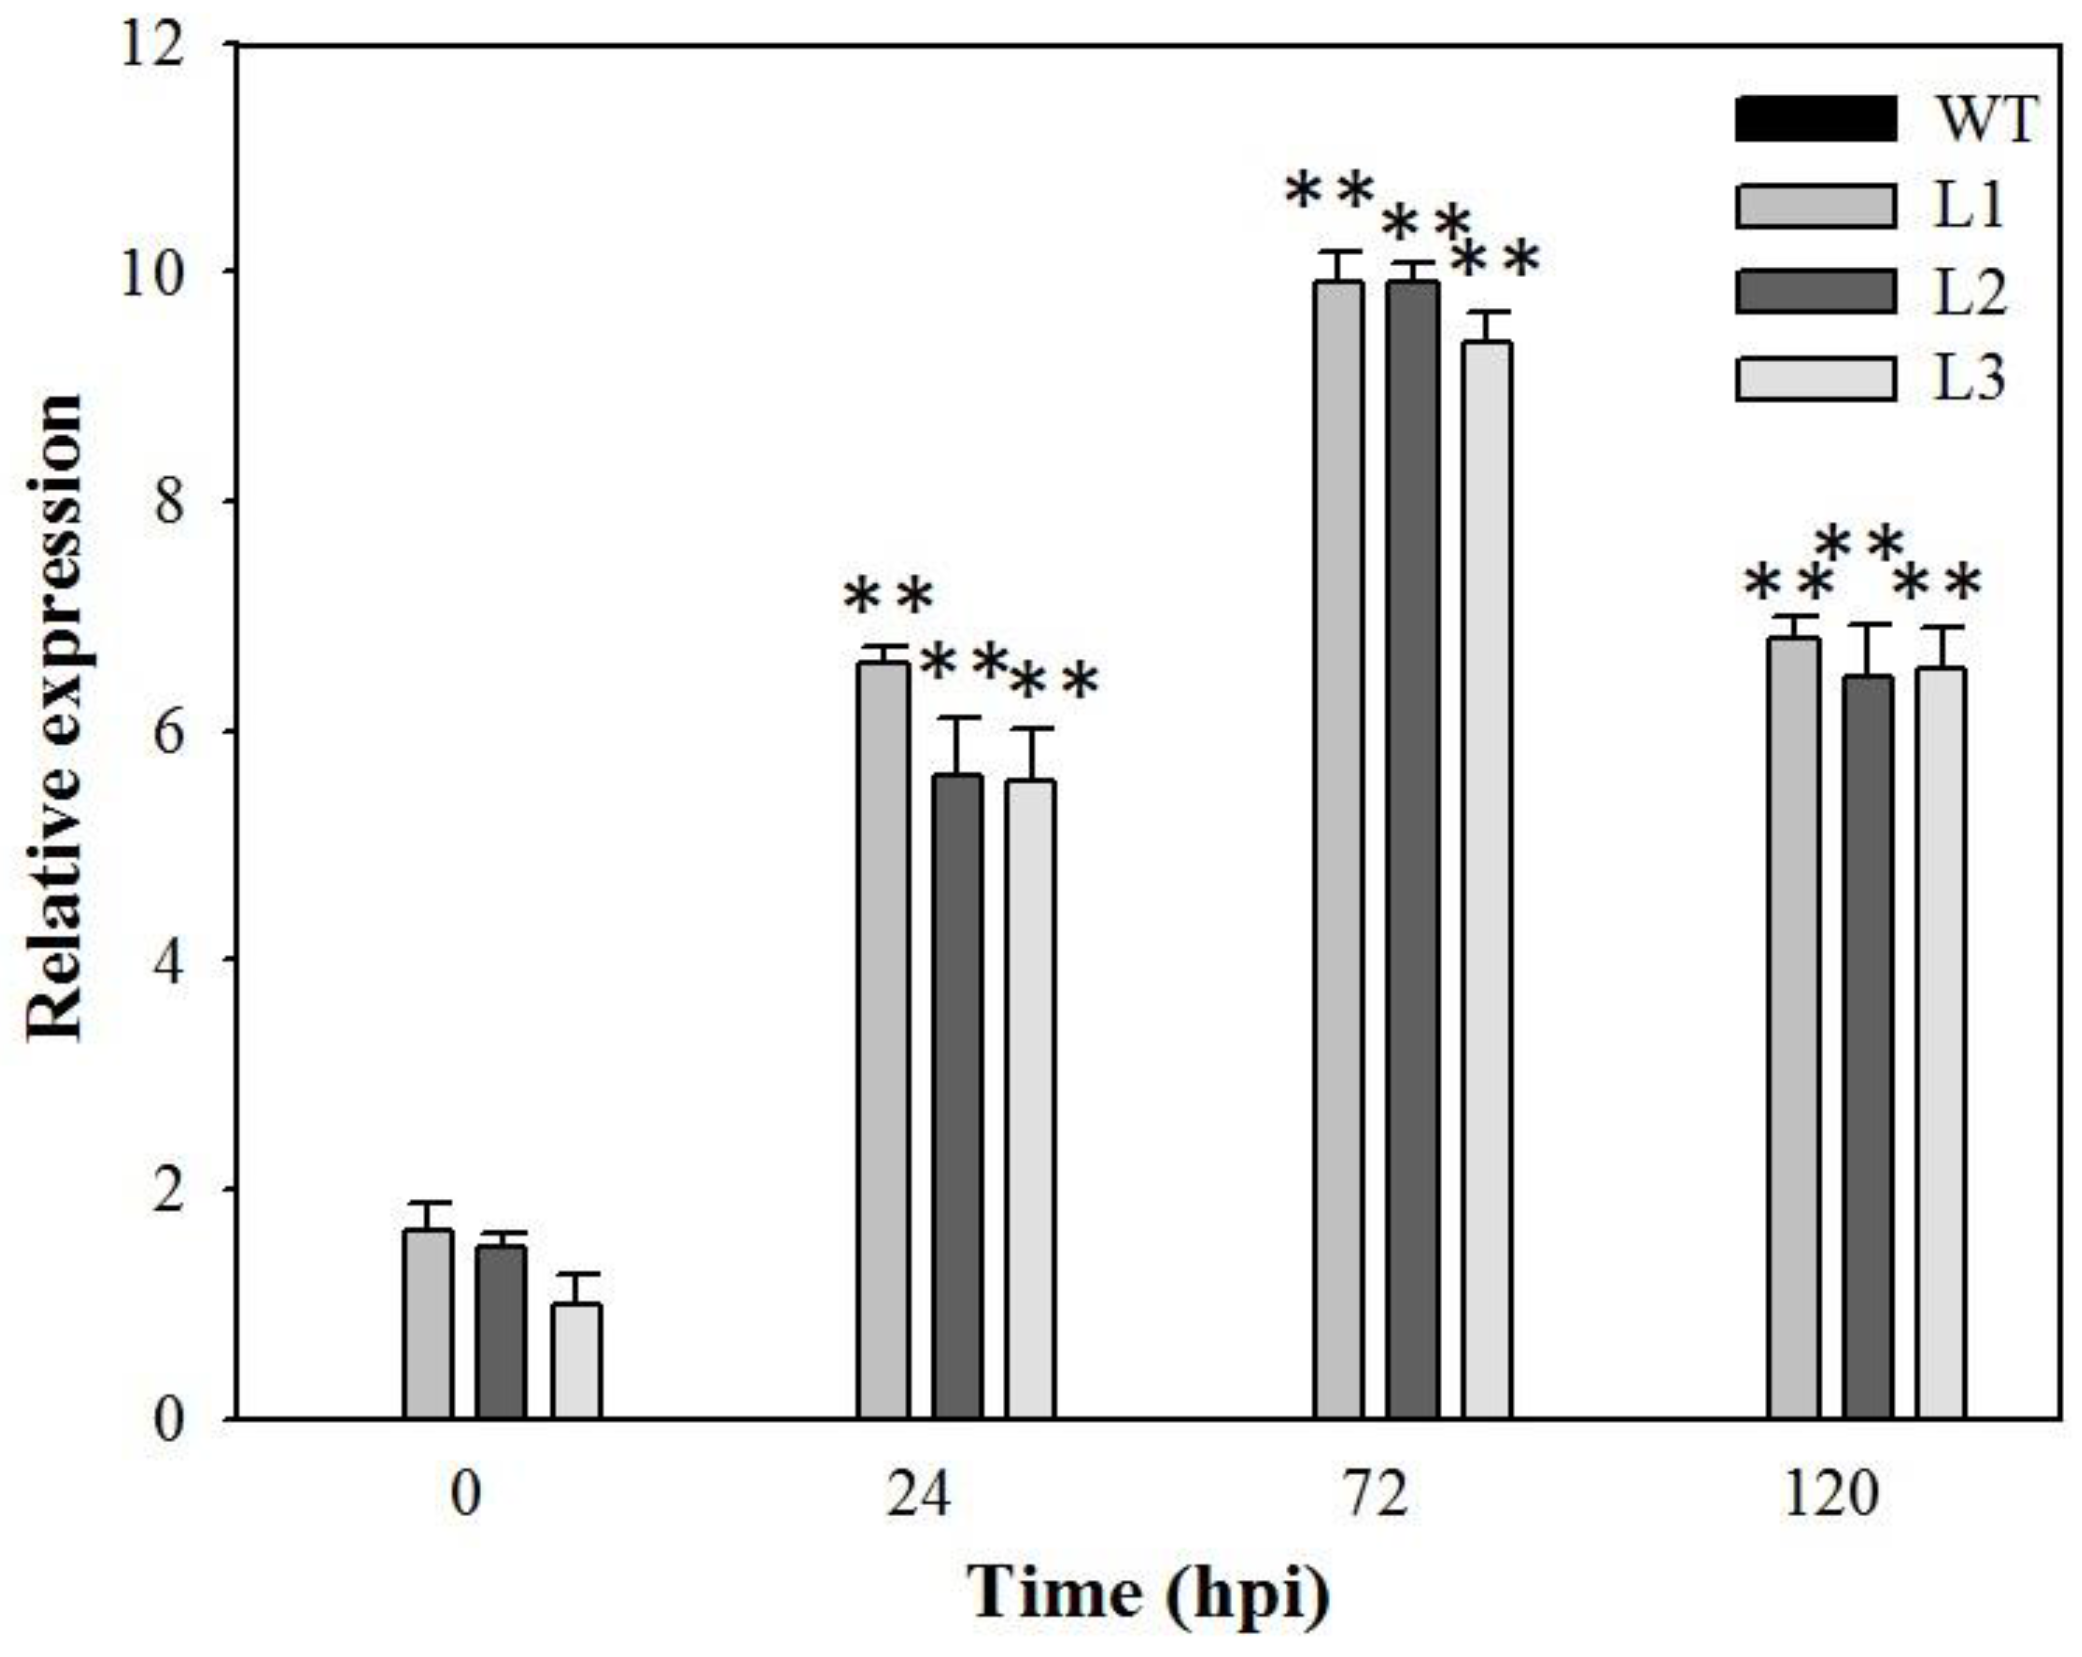
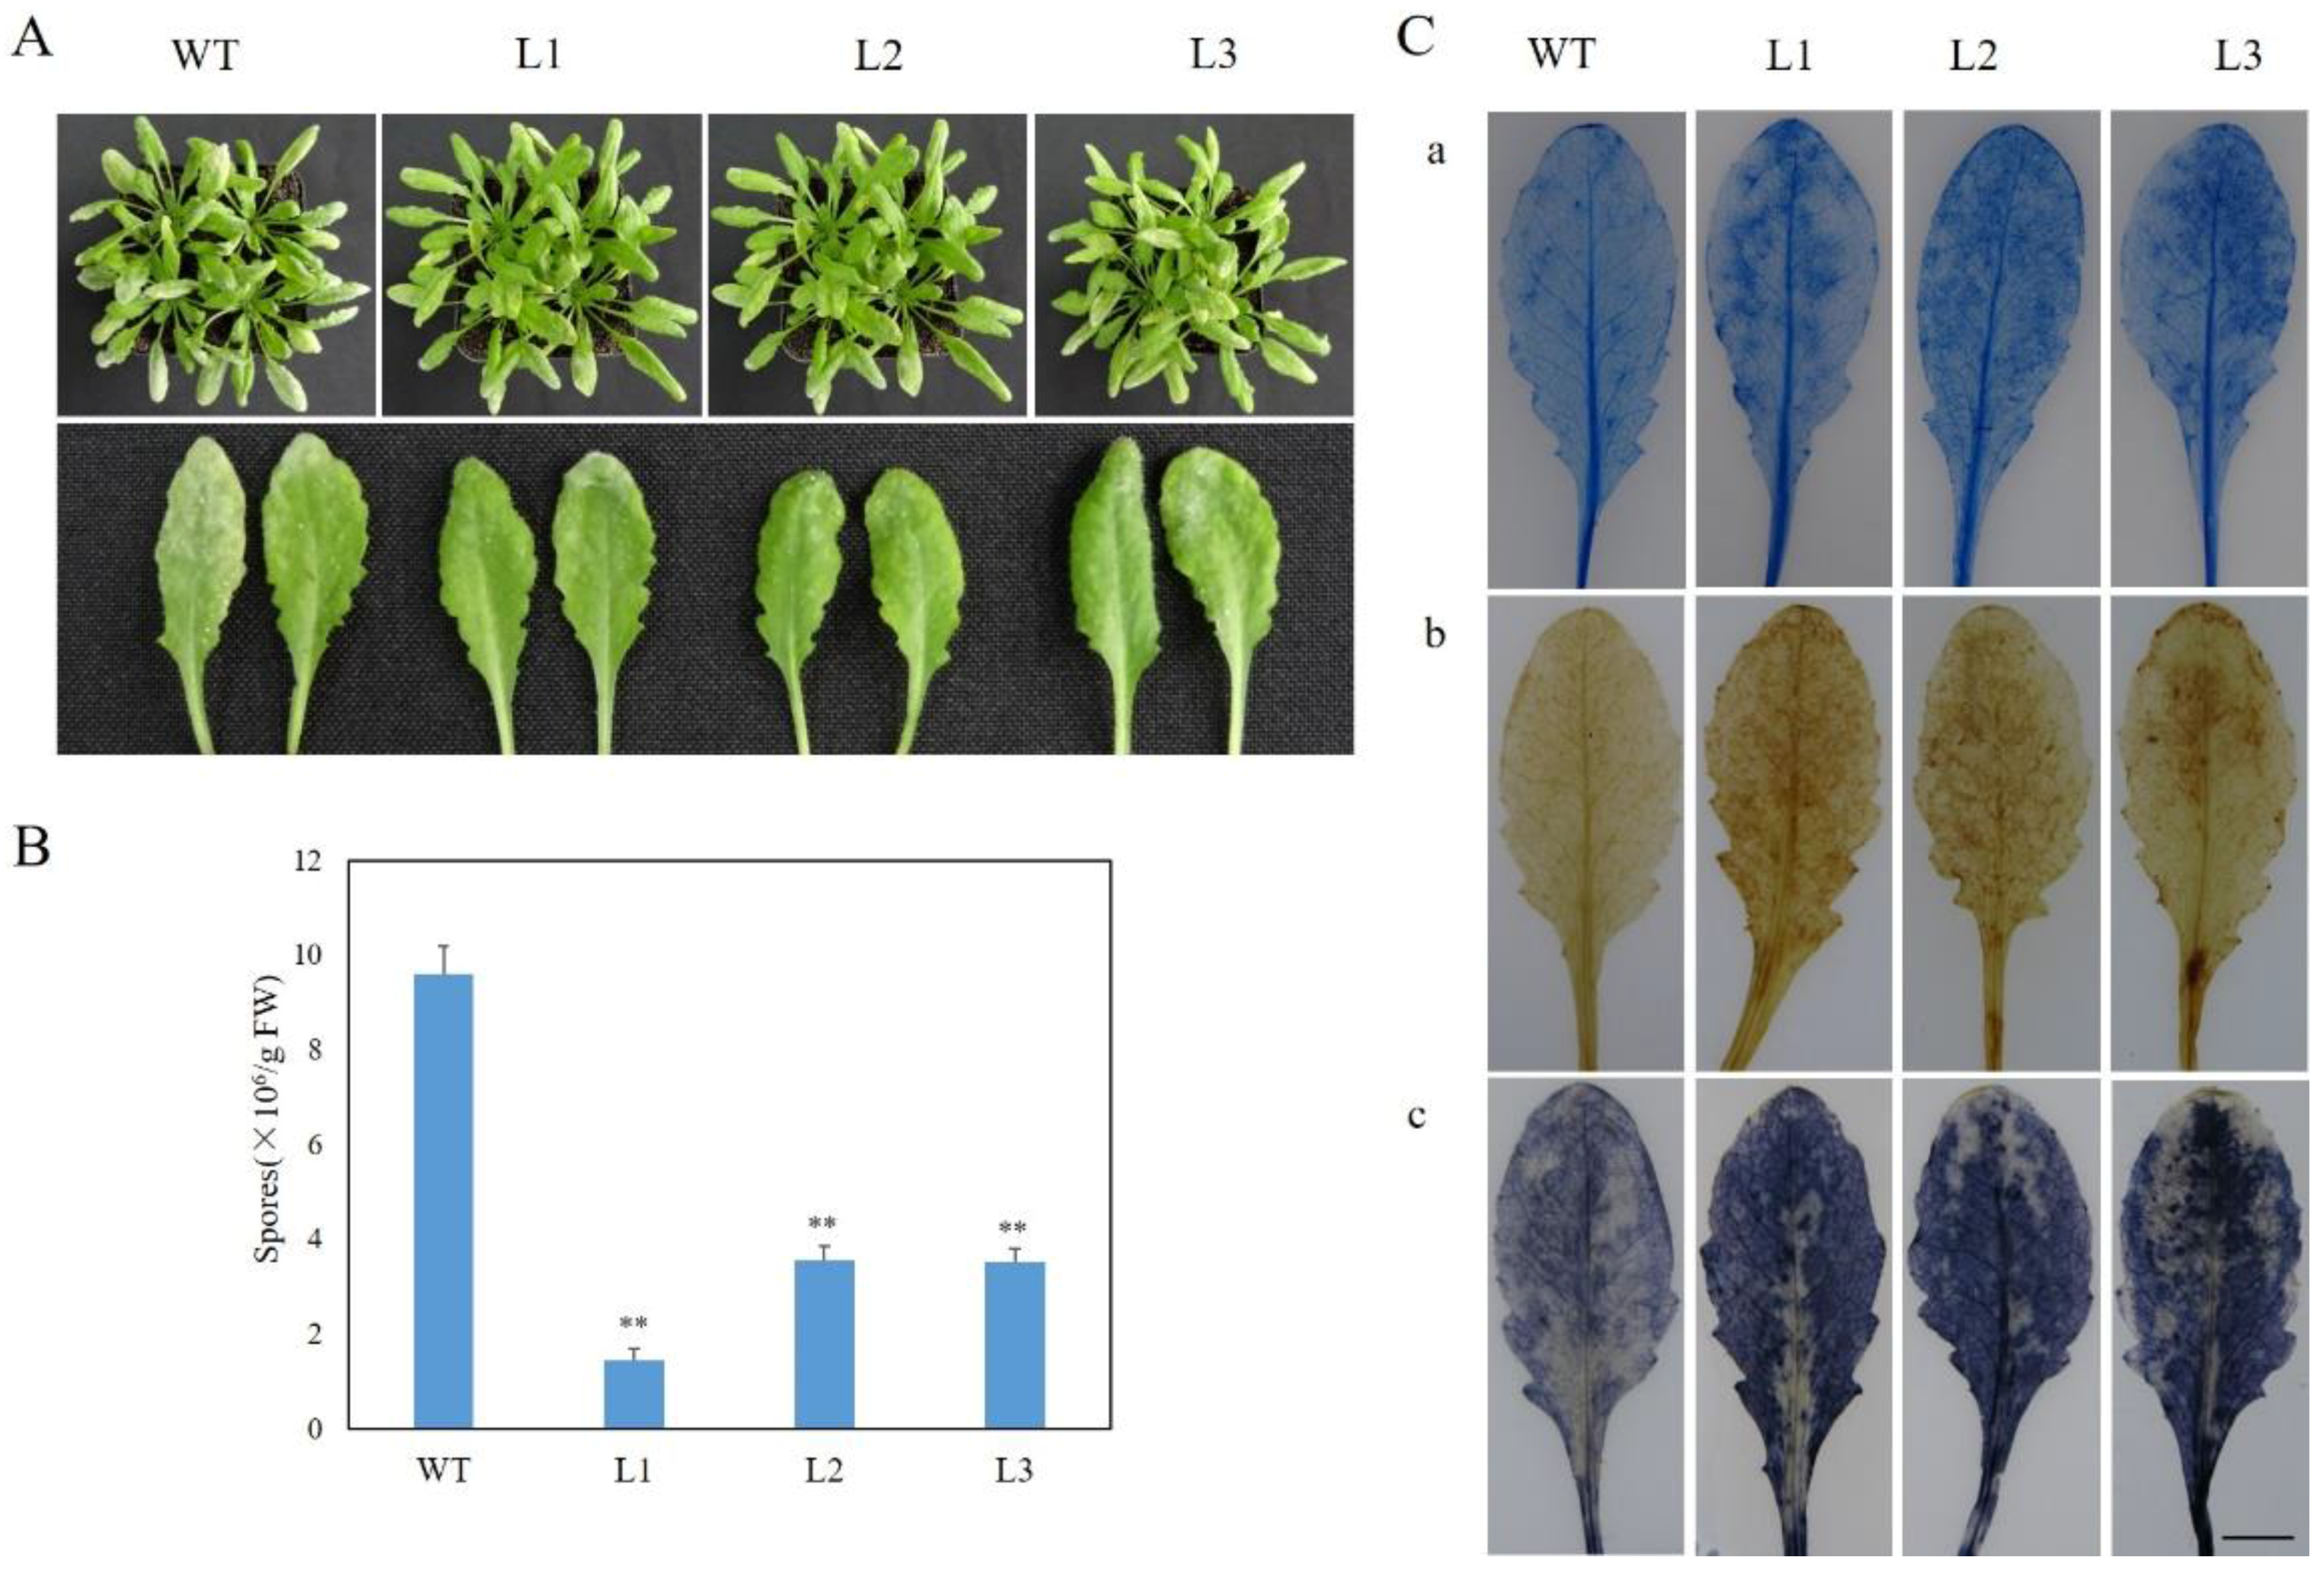
2.3. Expression of VaSTS19 in Arabidopsis Increases Resistance to Powdery Mildew

To evaluate the phenotypic response of VaSTS19-expressing lines to powdery mildew, three transgenic Arabidopsis lines and a representative nontransgenic control line were inoculated with powdery mildew, and disease symptoms were monitored. As shown in Figure 3A, nontransgenic plants displayed obvious disease symptoms within seven days post inoculation, with most of infected leaves covered with white powder. In contrast, transgenic plants exhibited only a few leaves with white powder at 7 dpi (Figure 3A). The number of spores per unit weight of leaf was lower in transgenic lines compared to nontransgenic control plants at 5 dpi (Figure 3B). To observe the accumulation of dead cells and active oxygen, we carried out histochemical staining assay with trypan blue, nitro blue tetrazolium (NBT), and diaminobenzidine (DAB). Transgenic plants showed extensive cell death, while nontransgenic plants displayed only fragmented cell death and limited reactive oxygen accumulation on leaves (Figure 3C). These results suggested that expression of VaSTS19 in Arabidopsis enhances resistance to powdery mildew.

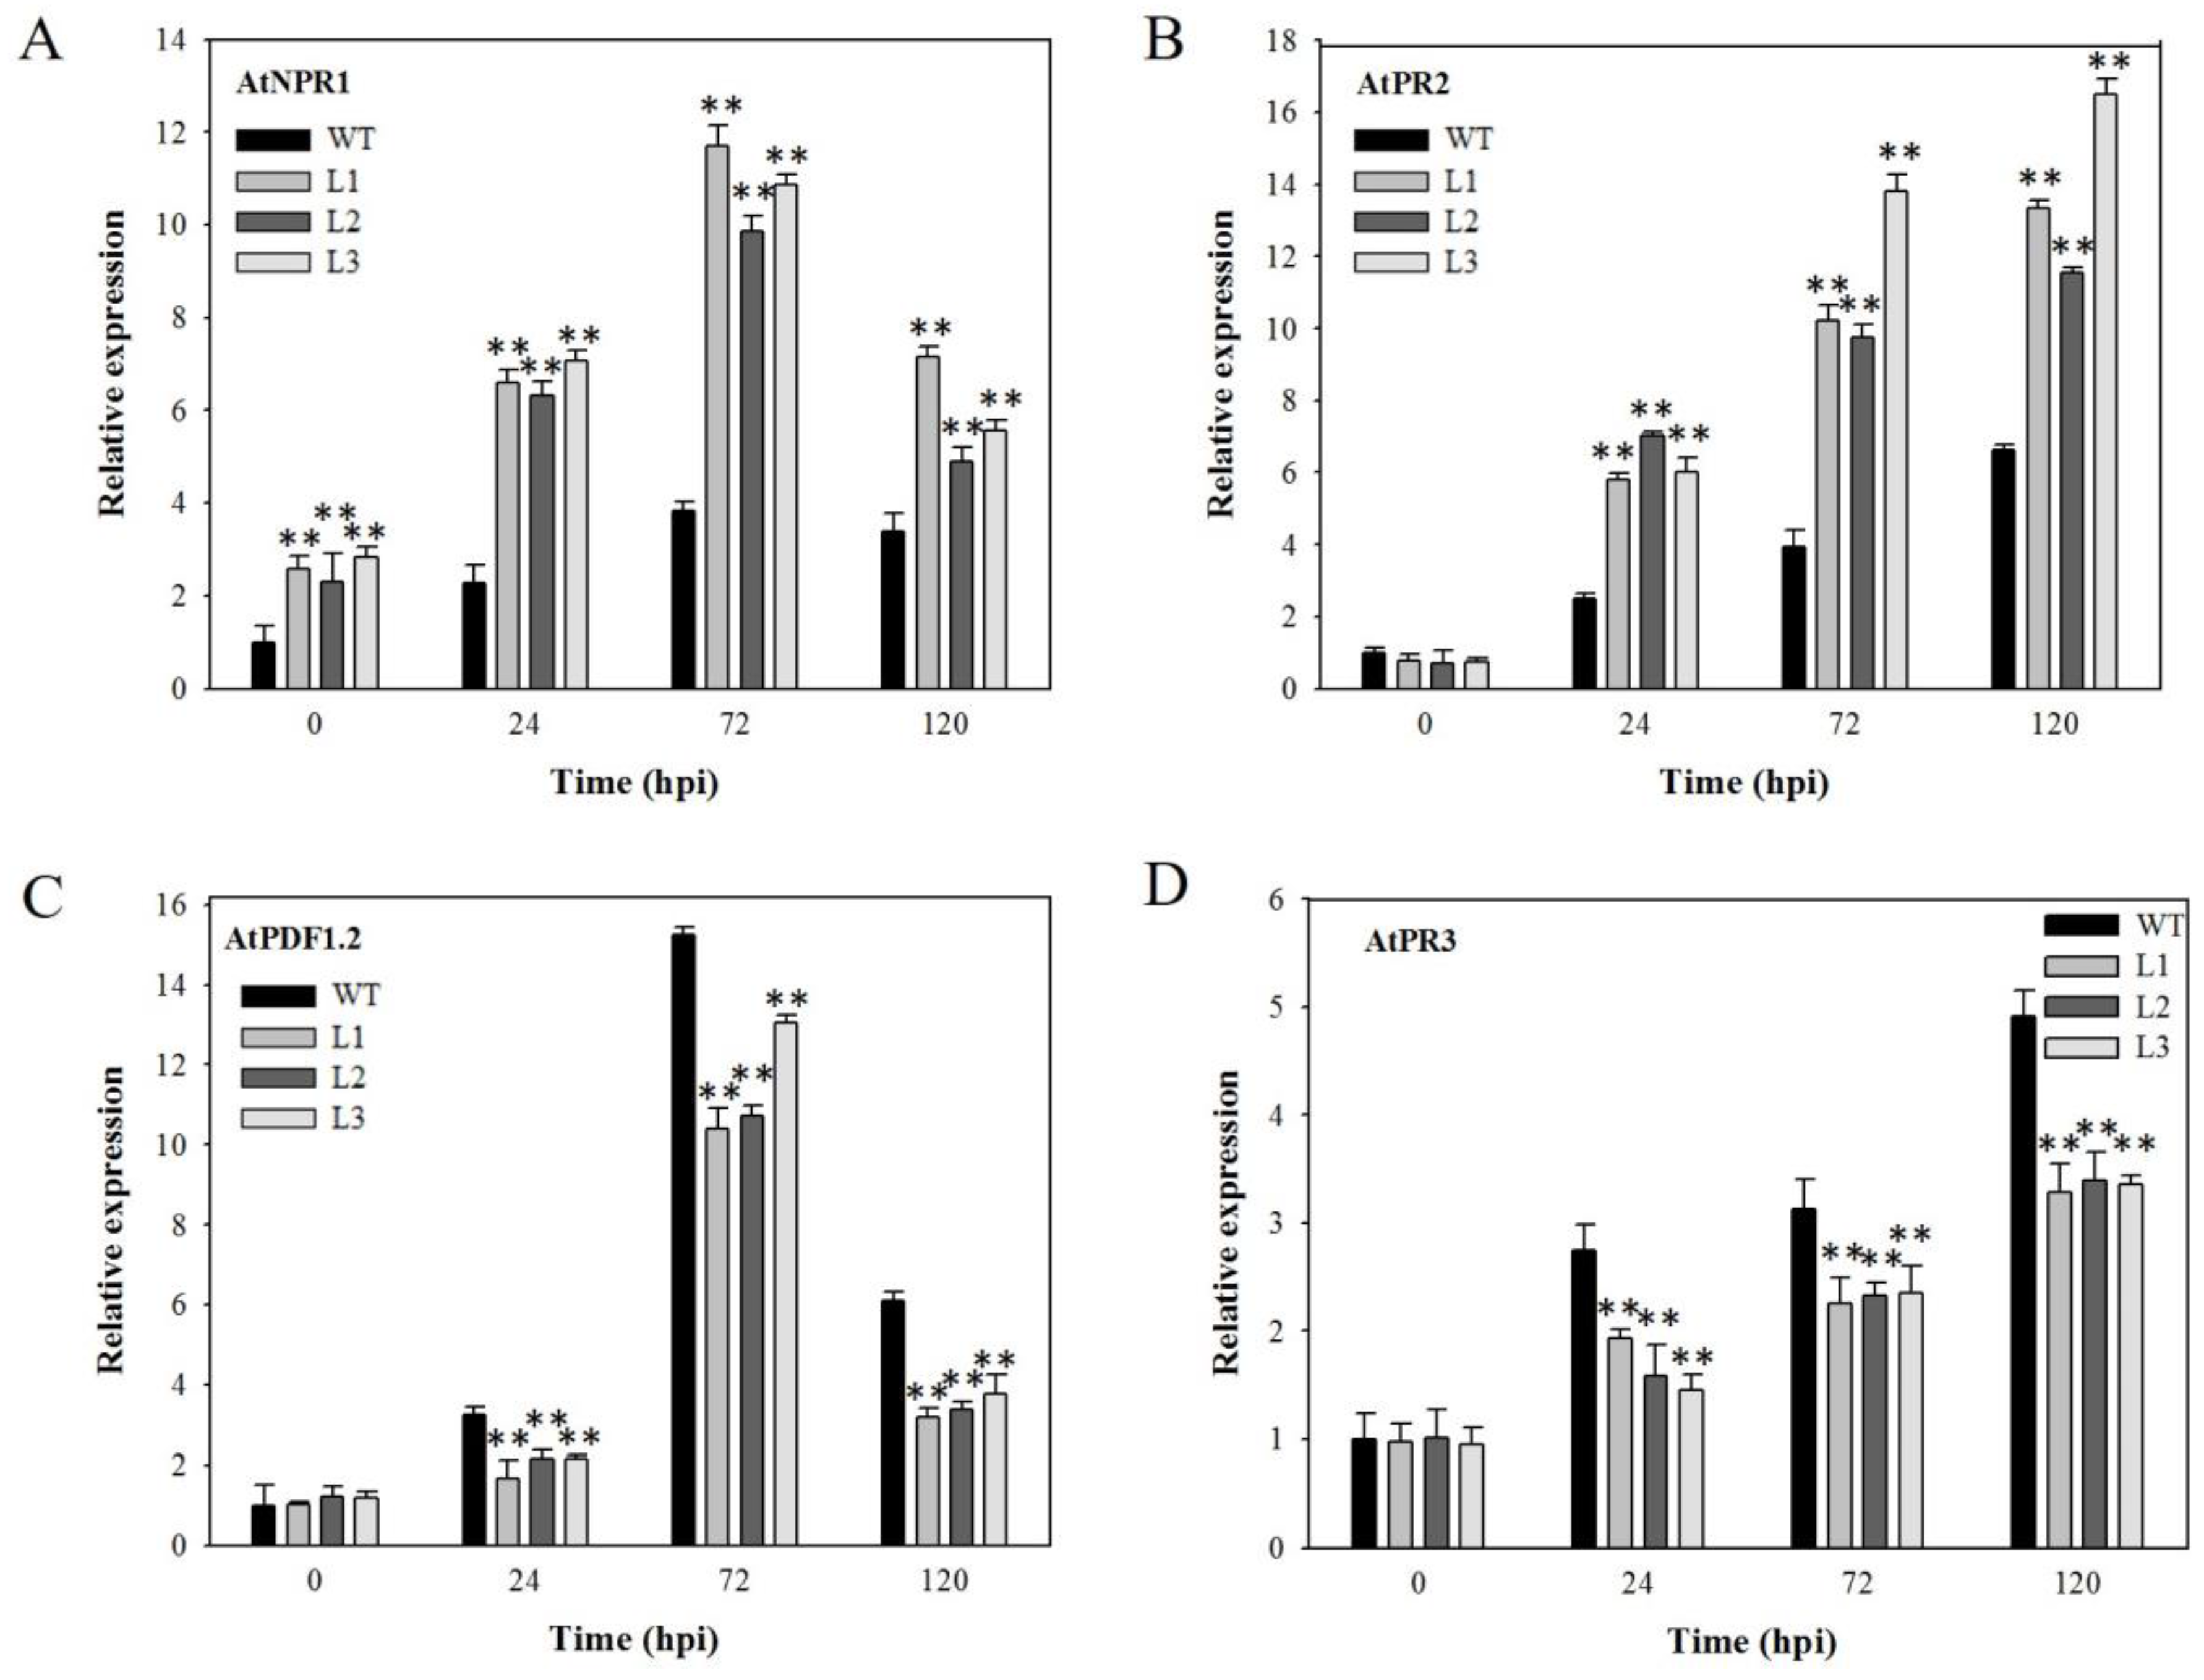
2.4. Expression Analysis of Disease-Resistance-Related Genes in VaSTS19-Expressing Arabidopsis Lines Following Powdery Mildew Infection

SA- and JA-dependent signaling pathways play a large role in defense against pathogens [27]. Therefore, we evaluated the expression levels of four defense-related genes in four-week-old plants at 0, 24, 72, 120 hpi with powdery mildew. We found that the expression of two genes related to SA-mediated defense signaling, AtNPR1 and AtPR2, was markedly increased for both transgenic lines and nontransgenic control plants following powdery mildew inoculation, and showed greater induction in transgenic plants compared to nontransgenic controls (Figure 4A,B). Conversely, the expression of two genes that are actively involved in JA-mediated defense signaling, AtPR3 and AtPDF1.2, was increased at 24, 72, and 120 hpi for both transgenic and nontransgenic plants, but their expression levels in transgenic plants were lower than those in controls at the same point in time following inoculation (Figure 4C,D).

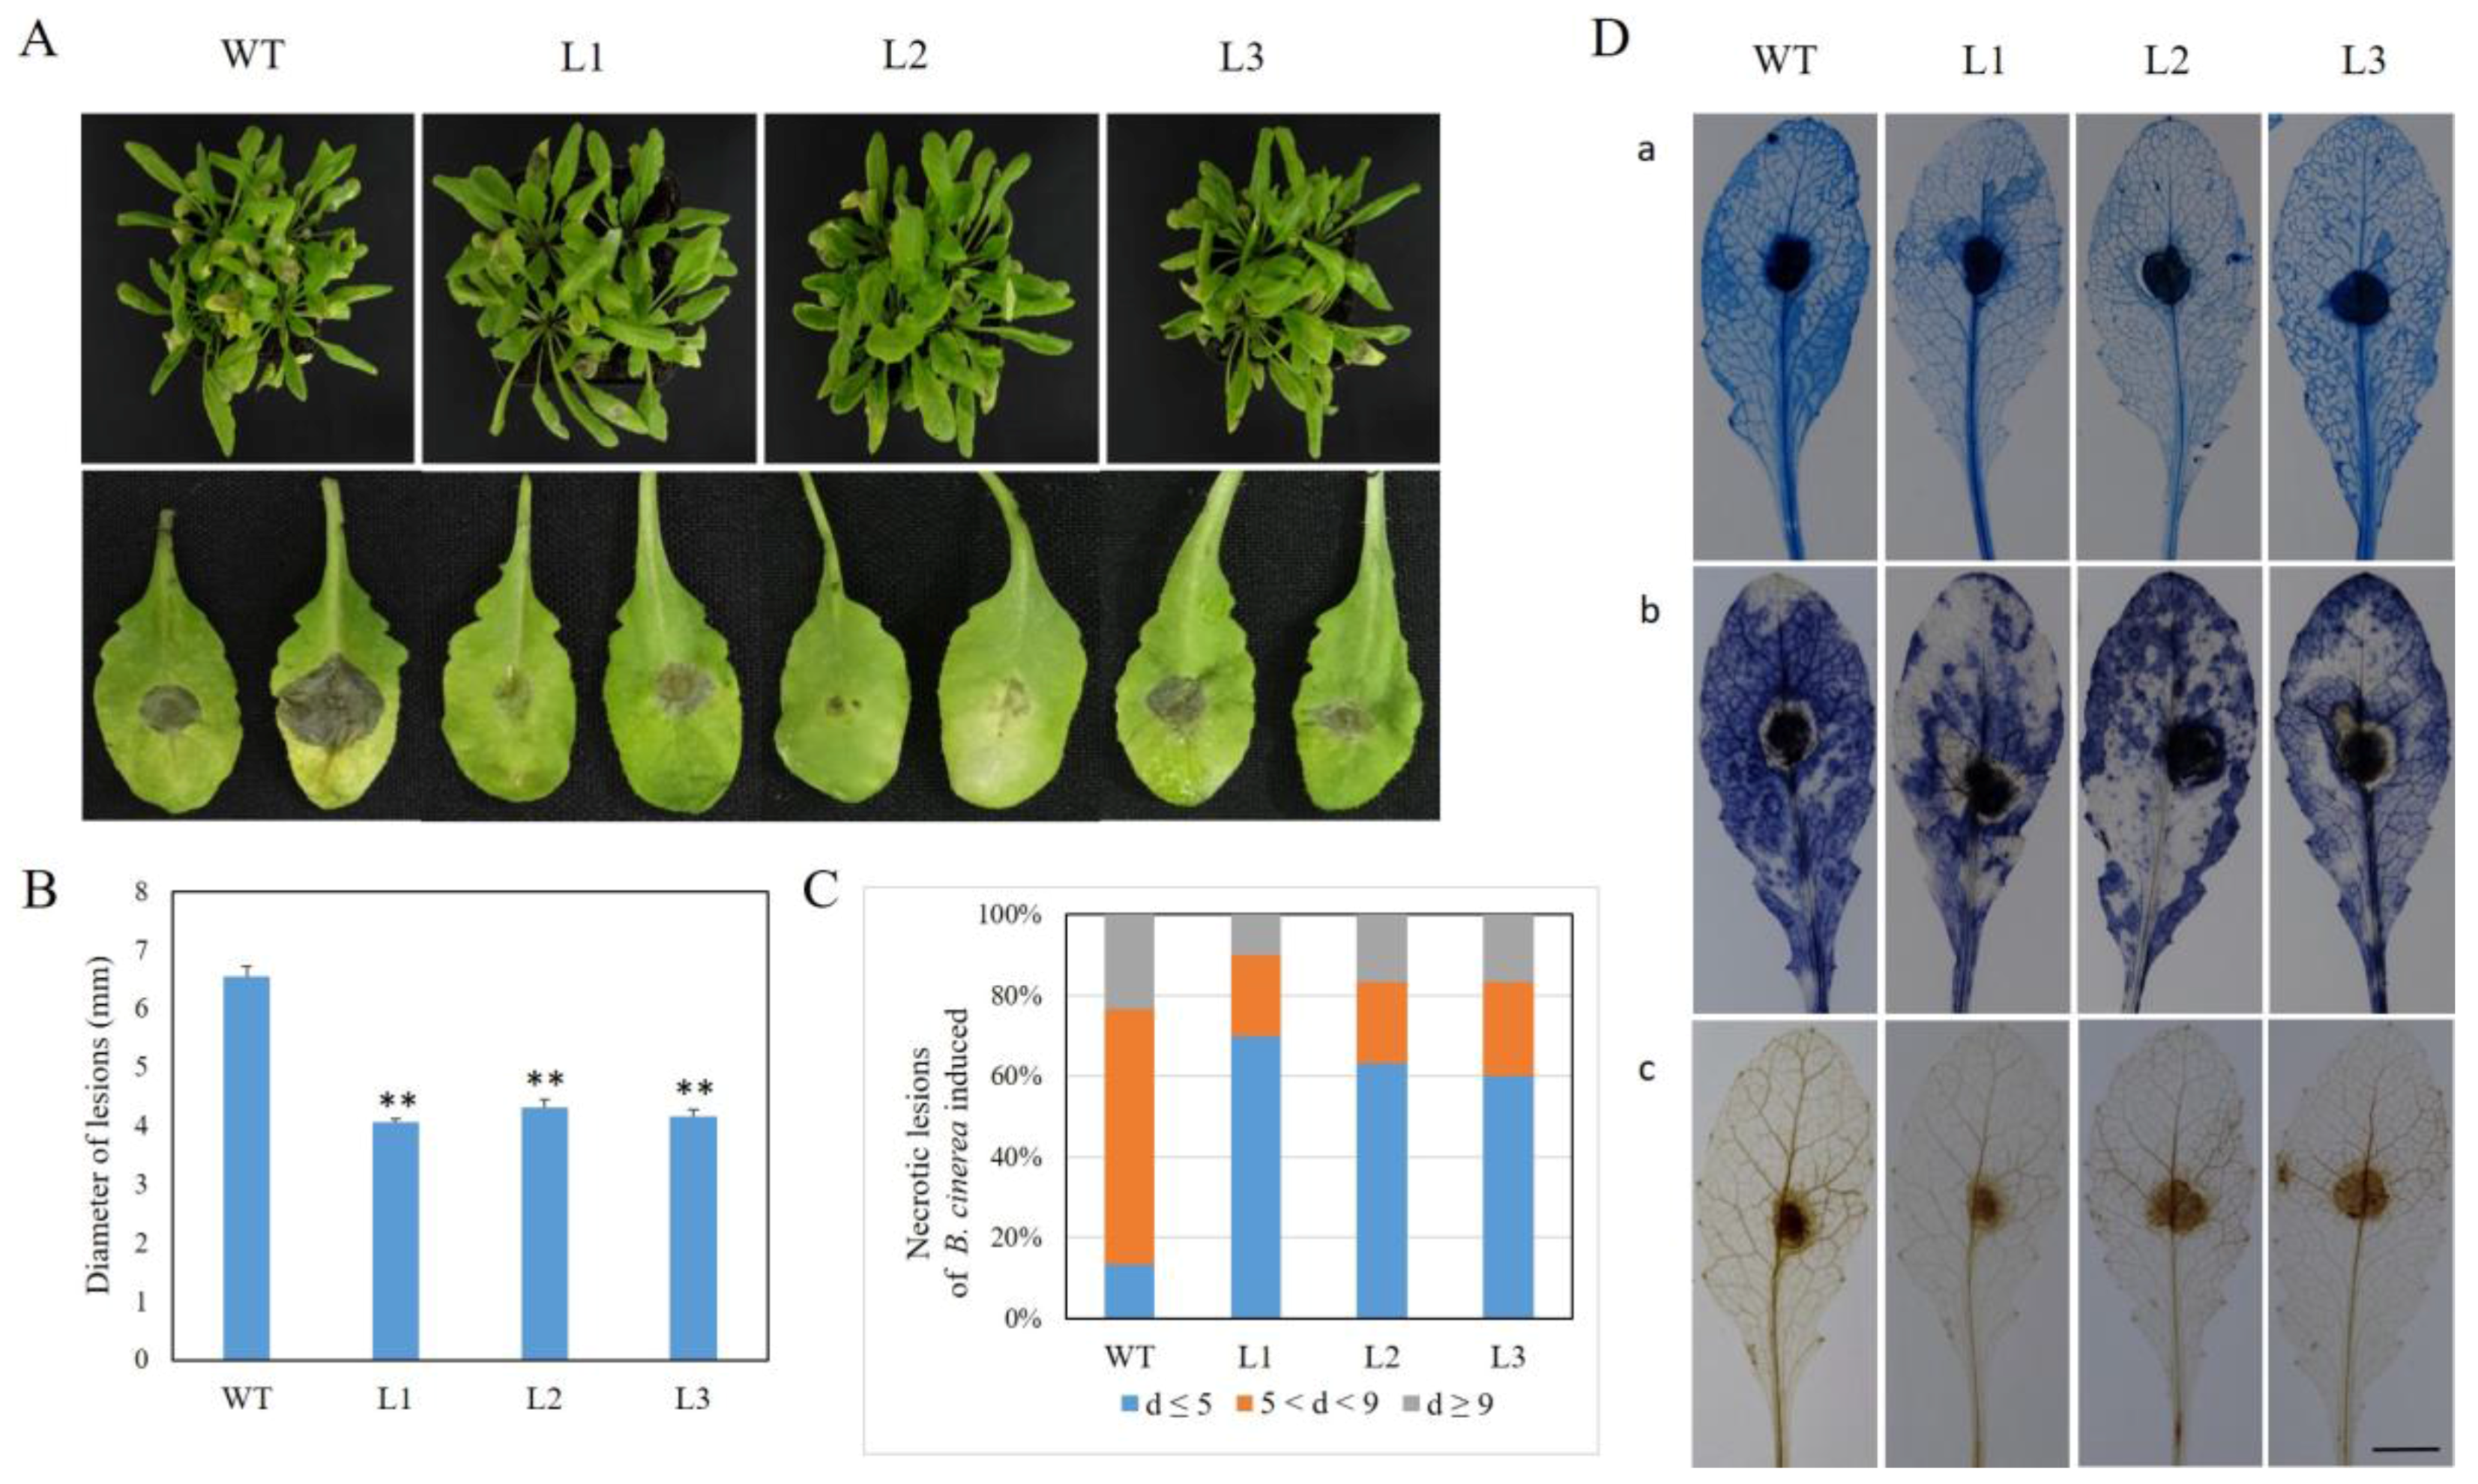
2.5. Expression of VaSTS19 in Arabidopsis Enhances Resistance to B. cinerea

To assess the function of VaSTS19 defense to B. cinerea, five-week-old plants were inoculated with B. cinerea spore suspension. By 48 hpi, we observed necrotizing, water-soaked lesions in both transgenic and nontransgenic lines. By 72 hpi, necrotic symptoms increased in severity in nontransgenic plants. The lesions of transgenic plants were generally less transparent and had a brown color, rather than the black and water-soaked appearance of the control plants (Figure 5A). Lesion size and the proportion of medium and large lesions was lower in transgenic plants (Figure 5B,C). Cell death and basal levels of superoxide were monitored by trypan blue, DAB, and NBT staining in rosette leaves. VaSTS19-expressing plants generated lower levels of superoxide and showed lower cell death, in comparison to nontransgenic control plants (Figure 5D). Based on these results, we concluded that VaSTS19 transgenic lines showed increased defense responses to B. cinerea.

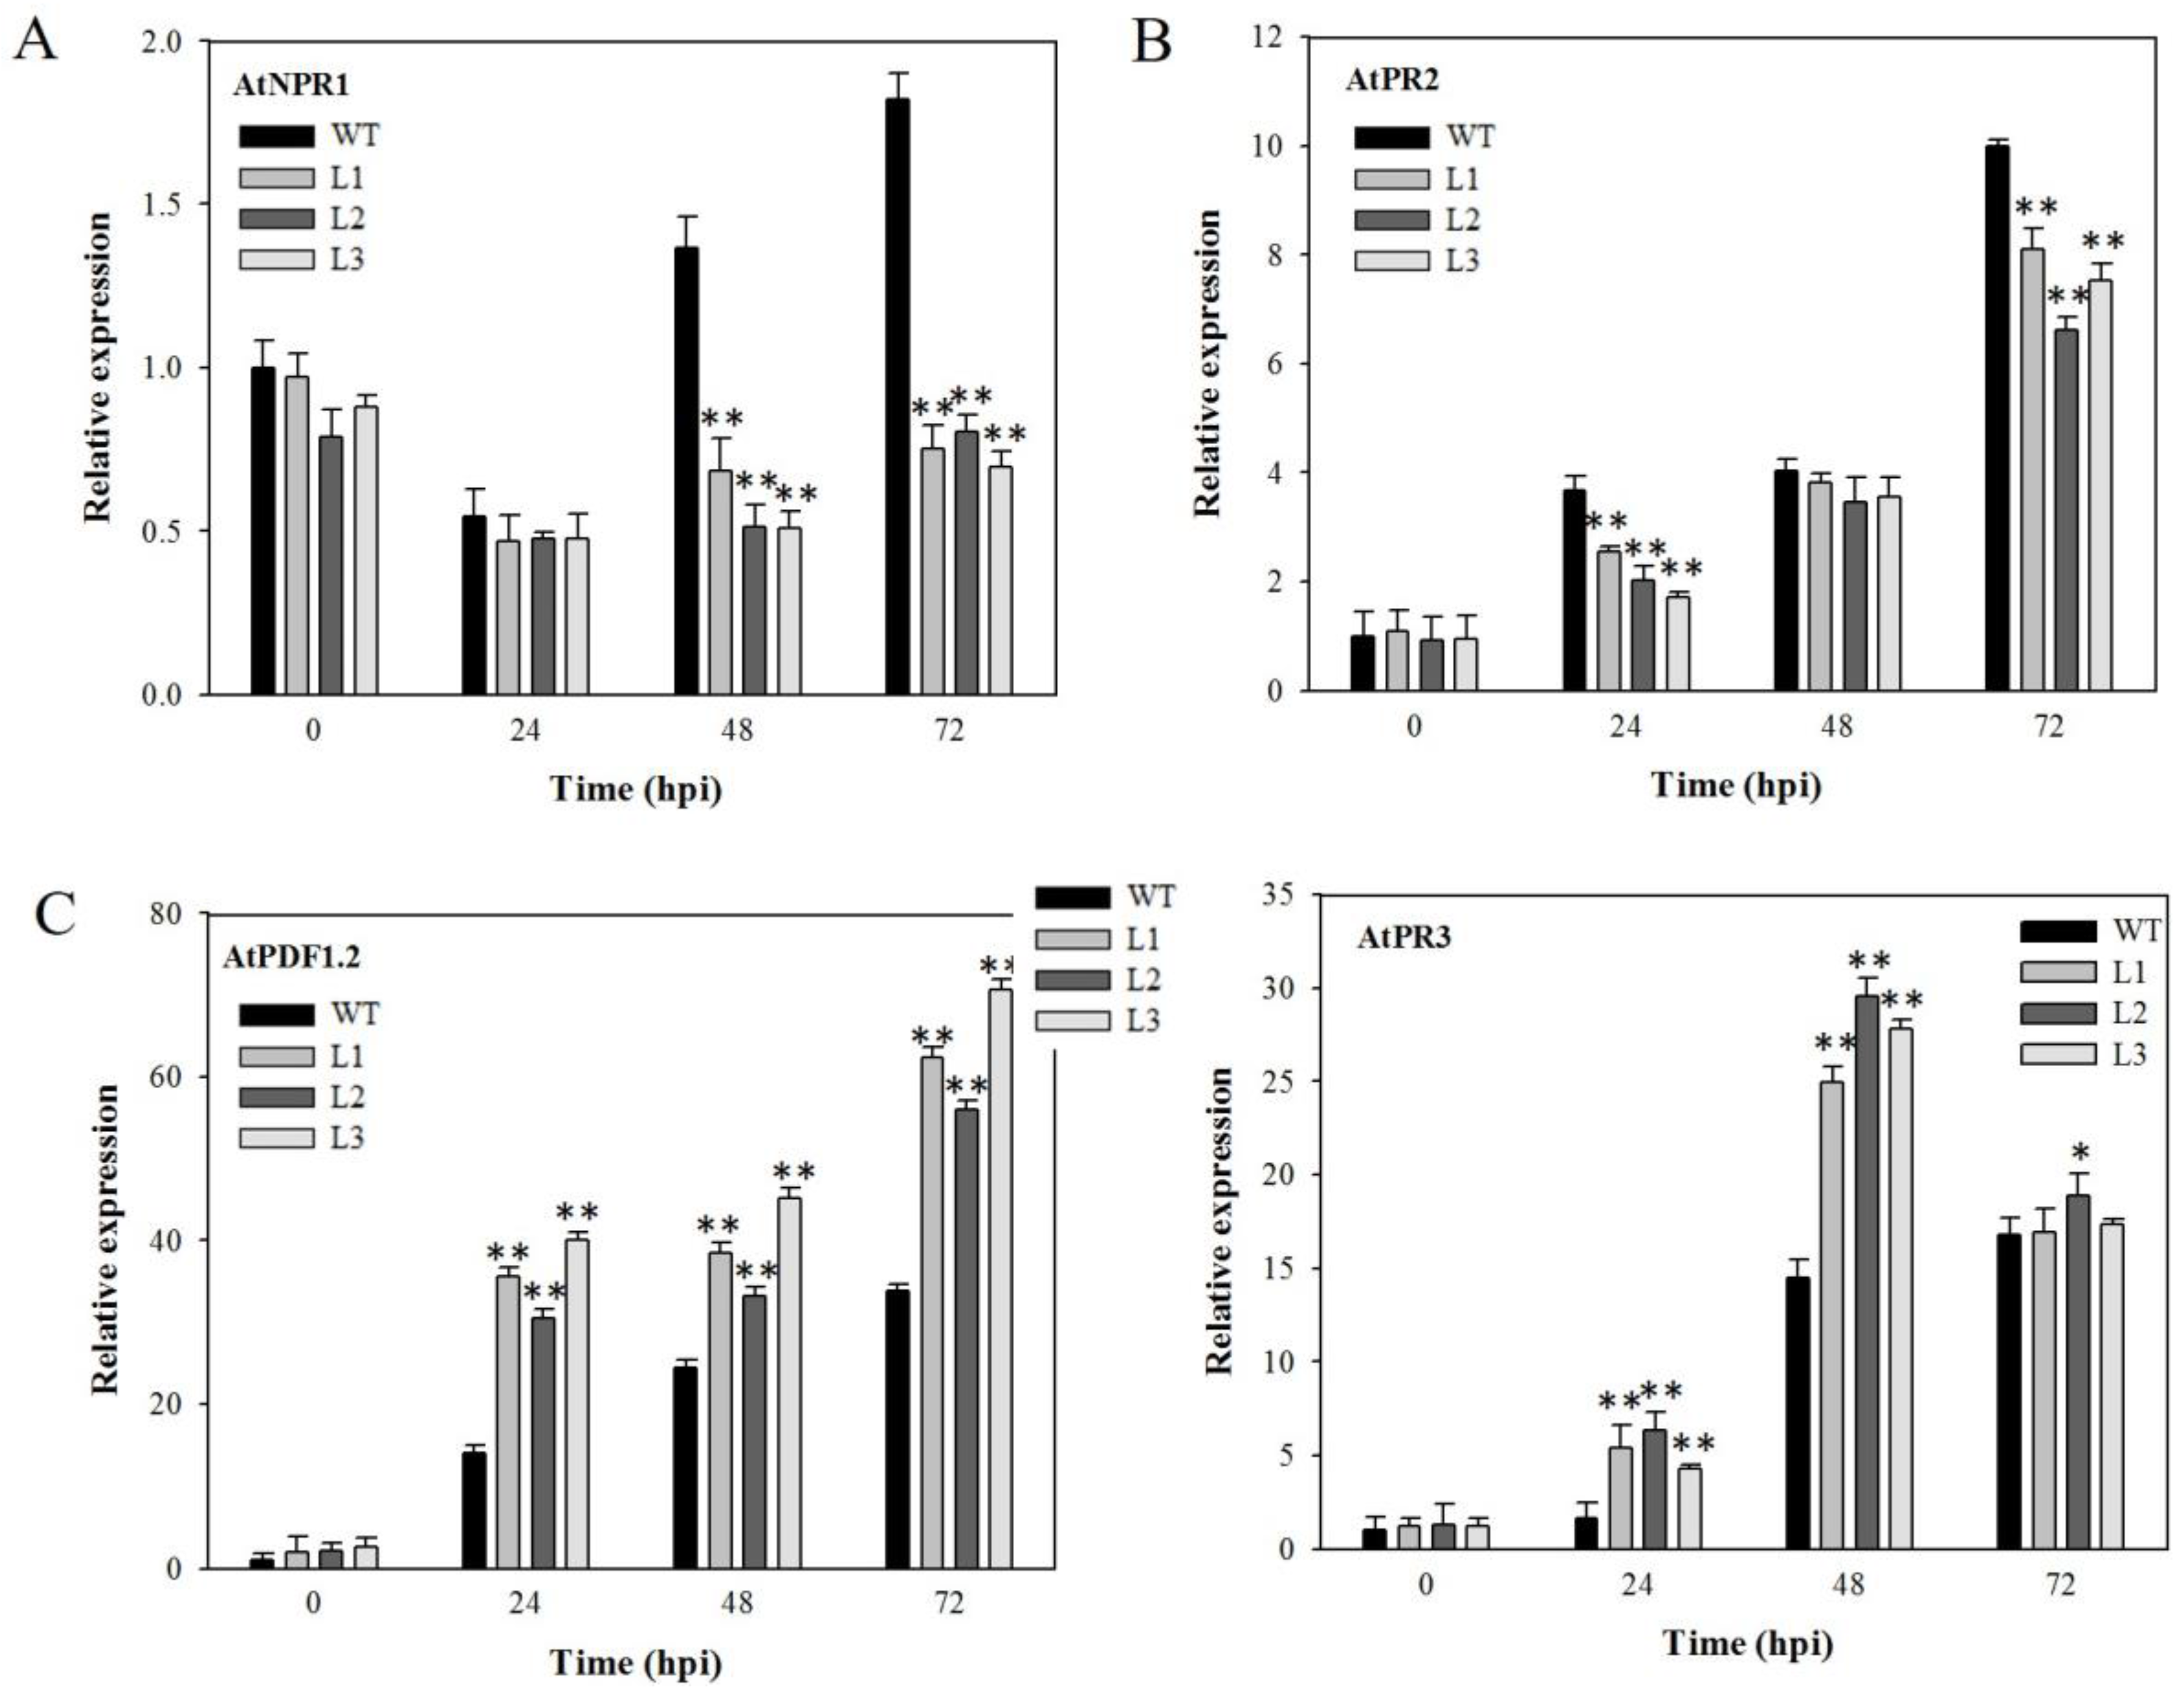
2.6. Expression Analysis of Disease-Resistance-Related Genes in VaSTS19-Expressing Plants Following B. cinerea Infection

To elucidate the effect of VaSTS19 expression on SA- and JA-signal pathways, we monitored the expression of SA- and JA-responsive genes following B. cinerea infection at 0, 24, 48, 72 hpi. The expression level of AtNPR1 dropped in both transgenic and nontransgenic plants at 24 hpi, and then was induced in control plants, but not transgenic lines. From 48 hpi onward, the expression of AtNPR1 was lower in transgenic lines than in nontransgenic control plants (Figure 6A). We also found that transcript levels of AtPR2 were induced in both transgenic and nontransgenic plants following B. cinerea inoculation, and peaked at 72 hpi. At 24 and 72 hpi, the transcript levels of AtPR2 in transgenic lines fell to lower levels than in nontransgenic control plants, but there was no difference between transgenic and nontransgenic lines at 48 hpi (Figure 6B). The transcript levels of AtPDF1.2 and AtPR3 were also up-regulated following B. cinerea infection in both transgenic and nontransgenic control plants and were higher in the transgenic lines compared to nontransgenic control plants (Figure 6C,D).

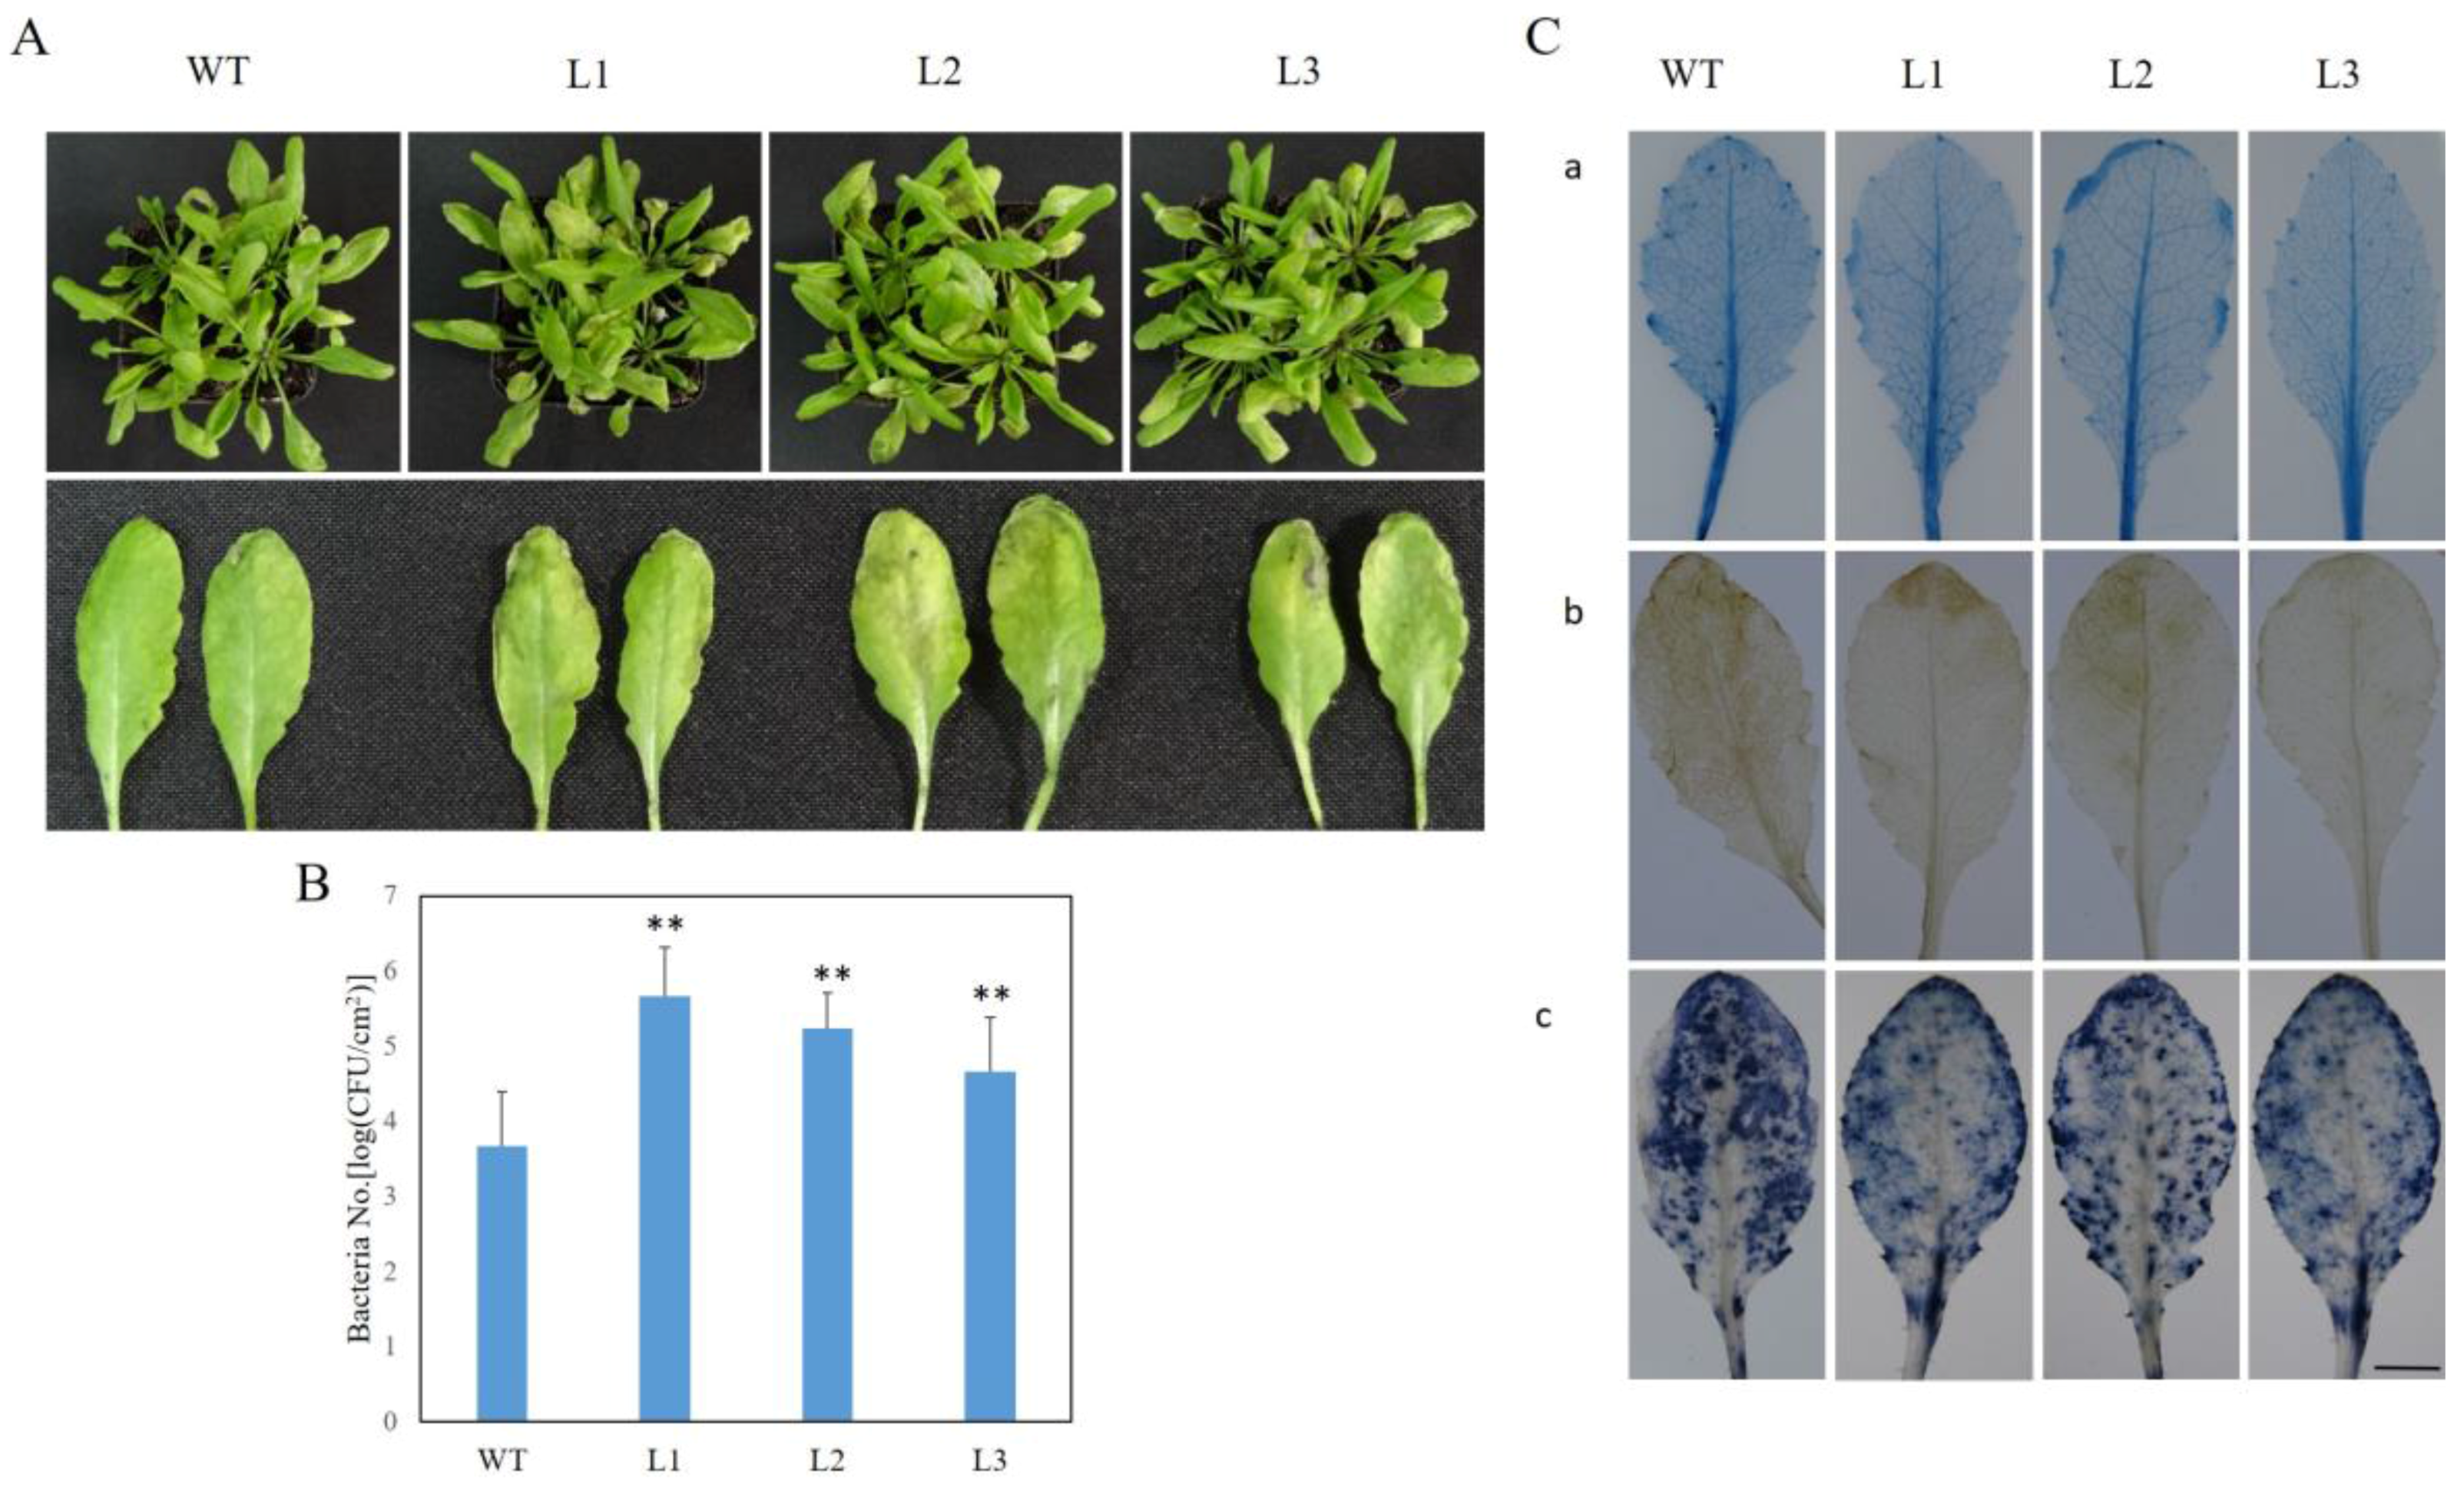
2.7. VaSTS19-Expressing Arabidopsis Lines Show Decreased Resistance to PstDC3000

To evaluate the effect of VaSTS19 expression on bacterial pathogen resistance, transgenic and nontransgenic plants were inoculated with PstDC3000. Within 1 dpi, leaves of transgenic lines became yellow and capreolary, and showed yellowish necrosis on surfaces. By 3 dpi, part of the leaves gradually wilted and senesced. Nontransgenic plants showed no apparent disease symptoms although some minor yellowish necrosis was observed (Figure 7A). Results of colony counts revealed that bacterial numbers in transgenic lines were significantly higher compared with in nontransgenic plants (Figure 7B). Staining of infected rosette leaves with trypan blue, DAB, and NBT at 3 dpi revealed small clusters of dead cells and localized superoxide production in transgenic plants, while nontransgenic plants generated high levels of superoxide and showed pervasive cell death (Figure 7C).

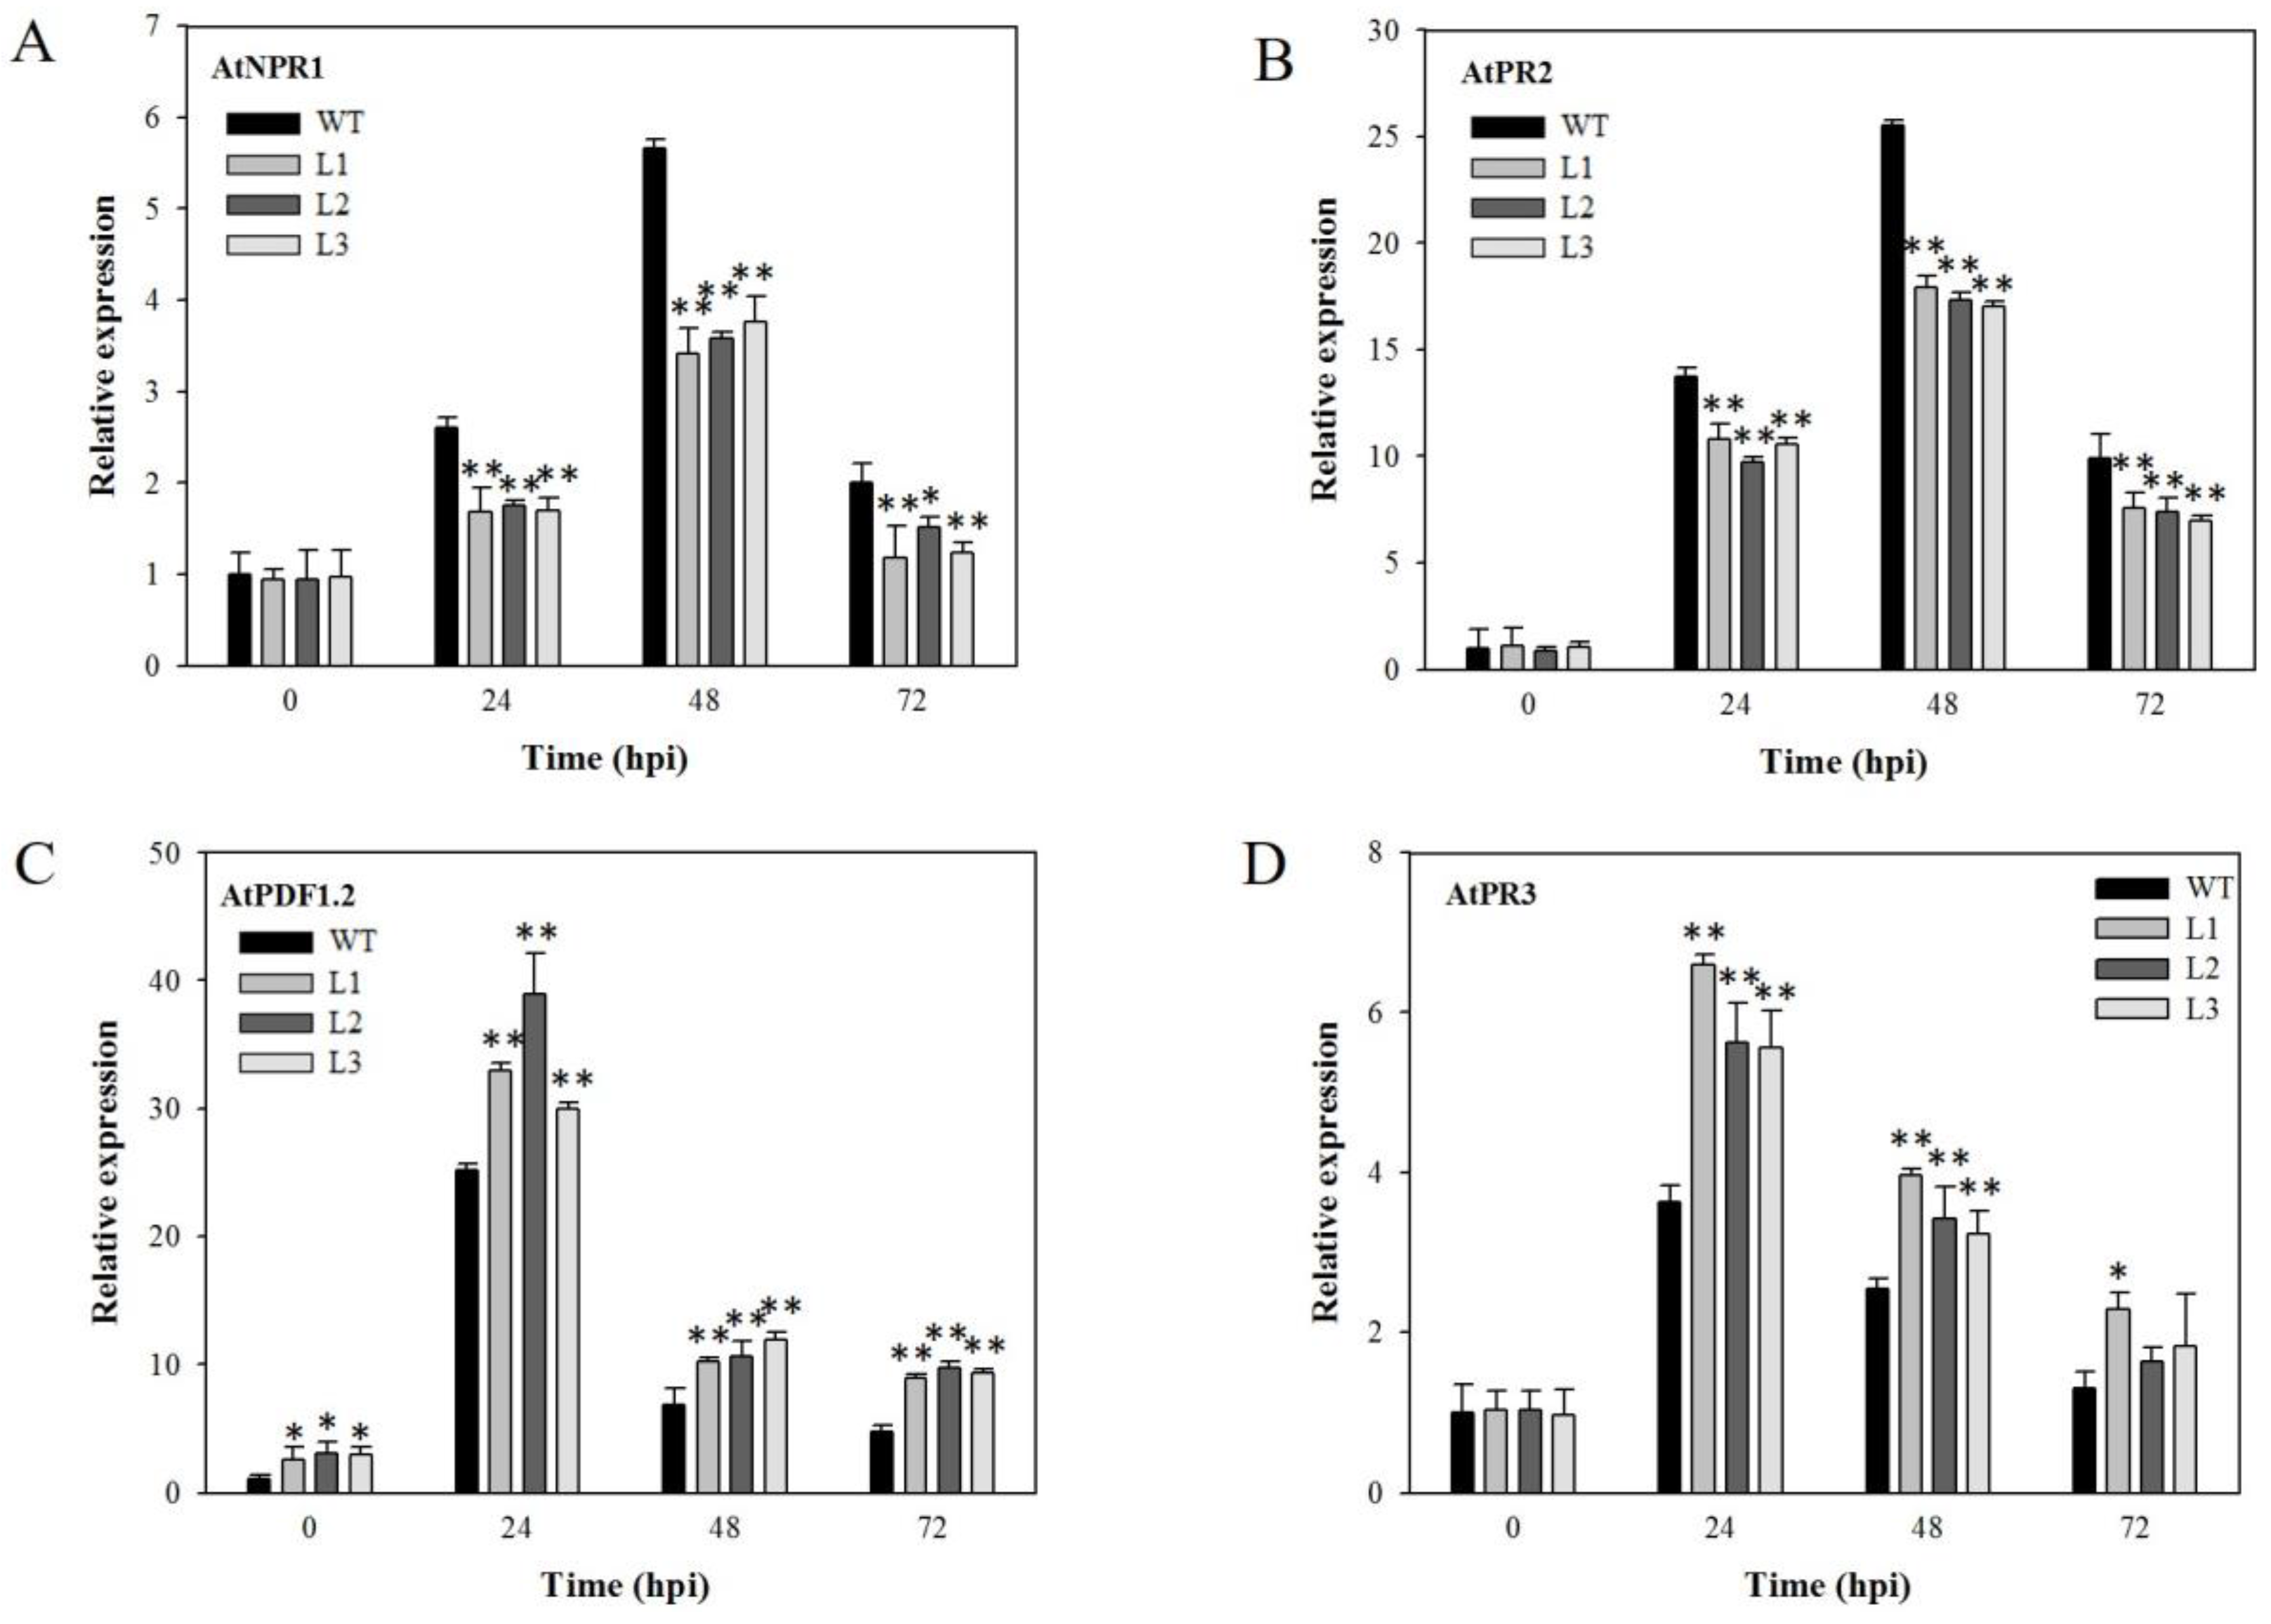
2.8. Analysis of Disease-Resistance-Related Genes in VaSTS19-Expressing Plants Following PstDC3000 Infection

We also evaluated the expression profile of four SA- and JA-responsive genes in five-week-old plants at 0, 24, 48, and 72 h following PstDC3000 infection. Transcript levels for AtNPR1 and AtPR2, as well as AtPDF1.2 and AtPR3, were increased in both transgenic and nontransgenic lines after PstDC3000 infection, and peaked at 24 or 48 hpi. The expression of AtNPR1 and AtPR2 showed an obvious decrease in transgenic lines compared to nontransgenic control plants (Figure 8A,B). Conversely, the expression of AtPDF1.2 and AtPR3 was higher in transgenic lines compared to nontransgenic control plants (Figure 8C,D).

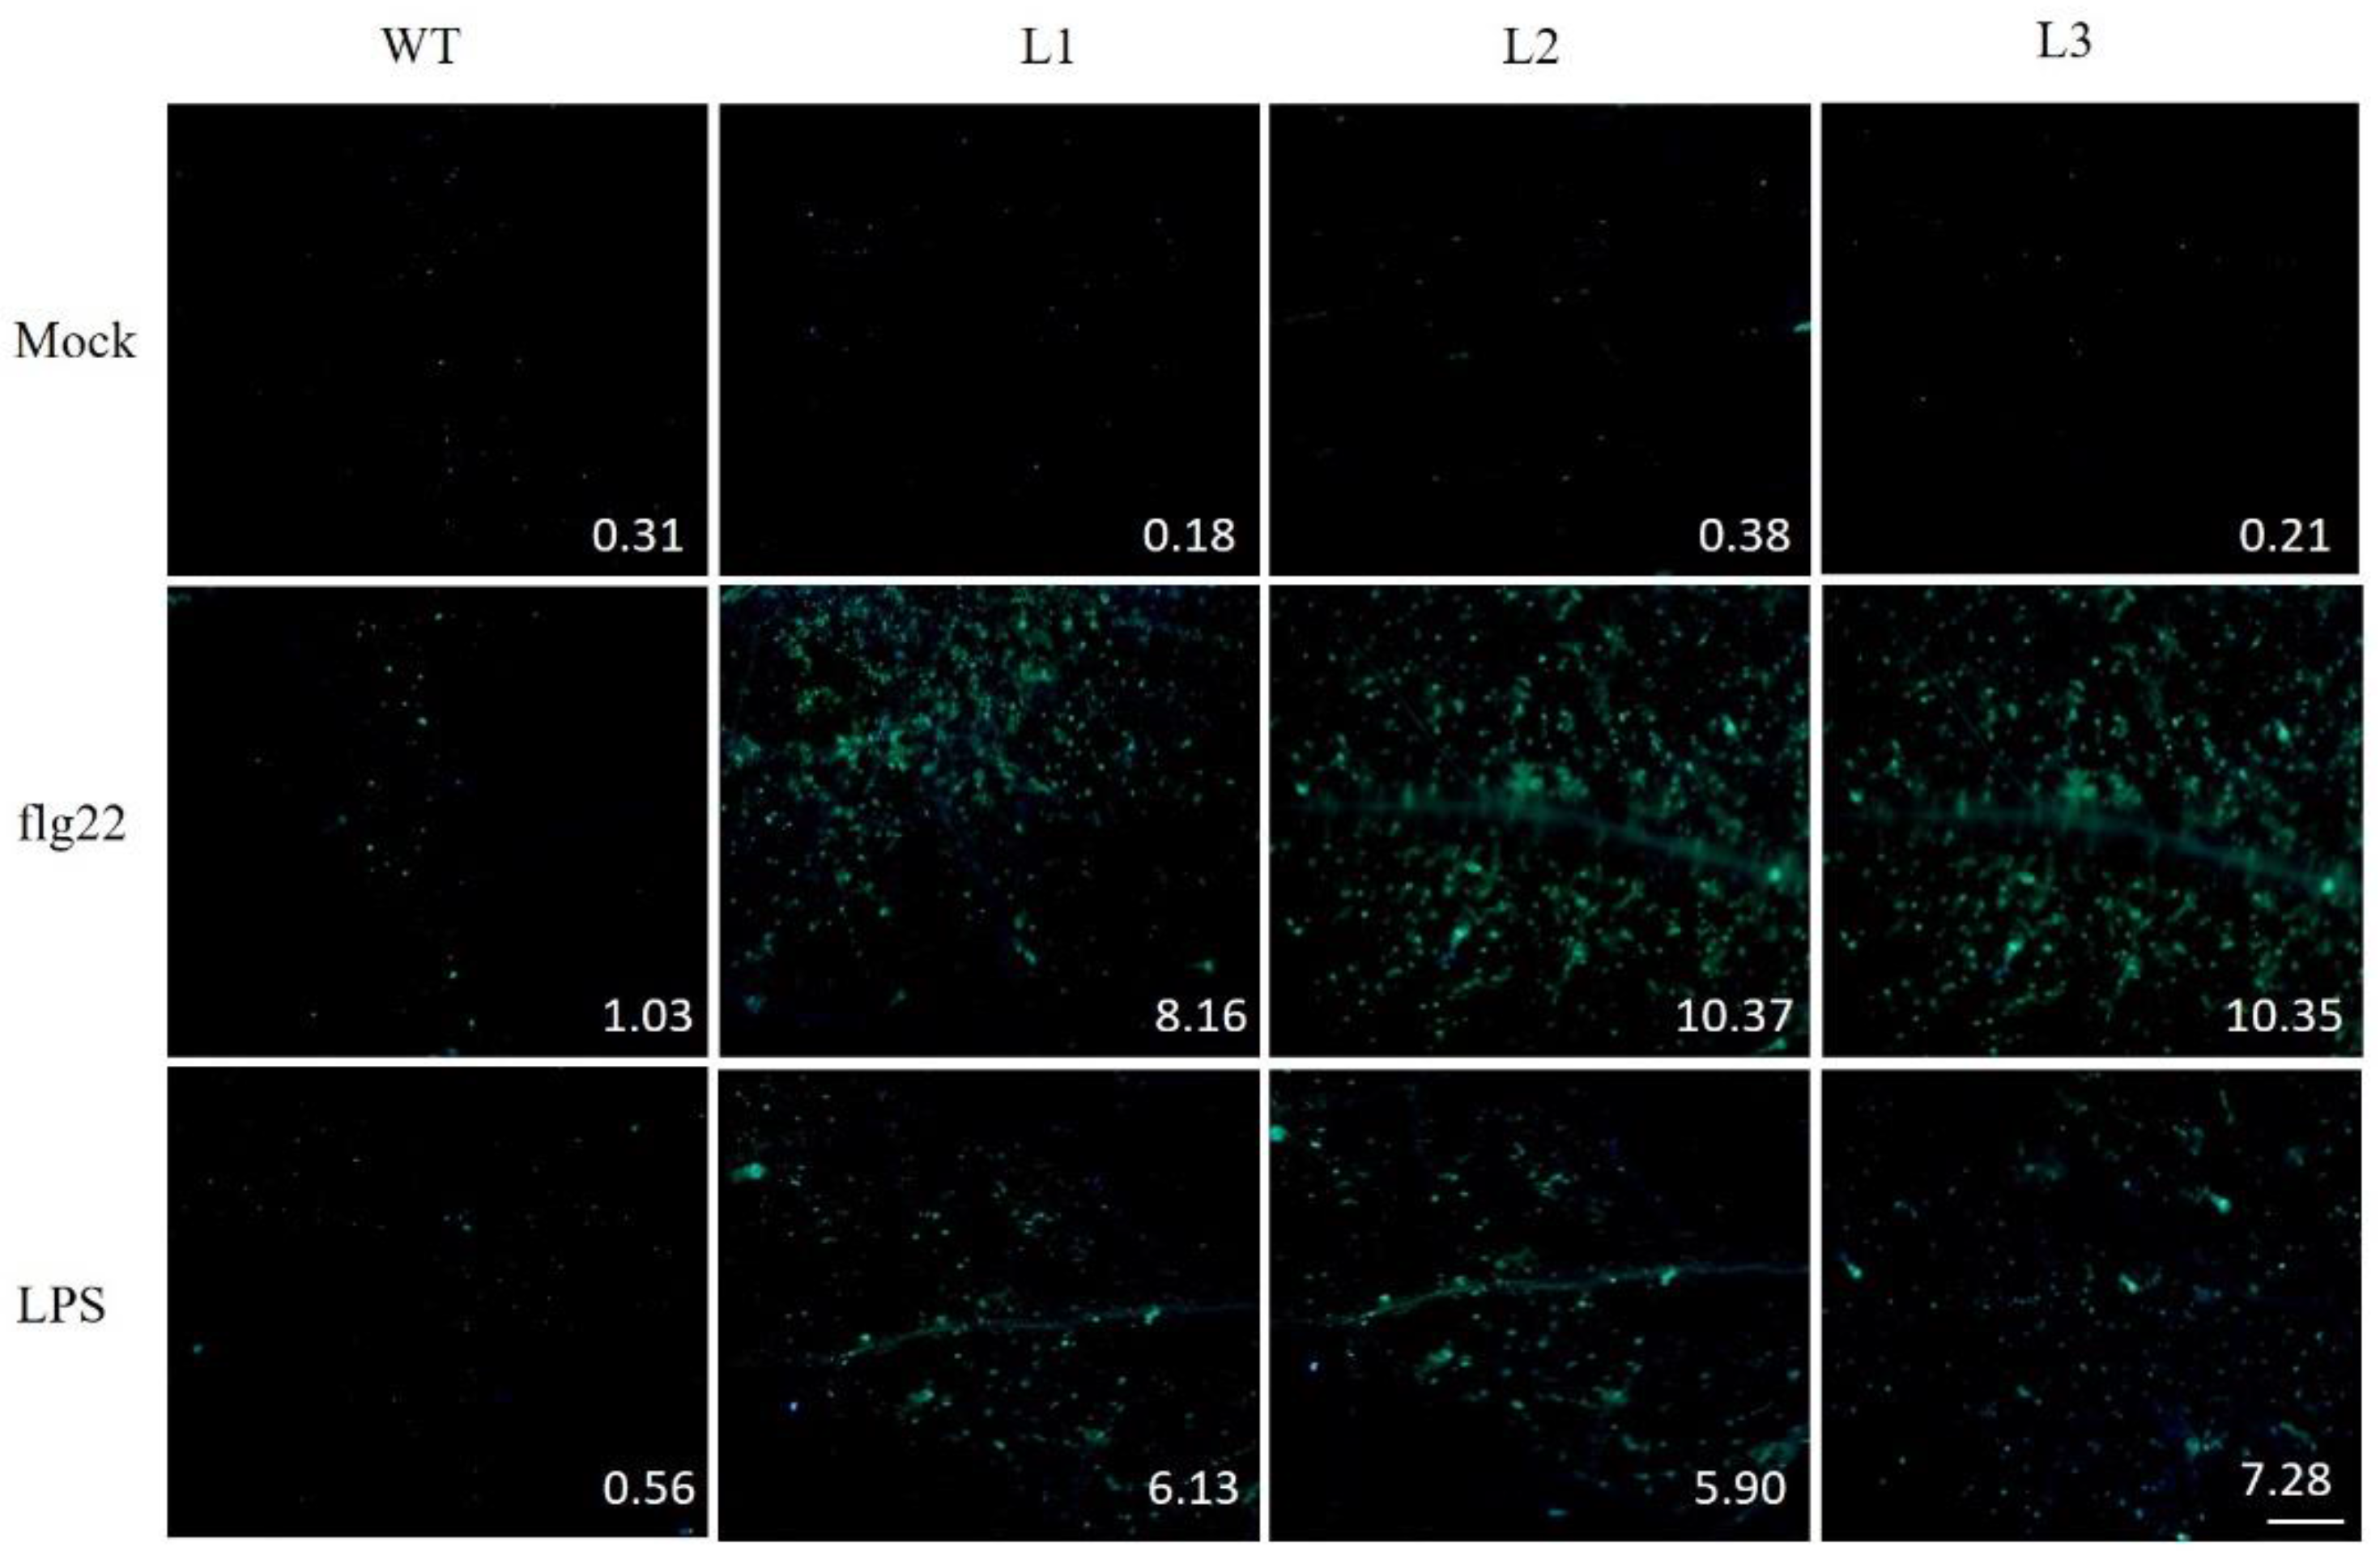
2.9. PAMP-Triggered Callose Deposition in VaSTS19-Expressing Lines and Nontransgenic Control Plants

Abundant deposits of the cell wall polymer, callose, are produced as a physical barrier when plants are subjected to biotic challenge [28,29]. We exposed Arabidopsis leaves to flg22 or LPS, two distinct pathogen-associated molecular patterns (PAMPs). Aniline blue staining revealed that transgenic lines accumulated a larger amount of callose compared to nontransgenic controls (Figure 9).

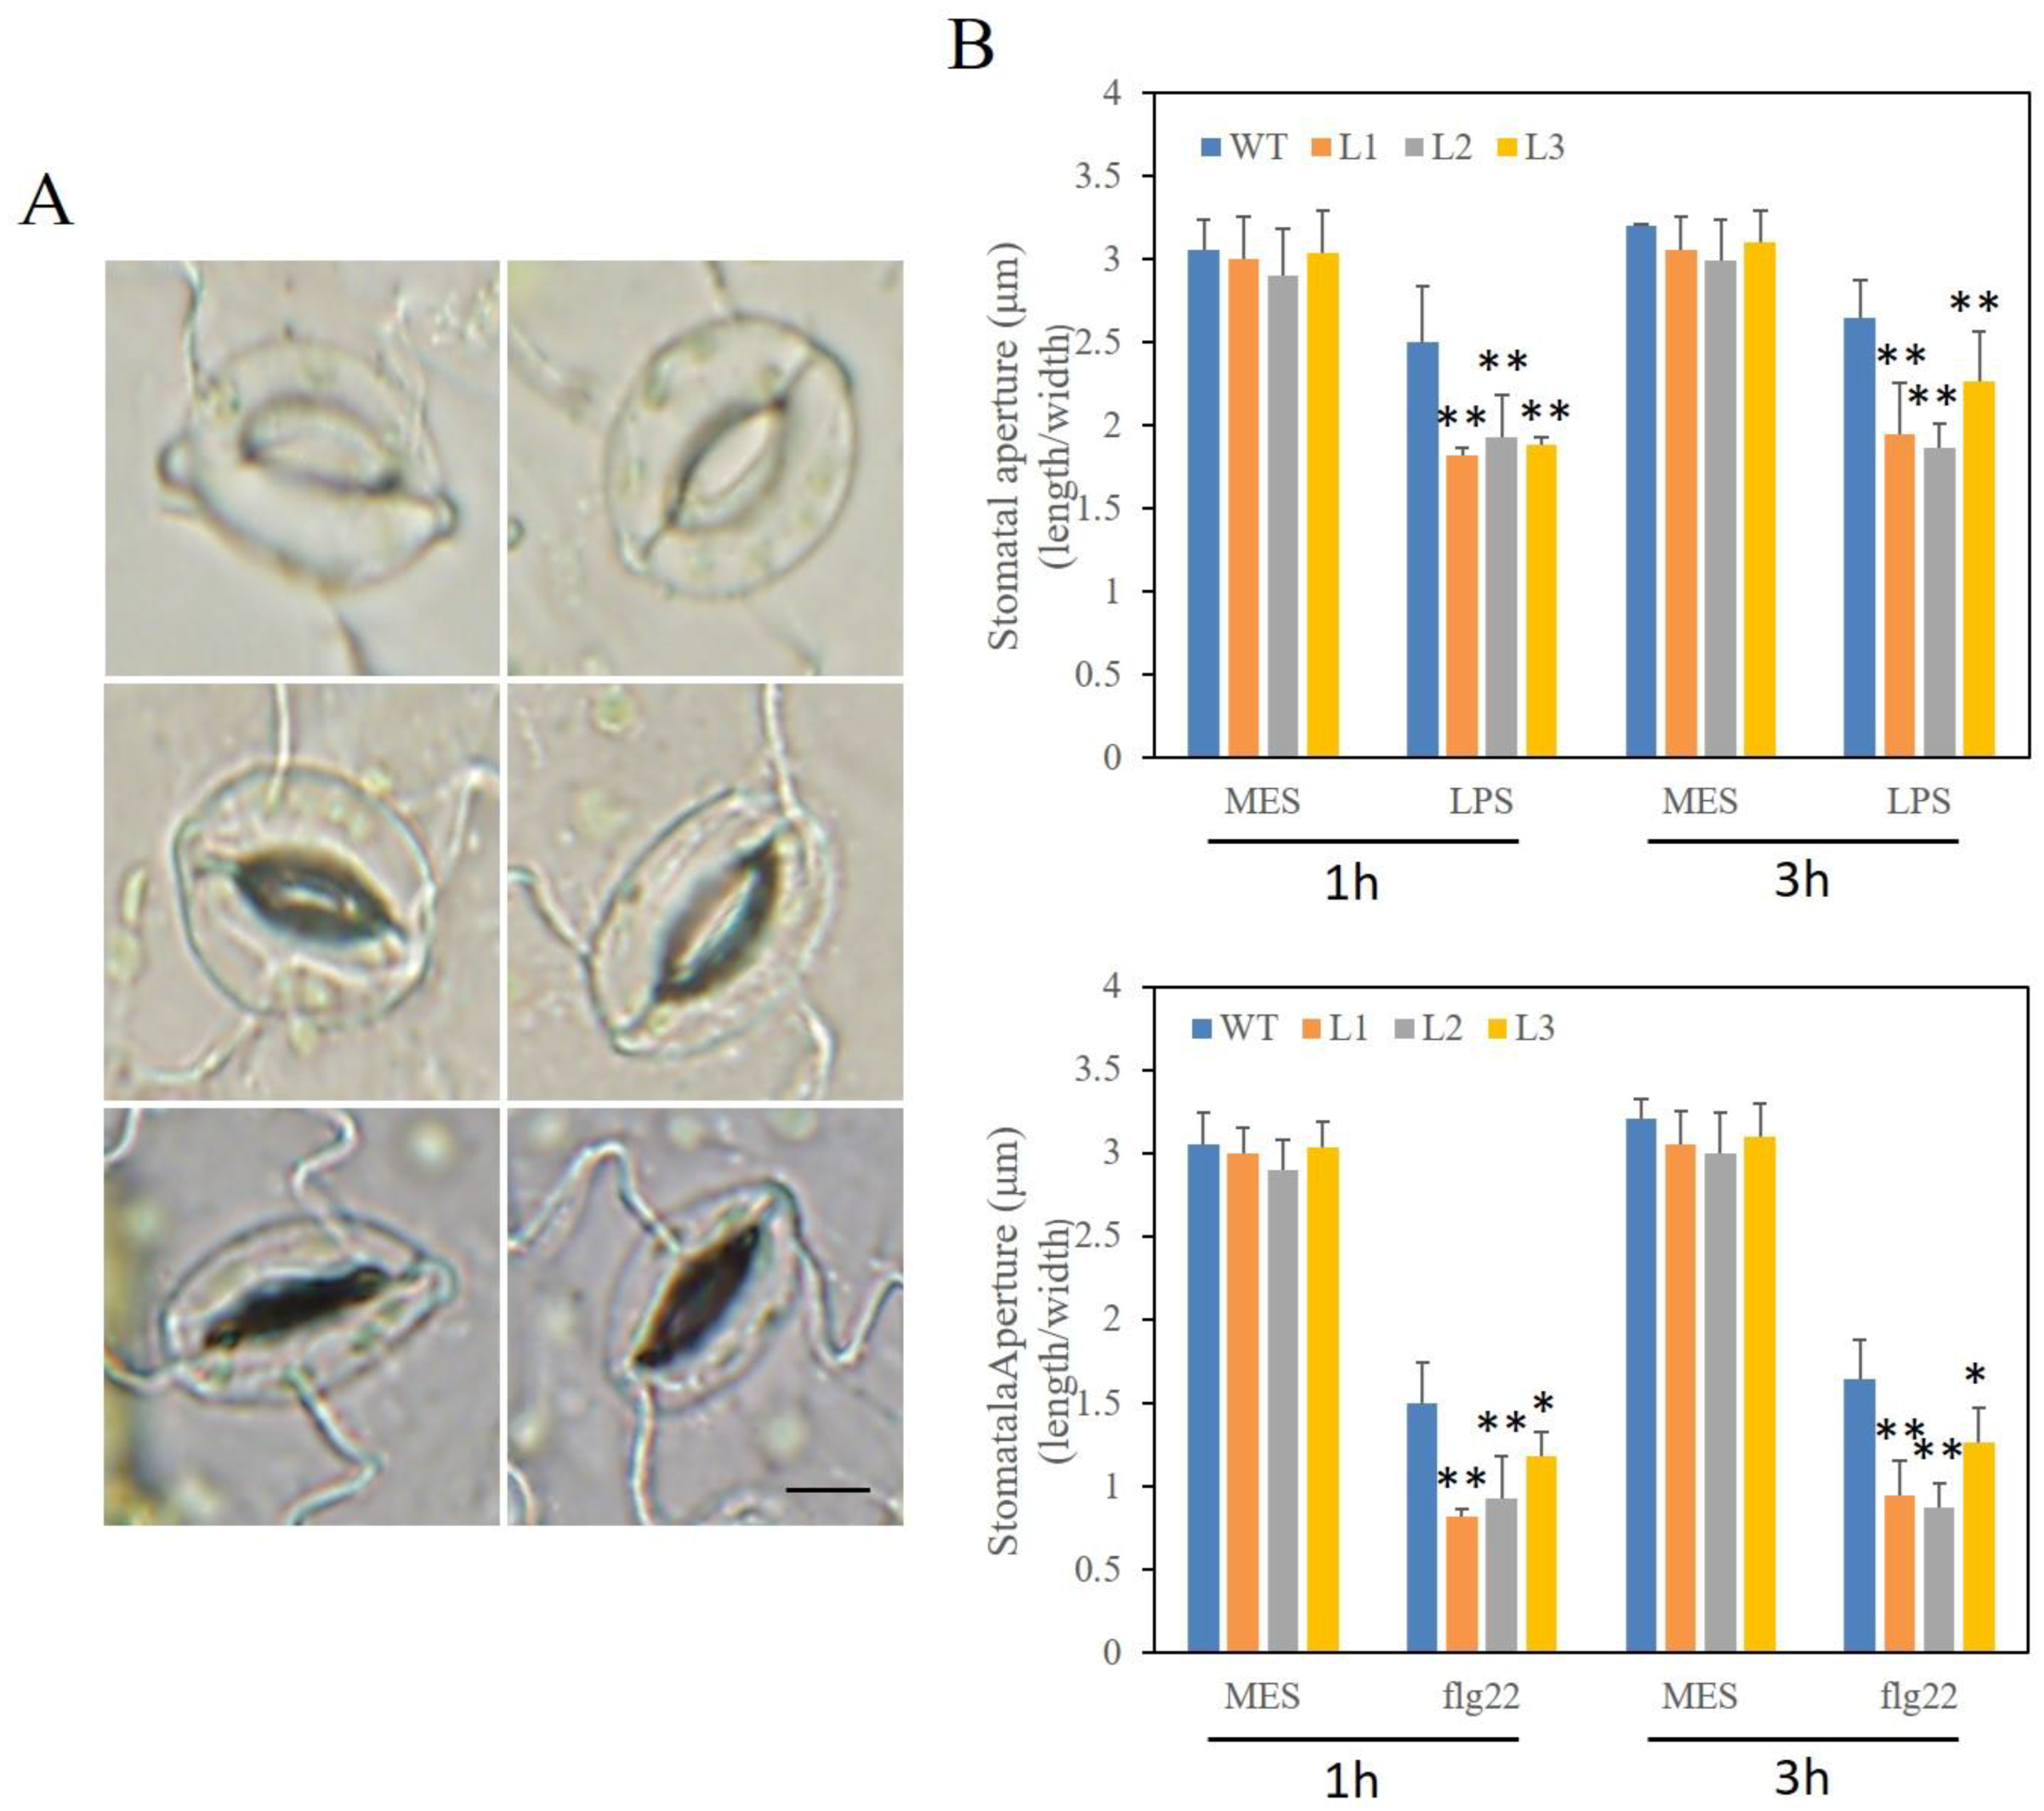
2.10. Altered Stomatal Immunity Responses in VaSTS19-Expressing Arabidopsis Lines and Nontransgenic Control Plants
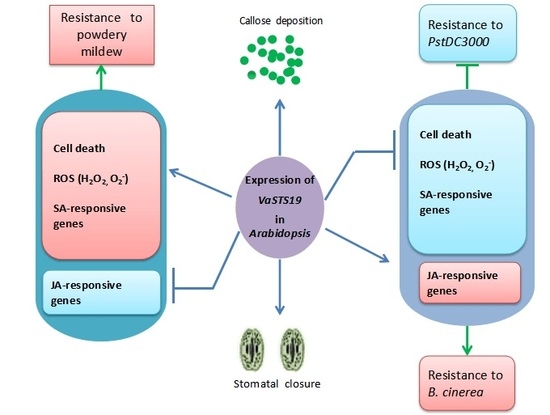
Stomatal closure is part of an integral plant innate immune response to restrict pathogenic bacteria. In order to study the role of VaSTS19 as a barrier in the PAMP-triggered immunity (PTI) process, we analyzed stomatal aperture in epidermal peels of plants exposed to flg22 or LPS. After 1 h of flg22 or LPS treatment, transgenic lines and nontransgenic controls showed drastically decreased stomatal aperture on the leaf, and this was accompanied by a reduction in the number of open stoma (Figure 10A). The stomatal aperture recovered to the nontreated state in nontransgenic control plants by 3 hpi. On the contrary, stomatal aperture of VaSTS19-expressing lines was smaller and remained small at 3 hpi (Figure 10B).

3. Discussion

The level of stilbenes in plant tissues is low under optimal growing conditions, but strongly increases to high levels in response to a wide range of pathogens and stresses [30], this increase is mediated by transcription of their biosynthetic genes. The most common stilbene is resveratrol [10], which is catalyzed by STS, from one molecule of p-coumaroyl-CoA and three molecules of malonyl-CoA [31]. Based on substrate specificity, STS enzymes are often classified into two categories, pinosylvin synthase (PSS) and resveratrol synthase (RS) [32]. Transgenic expression of STS has been shown to enhance resistance in a variety of plants, including pea [33], barley [34], papaya [35], white poplar [36], and lettuce [37]. One possible mechanism driving this resistance is the production of resveratrol, as STS has been shown to increase resveratrol in diverse plants [37,38].
To better understand the function of VaSTS19, the gene was constitutively expressed in the transgenic plants after infection with powdery mildew (Figure 2). Our observation that VaSTS19-expressing Arabidopsis lines showed improved disease resistance and significant reduction of disease symptoms when challenged with the biotrophic pathogen powdery mildew or necrotrophic pathogens B. cinerea (Figure 3A and Figure 5A), is consistent with previous research. For example, transformation of apple with the Vst1 gene increased general resistance to fungal pathogens [39]. Similarly, transgenic tobacco expressing STS showed increased resistance to B. cinerea [22]. Jiao et al. also found that an STS allele isolated from Chinese wild grapevine (VPSTS) conferred resistance to powdery mildew by recruiting salicylic acid signaling [40].
Programmed cell death (PCD) is one of the most common responses to pathogens in plants [28], PCD can decrease resistance to saprophytic fungal pathogens, but can improve the immunity to living biotrophic parasites. In addition, production of reactive oxygen species (ROS) is often associated with cell death in plants [41]. The results of our histochemical staining assays were consistent with phenotypic observations. Transgenic lines displayed more focused and frequent programmed cell death and ROS (H2O2, O2−) accumulation compared to nontransgenic control plants following powdery mildew infection (Figure 3C). In contrast, after B. cinerea infection, a decrease in lesions as well as decreased PCD and ROS accumulation was observed (Figure 5B,D). Our results differ from those of previous research, in which expression of VqSTS21 in transgenic Arabidopsis increased susceptibility to B. cinerea [42]. Previous reports suggested that the upstream region of STS contains important cis-acting elements involved in hormonal and defense response [25]. When plants are exposed to pathogenic fungus, cis-elements can mediate response to activate pathogenesis-related (PR, NPR) proteins to defense different biotic stresses [43,44].
Plants live in biotic environments in which they encounter a broad range of pathogens. Therefore, they must possess efficient defense mechanisms to protect themselves from disease. Defense response to pathogens is regulated through two major signaling pathways, an SA-dependent pathway and a JA-dependent pathway [27,45]. In our study, transcript levels of SA- and JA-responsive genes were increased in both transgenic lines and nontransgenic control plants after infection with powdery mildew or B. cinerea. Interestingly, VaSTS19-expressing Arabidopsis lines were found to express several genes related to SA-mediated signaling at significantly higher levels compared with nontransgenic plants in response to powdery mildew (Figure 4), and JA-mediated signaling in response to B. cinerea (Figure 6). Previous research has shown that these pathways cross-communicate in an antagonistic or synergistic interaction [46,47,48]. SA and JA act synergistically to induce expression of defense-related genes, and treatment with low concentrations of JA and SA resulted in a synergistic effect on the JA- and SA-responsive genes [49,50]. These findings are consistent with previous studies, and suggest that VaSTS19 enhances defense responses against powdery mildew and B. cinerea though SA and/or JA signaling pathways.
We observed that, in response to PstD3000 infection, leaves of transgenic plants became yellow and capreolary, following yellowish necrosis on surfaces (Figure 7A), and showed greatly reduced peroxide levels and numbers of dead cells (Figure 7B,C). Previous research found that several mutants with defects in SA signaling, including eds1, pad4 (phytoalexin deficient 4), eds5, sid2, and npr1, showed enhanced susceptibility to PstDC3000 [51]. Expression of JA-/ET-inducible transcription factor, ERF1, causes enhanced susceptibility to P. syringae [52]. In addition, PstDC3000 produces coronatine, [53,54], an important virulence factor for PstDC3000 infection in Arabidopsis and tomato plants [55,56]. Our results are in agreement with previous research. AtNPR1 and AtPR2, which are components of the SA signal transduction pathway, as well as AtPDF1.2 and AtPR3, which are JA-responsive marker genes, all exhibited significant increase in transcript levels in both transgenic and nontransgenic plants following PstDC3000 infection. Transcript levels of AtNPR1 and AtPR2 were down-regulated in the transgenic lines following PstDC3000 infection (Figure 8A,B), while AtPDF1.2 and AtPR3, were significantly up-regulated (Figure 8C,D). Therefore, we concluded that VaSTS19 responses to PstDC3000 may be mediated by JA signal transduction pathway, suppressing the SA signal transduction pathway.
Stomatal closure is part of the innate immune response to bacterial invasion. The accumulation of callose and altered stomatal aperture is an important symptom of PAMP-triggered immunity response in plants [57]. Our observation that stomatal aperture returned to an initial state in nontransgenic control plants and was markedly larger than VaSTS19-expressing lines (Figure 10), and that transgenic lines accumulated more callose compared to nontransgenic control plants following flg22 or LPS infection (Figure 9), meant that VaSTS19 play an important role in immunity response and that expression of VaSTS19 enhanced resistance to biotic stresses.
Here, we studied the role of VaSTS19 from Chinese wild variety V. amurensis cv. “Tonghua-3” in response to plant pathogens through a complex network of signaling pathways, which involve two signaling molecules, SA and JA. Expressing VaSTS19 in transgenic Arabidopsis lines enhanced disease resistance to the biotrophic powdery mildew and the necrotrophic B. cinerea, but conversely, increased the susceptibility to semi-biotrophic pathogen PstDC3000. We suggest that SA- and JA-mediated signaling pathways do not function independently, but instead, influence each other through positive and negative regulatory interactions. In short, our research findings may provide insight into the function of VaSTS19 in plants’ responses to biotic stresses and the signaling pathways that are involved in plant defense against pathogens. Further research should be focused on the mechanisms underlying activation and regulation of defense responses.

4. Materials and Methods

4.1. Plant Materials and Pathogenic Bacteria

Chinese wild V. amurensis cv. Tonghua-3 was grown in the grape germplasm resources orchard of Northwest A&F University, Yangling, Shaanxi, China, and was used for powdery mildew inoculation, and for cloning and expression analysis. Nontransgenic and transgenic Arabidopsis lines were grown in a chamber at 21 °C (16 h light, 8 h dark, 100 μmol m−2·s−1 photon flux density) and 80% relative humidity on a sterile substrate. For all experiments, 4- to 5-week-old plants were used.
Powdery mildew was cultured on Arabidopsis pad4 (phytoalexin deficient 4) mutant plants, which were grown in a plant incubator (22 °C, photoperiod 8 h dark/16 h light, light intensity 100 μmol m−2·s−1) [58]. B. cinerea was isolated from tomato and cultured on Potato Glucose Agar medium at 25 °C in the dark. PstDC3000 was grown at 28 °C on King’s B medium containing 50 mg/L rifampicin and 100 mg/L kanamycin [59].

4.2. Inoculation with Powdery Mildew in Grape

Fully expanded leaves in the third or fourth position from the shoot tip were infected with powdery mildew through gentle contact with previously infected leaves exhibiting disease symptoms [60]. Newly infected leaves were subsequently collected at 0, 6, 12, 24, 48, 72, and 96 h after inoculation. Leaves sprayed with sterile water at the same time points were used as a control. Samples were immediately frozen in liquid nitrogen, and then stored at −80 °C.

4.3. RNA Extraction and Gene Expression Analysis by Quantitative Real-Time PCR

Total grapevine RNA was extracted from powdery mildew-inoculated grapevine leaves, and total Arabidopsis RNA was extracted from leaves infected with powdery mildew, PstDC3000 or B. cinerea, using the E.Z.N.A.® Plant RNA Kit (Omega Bio-tek, Norcross, GA, USA). First-strand cDNA was synthesized using the PrimeScriptTM RTase 1st Strand cDNA Synthesis Kit (TaKaRa Biotechnology, Dalian, China) and diluted 6-fold with sterile water. Quantitative real-time PCR analysis was carried out using SYBR Green (TaKaRa Biotechnology) in a StepOnePlus Real-Time PCR System (Applied Biosystems, Foster, CA, USA), and cycling parameters were: 95 °C for 30 s, and 42 cycles of 95 °C for 5 s, and 60 °C for 30 s. The grape ACTIN1 gene (GenBank Acc. No. AY680701) or Arabidopsis ACTIN1 gene (GenBank Acc. No. AT3G18780) was used as an internal control. The sequences of gene-specific primers used for the qRT-PCR reactions are provided in Table 1. Each reaction was performed in triplicate for each of the three biologically replicated sets of cDNA samples. Relative expression levels were analyzed with the IQ5 software using the normalized expression method.

4.4. Generation of Transgenic Plants Expressing the VaSTS19 Gene

The VaSTS19 PCR product described above was cloned into the pGEM®-T Easy vector (Promega; Madison, WI, USA). The coding sequence of VaSTS19 (with BamHI and SmaI sites at the 5′ and 3′ ends, respectively) was amplified from the pGEM®-T Easy-VaSTS19 vector using gene-specific primers, then inserted downstream of the CaMV 35S promoter in the plant over-expression vector, pCambia 2300 (Cambia, Brisbane, QLD, Australia). Plants were transformed by the floral dip method [61]. T0 seeds were harvested and T1 plants were selected on MS medium (pH = 5.8, 30 g/L sucrose, 7.5 g/L agar) supplemented with 100 mg/L kanamycin [62]. Three lines (L1, L2 and L3) displaying the strongest resistance to powdery mildew were selected from 50 independent lines, and T3 homozygous lines were used for the following research.

4.5. Inoculation of Arabidopsis Pathogen

Leaves of 4-week-old plants were inoculated with powdery mildew [63]. Visual scoring of disease phenotypes was performed at 7 dpi. Samples were collected at 0, 24, 72, and 120 hpi, and were used for the analysis of expression of disease-resistance-related genes. Spore counts of susceptible leaves was determined as follows: ten leaf samples were collected from six independent lines, respectively, and weighed and placed in 50 mL tubes containing 40 mL of sterile water and 0.02% of Tween 20, after which the tubes were stirred vigorously for 3 min using a vortex mixer. The resulting spore suspension was diluted 1:10 with 0.02% Tween 20 solution. Spores were then counted by means of a hemocytometer under a dissecting microscope [64].
Conidia from 3-week-old cultured B. cinerea were washed, and the spore concentration in the inoculation suspension was adjusted to 106 spores/mL with sterile water. Conidia suspension supplemented with 4% maltose and 1% peptone (m/v) was applied to leaves. Inoculated leaves were covered with a plastic lid to ensure a relative humidity of 90–100%. Leaves sprayed with sterile water at the same time served as a control. Samples were collected at 0, 24, 48, and 72 hpi, and were used for the analysis of expression levels of disease-resistance-related genes. Disease incidence and lesion diameter were measured 72 h after inoculation, and the lesion diameter was defined as follows: small (d ≤ 5 mm); medium (5 < d < 9 mm); and large (d ≥ 9 mm) [65].
PstDC3000 was cultured on King’s B medium until an OD600 of 0.8 was reached. Bacteria were collected by centrifugation and resuspended in 10 mM MgCl2 to a final concentration of 108 cfu/mL. Arabidopsis plants were dipped into the cell suspension containing 0.05% Silwet L-77 for 15 min [59] and then placed in a plant incubator under 90% relative humidity until disease symptoms developed. Similar to B. cinerea infection, samples were collected at 0, 24, 48 and 72 hpi. For bacterial population assays, 12 infected leaves were obtained from six independent lines at 3 dpi, respectively, and then were sterilized with 70% ethanol for 1 min followed by several rinses. Leaf disks (0.6 × 0.6 cm2) were excised and homogenized in 100 mL 10mM MgCl2, and then the solution was gradually diluted with sterile water. One hundred microliters of the resulting diluted solution were plated on King’s B agar plates supplemented with 100 mg/mL rifampicin and 100 mg/mL kanamycin, and the plates were incubated in a shaker for 48 h at 28 °C [42].

4.6. Histochemical Detection of Cell Death and Superoxide Accumulation

H2O2 accumulation in leaf tissues was detected by diaminobenzidine (DAB) staining [66]. Inoculated leaves were excised at the base of petiole, placed in 1 mg/mL DAB (Sigma, Beijing, China), and incubated for 8 h in the dark. Subsequently, chlorophyll was removed by incubating in 70% ethanol [58]. For trypan blue staining to detect cell death, infected leaves were soaked in boiled trypan blue solution [67] (a 1:1:1:1:1 ratio of trypan blue, phenol, glycerol, lactic acid, and sterile water) for 5 min, and were subsequently depigmented in 2.5 g/mL chloral hydrate for 1–2 days. For NBT staining, inoculated leaves were incubated in HEPES (4-(2-hydroxyethyl)-1-piperazineethanesulfonic acid) buffer (pH 7.5) containing 6 mM NBT for 2 h with illumination [68].

4.7. Observation of Qualitative Stoma and Callose under Biotic Stresses

To assure that most stomata were open before experiments were initiated, plants were kept under light (100 mEm−2s−1) for at least 3 h [69]. The epidermis was peeled from fully expanded leaves and immediately immersed in MES buffer (25 mM MES-KOH (pH 6.15) and 10 mM KCl), 5 mM flg22 peptide (Flagellin Fragment, Anaspec, Fremont, CA, USA), or 100 ng/μL LPS (lipopolysaccharide, Sigma). Flg22 was dissolved in MES buffer. LPS was dissolved in MES buffer solution containing 0.25 mM MgCl2 and 0.1 mM CaCl2 [70,71]. At 1 and 3 hpi, samples were placed on glass slides and observed under a microscope. The width and length of the stomatal aperture was measured using the Image-Pro (Olympus Corporation, Tokyo, Japan). For the callose experiment, solution (Mgcl2 (10 mM), flg22 (5 mM) or LPS (100 ng/μL)) was injected into rosette leaves using 1 mL needleless syringes, respectively. Leaves were stained with aniline blue (dissolved in 150 mM k2HPO4 (pH 9.5)) at 18 hpi to detect callose deposition.

4.8. Statistical Analysis

All experiments were repeated independently three times for each of the three biological replicates. Results are presented as means and standard errors using Microsoft Excel (Microsoft Corporation, Redmond, WA, USA), SigmaPlot 10.0. Paired t tests were performed using the SPSS Statistics 17.0 software (IBM China Company Ltd., Beijing, China).

5. Conclusions

Expression of VaSTS19 in Arabidopsis enhanced resistance to powdery mildew and B. cinerea, but increased susceptibility to PstDC3000 though SA and/or JA signaling pathways. Aniline blue staining revealed that VaSTS19 transgenic lines accumulated more callose compared to nontransgenic control plants, and showed smaller stomatal apertures when exposed to pathogen-associated molecular patterns (flg22 or LPS).

Acknowledgments

This work was supported by the National Natural Science Foundation of China (31572110), as well as the Program for Innovative Research Team of Grape Germplasm Resources and Breeding (2013KCT-25).

Author Contributions

Xiping Wang, Hua Gao, and Yaqiong Wang designed the study; Yaqiong Wang and Fan Wang performed the experiments; Xiaomin Tian and Dejun Wang contributed to data analysis; Xiping Wang and Hua Gao provided guidance throughout the entire study; Yaqiong Wang, Li Huang, and Xiping Wang wrote and revised the manuscript; Steve van Nocker reviewed this manuscript; All authors approved the final manuscript.

Conflicts of Interest

There are no competing interests in this paper, and the authors declare no conflict of interest.

Abbreviations

STSstilbene synthase
CaMVcauliflower mosaic virus
pad4phytoalexin deficient 4
MSmurashige and skoog
CoAcoenzyme A
HEPES4-(2-hydroxyethyl)-1-piperazineethanesulfonic acid
MES2-(N-morpholino) ethanesulfonic acid
PstDC3000Pseudomonas syringae pv. tomatoDC3000
SAsalicylic acid
JAjasmonic acid
hpihours post inoculation
dpidays post inoculation
PCRpolymerase chain reaction
qRT-PCRquantitative real-time PCR
NPR1nonexpressor of pathogenesis-related gene
PR2pathogenesis-related gene 2
PDF1.2plant defensing 1.2
PR3pathogenesis-related gene 3
NBTnitro blue tetrazolium
DABdiaminobenzidine
LPSlipopolysaccharides
Flg22flagellin fragment
PAMPpathogen-associated molecular pattern
UCSC1Erysiphe cichoracearum
PCDprogrammed cell death
PTIPAMP-triggered immunity

References

  1. Zhu, Z.; Shi, J.; Cao, J.; He, M.; Wang, Y. VpWRKY3, a biotic and abiotic stress-related transcription factor from the Chinese wild Vitis pseudoreticulata. Plant Cell Rep. 2012, 31, 2109–2120. [Google Scholar]
  2. Mzid, R.; Marchive, C.; Blancard, D.; Deluc, L.; Barrieu, F.; Corio-Costet, M.-F.; Drira, N.; Hamdi, S.; Lauvergeat, V. Overexpression of VvWRKY2 in tobacco enhances broad resistance to necrotrophic fungal pathogens. Physiol. Plant 2007, 131, 434–447. [Google Scholar] [CrossRef] [PubMed]
  3. Guo, R.; Tu, M.; Wang, X.; Zhao, J.; Wan, R.; Li, Z.; Wang, Y.; Wang, X. Ectopic expression of a grape aspartic protease gene, AP13, in Arabidopsis thaliana improves resistance to powdery mildew but increases susceptibility to Botrytis cinerea. Plant Sci. 2016, 248, 17–27. [Google Scholar] [CrossRef] [PubMed]
  4. Dixon, R.A.; Harrison, M.J. Activation, structure, and organization of genes involved in microbial defense in plants. Adv. Genet. 1990, 28, 165–234. [Google Scholar] [PubMed]
  5. Derckel, J.P.; Baillieul, F.; Manteau, S.; Audran, J.C.; Haye, B.; Lambert, B.; Legendre, L. Differential induction of grapevine defenses by two strains of Botrytis cinerea. Phytopathology 1999, 89, 197–203. [Google Scholar] [CrossRef]
  6. Jeandet, P.; Douillet-Breuil, A.C.; Bessis, R.; Debord, S.; Sbaghi, M.; Adrian, M. Phytoalexins from the Vitaceae: Biosynthesis, phytoalexin gene expression in transgenic plants, antifungal activity and melabolism. J. Agric. Food Chem. 2002, 50, 2731–2741. [Google Scholar] [CrossRef] [PubMed]
  7. Kuc, J. Phytoalexins, stress metabolism, and disease resistance in plants. Annu. Rev. Phytopathol. 1995, 33, 275–297. [Google Scholar] [CrossRef] [PubMed]
  8. Purkayashta, R.P. Progress in phytoalexin research during the past 50 years. In Handbook of Phytoalexin Metabolism and Action; Daniel, M., Purkayashta, R.P., Eds.; Marcel Dekker: New York, NY, USA, 1995; pp. 1–39. [Google Scholar]
  9. Harborne, J.B. The comparative biochemistry of phytoalexin induction in plants. Biochem. Syst. Ecol. 1999, 27, 335–367. [Google Scholar]
  10. Serazetdinova, L.; Oldach, K.H.; Lörz, H. Expression of transgenic stilbene synthases in wheat causes the accumulation of unknown stilbene derivatives with antifungal activity. J. Plant Physiol. 2005, 162, 985–1002. [Google Scholar] [CrossRef] [PubMed]
  11. Treutter, D. Significance of flavonoids in plant resistance: A review. Environ. Chem. Lett. 2006, 4, 147. [Google Scholar]
  12. Pan, Q.-H.; Wang, L.; Li, J.-M. Amounts and subcellular localization of stilbene synthase in response of grape berries to UV irradiation. Plant Sci. 2009, 176, 360–366. [Google Scholar] [CrossRef]
  13. Yu, C.K.; Springob, K.; Schmidt, J.; Nicholson, R.L.; Chu, I.K.; Yip, W.K.; Lo, C. A stilbene synthase gene (SbSTS1) is involved in host and nonhost defense responses in sorghum. Plant Physiol. 2005, 138, 393–401. [Google Scholar] [CrossRef] [PubMed] [Green Version]
  14. Counet, C.; Callemien, D.; Collin, S. Chocolate and cocoa: New sources of trans-resveratrol and trans-piceid. Food Chem. 2006, 98, 649–657. [Google Scholar] [CrossRef]
  15. Bais, A.J.; Murphy, P.J.; Dry, I.B. The molecular regulation of stilbene phytoalexin biosynthesis in Vitis. vinifera during grape berry development. Aust. J. Plant Physiol. 2000, 27, 425–433. [Google Scholar] [CrossRef]
  16. Versari, A.; Parpinello, G.P.; Tornielli, G.B.; Ferrarini, R.; Giulivo, C. Stilbene compounds and stilbene synthase expression during ripening, wilting, and UV treatment in grape cv. Corvina. J. Agric. Food Chem. 2001, 49, 5531–5536. [Google Scholar] [CrossRef] [PubMed]
  17. Borra, M.T.; Smith, B.C.; Denu, J.M. Mechanism of human SIRT1 activation by resveratrol. J. Biol. Chem. 2005, 280, 17187–17195. [Google Scholar] [CrossRef] [PubMed]
  18. Vannozzi, A.; Dry, I.B.; Fasoli, M.; Zenoni, S.; Lucchin, M. Genome-wide analysis of the grapevine stilbene synthase multigenic family: Genomic organization and expression profiles upon biotic and abiotic stresses. BMC Plant Biol. 2012, 12, 130. [Google Scholar] [CrossRef] [PubMed] [Green Version]
  19. Xu, W.; Yu, Y.; Ding, J.; Hua, Z.; Wang, Y. Characterization of a novel stilbene synthase promoter involved in pathogen- and stress-inducible expression from Chinese wild Vitis pseudoreticulata. Planta 2009, 231, 489. [Google Scholar] [CrossRef]
  20. Yu, C.K.Y.; Lam, C.N.W.; Springob, K.; Schmidt, J.; Chu, I.K.; Lo, C. Constitutive accumulation of cis-piceid in transgenic Arabidopsis overexpressing a sorghum stilbene synthase gene. Plant Cell Physiol. 2006, 47, 1017–1021. [Google Scholar] [CrossRef] [PubMed]
  21. Cheng, S.; Xie, X.; Xu, Y.; Zhang, C.; Wang, X.; Zhang, J.; Wang, Y. Genetic transformation of a fruit-specific, highly expressed stilbene synthase gene from Chinese wild Vitis quinquangularis. Planta 2016, 243, 1041–1053. [Google Scholar] [CrossRef] [PubMed]
  22. Hain, R.; Reif, H.J.; Krause, E.; Langebartels, R.; Kindl, H.; Vornam, B.; Wiese, W.; Schmelzer, E.; Schreier, P.H.; Stöcker, R.H. Disease resistance results from foreign phytoalexin expression in a novel plant. Nature 1993, 361, 153–156. [Google Scholar] [CrossRef] [PubMed]
  23. Stark-Lorenzen, P.; Nelke, B.; Hänßler, G.; Mühlbach, H.P.; Thomzik, J.E. Transfer of a grapevine stilbene synthase gene to rice (Oryza sativa L.). Plant Cell Rep. 1997, 16, 668–673. [Google Scholar] [CrossRef]
  24. Dai, R.; Ge, H.; Howard, S.; Qiu, W. Transcriptional expression of stilbene synthase genes are regulated developmentally and differentially in response to powdery mildew in Norton and Cabernet Sauvignon grapevine. Plant Sci. 2012, 197, 70–76. [Google Scholar] [CrossRef] [PubMed]
  25. Yin, X.; Singer, S.D.; Qiao, H.; Liu, Y.; Jiao, C.; Wang, H.; Li, Z.; Fei, Z.; Wang, Y.; Fan, C.; Wang, X. Insights into the mechanisms underlying ultraviolet-C induced resveratrol metabolism in Grapevine (V. amurensis Rupr.) cv. “Tonghua-3”. Front. Plant Sci. 2016, 7. [Google Scholar] [CrossRef] [PubMed]
  26. Yin, X.; Huang, L.; Zhang, X.; Guo, C.; Wang, H.; Li, Z.; Wang, X. Expression patterns and promoter characteristics of the Vitis quinquangularis VqSTS36 gene involved in abiotic and biotic stress response. Protoplasma 2017, 1–15. [Google Scholar] [CrossRef] [PubMed]
  27. Kiselev, K.; Tyunin, A.; Karetin, Y. Salicylic acid induces alterations in the methylation pattern of the VaSTS1, VaSTS2, and VaSTS10 genes in Vitis amurensis Rupr. cell cultures. Plant Cell Rep. 2015, 34, 311–320. [Google Scholar] [CrossRef] [PubMed]
  28. Jones, J.D.G.; Dangl, J.L. The plant immune system. Nature 2006, 444, 323–329. [Google Scholar] [CrossRef] [PubMed]
  29. Ellinger, D.; Naumann, M.; Falter, C.; Zwikowics, C.; Jamrow, T.; Manisseri, C.; Somerville, S.C.; Voigt, C.A. Elevated early callose deposition results in complete penetration resistance to powdery mildew in Arabidopsis. Plant Physiol. 2013, 161, 1433–1444. [Google Scholar] [CrossRef] [PubMed]
  30. Aleynova-Shumakova, O.A.; Dubrovina, A.S.; Manyakhin, A.Y.; Karetin, Y.A.; Kiselev, K.V. VaCPK20 gene overexpression significantly increased resveratrol content and expression of stilbene synthase genes in cell cultures of Vitis amurensis Rupr. Appl. Microbiol. Biotechnol. 2014, 98, 5541–5549. [Google Scholar] [CrossRef] [PubMed]
  31. Ingham, J.L. 3, 5, 4′-Trihydroxystilbene as a phytoalexin from groundnuts (Arachis hypogaea). Phytochemistry 1976, 15, 1791–1793. [Google Scholar] [CrossRef]
  32. Melchior, F.; Hohmann, F.; Schwer, B.; Kindl, H. Induction of stilbene synthase by Botrytis cinerea in cultured grapevine cells. Planta 1991, 183, 307–314. [Google Scholar]
  33. Richter, A.; Jacobsen, H.J.; de Kathen, A.; de Lorenzo, G.; Briviba, K.; Hain, R.; Ramsay, G.; Kiesecker, H. Transgenic peas (Pisum sativum) expressing polygalacturonase inhibiting protein from raspberry (Rubus idaeus) and stilbene synthase from grape (Vitis vinifera). Plant Cell Rep. 2006, 25, 1166–1173. [Google Scholar] [CrossRef] [PubMed]
  34. Leckband, G.; Lorz, H. Transformation and expression of a stilbene synthase gene of Vitis vinifera L. in barley and wheat for increased fungal resistance. Theor. Appl. Genet. 1998, 96, 1004–1012. [Google Scholar] [CrossRef]
  35. Zhu, Y.J.; Agbayani, R.; Jackson, M.C.; Tang, C.; Moore, P.H. Expression of the grapevine stilbene synthase gene VST1 in papaya provides increased resistance against diseases caused by Phytophthora palmivora. Planta 2004, 220, 241–250. [Google Scholar] [CrossRef] [PubMed]
  36. Giorcelli, A.; Sparvoli, F.; Mattivi, F.; Tava, A.; Balestrazzi, A.; Vrhovsek, U.; Calligari, P.; Bollini, R.; Confalonieri, M. Expression of the stilbene synthase (STSy) gene from grapevine in transgenic white poplar results in high accumulation of the antioxidant resveratrol glucosides. Transgenic Res. 2004, 13, 203–214. [Google Scholar] [CrossRef] [PubMed]
  37. Liu, S.; Hu, Y.; Wang, X.; Zhong, J.; Lin, Z. High content of resveratrol in lettuce transformed with a stilbene synthase gene of Parthenocissus henryana. J. Agric. Food Chem. 2006, 54, 8082–8085. [Google Scholar] [CrossRef] [PubMed]
  38. Schnee, S.; Viret, O.; Gindro, K. Role of stilbenes in the resistance of grapevine to powdery mildew. Physiol. Mol. Plant Pathol. 2008, 72, 128–133. [Google Scholar] [CrossRef]
  39. Szankowski, I.; Briviba, K.; Fleschhut, J.; Schönherr, J.; Jacobsen, H.; Kiesecker, H. Transformation of apple (Malus domestica Borkh.) with the stilbene synthase gene from grapevine (Vitis vinifera L.) and a PGIP gene from kiwi (Actinidia deliciosa). Plant Cell Rep. 2003, 22, 141–149. [Google Scholar] [CrossRef] [PubMed]
  40. Jiao, Y.; Xu, W.; Duan, D.; Wang, Y.; Nick, P. A stilbene synthase allele from a Chinese wild grapevine confers resistance to powdery mildew by recruiting salicylic acid signalling for efficient defence. J. Exp. Bot. 2016, 67, 5841–5856. [Google Scholar] [CrossRef]
  41. Greenberg, J.T.; Yao, N. The role and regulation of programmed cell death in plant–pathogen interactions. Cell. Microbiol. 2004, 6, 201–211. [Google Scholar] [CrossRef] [PubMed]
  42. Huang, L.; Zhang, S.; Singer, S.D.; Yin, X.; Yang, J.; Wang, Y.; Wang, X. Expression of the Grape VqSTS21 gene in Arabidopsis confers resistance to osmotic stress and biotrophic pathogens but not Botrytis cinerea. Front. Plant Sci. 2016, 7, 1379. [Google Scholar] [CrossRef] [PubMed]
  43. Jayakannan, M.; Bose, J.; Babourina, O.; Rengel, Z.; Shabala, S. Salicylic acid in plant salinity stress signalling and tolerance. Plant Growth Regul. 2015, 76, 25–40. [Google Scholar] [CrossRef]
  44. Shah, J. The salicylic acid loop in plant defense. Curr. Opin. Plant Biol. 2003, 6, 365–371. [Google Scholar] [CrossRef]
  45. Zhao, G.Y.; Fan, J.Y.; Hua, C.P.; Yan, W.; Chen, C.J.; Lu, Y.H.; Jiao, R.H.; Tan, R.X. Resveratrol improves fungal ribosylation capacity through a unique mechanism. Rsc. Adv. 2014, 5, 5657–5663. [Google Scholar] [CrossRef]
  46. Doherty, H.M.; Selvendran, R.R.; Bowles, D.J. The wound response of tomato plants can be inhibited by aspirin and related hydroxy-benzoic acids. Physiol. Mol. Plant Pathol. 1988, 33, 377–384. [Google Scholar] [CrossRef]
  47. Schenk, P.M.; Kazan, K.; Wilson, I.; Anderson, J.P.; Richmond, T.; Somerville, S.C.; Manners, J.M. Coordinated plant defense responses in Arabidopsis revealed by microarray analysis. Proc. Natl. Acad. Sci. USA 2000, 97, 11655–11660. [Google Scholar] [CrossRef] [PubMed]
  48. Mur, L.A.; Kenton, P.; Atzorn, R.; Miersch, O.; Wasternack, C. The outcomes of concentration-specific interactions between salicylate and jasmonate signaling include synergy, antagonism, and oxidative stress leading to cell death. Plant Physiol. 2006, 140, 249–262. [Google Scholar] [CrossRef] [PubMed]
  49. Xu, Y.; Chang, P.-F.L.; Liu, D.; Narasimhan, M.L.; Raghothama, K.G.; Hasegawa, P.M.; Bressan, R.A. Plant defense genes are synergistically induced by ethylene and methyl jasmonate. Plant Cell 1994, 6, 1077–1085. [Google Scholar] [CrossRef] [PubMed]
  50. Thomma, B.P.; Eggermont, K.; Broekaert, W.F.; Cammue, B.P. Disease development of several fungi on Arabidopsis can be reduced by treatment with methyl jasmonate. Plant Physiol. Biochem. 2000, 38, 421–427. [Google Scholar] [CrossRef]
  51. Aarts, N.; Metz, M.; Holub, E.; Staskawicz, B.J.; Daniels, M.J.; Parker, J.E. Different requirements for EDS1 and NDR1 by disease resistance genes define at least two R gene-mediated signaling pathways in Arabidopsis. Proc. Natl. Acad. Sci. USA 1998, 95, 10306–10311. [Google Scholar] [CrossRef] [PubMed]
  52. Berrocal-Lobo, M.; Molina, A.; Solano, R. Constitutive expression of ETHYLENE-RESPONSE-FACTOR1 in Arabidopsis confers resistance to several necrotrophic fungi. Plant J. 2002, 29, 23–32. [Google Scholar] [CrossRef] [PubMed]
  53. Brooks, D.M.; Bender, C.L.; Kunkel, B.N. The Pseudomonas syringae phytotoxin coronatine promotes virulence by overcoming salicylic acid-dependent defences in Arabidopsis thaliana. Mol. Plant Pathol. 2005, 6, 629–639. [Google Scholar] [CrossRef] [PubMed]
  54. Laurie-Berry, N.; Joardar, V.; Street, I.H.; Kunkel, B.N. The Arabidopsis thaliana JASMONATE INSENSITIVE 1 gene is required for suppression of salicylic acid-dependent defenses during infection by Pseudomonas syringae. Mol. Plant-Microbe Interact. 2006, 19, 789–800. [Google Scholar] [CrossRef] [PubMed]
  55. Ma, S.W.; Morris, V.L.; Cuppels, D.A. Characterization of a DNA region required for production of the phytotoxin coronatine by Pseudomonas syringae pv. tomato. Mol. Plant-Microbe Interact. 1991, 4, 69–74. [Google Scholar] [CrossRef]
  56. Cui, J.; Bahrami, A.K.; Pringle, E.G.; Hernandez-Guzman, G.; Bender, C.L.; Pierce, N.E.; Ausubel, F.M. Pseudomonas syringae manipulates systemic plant defenses against pathogens and herbivores. Proc. Natl. Acad. Sci. USA 2005, 102, 1791–1796. [Google Scholar] [CrossRef] [PubMed]
  57. Gómez-Gómez, L.; Felix, G.; Boller, T. A single locus determines sensitivity to bacterial flagellin in Arabidopsis thaliana. Plant J. 1999, 18, 277–284. [Google Scholar] [CrossRef] [PubMed]
  58. Reuber, T.L.; Plotnikova, J.M.; Dewdney, J.; Rogers, E.E.; Wood, W.; Ausubel, F.M. Correlation of defense gene induction defects with powdery mildew susceptibility in Arabidopsis enhanced disease susceptibility mutants. Plant J. 1998, 16, 473–485. [Google Scholar] [CrossRef] [PubMed]
  59. Tornero, P.; Dangl, J.L. A high-throughput method for quantifying growth of phytopathogenic bacteria in Arabidopsis thaliana. Plant J. 2001, 28, 475–481. [Google Scholar] [CrossRef] [PubMed]
  60. Vidal, J.R.; Kikkert, J.R.; Malnoy, M.A.; Wallace, P.G.; Barnard, J.; Reisch, B.I. Evaluation of transgenic “Chardonnay” (Vitis vinifera) containing magainin genes for resistance to crown gall and powdery mildew. Transgenic Res. 2006, 15, 69–82. [Google Scholar] [CrossRef] [PubMed]
  61. Clough, S.J.; Bent, A.F. Floral dip: A simplified method for Agrobacterium-mediated transformation of Arabidopsis thaliana. Plant J. 1998, 16, 735–743. [Google Scholar] [CrossRef] [PubMed]
  62. Murashige, T.; Skoog, F. A revised medium for rapid growth and bio assays with tobacco tissue cultures. Physiol. Plant 1962, 15, 473–497. [Google Scholar] [CrossRef]
  63. Xiao, S.; Ellwood, S.; Findlay, K.; Oliver, R.P.; Turner, J.G. Characterization of three loci controlling resistance of Arabidopsis thaliana accession Ms-0 to two powdery mildew diseases. Plant J. 1997, 12, 757–768. [Google Scholar] [CrossRef] [PubMed]
  64. Li, H.; Xu, Y.; Xiao, Y.; Zhu, Z.; Xie, X.; Zhao, H.; Wang, Y. Expression and functional analysis of two genes encoding transcription factors, VpWRKY1 and VpWRKY2, isolated from Chinese wild Vitis pseudoreticulata. Planta 2010, 232, 1325–1337. [Google Scholar] [CrossRef] [PubMed]
  65. Le Hénanff, G.; Profizi, C.; Courteaux, B.; Rabenoelina, F.; Gérard, C.; Clément, C.; Baillieul, F.; Cordelier, S.; Dhondt-Cordelier, S. Grapevine NAC1 transcription factor as a convergent node in developmental processes, abiotic stresses, and necrotrophic/biotrophic pathogen tolerance. J. Exp. Bot. 2013, 64, 4877–4893. [Google Scholar] [CrossRef] [PubMed]
  66. Thordal-Christensen, H.; Zhang, Z.; Wei, Y.; Collinge, D.B. Subcellular localization of H2O2 in plants. H2O2 accumulation in papillae and hypersensitive response during the Barley—Powdery mildew interaction. Plant J. 1997, 11, 1187–1194. [Google Scholar] [CrossRef]
  67. Koch, E.; Slusarenko, A. Arabidopsis is susceptible to infection by a downy mildew fungus. Plant Cell 1990, 2, 437–445. [Google Scholar] [CrossRef] [PubMed]
  68. Tu, M.; Wang, X.; Huang, L.; Guo, R.; Zhang, H.; Cai, J.; Wang, X. Expression of a grape bZIP transcription factor, VqbZIP39, in transgenic Arabidopsis thaliana confers tolerance of multiple abiotic stresses. PCTOC 2016, 125, 537–551. [Google Scholar] [CrossRef]
  69. Melotto, M.; Underwood, W.; Koczan, J.; Nomura, K.; He, S.Y. Plant stomata function in innate immunity against bacterial invasion. Cell 2006, 126, 969–980. [Google Scholar] [CrossRef] [PubMed]
  70. Zeidler, D.; Zähringer, U.; Gerber, I.; Dubery, I.; Hartung, T.; Bors, W.; Hutzler, P.; Durner, J. Innate immunity in Arabidopsis thaliana: Lipopolysaccharides activate nitric oxide synthase (NOS) and induce defense genes. Proc. Natl. Acad. Sci. USA 2004, 101, 15811–15816. [Google Scholar] [CrossRef] [PubMed]
  71. Zipfel, C.; Robatzek, S.; Navarro, L.; Oakeley, E.J.; Jones, J.D.; Felix, G.; Boller, T. Bacterial disease resistance in Arabidopsis through flagellin perception. Nature 2004, 428, 764–767. [Google Scholar] [CrossRef] [PubMed]
Figure 1. Expression analysis of VaSTS19 in “Tonghua-3” grapevine plants following powdery mildew infection. Measurements were done using qRT-PCR. Values are the means ± SD from three independent experiments (n = 5). Asterisks indicate statistically significant difference (Student’s t test, ** p < 0.01) between the treated and untreated control plants.
Ijms 18 02000 g001
Figure 2. The expression level of VaSTS19 in transgenic Arabidopsis following powdery mildew infection. Measurements were done using qRT-PCR. The lowest expression level in the transgenic plants under non-stressed condition was defined as 1.0. Values are the means ± SD from three independent experiments (n = 5). Asterisks indicate statistically significant difference (Student’s t test, ** p < 0.01) between the expression level of 24, 48, 72, 120 and 0 h after infection.
Ijms 18 02000 g002
Figure 3. Expression of VaSTS19 in Arabidopsis enhances resistance to powdery mildew. (A) Representatives of three transgenic lines and nontransgenic control plants 7 dpi with powdery mildew; (B) quantitative analysis of spore numbers on leaves, values are the means ± SD from three independent experiments (n = 10), asterisks indicate statistically significant difference (Student’s t test, ** p < 0.01) between transgenic and nontransgenic lines; (C) histochemical staining with trypan blue (a) diaminobenzidine (DAB) (b) and nitro blue tetrazolium (NBT) (c) was performed in order to observe the accumulation of dead cells and reactive oxygen in transgenic and nontransgenic leaves, respectively, and the experiment was repeated three times with 10 leaves each. Scale bars = 10 mm.
Ijms 18 02000 g003
Figure 4. Relative expression levels of disease-resistance-related genes in VaSTS19-expressing lines and nontransgenic control plants following powdery mildew infection. The expression levels of (A) AtNPR1; (B) AtPR2; (C) AtPDF1.2 and (D) AtPR3. Measurements were done using qRT-PCR. Values are the means ± SD from three independent experiments (n = 5). Asterisks indicate statistically significant difference (Student’s t test, ** p < 0.01) between transgenic lines and nontransgenic control plants.
Ijms 18 02000 g004
Figure 5. Expression of VaSTS19 in Arabidopsis increases resistance to B. cinerea infection. (A) Representatives of three transgenic lines and a nontransgenic control line 3 d following B. cinerea inoculation; (B) average diameter of lesions on leaves of transgenic and nontransgenic lines, data are the means ± SD from three independent experiments (n = 30), asterisks indicate statistically significant difference between transgenic and nontransgenic lines (Student’s t test, ** p < 0.01); (C) symptoms of B. cinerea 3 dpi were scored by assigning lesions to one of three diameter classes: d ≤ 5 mm; 5 < d < 9 mm; d ≥ 9 mm, and three independent experiments were performed, each with at least 30 leaves; (D) transgenic and nontransgenic leaves were stained 3 dpi by trypan blue (a), DAB (b), and NBT (c) to observe the accumulation of dead cells and reactive oxygen, and the experiment was repeated three times, with 10 leaves each. Scale bars = 10 mm.
Ijms 18 02000 g005
Figure 6. Relative expression levels of four salicylic acid (SA)- and jasmonic acid (JA)-responsive genes in VaSTS19-expressing lines and nontransgenic control plants following B. cinerea infection. The expression levels of (A) AtNPR1; (B) AtPR2; (C) AtPDF1.2 and (D) AtPR3. Measurements were done using qRT-PCR. Values are the means ± SD from three independent experiments (n = 5). Asterisks indicate statistically significant difference (Student’s t test, * 0.01 < p < 0.05, ** p < 0.01) between transgenic lines and nontransgenic control plants.
Ijms 18 02000 g006
Figure 7. Expression of VqSTS19 in Arabidopsis increases susceptibility to PstDC3000 infection. (A) Representatives of three transgenic and nontransgenic lines 3d following PstDC3000 inoculation; (B) bacterial numbers per square centimeter on leaves of transgenic and nontransgenic lines at 3 dpi, bars represent the mean ± SD from three independent experiments (n = 12), asterisks indicate statistically significant difference (Student’s t test, ** p < 0.01) between transgenic lines and nontransgenic control plants; (C) dead cells and active oxygen production in infected transgenic and nontransgenic lines at 3 dpi using trypan blue (a), DAB (b) and NBT (c) staining, respectively, the experiment was repeated 3 times, with each samples comprising 10 leaves. Scale bars = 10 mm.
Ijms 18 02000 g007
Figure 8. Relative expression levels of disease-resistance-related genes in VaSTS19-expressing lines and nontransgenic control plants after PstDC3000 infection. The expression levels of (A) AtNPR1; (B) AtPR2; (C) AtPDF1.2 and (D) AtPR3. Measurements were done using qRT-PCR. Values are the means ± SD from three independent experiments (n = 5). Asterisks indicate statistically significant difference (Student’s t test, * 0.01 < p < 0.05, ** p < 0.01) between transgenic lines and nontransgenic control plants.
Ijms 18 02000 g008
Figure 9. Callose deposition in transgenic and nontransgenic lines following MgSO4, flg22, or LPS inoculation. Arabidopsis leaves were stained with aniline blue 18 h after infiltration with 10 mM MgSO4 (Mock), flg22 (5 μM), or LPS (100 ng/μL). The indicated number on each picture stands for the percent of area deposited by callose in each leaf. This experiment was repeated three times with similar results. Scale bars = 500 μm.
Ijms 18 02000 g009
Figure 10. Altered stomatal immunity responses in VaSTS19-expressing Arabidopsis lines and nontransgenic control plants. (A) Open (top and middle panels) and closed (bottom panel) stoma, scale bars = 50 μm; (B) stomatal apertures in epidermal peels of transgenic and nontransgenic lines after 1, 3 h of incubation with MES (2-(N-morpholino) ethanesulfonic acid) buffer (Control), flg22 (5 μM) or LPS (100 ng/μL), bars represent the mean ± SD from three independent experiments (n = 60), asterisks indicate statistically significant difference between transgenic lines and nontransgenic control plants (Student’s t test, * 0.01 < p < 0.05, ** p < 0.01).
Ijms 18 02000 g010
Table 1. Sequence of oligonucleotide primers used in this study.
Primer NameForward and Reverse Primers(5′–3′)Restriction Enzyme Cutting Site
VaSTS19-F1F:CGGGCTAATTTGAATATGTAA-
VaSTS19-R1R:CGGTAAGGGTCATAGTGCAGCT-
VaSTS19-F2F:CGCGGATCCGCGATGGCGTCTGTGGAGGAAABamHI site underlined
VaSTS19-R2R:TCCCCCGGGGGATTAGTTGGAATCTGTACCAXmaI site underlined
AtNPR1-FF:GCTCTGCTCGTCAATGGTTATC-
AtNPR1-RR:GAGGAGTCGGTGTTATCGGTA-
AtPR2-FF:CGGTACATCAACGTTGGAA-
AtPR2-RR:GCGTAGTCTAGATGGATGTT-
AtPR3-FF:CGCTTGTCCTGCTAGAGGTT-
AtPR3-RR:GCTCGGTTCACAGTAGTCTGA-
AtPDF1.2-FF:TCATGGCTAAGTTTGCTTCC-
AtPDF1.2-RR:AATACACACGATTTAGCACC-
AtActin1-FF:TCAATCCAGGAGATGTTTAGG-
AtActin1-RR:ACTGCTGGTACTCTGCGACA-
VaActin-FF:GATTCTGGTGATGGTGTGAGT-
VaActin-RR:GACAATTTCCCGTTCAGCAGT-

