Article

Genetic Variants Contributing to Colistin Cytotoxicity: Identification of TGIF1 and HOXD10 Using a Population Genomics Approach

1
Division of Nephrology, Indiana University School of Medicine, Indianapolis, IN 46202, USA
2
Division of Clinical Pharmacology, Indiana University School of Medicine, Indianapolis, IN 46202, USA
3
Juno Therapeutics, Seattle, WA 98109, USA
4
Department of Biological Sciences, University of Notre Dame, South Bend, IN 46556, USA
5
Department of Biology, Department of Computer Science, Loyola University Chicago, Chicago, IL 60660, USA
6
Department of Medicine, University of Chicago, Chicago, IL 60637, USA
*
Authors to whom correspondence should be addressed.
Int. J. Mol. Sci. 2017, 18(3), 661; https://doi.org/10.3390/ijms18030661
Submission received: 15 February 2017 / Revised: 15 March 2017 / Accepted: 16 March 2017 / Published: 18 March 2017
(This article belongs to the Special Issue Nephrotoxicity)

Abstract

:
Colistin sulfate (polymixin E) is an antibiotic prescribed with increasing frequency for severe Gram-negative bacterial infections. As nephrotoxicity is a common side effect, the discovery of pharmacogenomic markers associated with toxicity would benefit the utility of this drug. Our objective was to identify genetic markers of colistin cytotoxicity that were also associated with expression of key proteins using an unbiased, whole genome approach and further evaluate the functional significance in renal cell lines. To this end, we employed International HapMap lymphoblastoid cell lines (LCLs) of Yoruban ancestry with known genetic information to perform a genome-wide association study (GWAS) with cellular sensitivity to colistin. Further association studies revealed that single nucleotide polymorphisms (SNPs) associated with gene expression and protein expression were significantly enriched in SNPs associated with cytotoxicity (p ≤ 0.001 for gene and p = 0.015 for protein expression). The most highly associated SNP, chr18:3417240 (p = 6.49 × 10⁻⁸), was nominally a cis-expression quantitative trait locus (eQTL) of the gene TGIF1 (transforming growth factor β (TGFβ)-induced factor-1; p = 0.021) and was associated with expression of the protein HOXD10 (homeobox protein D10; p = 7.17 × 10⁻⁵). To demonstrate functional relevance in a murine colistin nephrotoxicity model, HOXD10 immunohistochemistry revealed upregulated protein expression independent of mRNA expression in response to colistin administration. Knockdown of TGIF1 resulted in decreased protein expression of HOXD10 and increased resistance to colistin cytotoxicity. Furthermore, knockdown of HOXD10 in renal cells also resulted in increased resistance to colistin cytotoxicity, supporting the physiological relevance of the initial genomic associations.

1. Introduction

Colistin (polymixin E) is a cyclic polypeptide antibiotic prescribed to treat resistant Gram-negative infections [1,2]. In clinical settings, the drug is administered as an anionic prodrug, colistin methanosulfate, which is subsequently hydrolyzed to the cationic colistin [3]. The major toxicities of colistin include nephrotoxicity [4] and neurotoxicity [5]. The use of colistin is often limited by nephrotoxicity, affecting up to 55% of recipients [6,7,8,9,10]. The deleterious consequences of nephrotoxicity include increased morbidity, mortality, and the development of chronic kidney disease. Clinical predictors of colistin nephrotoxicity do exist [11,12]; however, no genetic predictors of colistin nephrotoxicity have been discovered. The utility of the drug would be enhanced by the discovery of pharmacogenomic markers associated with toxicity that could be used to predict patients requiring dose reduction, altered dosing intervals, or increased monitoring to prevent nephrotoxicity.
Lymphoblastoid cell lines (LCLs) are a human cell-based model system that has been successfully utilized to identify genomic markers associated with cellular sensitivity to chemotherapeutics [13,14,15,16,17,18] and statins [19,20]. For this purpose, the LCL model from the International HapMap Consortium [21] has several advantages including publically available genetic information [21], gene expression [22], and protein expression data [23] to correlate with cytotoxicity (cell growth inhibition following drug exposure) phenotypes. Furthermore, associations between genetic variants and drug responses in LCLs have been replicated in patient samples [24,25,26,27]. Although tissue-specific patterns of gene and protein expression exist [28,29], the LCL model of drug-induced cytotoxicity captures components of the underlying polygenic architecture in non-hematologic toxicities of patients [30]. For example, single nucleotide polymorphisms (SNPs) associated with capecitabine-induced LCL cytotoxicity were enriched among SNPs associated with patient phenotypes of hand-foot syndrome [31]. Paclitaxel cytotoxicity-associated SNPs were likewise enriched among SNPs identified in a clinical trial of paclitaxel sensory peripheral neuropathy [32]. These successful translations from the LCL model to patients form the basis of our use of the LCL model to uncover genetic predictors of colistin toxicity.
In this report, we utilize an unbiased, comprehensive approach to identify genetic variants associated with colistin cytotoxicity that were further evaluated for potential functional significance through their association with gene expression and protein expression. The most highly associated SNP, located at chr18:3417240, was associated with colistin cytotoxicity and was a nominal cis-expression quantitative trait locus (eQTL) of its host gene, TGIF1 (transforming growth factor β (TGFβ)-induced factor-1), a homeobox gene and negative regulator of TGF-β [33,34]. The SNP was similarly associated with the expression of the multimeric form of a protein, HOXD10 (homeobox protein D10). To validate the associations from our population genetic analyses and establish the relevance of these genetic associations in renal tissue, small interfering RNA (siRNA) knockdowns of TGIF1 and HOXD10 were undertaken in renal proximal tubular epithelial cells [35], among the cells most susceptible to renal toxicity [36].
The pharmacogenomic markers identified through these studies reveal important considerations in the molecular biology and pathogenesis of colistin toxicity and can be evaluated as predictors of toxicity in future clinical settings.

2. Results

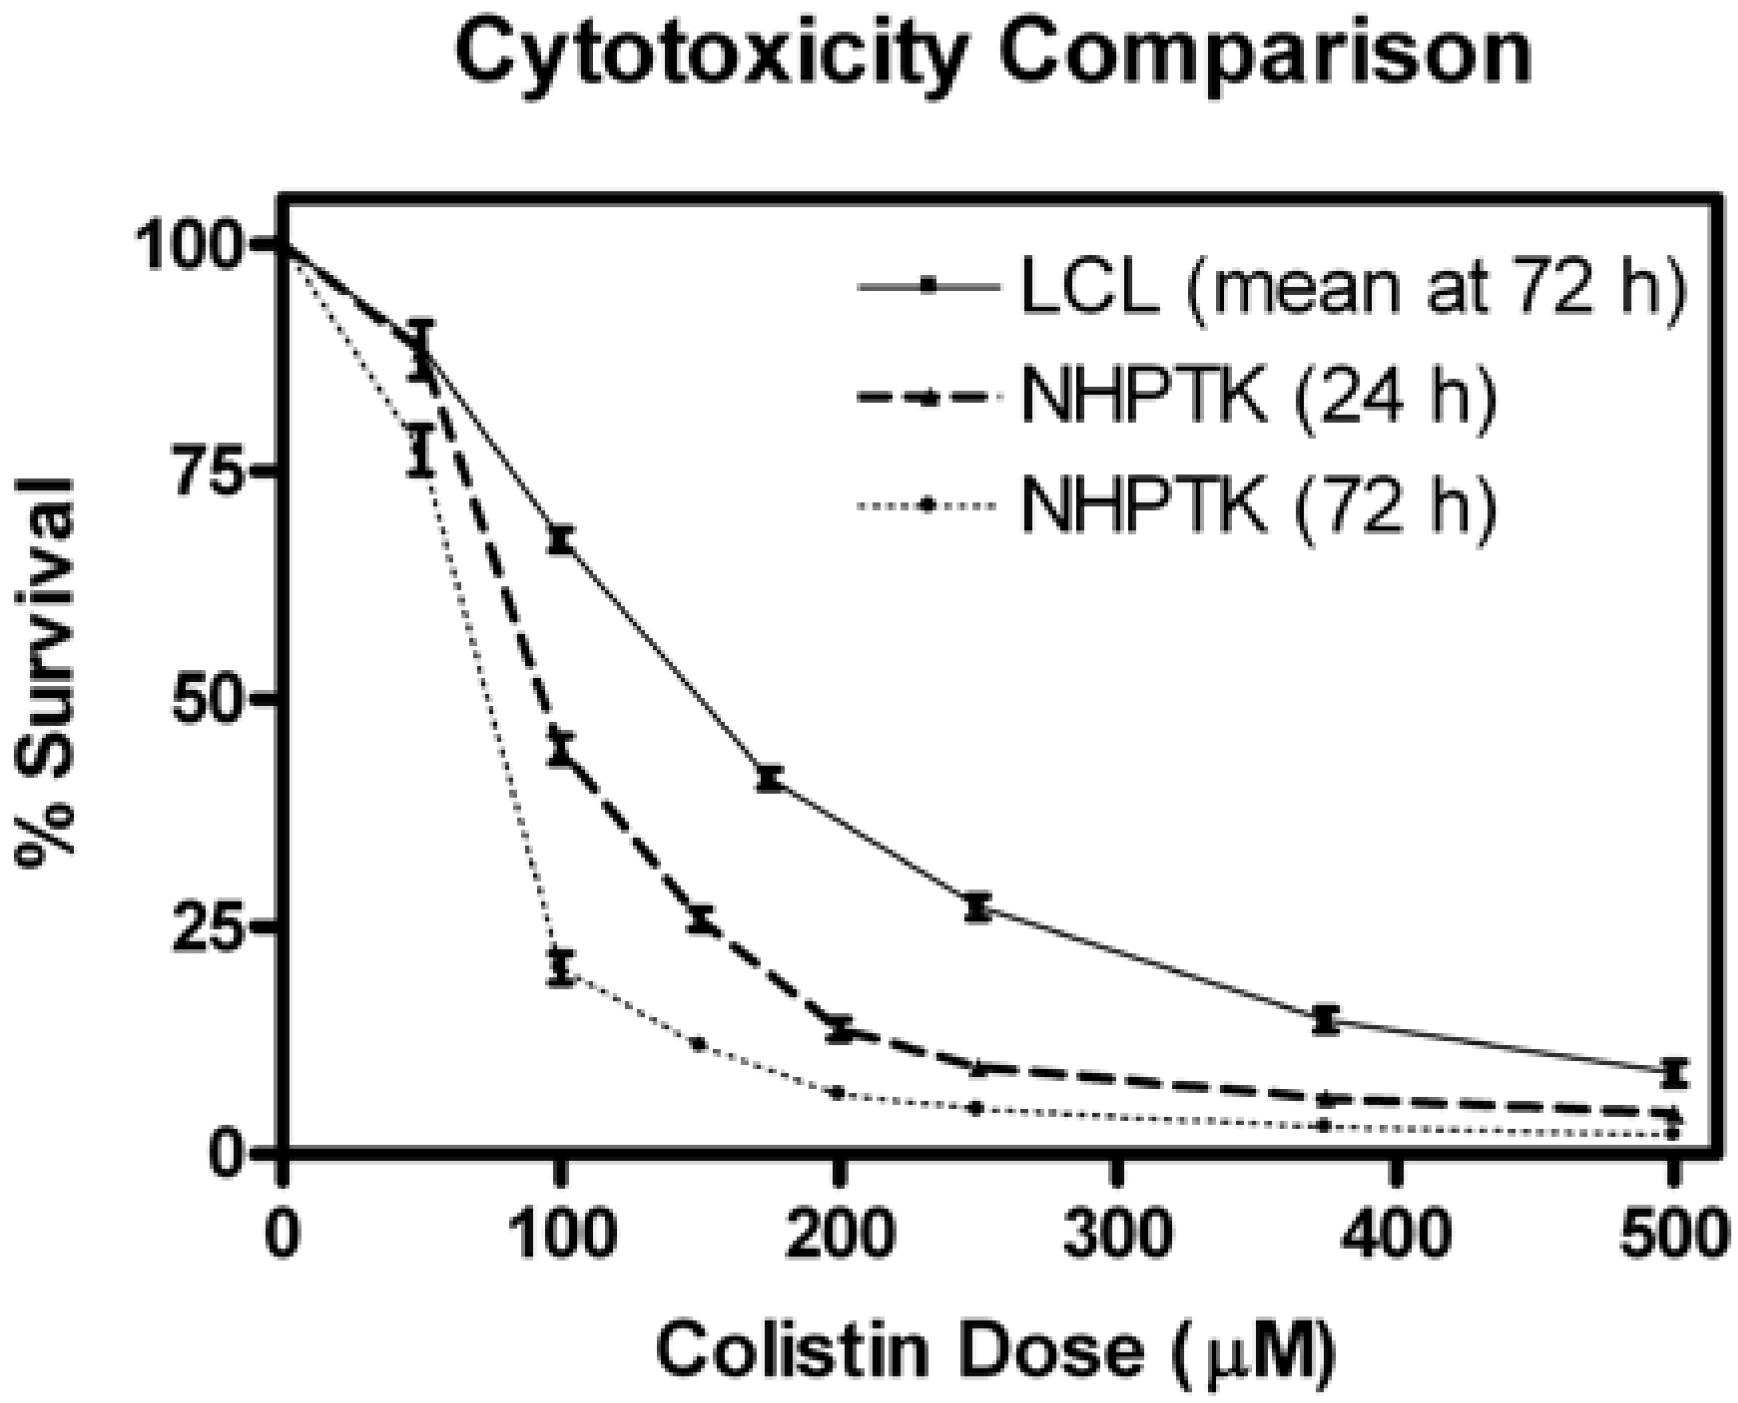
2.1. Colistin-Induced Cytotoxicity in Lymphoblastoid Cell Lines

Lymphoblastoid cell lines derived from individuals within the Yoruban (YRI) YRI1 and YRI3 populations were assessed for sensitivity to colistin. The mean half maximal inhibitory concentration (IC50) for all 68 unrelated cell lines was 176.5 ± 6.6 µM. Phenotypes were generated from the log2 IC50 of each cell line and a histogram of the distribution of these phenotypes is illustrated in Figure S1. These phenotypes were normally distributed, passing a Kolmogorov–Smirnov normality test (p ≥ 0.05).

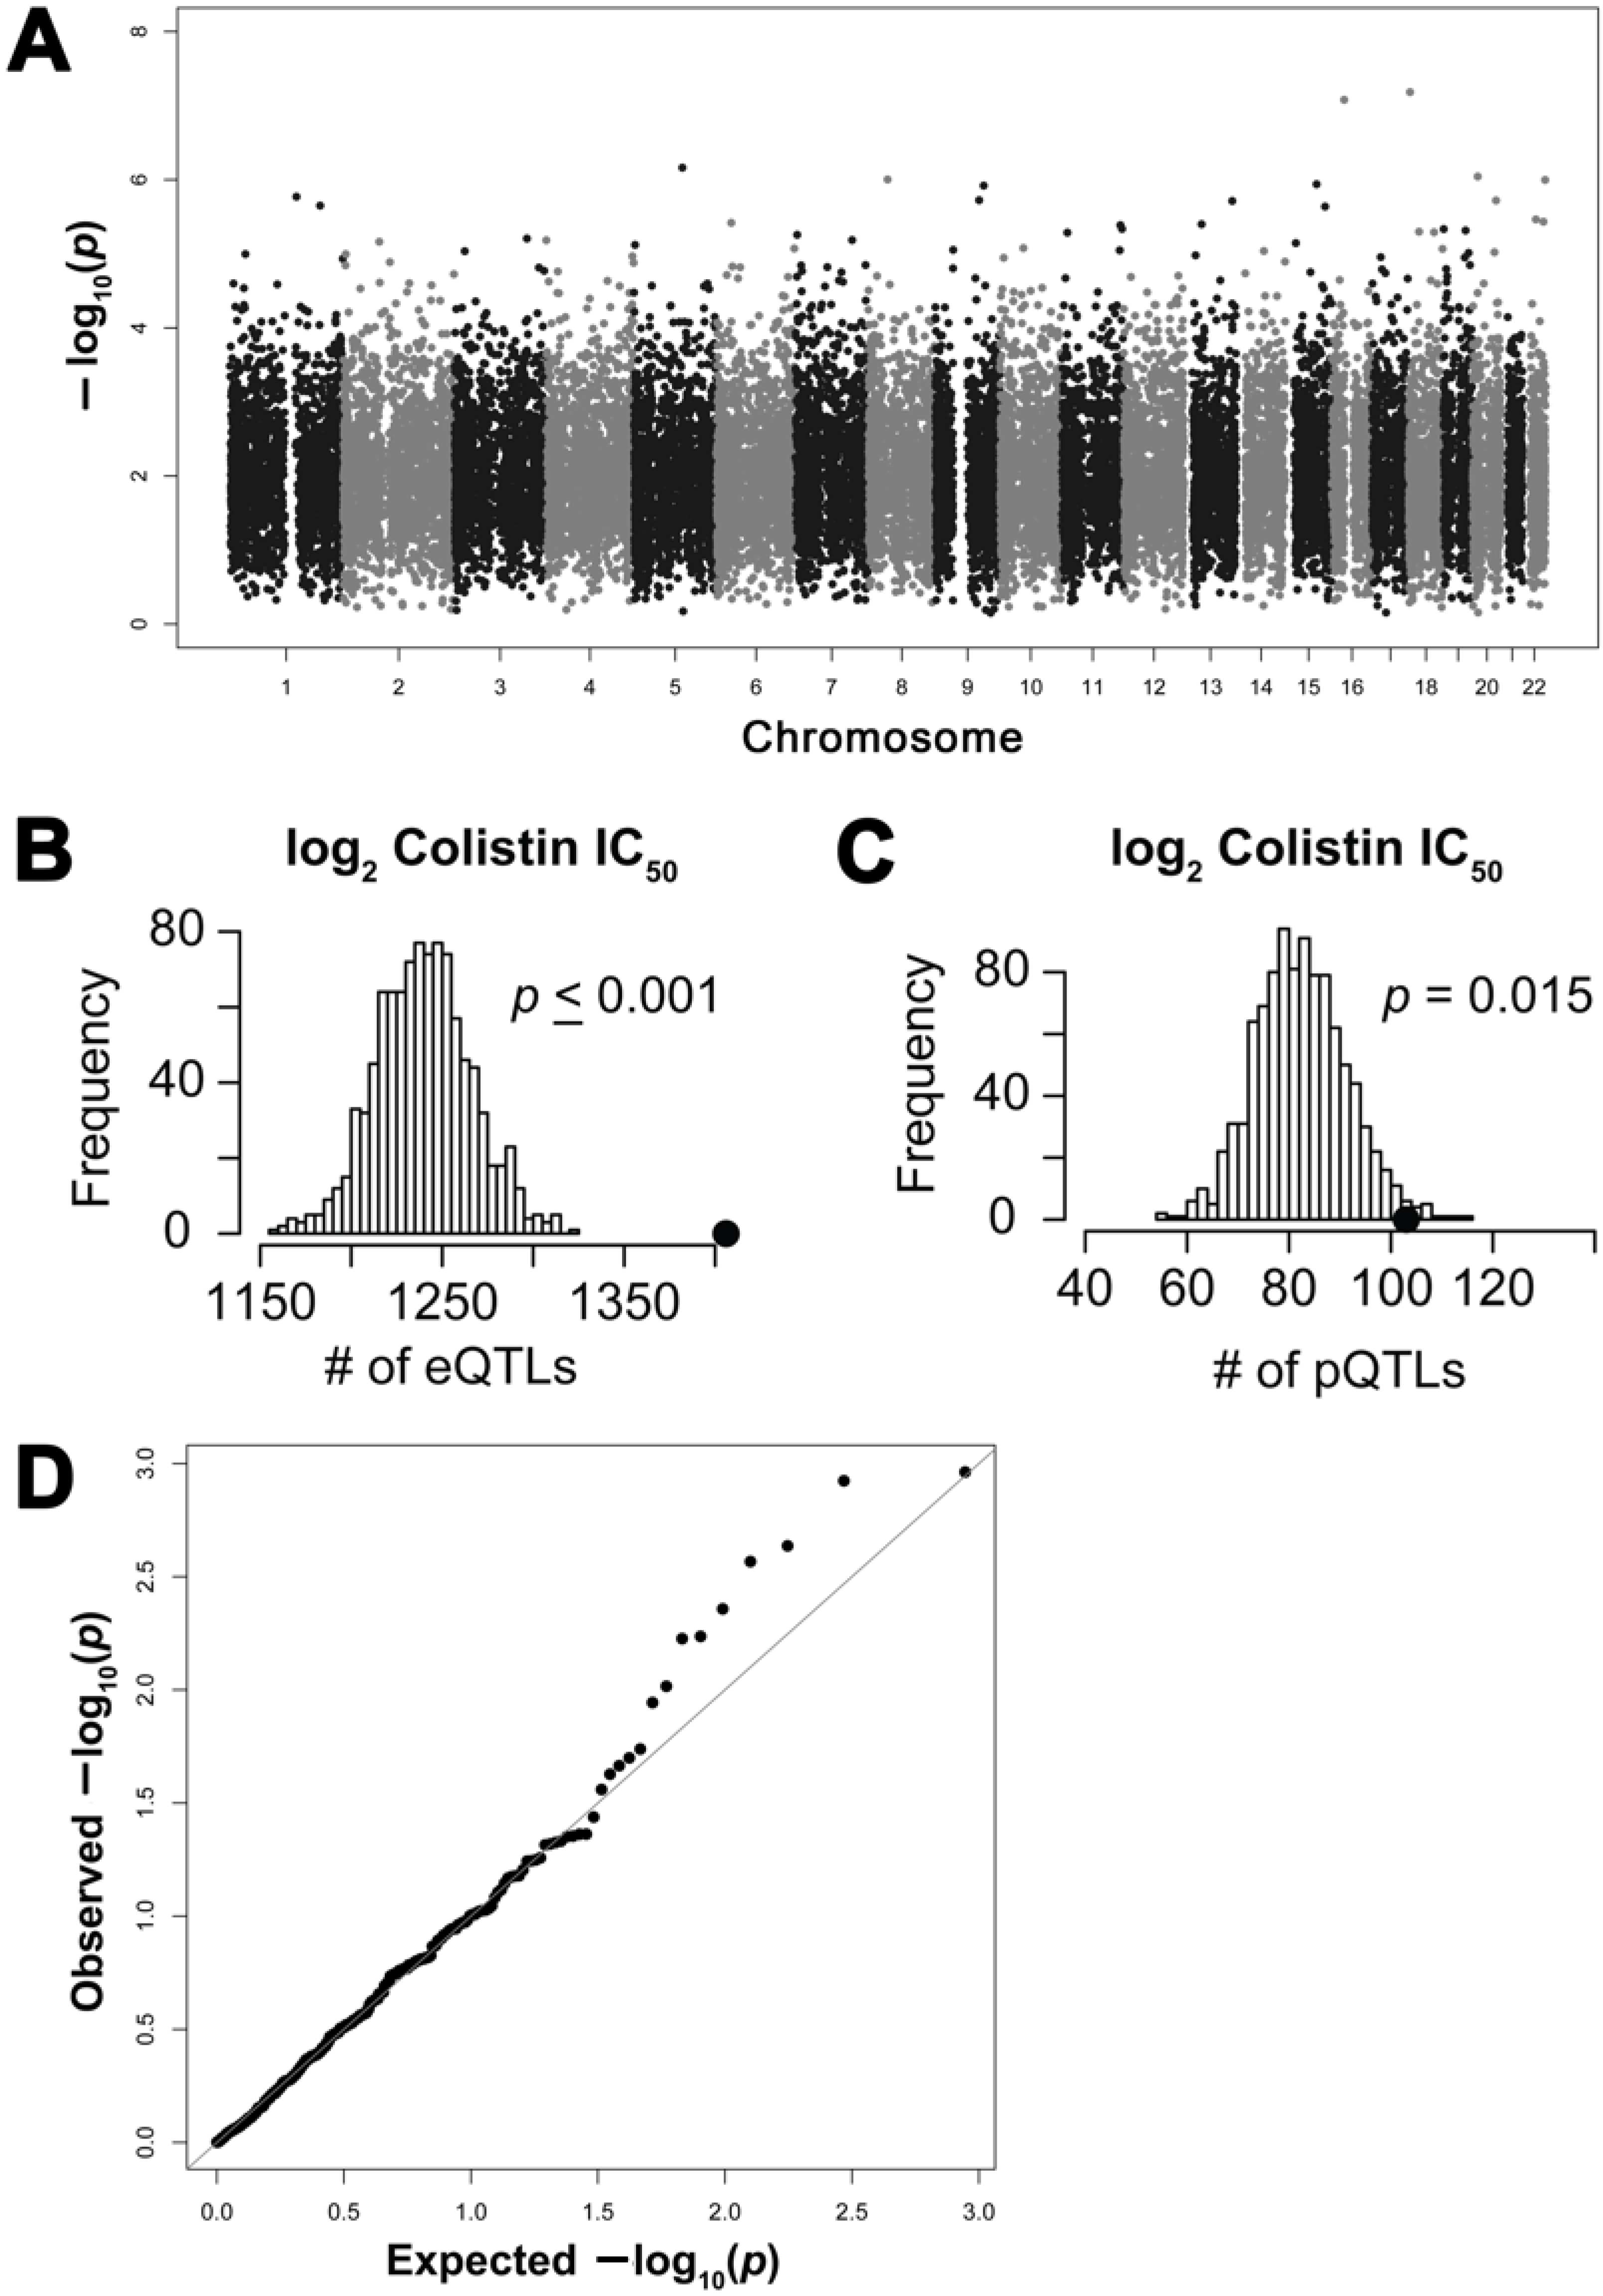
2.2. Genome-Wide Association Study of Colistin Cytotoxicity

Figure 1 illustrates our overall approach. A genome-wide association study (GWAS) performed with colistin log2 IC50 phenotypes did not result in any SNPs meeting Bonferroni genome-wide significance at p ≤ 5 × 10⁻⁸ (Figure 2A); however, 12,948 SNPs were associated with the log2 IC50 of colistin cytotoxicity at a nominal significance threshold of p ≤ 0.001. After pruning for linkage disequilibrium (LD), 2711 SNPs in separate recombination blocks were significant at this threshold. These SNPs were defined as drug quantitative trait loci (dQTLs) and are listed in Table S1.

2.3. Functional Enrichment of Expression Quantitative Trait Loci and Protein Quantitative Trait Loci

To determine whether colistin cytotoxicity dQTLs were enriched in SNPs that were also associated with gene expression as has been observed for several chemotherapeutics [37], we performed a permutation analysis with eQTLs defined as those SNPs associated with at least one of 18,227 genes measured by RNA sequencing (RNAseq) at a threshold of p ≤ 0.0001 [38]. From among the 2711 dQTLs, 1402 SNPs were also eQTLs and were significantly enriched when compared to that expected by random chance (Figure 2B, empirical p ≤ 0.001).
Using a protein dataset composed of 441 human signaling and transcription factor proteins that were quantified in these cell lines using a microwestern and/or reverse phase protein array [23,39], we evaluated for the enrichment of protein quantitative trait loci (pQTLs); genotype correlated to protein expression at p ≤ 0.0001). Of the 2711 dQTLs, 271 were associated with baseline expression of 130 unique proteins (Supplementary Table S2). However, mRNA expression significantly affected expression of many of these protein associations. After correcting for mRNA expression, 104 SNPs were identified as pQTLs independent of eQTLs. The 104 mRNA-independent pQTLs represent a significantly enriched functional set of SNPs (Figure 2C, p = 0.015).

2.4. Association of Protein Expression with Colistin Cytotoxicity

The direct correlation between baseline protein expression of the 441 proteins and colistin log2 IC50 was then queried. The significance of these associations is provided in a quantile–quantile (Q–Q) plot with a multiple testing corrected false discovery rate (FDR) of 0.05 (Figure 2D). Fourteen proteins had observed associations stronger than those expected by chance. At a relaxed p ≤ 0.05, 23 proteins were associated with colistin cytotoxicity (Table S3).

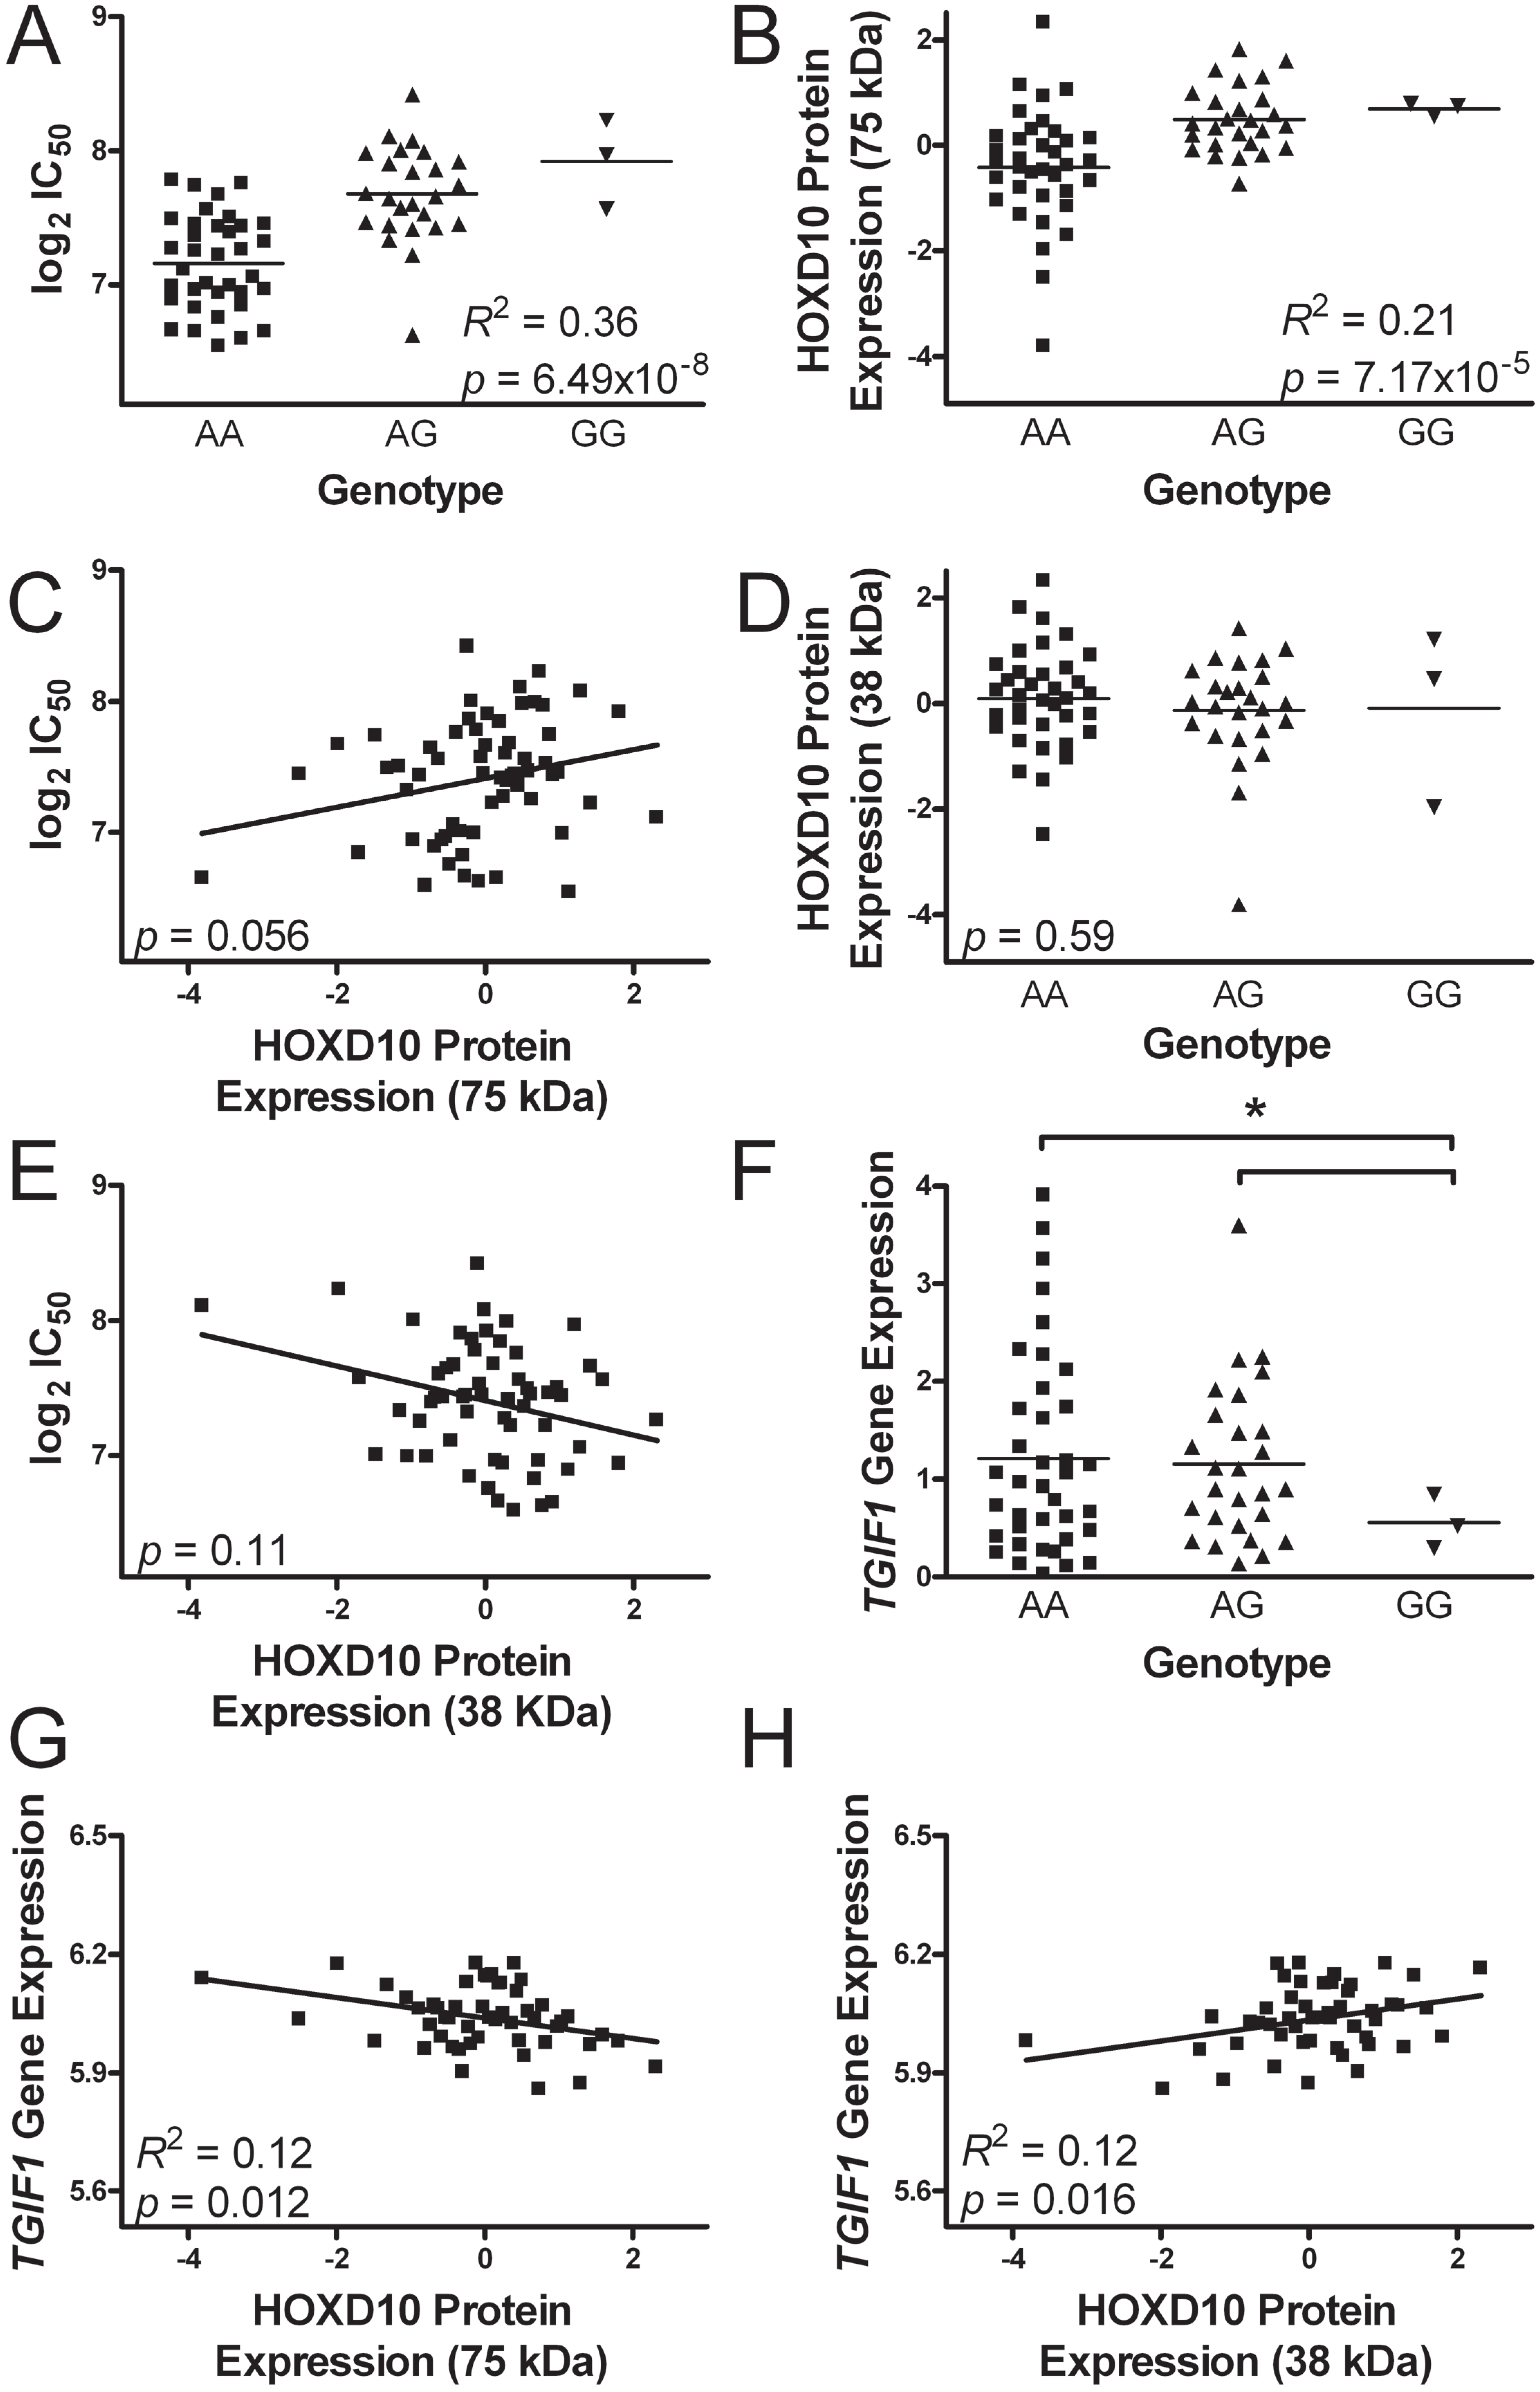
2.5. Evaluation of the Most Significant Single Nucleotide Polymorphism Associated with Colistin Cytotoxicity

The SNP most significantly associated with colistin cytotoxicity in the 68 cell lines was an imputed intronic SNP located on chromosome 18 at base pair 3,417,240 (GRCh38/hg38) in the gene TGIF1. The genotype of this dQTL, hereby referred to as chr18:3417240, was correlated with the log2 IC50 for colistin at a level close to the genome-wide significance threshold of 5 × 10⁻⁸ (R2 = 0.36, p = 6.49 × 10⁻⁸, Figure 3A). The minor allele (G) frequency was 24.3% in the population studied and this allele conferred resistance to colistin cytotoxicity. Although the association between chr18:3417240 and colistin cytotoxicity nearly reached a genome-wide threshold of significance, many downstream associations with baseline protein and baseline gene expression in LCLs did not approach Bonferroni-corrected levels of significance. We present these downstream targets to glean insight into the functional relationship between the SNP and colistin cytotoxicity.

2.6. chr18:3417240 and Homeobox Protein D10 Expression

To better understand how chr18:3417240 might mediate resistance to colistin cytotoxicity, we examined whether it was also an eQTL or pQTL. In both the genotype-RNAseq expression and genotype-protein association studies, chr18:3417240 was most strongly associated with expression of the protein HOXD10. Homeobox protein D10 is encoded by its gene located on chromosome 2. The monomeric form is 38 kDa in size, but it is well known to form multimers by dimerization, heterodimerization, or trimerization [40,41]. On the microwestern array, both a 38 kDa HOXD10 isoform and a 75 kDa isoform were found. It is possible that the 75 kDa isoform represents a multimeric or cross-hybridized form of HOXD10; however, the sensitivity of the microwestern array is insufficient to discern the exact size and nature of this isoform.
Chr18:3417240 was identified as a trans-pQTL, associated with expression of the 75 kDa form of the protein HOXD10 (R2 = 0.21, p = 7.17 × 10⁻⁵). The G allele correlated with higher levels of 75 kDa protein expression on the microwestern array (Figure 3B). Based on the positive correlation of the G allele with both 75 kDa expression and the log2 IC50 of colistin (from Figure 3A,B), the 75 kDa expression is predicted to correlate positively with the log2 IC50 of colistin (i.e., greater HOXD10 75 kDa expression predicts resistance to colistin cytotoxicity). While the directionality of this association followed predictions, the relationship between 75 kDa protein expression and the log2 IC50 of colistin failed to reach significance (p = 0.056, Figure 3C).
A second HOXD10 isoform of approximately 38 kDa was also detected on the microwestern array. This 38 kDa isoform may represent the monomeric form of HOXD10 on the microwestern array. The genotype of chr18:3417240 was not significantly associated with expression of 38 kDa HOXD10 (Figure 3D). Further, expression of the 38 kDa HOXD10 did not significantly correlate with the log2 IC50 of colistin (p = 0.11, Figure 3E). Although non-significant, both relationships held the opposite direction of effect to the 75 kDa HOXD10 protein expression (i.e., reduced 38 kDa HOXD10 predicts resistance to colistin).
We then examined whether HOXD10 baseline gene expression by RNAseq correlated with genotype, protein expression, or cytotoxicity. Unfortunately, HOXD10 gene expression was only detected above background thresholds in 3 of 68 cell lines. Thus, no relationship with gene expression could be established using the RNAseq expression [38]. We entertained the idea that HOXD10 gene expression was insufficiently captured by RNAseq and examined baseline LCL expression on a second platform, an Illumina microarray [42]. Although expression measurements were available for 53 of the LCLs, the dynamic range of expression was small. No significant associations between HOXD10 gene expression and genotype, protein expression, or cytotoxicity were found. Thus, chr18:3417240 appears to be an mRNA-independent pQTL of HOXD10. However, we cannot exclude the possibility that small, undetectable differences in gene expression mediate the variation in protein expression.

2.7. Transforming Growth Factor β-Induced Factor-1 Gene Expression

Chr18:3417240 genotype was associated with expression of its host gene TGIF1 (Figure 3F). Using gene expression measured by RNAseq, the homozygous recessive genotype (GG) was associated with lower expression of TGIF1 as compared to either the homozygous dominant (AA, p = 0.021) or heterozygous (p = 0.031) genotypes. No significant expression difference was observed between the AA and AG genotypes.
We then sought to explore the relationship between TGIF1 gene expression with both colistin cytotoxicity and HOXD10 protein expression. Based on the correlation of the GG genotype with increased log2 IC50 of colistin, increased 75 kDa HOXD10 expression, and reduced TGIF1 expression (from Figure 3A,B,F), higher TGIF1 gene expression is predicted to: (i) negatively correlate with the log2 IC50 of colistin (i.e., knockdown of gene expression would increase cellular sensitivity to colistin); (ii) negatively correlate with 75 kDa expression of HOXD10; and (iii) positively correlate with 38 kDa HOXD10 expression. None of these three associations reached statistical significance using expression data from RNAseq (Figure S2).
To complement the RNAseq expression data, we again examined a second set of expression data for the same LCLs from the Illumina array platform. Using these expression data, TGIF1 gene expression did correlate significantly with HOXD10 protein expression (Figure 3G–H). Consistent with the predictions above, TGIF1 expression negatively correlated with 75 kDa HOXD10 expression (R2 = 0.123, p = 0.012) and positively with 38 kDa HOXD10 expression (R2 = 0.12, p = 0.016). The direction of effect for the Illumina array associations was the same as those of the RNAseq associations. The association between the GG genotype of chr18:3417240 and TGIF1 expression on the Illumina array persisted (Figure S2, p = 0.05), in accordance with the results from RNAseq. The relationship between TGIF1 expression and log2 IC50 of colistin remained non-significant on the Illumina platform. These data support the hypothesis that chr18:3417240 impacts TGIF1 expression and that TGIF1 expression in turn affects HOXD10 protein isoform expression.

2.8. Homeobox Protein D10 Expression Is Upregulated in the Kidney in Response to Colistin, Independent of Its Gene Expression

One goal of this investigation was to identify genetic variants in LCLs that predict susceptibility to colistin-induced nephrotoxicity; however, gene and protein expression patterns vary in different tissues [28,29]. Variants, genes, and proteins discovered in LCLs may not be associated with colistin toxicity in the kidney. As a result, we sought to determine whether the HOXD10 protein was expressed in kidney and whether this expression was affected by colistin administration.
Mice were administered either colistin (16 mg/day) or saline intraperitoneally and sacrificed on day 3 or 15 as previously described [36]. The dose was approximately twice the upper limit of the recommended corresponding weight-based human dose and the timing reflected a typical two-week course of antibiotics. Homeobox protein D10 expression and distribution was assessed in formalin fixed kidney by immunohistochemistry (IHC; Figure 4A–C). Even before the onset of overt pathologic kidney injury, HOXD10 protein expression was subtly but significantly upregulated after three days of colistin exposure (Figure 4D, 0.368% ± 0.1%) compared with control (0.106% ± 0.03%, p = 0.044), as determined by the total proportion of stained pixels in a 40× field. HOXD10 was more remarkably upregulated after 15 days of colistin administration (4.62% ± 0.86%, p = 0.00079). Multiple portions of the kidney were affected, including the glomeruli, interstitium, and proximal tubules. S1 and S2 proximal tubules revealed increased staining in the luminal brush border. S3 proximal tubules of the outer medullary stripe revealed upregulated cytoplasmic staining with some nuclear staining. These data provide the rationale for the functional validation of the TGIF1–HOXD10 axis in normal human proximal tubular kidney (NHPTK) cells below.
To understand whether gene expression played a role in the HOXD10 protein expression changes, we extracted data from an Illumina Mouse WG-6 Expression array performed in control mice and those receiving colistin for three days (Figure 4E). Transforming growth factor β is known to interact with Tgif1. Tgfb3 (transforming growth factor β-3) gene expression was significantly upregulated (1.81 ± 0.058 fold increase, p = 0.016), suggesting this pathway is activated in mice receiving colistin. Hoxd10 gene expression was not significantly changed (94% ± 0.8% of control, p = 0.699). This may be consistent with the lack of mRNA and protein expression correlation observed in LCLs; however, small changes in gene expression at the limits of detection cannot be excluded. Tgif1 gene expression was not significantly increased (1.16 ± 0.02-fold increase, p = 0.11). Speculation regarding the lack of significant differential Tgif1 expression after three days of colistin is provided in the discussion. The murine kidney IHC and array data presented here provided us enough justification to move forward with the functional validation outlined below. These data will also provide the basis for future gene knockdown experimentation and pathway interrogation in organisms.

2.9. Colistin-Induced Cytotoxicity in Human Proximal Tubular Cells

The cellular sensitivity of NHPTK cells to colistin was assessed 24 and 72 h after exposure. Normal human proximal tubular kidney cells are primary renal tubular epithelial cells from a single donor that have been immortalized by human telomerase elongation. When maintained in renal epithelial growth medium, the NHPTK cell line closely resembles primary proximal tubular cells with a renal phenotype that includes transporter expression and function, tight junction formation, and parathyroid hormone responsiveness [35,43]. Normal human proximal tubular kidney cells were more sensitive to colistin than LCLs (Figure 5). This finding parallels the clinical side effect profile of colistin which includes nephrotoxicity, but not hematotoxicity. The mean IC50 in LCLs and NHPTK cells were 176.5 ± 6.6 µM and 65 ± 6.0 µM after 72 h of drug exposure, respectively. The IC50 in NHPTK cells after 24 h was 94.7 ± 5.9 µM. Given the susceptibility of NHPTK cells to colistin, the 24 h time point was selected for subsequent analyses.

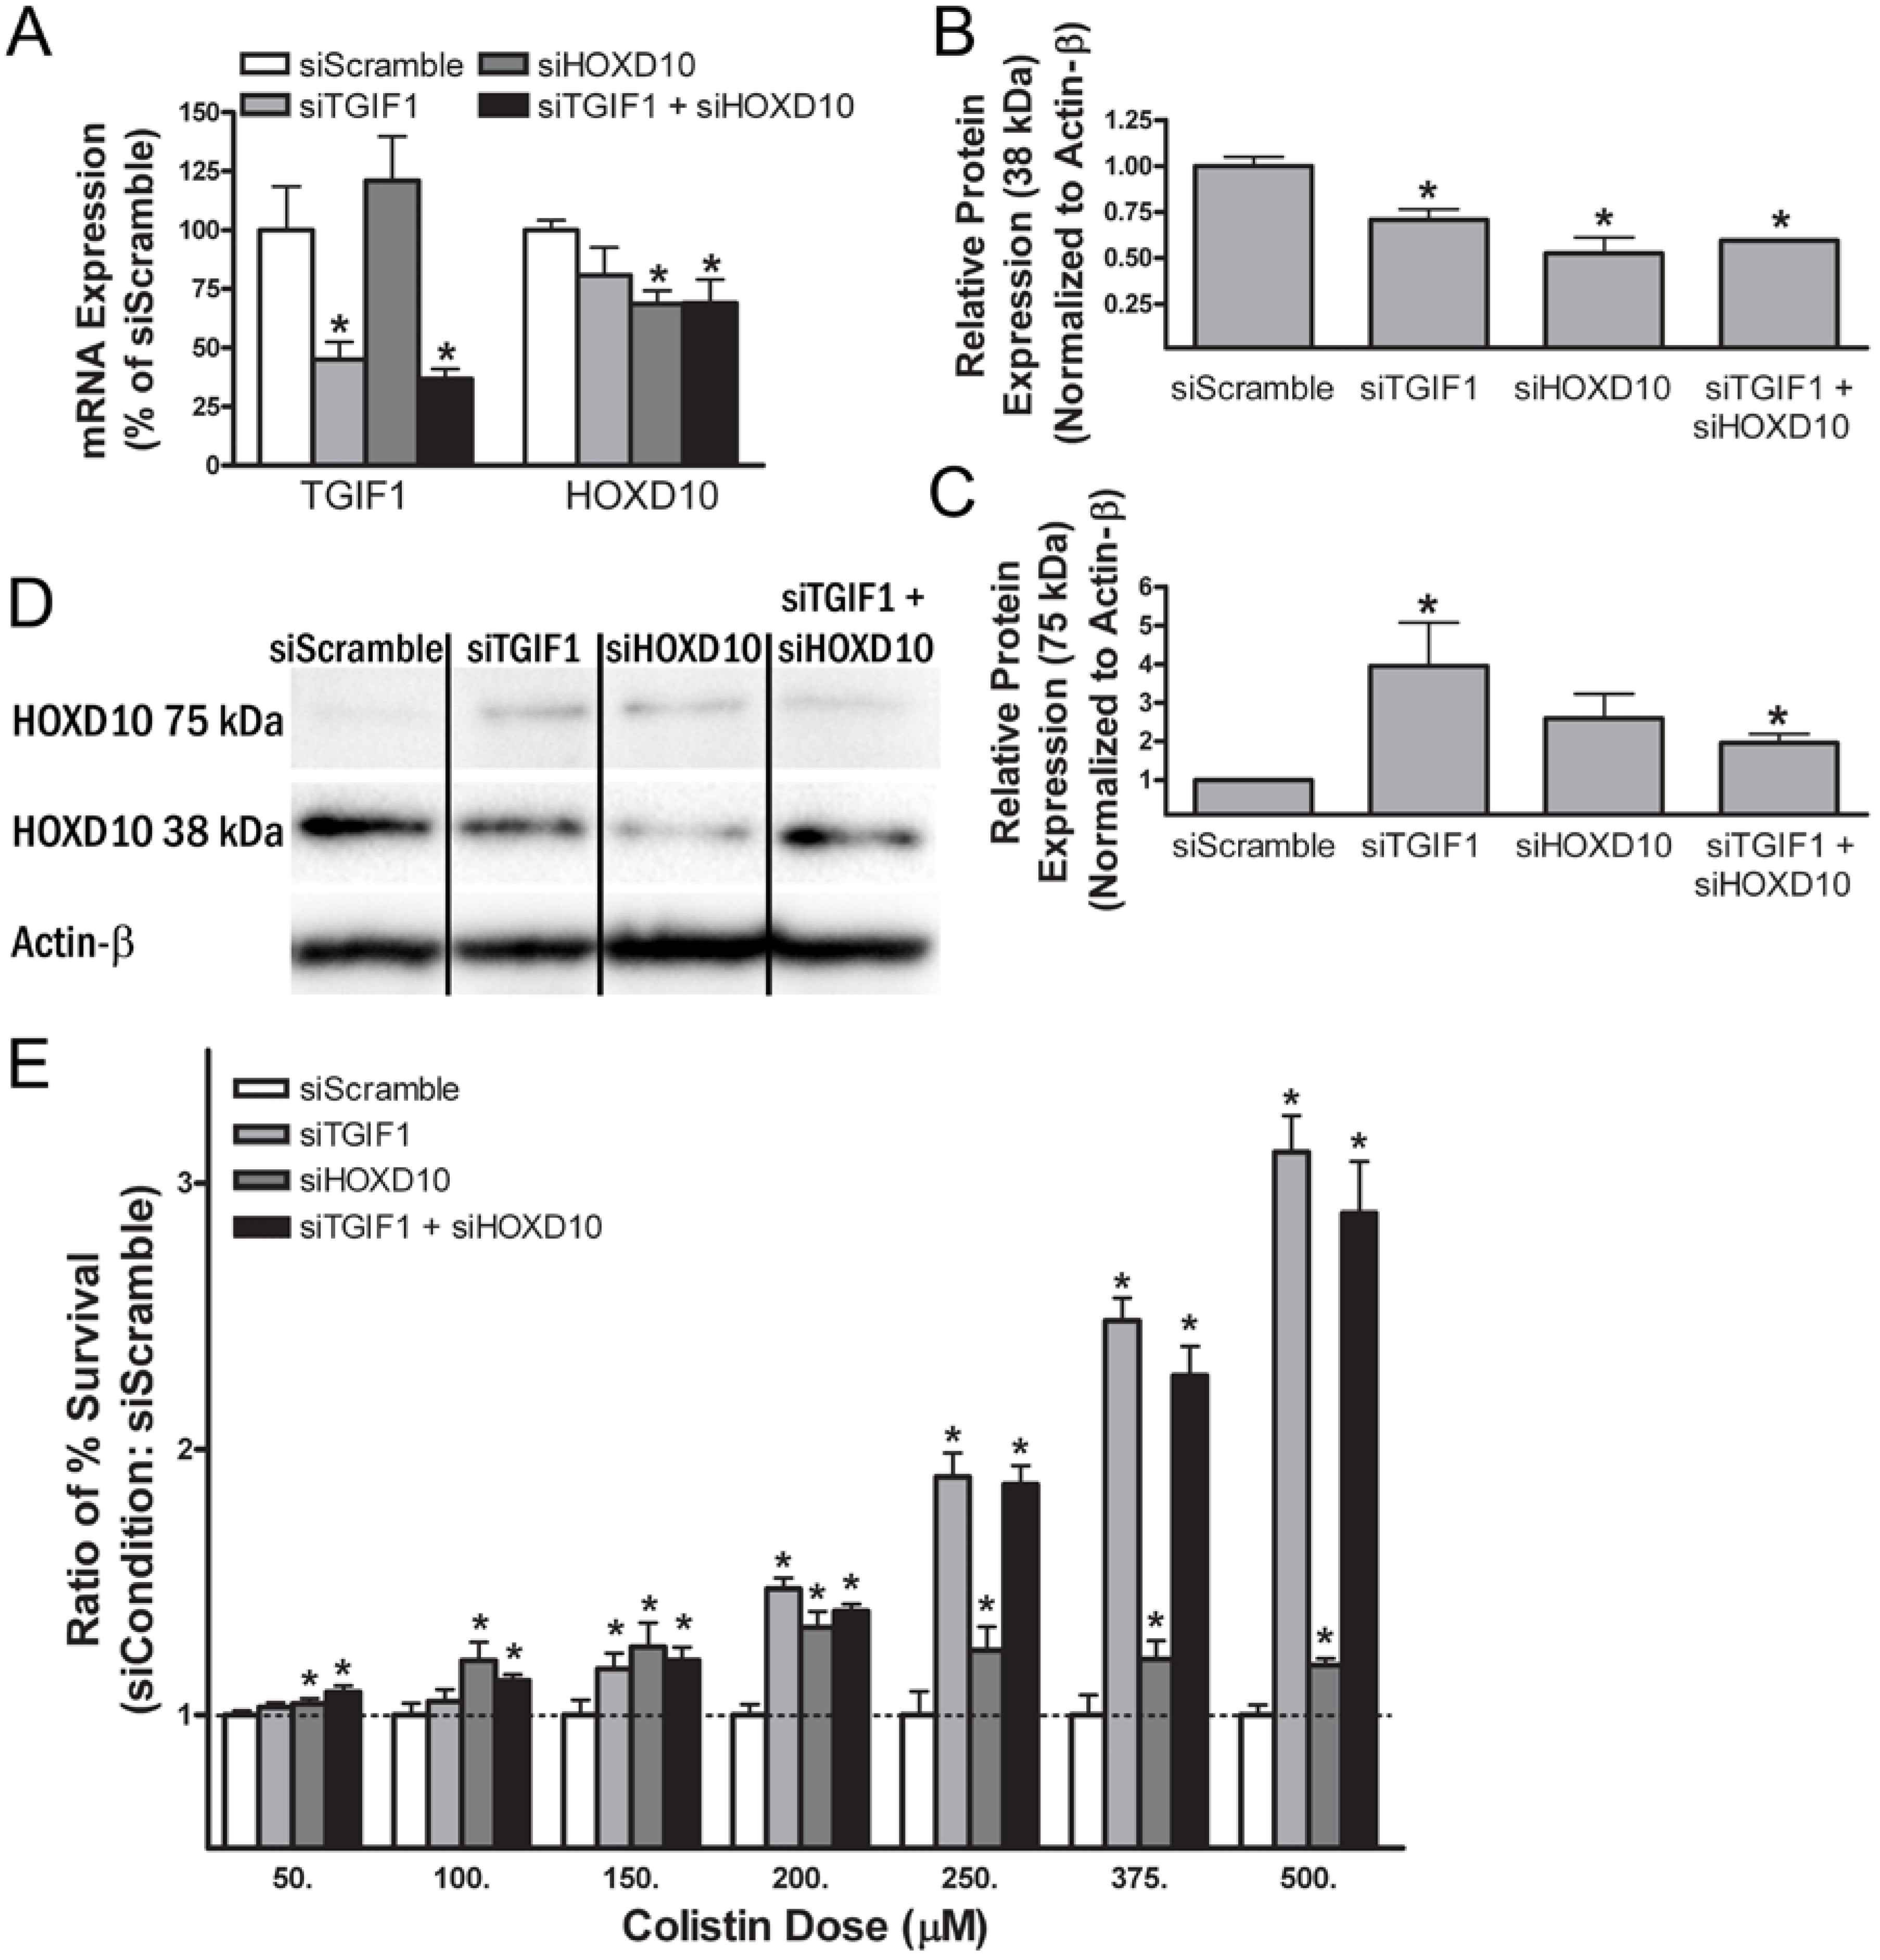
2.10. Smal Interfering RNA Knockdown of Transforming Growth Factor β-Induced Factor-1 and Homeobox Protein D10 Alters Gene and Protein Expression in Renal Cells

To validate the functional significance of TGIF1 gene expression and HOXD10 protein expression in mediating colistin cytotoxicity, mRNA expression of TGIF1 and HOXD10 were reduced with siRNA knockdown and cellular sensitivity was compared to a scrambled siRNA (siScramble) control. Four conditions were evaluated: siScramble control, siTGIF1, siHOXD10, and siTGIF1 + siHOXD10 (a combined knockdown). siRNA knockdown of TGIF1 reduced its gene expression to 45.1% ± 7.5% 24 h after knockdown compared to the time matched siScramble control (p = 0.018, Figure 6A). siHOXD10 displayed no significant effect on expression of TGIF1 (1.21 fold increase, p = 0.47). The combination of siTGIF1 + siHOXD10 knockdown reduced TGIF1 expression to 36.8% ± 1.9% (p = 0.027) as compared to siScramble 24 h after knockdown.
In the population genomic studies described above, HOXD10 protein expression did not significantly correlate with HOXD10 gene expression. Despite this, we posited that siRNA knockdown of HOXD10 mRNA might still result in a significant change in HOXD10 protein expression. Based on the associations in Figure 3G–H, we further hypothesized that TGIF1 knockdown would reduce monomeric HOXD10 protein expression and increase 75 kDa HOXD10 protein expression.
Homeobox protein D10 was lowly expressed by real-time quantitative polymerse chain reaction (qRT-PCR) in NHPTK cells with raw threshold cycle (CT) values in the 30–32 range. By contrast, TGIF1 CT values were approximately 21–22. Nonetheless, HOXD10 expression was modestly reduced to 68.7% ± 5.6% of the siScramble control 24 h after knockdown (p = 0.0068). Homeobox protein D10 expression was reduced to 69.1% ± 9.9% of the control (p = 0.023) after the combined siTGIF1 + siHOXD10 knockdown. siTGIF1 did not cause a significant reduction in HOXD10 gene expression (80.8% ± 11.6%, p = 0.18).
Homeobox protein D10 expression of both the 38 kDa and 75 kDa isoforms was assessed by Western immunoblot for each of the four conditions after siRNA knockdown (n = 5 for each condition). siHOXD10 resulted in a reduction of its own monomeric protein expression (52.6% ± 8.7% of control, p = 0.0022) as estimated by densitometry (Figure 6B–D). Despite the lack of HOXD10 gene and protein expression correlation in the population genomics studies, this finding is consistent with the conclusion that relatively modest reductions in HOXD10 mRNA can result in reductions in its protein expression. siTGIF1 + siHOXD10 resulted in a similar reduction in monomeric HOXD10 protein expression (59.4% ± 0.5% of control, p = 0.0009) as estimated by densitometry. Finally, siTGIF1 knockdown also resulted in a reduction in monomeric HOXD10 protein expression (70.7% ± 5.9% of control, p = 0.0087) as estimated by densitometry.
In contrast, the siTGIF1 and siTGIF1 + siHOXD10 conditions showed increased levels of protein detected by the HOXD10 antibody at 75 kDa (siTGIF1: 3.5 ± 1.4-fold increase, p = 0.044; siTGIF1 + siHOXD10: 1.5 ± 0.2-fold increase, p = 0.040). siHOXD10 did not significantly increase 75 kDa HOXD10 (2.2 ± 0.6-fold, p = 0.065). In NHPTK cells, total HOXD10 protein was still reduced in all conditions because the proportion of the 38 kDa protein far outweighed the 75 kDa protein.
These findings support the population genomics results presented in Figure 3. Expression of the TGIF1 gene was positively correlated with monomeric HOXD10 protein expression and negatively correlated with 75 kDa HOXD10 expression. Given the limitations in determining HOXD10 gene expression by RNAseq, Illumina array, and qRT-PCR, it cannot be determined from these studies whether TGIF1 gene expression changes result in HOXD10 protein changes via downstream post-translational modifications or by subtle reductions in gene expression.

2.11. Small Interfering RNA Knockdown of Transforming Growth Factor β-Induced Factor-1 and Homeobox Protein D10 Alters Sensitivity to Colistin in Normal Human Proximal Tubular Kidney Cells

The effect of siRNA knockdown of TGIF1 and HOXD10 mRNA on colistin cytotoxicity was assessed in NHPTK cells. Based on the population genomic studies presented in Figure 3 and Figure S2, a higher colistin log2 IC50 (i.e., increased resistance to colistin cytotoxicity) correlated with the G allele of chr18:3417240. Increased resistance to colistin cytotoxicity is predicted to correlate with: (i) reduced TGIF1 gene expression; (ii) reduced monomeric HOXD10 expression; and (iii) increased 75 kDa HOXD10 expression. Thus, siRNA knockdown of each condition (siTGIF1, siHOXD10, and siTGIF1 + siHOXD10) is expected to elicit an increase in resistance to colistin cytotoxicity as compared to a scrambled siRNA.
siTGIF1 knockdown resulted in an increase in cell survival in response to colistin (Figure 6E). Although no significant difference was observed at the 50 or 100 µM colistin dose, at higher doses of 150 µM to 500 µM, NHPTK cells were more resistant to colistin as compared to the dose matched siScramble. The relative increase (ratio of siTGIF1 to siScramble) for each concentration is provided in Figure 6E and ranged from a 17.4% to 211.8% increase in relative resistance. The absolute increase in resistance was modest but significant, ranging from 4.5% to 9.4% at each concentration of 150 µM or higher (p ≤ 0.05). Both the absolute and relative resistance increased with increasing doses.
siHOXD10 knockdown also resulted in an increase in cell survival in response to colistin as compared to the siScramble. Significant but modest increases were observed at each colistin dose. Compared with siTGIF1, the relative increase in resistance caused by siHOXD10 was more consistent across each colistin dose, ranging from 4.3% to 33.1% at each dose (p ≤ 0.05). The absolute increase in resistance ranged from 9.4% at the 100 µM dose down to only 0.8% at the 500 µM dose.
Combined mRNA reduction with siTGIF1 and siHOXD10 resulted in neither a synergistic nor additive effect; rather, the combined knockdown recapitulated the stronger of the effects from either siTGIF1 or siHOXD10 at each dose. For example, at lower colistin doses (50–150 µM), the relative and absolute increases in resistance were similar to siHOXD10 (8.7% to 20.7% relative increase, p ≤ 0.05). At higher concentrations (250–500 µM), the relative and absolute increases in resistance were similar to siTGIF1 (86.8% to 189.1% relative increase, p ≤ 0.05).

3. Discussion

In this investigation, the results of a comprehensive GWAS of colistin cytotoxicity are presented. Colistin cytotoxicity associated SNPs were enriched in eQTLs and mRNA-independent pQTLs. The data presented in this investigation suggest that chr18:3417240 is a dQTL of colistin, an mRNA independent pQTL of the protein HOXD10 and nominal cis-eQTL of its host gene TGIF1. After confirming in vivo kidney expression of HOXD10, these associations were then tested in human renal proximal tubular cells through siRNA knockdown, supporting the relationship of TGIF1 and HOXD10. Specifically, the knockdown of TGIF1 led to reduced protein expression of monomeric HOXD10.
Transforming growth factor β-Induced homeobox 1, or TGIF1, is a protein-coding gene important in the TGF-β signaling axis [33]. In conjunction with Smad, it is a known repressor of TGF-β [34], and rises in response to elevated levels of the cytokine [44]. The TGIF1 protein binds directly to c-Jun to assemble with Smad proteins and mediate the transcriptional repression of TGF-β and other genes [45]. In the presented studies, TGIF1 siRNA knockdown resulted in increased cell survival following colistin exposure. Expression of TGIF1 has been demonstrated to regulate stem cell self-renewal [46] and in TGIF1 (−/−) knockout mice, loss of expression correlated with higher repopulation of bone marrow cells [46]. The TGIF1 gene is known to have over 20 splicing variants [47]. Transcript variant expression levels have been measured in tissues with over- or under-expression of certain variants correlating with the presence or absence of malignancy. In a study of oral squamous cell carcinomas, transcript TGIF1-008 was over-expressed and TGIF1-005 under-expressed in malignant tissue [48].
siTGIF1 resulted in reductions in HOXD10 protein expression in our studies. However, siTGIF1 and siHOXD10 had different patterns of cytotoxicity with siTGIF1 resulting in more pronounced changes at higher colistin doses. By contrast, siHOXD10 resulted in more consistent increases in cell survival across the dosing range. It is possible that mRNA reduction of TGIF1 resulted in a variety of downstream effects, including changes in expression of other genes and proteins resulting in both cell survival and cell death, with the balance shifting to cell survival only under higher concentrations of colistin. One potential limitation of the siRNA knockdown model is that a pool of siRNA constructs was used to knockdown all transcripts (as the exons near the 3’ end are conserved across transcript variants). Future studies should examine the role of transcript variant specific knockdown in cytotoxicity.
Homeobox D10, or HOXD10, is a 38 kDa protein with roles in regulation of the cell cycle and in the development of the spinal cord and kidney [49,50,51]. A mutation in HOXD10 has been found to be a causative variant in Wilm’s tumor (a pediatric renal tumor) [52], further supporting its role in the kidney’s cell cycle. Homeobox protein D10 is a target of the microRNA miR-7, which suppresses p21/CDKN1a (Cyclin-dependent kinase inhibitor 1α) activated kinase [53]. Our group’s prior work has implicated G2/M cell-cycle arrest in the pathogenesis of colistin nephrotoxicity [36]. Thus, the role of HOXD10 in colistin cytotoxicity is plausible given its renal expression and link to the cell cycle. Although specific interactions between the TGIF1 gene and Homeobox protein D10 have not been previously reported, these interactions are also plausible. Homeobox HOX proteins have DNA-binding sites, operating as transcription factors downstream of bone morphogenetic protein (BMP) signaling, part of the TGF-β signaling superfamily [54]. Smad1 and Smad6 interact directly through T-box 1 (Tbx1) with the HOXD10 protein, repressing its transcriptional activity [51]. Based on this, TGIF1 and HOXD10 likely interact through the TGF-β/BMP-signaling pathway, potentially linked by Smad proteins.
Several limitations exist. First, this study identified genes in a lymphoblastoid cell model and replication in relevant cell types will be required to better elucidate downstream pathways. The 68 unrelated YRI samples are a relatively small sample size for GWAS. The association between chr18:3417240 and cytotoxicity, at p ≤ 6.49 × 10⁻⁸, failed to reach a genome-wide significance threshold of p ≤ 5 × 10⁻⁸. This limitation was addressed by the experimentation in NHPTK cells that supports the associations identified in the population genomics portion of the paper. Another limitation is that the pQTL association data is based on antibody-based, targeted proteomic array data [39] and the strength of the corresponding antibodies and methodology (including reducing conditions) used for quantification. Finally, other limitations include the polygenic nature of cytotoxicity and corresponding modest effect of any single gene knockdown, the need to overcome tissue specificity of expression, and the low gene expression of HOXD10 on multiple platforms (RNAseq, Illumina, and qRT-PCR).
Despite these limitations, this work identified two new genes that have not previously been considered in the pathogenesis of colistin nephrotoxicity. The genes TGIF1 and HOXD10 are rarely considered in the pathogenesis of acute kidney injury. Their identification in this study may result in better understanding of their roles in nephrotoxicity caused by a variety of drugs. Of note, neither TGIF1 nor HOXD10 were identified in a prior array based study of colistin nephrotoxicity in mice [36]. Since no population of genotyped renal cells exists to correlate with drug-related phenotypes, a strength of this investigation was the combination of the LCL model with renal tissue and cells to discover associations important in renal cytotoxicity.
The ultimate goal is to use data such as that presented above to predict patients at risk for nephrotoxicity. To date, no prior GWAS studies have examined the role of genotype in predicting toxicity to colistin. Human GWAS studies should be performed; however, these will be fraught with at least one major obstacle: phenotype selection. In practice, clinicians still use creatinine as a late marker of acute kidney injury. This marker is burdened by confounders, and nephrotoxicity may prove one of multiple contributors to an episode of acute kidney injury. As new, more sensitive, biomarkers of acute kidney injury reach clinical practice, this difficulty may be attenuated. Despite remarkable differences in the IC50 of LCLs and renal cells to colistin, the genes and proteins identified in LCLs still resulted in alterations in renal cell sensitivity to colistin. Further, the clean phenotype of cytotoxicity allowed a small number of cell lines to be used to obtain important genetic information. Prospective pharmacogenomic implementation initiatives are underway [55,56]. Often, array platforms are used to screen a moderate number of variants important in drug dosing [57]. Future investigations could include the screening of chr18:3417240 in patients receiving colistin in order to improve the clinical validity of this SNP in predicting nephrotoxicity.
In conclusion, we present a comprehensive genome-wide association study of colistin mediated susceptibility. Through this investigation, we identified a SNP, chr18:3417240 strongly associated with colistin cytotoxicity. With additional validation, this SNP may serve as a marker for susceptibility to colistin in the future. Its host gene, TGIF1, and an associated protein HOXD10 were found to contribute to colistin cytotoxicity in renal proximal tubular cells. Both TGIF1 and HOXD10 are worthy targets for future investigation of nephrotoxicity in humans.

4. Materials and Methods

4.1. Cell Lines and Drug

Lymphoblastoid cell lines were cultured in RPMI 1640 media with 15% bovine growth serum (Hyclone, Logan, UT, USA) and 3.7 mM-glutamine. Cell lines were diluted three times per week to a concentration of 300,000–350,000 cells/mL and maintained in a 37 °C, 5% CO2 humidified incubator. Media and components were purchased from Cellgro (Herndon, VA, USA). HapMap LCLs were purchased from Coriell Institute for Medical Research (Camden, NJ, USA). The 68 LCLs of Yoruban ancestry (YRI 1 and YRI 3) were used in previous experiments evaluating protein levels [23,39]. Table S4 lists the cell lines.
Normal human proximal tubular kidney cells [35] were maintained in REGM media (Lonza, Basel, Switzerland) supplemented with 10% fetal bovine serum (HyClone). Normal human proximal tubular kidney cells were diluted to 20%–30% confluency three times a week and maintained at 37 °C in 95% humidified atmosphere with 5% CO2.
Colistin sulfate was commercially obtained from Sigma (St. Louis, MO, USA).

4.2. Colistin-Induced Cytotoxicity

HapMap LCLs were phenotyped for cellular sensitivity to colistin using a short-term, colorimetric growth inhibition assay. Cell lines were maintained at exponential growth phase with ≥85% viability as determined using the Vi-Cell XR viability analyzer (Beckman Coulter, Fullerton, CA, USA) and diluted in triplicate at a density of 105 cells/mL in 96-well round-bottom plates (Corning, Inc., Corning, NY, USA) 24 h prior to drug treatment. Colistin was prepared by dissolving powder in sterile water to obtain a stock solution of 25 mM with subsequent drug filtration. The drug was dissolved in water rather than saline or phosphate-buffered saline (PBS) because of its increased stability [58]. The drug was suspended in media and in turn added to the 96-well plates of each cell line to obtain six final concentrations of colistin (50, 100, 175, 250, 375 and 500 µM). The range of concentrations was carefully chosen based on previously published in vitro cytotoxicity data [59,60] and optimized for these cell lines. Alamar Blue (Life Technologies, Carlsbad, CA, USA) was added 48 h after drug addition and 24 h before absorbance reading at wavelengths of 570 and 600 nm using the Synergy-HT multi-detection plate reader (BioTek, Winooski, VT, USA). Percent survival was quantified relative to a control well without drug addition. Experiments consisted of at least two biological replicates and six technical replicates. The phenotype chosen for analysis was the IC50 calculated from the survival curve.
Since NHPTK cells are adherent, they were plated at a density of 2 × 10⁴ in 96-well flat-bottom plates and growth inhibition was measured using the CellTiter-Glo assay (Promega, Madison, WI, USA). Cytotoxicity curves were measured 24 h, 48 h, and 72 h after drug treatment using a Spectramax M5 plate reader (Molecular Devices, Sunnyvale, CA, USA) with seven colistin concentrations (50, 100, 150, 200, 250, 375 and 500 µM).

4.3. Genome-Wide Association and Gene Expression Association with Phenotype

Genotype data were obtained from the 1000 Genomes June 2011 phase I low-pass whole genome SNP genotype release and utilized the GRCh37/hg19. The location and nomenclature of SNPs in the text were updated for the GRCh38/hg38 assembly. Missing values were imputed from the 1000 Genomes Project [61,62,63] as previously described [39]. A list of the cell lines included in each analysis is provided in Supplementary Table S4. Analyses were performed to identify SNPs associated with cellular sensitivity to colistin by regressing the number of minor allele copies for each SNP against log2-transformed colistin cytotoxicity IC50 values. All SNPs evaluated had a minor allele frequency ≥5% and were in Hardy–Weinberg equilibrium (p ≥ 0.001). Regression analyses, including the relationships between colistin IC50 with gene or protein expression, and the relationships between genetic variables such as SNPs, baseline gene expression, miRNA, or protein expression were performed in R [64]. Global baseline gene expression levels measured by RNAseq data [38] was used as the metric for mRNA expression. Some expression associations were also evaluated by an Illumina H6 v2 array [42]. Protein expression was measured using microwestern and reverse phase protein arrays as previously published [39]. A p-value threshold of ≤0.001 was used in the drug GWAS and in the subsequent analyses for eQTLs and pQTLs.

4.4. Expression Quantittative Trait Loci and Protein Quantittative Trait Loci Enrichment Analysis

Top colistin-associated SNPs (p ≤ 0.001) were tested for enrichment of eQTLs and pQTLs. A permutation analysis was performed with one thousand random sets of SNPs, generated from the set of HapMap YRI SNPs, each with matching minor allele frequency distributions as the set of significantly associated SNPs. For each random set, the number of eQTLs or pQTLs was determined, yielding a distribution of the expected counts from which an empirical p-value for the enrichment was calculated by comparing to the observed count [37]. mRNA-independent pQTLs were examined using regression analysis on protein expression residuals after regression against mRNA levels for the same gene.

4.5. Animal Studies and Immunohistochemistry

All animal studies were performed as previously reported [36] and approved by the University of Chicago and Indiana University School of Medicine’s Institutional Animal Care and Use Committee (protocol 10670, approval date 1-24-14). In brief, animals were administered colistin 8 mg/kg twice daily for 3 or 15 days and sacrificed with harvest of their kidneys. Paraffin-embedded sections were stained using an antibody to HOXD10 (200 µg/mL, 1:100 dilution, sc-66926, Santa Cruz, Dallas, TX, USA) according to the manufacturer’s instructions, including the optional antigen retrieval step. Renal staining intensity was scored based on total number of pixels per 40× field (n = 4 mice per group, with 10 fields per mouse) as determined by ImageJ 1.49a [65].

4.6. Small Interfering RNA Nucleofection

Normal human proximal tubular kidney cells were diluted to 500,000 cells/mL one day prior to nucleofection. Cells were nucleofected using the SF Cell Line Amaxa X-system Nucleofector Kit (Lonza Inc.) and the CA-137 program on Lonza’s Nucleofector Amaxa X-system. Cells were then centrifuged at 90× g for 10 min at room temperature and resuspended at a concentration of 1,000,000 cells/20 µL in SF/supplement solution (included in SF Kit Lonza Catalog V4SC2096) and 2000 nM final concentration of All Stars Negative Control siRNA (Qiagen, Inc., Valencia, CA, USA) or a pool of four siRNA constructs for the genes TGIF1, HOXD10 or both mRNAs together (Dharmacon, Lafayette, CO, USA). Cells were allowed to rest for 10 min prior to the addition of pre-warmed (37 °C water bath) REGM media and then for another 5 min in the warm REGM media. Cells were then plated for mRNA harvest or drug treatment. Cells were harvested 24 and 48 h post-nucleofection for gene or protein expression measurements, respectively.

4.7. Quantitative Quantitative Real-Time Polymerase Chain Reaction

Quantitative real-time polymerase chain reaction (qRT-PCR) was performed to measure the levels of expression of TGIF1 and HOXD10 in NHPTK cells. A total of 1 million cells were pelleted 24 h after nucleofection, washed in ice-cold PBS, and centrifuged to remove PBS. All pellets were stored at −80 °C until RNA isolation. Total RNA was extracted using the miRNeasy Plus Mini Kit (Qiagen) following the manufacturer’s protocol. Subsequently, mRNA was reverse transcribed to cDNA using the Bio-Rad iScript Reverse Transcription Kit (Bio-Rad, Hercules, CA, USA). The final concentration of cDNA was 25 ng/mL. GAPDH was used as an endogenous control using custom made primers (Life Technologies) and iTaq Universal SYBR Green (Bio-Rad) on the Bio-Rad iCycler qRT-PCR system. Primer sequences are given in Table S5. Total reaction was performed in 20 µL volume, which consisted of 10 µL SYBR green, 4 µL cDNA, 0.4 µL of each primer (0.4 µM concentration), and 5.2 µL of water. The thermocycler parameters were 95 °C for 30 s, 40 cycles of 95 °C for 15 s, and then a lower temperature for 30 s (GAPDH: 60 °C, TGIF1: 50 °C, HOXD10: 56 °C), with ramping speeds of 1.6–1.98 °C/s and a melt curve. The CT threshold and baseline for each experiment were set automatically by the Bio-Rad software.
The ΔΔCT method was used to obtain the relative expression of each gene for samples treated with their associated pool of siRNA or scrambled siRNA. Fold change of the siRNA knockdown as compared to the scramble was determined by the formula fold change = 2ΔΔCT. Gene expression for each condition is given as a percentage of expression relative to the scramble control. Each knockdown experiment was conducted three or more separate times with the qRT-PCR samples run in triplicate. Within each cell line, statistical significance was assessed based on an analysis of variance (ANOVA) between time points.

4.8. Protein Quantitation by Immunoblot in Normal Human Proximal Tubular Kidney Cells

Western immunoblots were performed to measure the level of protein expression of TGIF1 and HOXD10 in NHPTK cells. Approximately 3 million cells were harvested from a petri dish for each condition (siScramble, siTGIF1, siHOXD10, siTGIF1 + siHOXD10) on five occasions 48 h after nucleofection. Media was removed and cells were rinsed with PBS. Radioimmunoprecipitation assay (RIPA) buffer (0.3 mL) with protease inhibitor was added to the monolayer and cells were removed with a cell scraper 48 h after nucleofection. Cells were centrifuged at 10,000× g for 10 minutes at 4 °C and the supernatant was used in subsequent immunoblotting. Protein concentrations of each sample were measured using the bicinchoninic acid (BCA) procedure (Pierce Chemical, Rockford, IL, USA). Samples (20 µg protein) were electrophoresed through a 4%–12% sodium dodecyl sulfate polyacrylamide gel electrophoresis (SDS-PAGE) (Invitrogen Nu-PAGE) under reducing conditions. Proteins were transferred to an Immobilon-P nitrocellulose membrane (Millipore, Bedford, MA, USA) and blocked for 2 h in 5% w/v milk. Membranes were incubated overnight with rabbit polyclonal anti-HOXD10 (200 µg/mL, 1:200 dilution) in 5% milk. A secondary goat anti-rabbit HRP antibody (sc-2004, 1:2000 dilution) was then incubated for 1 h. A protein molecular size ladder control was run for each membrane with Precision Plus Protein WesternC (Bio-Rad, Hercules, CA, USA). The gel was developed with ECL prime (GE, Piscataway, NJ, USA) and analyzed in a Bio-Rad ChemiDoc MP imaging system. An actin-β control was performed for each membrane with mouse anti-actin-β antibody (sc-47778, 1:250) and goat anti-mouse horseradish peroxidase (HRP; sc-2005, 1:5000). Band density was assessed with Biorad Image Lab 4.1 software and normalized to actin-β for each lane.

4.9. Drug Treatment after Nucleofection

Normal human proximal tubular kidney cells were plated in triplicate at a density of 2 × 10⁴ cells/mL in 96-well flat-bottom plates and colistin was added 24 h later. Each knockdown experiment was conducted three or more separate times (at least three biologic replicates and six technical replicates). Cell survival was measured 24, 48, and 72 h post-drug treatment using the Cell-Titer Glo assay (Promega, Madison, WI, USA). Relative change in resistance to colistin was calculated as follows: (SurvivalsiCondition, colistin (µM)/SurvivalsiCondition, control)/(SurvivalsiScramble, colistin (µM)/SurvivalsiScramble, control), in which colistin (µM) = colistin treated cells at a given concentration; Control = vehicle treated cells, siCondition = siRNA experimental knockdown group, and siScramble = scrambled siRNA control group.

4.10. Small Interfering RNA Statistical Analysis

To assess the size and significance of the effect of siRNA on NHPTK cell survival after colistin treatment, a linear mixed model used was: survival~siRNA + (1|experiment). The mixed-effects model was fit using the lmer function from the lme4 package in R version 2.15.2. Significance of the siRNA term in the model was assessed using a likelihood ratio test.

Supplementary Materials

Supplementary materials can be found at www.mdpi.com/1422-0067/18/3/661/s1. Figure S1: Histogram illustrating the distribution of cytotoxicity phenotypes in LCLs; Figure S2: Additional association study results; Table S1: SNPs associated with colistin cytotoxicity; Table S2: pQTLs associated with colistin cytotoxicity; Table S3: Associations between colistin cytotoxicity and protein expression; Table S4: LCLs used in each analysis; Table S5: Primer sequences and temperatures.

Acknowledgments

This work is supported by the PhRMA foundation, Normon S. Coplon Satellite Award, NIH/National Institute of Diabetes and Digestive and Kidney Diseases K08 DK107864, and T32GM007019 (Michael T. Eadon); National Institutes of Health (NIH)/National Institute of General Medical Sciences (NIGMS) F31 GM119401 (Kimberly S. Burgess); NIH/ National Cancer Institute (NCI) National Research Service Award F32CA165823 (Heather E. Wheeler); NIH/NIGMS K08 GM119006 (Eric A. Benson); R01 CA136765 (M. Eileen Dolan); NIH/NIGMS Pharmacogenomics of Anticancer Agents Research Grant U01GM61393 (M. Eileen Dolan); and NIH/NCI R01 CA213466 (Michael T. Eadon, Todd C. Skaar and M. Eileen Dolan).

Author Contributions

Michael T. Eadon, M. Eileen Dolan, Todd C. Skaar, Robert L. Bacallao, Pierre C. Dagher, and Patrick N. Cunningham provided conception and design of research; Michael T. Eadon, Ying-Hua Cheng, and Amy L. Stark performed experiments; Michael T. Eadon, M. Eileen Dolan, Ronald J. Hause, and Heather E. Wheeler analyzed data; Michael T. Eadon, Kimberly S. Burgess, and Eric A. Benson interpreted results of experiments; Michael T. Eadon and Ying-Hua Cheng prepared figures; Michael T. Eadon and M. Eileen Dolan drafted manuscript; and Michael T. Eadon and M. Eileen Dolan edited and revised manuscript. All authors approved final version of manuscript.

Conflicts of Interest

The authors declare no conflict of interest.

References

  1. Li, J.; Nation, R.L.; Milne, R.W.; Turnidge, J.D.; Coulthard, K. Evaluation of colistin as an agent against multi-resistant gram-negative bacteria. Int. J. Antimicrob. Agents 2005, 25, 11–25. [Google Scholar] [CrossRef] [PubMed]
  2. Sarkar, S.; de Santis, E.R.; Kuper, J. Resurgence of colistin use. Am. J. Health Syst. Pharm. 2007, 64, 2462–2466. [Google Scholar] [CrossRef] [PubMed]
  3. Li, J.; Nation, R.L.; Turnidge, J.D.; Milne, R.W.; Coulthard, K.; Rayner, C.R.; Paterson, D.L. Colistin: The re-emerging antibiotic for multidrug-resistant gram-negative bacterial infections. Lancet Infect. Dis. 2006, 6, 589–601. [Google Scholar] [CrossRef]
  4. Azad, M.A.; Akter, J.; Rogers, K.L.; Nation, R.L.; Velkov, T.; Li, J. Major pathways of polymyxin-induced apoptosis in rat kidney proximal tubular cells. Antimicrob. Agents Chemother. 2015, 59, 2136–2143. [Google Scholar] [CrossRef] [PubMed]
  5. Dai, C.; Li, J.; Li, J. New insight in colistin induced neurotoxicity with the mitochondrial dysfunction in mice central nervous tissues. Exp. Toxicol. Pathol. 2013, 65, 941–948. [Google Scholar] [CrossRef] [PubMed]
  6. Deryke, C.A.; Crawford, A.J.; Uddin, N.; Wallace, M.R. Colistin dosing and nephrotoxicity in a large community teaching hospital. Antimicrob. Agents Chemother. 2010, 54, 4503–4505. [Google Scholar] [CrossRef] [PubMed]
  7. Hartzell, J.D.; Neff, R.; Ake, J.; Howard, R.; Olson, S.; Paolino, K.; Vishnepolsky, M.; Weintrob, A.; Wortmann, G. Nephrotoxicity associated with intravenous colistin (colistimethate sodium) treatment at a tertiary care medical center. Clin. Infect. Dis. 2009, 48, 1724–1728. [Google Scholar] [CrossRef] [PubMed]
  8. Ko, H.; Jeon, M.; Choo, E.; Lee, E.; Kim, T.; Jun, J.B.; Gil, H.W. Early acute kidney injury is a risk factor that predicts mortality in patients treated with colistin. Nephron Clin. Pract. 2011, 117, c284–c288. [Google Scholar] [CrossRef] [PubMed]
  9. Paul, M.; Bishara, J.; Levcovich, A.; Chowers, M.; Goldberg, E.; Singer, P.; Lev, S.; Leon, P.; Raskin, M.; Yahav, D.; et al. Effectiveness and safety of colistin: Prospective comparative cohort study. J. Antimicrob. Chemother. 2010, 65, 1019–1027. [Google Scholar] [CrossRef] [PubMed]
  10. Santamaria, C.; Mykietiuk, A.; Temporiti, E.; Stryjewski, M.E.; Herrera, F.; Bonvehi, P. Nephrotoxicity associated with the use of intravenous colistin. Scand. J. Infect. Dis. 2009, 41, 767–769. [Google Scholar] [CrossRef] [PubMed]
  11. Kim, J.; Lee, K.H.; Yoo, S.; Pai, H. Clinical characteristics and risk factors of colistin-induced nephrotoxicity. Int. J. Antimicrob. Agents 2009, 34, 434–438. [Google Scholar] [CrossRef] [PubMed]
  12. Kwon, J.A.; Lee, J.E.; Huh, W.; Peck, K.R.; Kim, Y.G.; Kim, D.J.; Oh, H.Y. Predictors of acute kidney injury associated with intravenous colistin treatment. Int. J. Antimicrob. Agents 2010, 35, 473–477. [Google Scholar] [CrossRef] [PubMed]
  13. Eadon, M.T.; Wheeler, H.E.; Stark, A.L.; Zhang, X.; Moen, E.L.; Delaney, S.M.; Im, H.K.; Cunningham, P.N.; Zhang, W.; Dolan, M.E. Genetic and epigenetic variants contributing to clofarabine cytotoxicity. Hum. Mol. Genet. 2013, 22, 4007–4020. [Google Scholar] [CrossRef] [PubMed]
  14. Wheeler, H.E.; Dolan, M.E. Lymphoblastoid cell lines in pharmacogenomic discovery and clinical translation. Pharmacogenomics 2012, 13, 55–70. [Google Scholar] [CrossRef] [PubMed]
  15. Cox, N.J.; Gamazon, E.R.; Wheeler, H.E.; Dolan, M.E. Clinical translation of cell-based pharmacogenomic discovery. Clin. Pharmacol. Ther. 2012, 92, 425–427. [Google Scholar] [CrossRef] [PubMed]
  16. Peters, E.J.; Kraja, A.T.; Lin, S.J.; Yen-Revollo, J.L.; Marsh, S.; Province, M.A.; McLeod, H.L. Association of thymidylate synthase variants with 5-fluorouracil cytotoxicity. Pharmacogenet. Genom. 2009, 19, 399–401. [Google Scholar] [CrossRef] [PubMed]
  17. Niu, N.; Schaid, D.J.; Abo, R.P.; Kalari, K.; Fridley, B.L.; Feng, Q.; Jenkins, G.; Batzler, A.; Brisbin, A.G.; Cunningham, J.M.; et al. Genetic association with overall survival of taxane-treated lung cancer patients—A genome-wide association study in human lymphoblastoid cell lines followed by a clinical association study. BMC Cancer 2012, 12, 422. [Google Scholar] [CrossRef] [PubMed]
  18. Brown, C.C.; Havener, T.M.; Medina, M.W.; Auman, J.T.; Mangravite, L.M.; Krauss, R.M.; McLeod, H.L.; Motsinger-Reif, A.A. A genome-wide association analysis of temozolomide response using lymphoblastoid cell lines shows a clinically relevant association with mgmt. Pharmacogenet. Genomics 2012, 22, 796–802. [Google Scholar] [CrossRef] [PubMed]
  19. Kim, K.; Bolotin, E.; Theusch, E.; Huang, H.; Medina, M.W.; Krauss, R.M. Prediction of LDL cholesterol response to statin using transcriptomic and genetic variation. Genome Biol. 2014, 15, 460. [Google Scholar] [CrossRef] [PubMed]
  20. Mangravite, L.M.; Engelhardt, B.E.; Medina, M.W.; Smith, J.D.; Brown, C.D.; Chasman, D.I.; Mecham, B.H.; Howie, B.; Shim, H.; Naidoo, D.; et al. A statin-dependent QTL for GATM expression is associated with statin-induced myopathy. Nature 2013, 502, 377–380. [Google Scholar] [CrossRef] [PubMed]
  21. International HapMap Consortium. The international hapmap project. Nature 2003, 426, 789–796. [Google Scholar] [CrossRef] [PubMed]
  22. Zhang, W.; Duan, S.; Kistner, E.O.; Bleibel, W.K.; Huang, R.S.; Clark, T.A.; Chen, T.X.; Schweitzer, A.C.; Blume, J.E.; Cox, N.J.; et al. Evaluation of genetic variation contributing to differences in gene expression between populations. Am. J. Hum. Genet. 2008, 82, 631–640. [Google Scholar] [CrossRef] [PubMed]
  23. Hause, R.J.; Stark, A.L.; Antao, N.N.; Gorsic, L.K.; Chung, S.H.; Brown, C.D.; Wong, S.S.; Gill, D.F.; Myers, J.L.; To, L.A.; et al. Identification and validation of genetic variants that influence transcription factor and cell signaling protein levels. Am. J. Hum. Genet. 2014, 95, 194–208. [Google Scholar] [CrossRef] [PubMed]
  24. Mitra, A.K.; Crews, K.R.; Pounds, S.; Cao, X.; Feldberg, T.; Ghodke, Y.; Gandhi, V.; Plunkett, W.; Dolan, M.E.; Hartford, C.; et al. Genetic variants in cytosolic 5’-nucleotidase II are associated with its expression and cytarabine sensitivity in hapmap cell lines and in patients with acute myeloid leukemia. J. Pharmacol. Exp. Ther. 2011, 339, 9–23. [Google Scholar] [CrossRef] [PubMed]
  25. Ziliak, D.; O’Donnell, P.H.; Im, H.K.; Gamazon, E.R.; Chen, P.; Delaney, S.; Shukla, S.; Das, S.; Cox, N.J.; Vokes, E.E.; et al. Germline polymorphisms discovered via a cell-based, genome-wide approach predict platinum response in head and neck cancers. Transl. Res. 2011, 157, 265–272. [Google Scholar] [CrossRef] [PubMed]
  26. Chen, S.H.; Yang, W.; Fan, Y.; Stocco, G.; Crews, K.R.; Yang, J.J.; Paugh, S.W.; Pui, C.H.; Evans, W.E.; Relling, M.V. A genome-wide approach identifies that the aspartate metabolism pathway contributes to asparaginase sensitivity. Leukemia 2011, 25, 66–74. [Google Scholar] [CrossRef] [PubMed]
  27. Tan, X.L.; Moyer, A.M.; Fridley, B.L.; Schaid, D.J.; Niu, N.; Batzler, A.J.; Jenkins, G.D.; Abo, R.P.; Li, L.; Cunningham, J.M.; et al. Genetic variation predicting cisplatin cytotoxicity associated with overall survival in lung cancer patients receiving platinum-based chemotherapy. Clin. Cancer Res. 2011, 17, 5801–5811. [Google Scholar] [CrossRef] [PubMed]
  28. Grundberg, E.; Small, K.S.; Hedman, A.K.; Nica, A.C.; Buil, A.; Keildson, S.; Bell, J.T.; Yang, T.P.; Meduri, E.; Barrett, A.; et al. Mapping cis- and trans-regulatory effects across multiple tissues in twins. Nat. Genet. 2012, 44, 1084–1089. [Google Scholar] [CrossRef] [PubMed]
  29. Goring, H.H. Tissue specificity of genetic regulation of gene expression. Nat. Genet. 2012, 44, 1077–1078. [Google Scholar] [CrossRef] [PubMed]
  30. Travis, L.B.; Fossa, S.D.; Sesso, H.D.; Frisina, R.D.; Herrmann, D.N.; Beard, C.J.; Feldman, D.R.; Pagliaro, L.C.; Miller, R.C.; Vaughn, D.J.; et al. Chemotherapy-induced peripheral neurotoxicity and ototoxicity: New paradigms for translational genomics. J. Natl. Cancer Inst. 2014. [Google Scholar] [CrossRef] [PubMed]
  31. Wheeler, H.E.; Gonzalez-Neira, A.; Pita, G.; de la Torre-Montero, J.C.; Alonso, R.; Lopez-Fernandez, L.A.; Alba, E.; Martin, M.; Dolan, M.E. Identification of genetic variants associated with capecitabine-induced hand-foot syndrome through integration of patient and cell line genomic analyses. Pharmacogenet. Genom. 2014, 24, 231–237. [Google Scholar] [CrossRef] [PubMed]
  32. Wheeler, H.E.; Gamazon, E.R.; Wing, C.; Njiaju, U.O.; Njoku, C.; Baldwin, R.M.; Owzar, K.; Jiang, C.; Watson, D.; Shterev, I.; et al. Integration of cell line and clinical trial genome-wide analyses supports a polygenic architecture of paclitaxel-induced sensory peripheral neuropathy. Clin. Cancer Res. 2013, 19, 491–499. [Google Scholar] [CrossRef] [PubMed]
  33. Hneino, M.; Francois, A.; Buard, V.; Tarlet, G.; Abderrahmani, R.; Blirando, K.; Hoodless, P.A.; Benderitter, M.; Milliat, F. The TGF-β/Smad repressor TG-interacting factor 1 (TGIF1) plays a role in radiation-induced intestinal injury independently of a smad signaling pathway. PLoS ONE 2012, 7, e35672. [Google Scholar] [CrossRef] [PubMed]
  34. Song, K.; Peng, S.; Sun, Z.; Li, H.; Yang, R. Curcumin suppresses TGF-β signaling by inhibition of tgif degradation in scleroderma fibroblasts. Biochem. Biophys. Res. Commun. 2011, 411, 821–825. [Google Scholar] [CrossRef] [PubMed]
  35. Herbert, B.S.; Grimes, B.R.; Xu, W.M.; Werner, M.; Ward, C.; Rossetti, S.; Harris, P.; Bello-Reuss, E.; Ward, H.H.; Miller, C.; et al. A telomerase immortalized human proximal tubule cell line with a truncation mutation (Q4004X) in polycystin-1. PLoS ONE 2013, 8, e55191. [Google Scholar] [CrossRef] [PubMed]
  36. Eadon, M.T.; Hack, B.K.; Alexander, J.J.; Xu, C.; Dolan, M.E.; Cunningham, P.N. Cell cycle arrest in a model of colistin nephrotoxicity. Physiol. Genom. 2013, 45, 877–888. [Google Scholar] [CrossRef] [PubMed]
  37. Gamazon, E.R.; Huang, R.S.; Cox, N.J.; Dolan, M.E. Chemotherapeutic drug susceptibility associated SNPs are enriched in expression quantitative trait loci. Proc. Natl. Acad. Sci. USA 2010, 107, 9287–9292. [Google Scholar] [CrossRef] [PubMed]
  38. Pickrell, J.K.; Marioni, J.C.; Pai, A.A.; Degner, J.F.; Engelhardt, B.E.; Nkadori, E.; Veyrieras, J.B.; Stephens, M.; Gilad, Y.; Pritchard, J.K. Understanding mechanisms underlying human gene expression variation with RNA sequencing. Nature 2010, 464, 768–772. [Google Scholar] [CrossRef] [PubMed]
  39. Stark, A.L.; Hause, R.J., Jr.; Gorsic, L.K.; Antao, N.N.; Wong, S.S.; Chung, S.H.; Gill, D.F.; Im, H.K.; Myers, J.L.; White, K.P.; et al. Protein quantitative trait loci identify novel candidates modulating cellular response to chemotherapy. PLoS Genet. 2014, 10, e1004192. [Google Scholar] [CrossRef] [PubMed]
  40. Shanmugam, K.; Green, N.C.; Rambaldi, I.; Saragovi, H.U.; Featherstone, M.S. PBX and MEIS as non-DNA-binding partners in trimeric complexes with HOX proteins. Mol. Cell. Biol. 1999, 19, 7577–7588. [Google Scholar] [CrossRef] [PubMed]
  41. Phelan, M.L.; Featherstone, M.S. Distinct HOX N-terminal arm residues are responsible for specificity of DNA recognition by hox monomers and HOX·PBX heterodimers. J. Biol. Chem. 1997, 272, 8635–8643. [Google Scholar] [CrossRef] [PubMed]
  42. Stranger, B.E.; Nica, A.C.; Forrest, M.S.; Dimas, A.; Bird, C.P.; Beazley, C.; Ingle, C.E.; Dunning, M.; Flicek, P.; Koller, D.; et al. Population genomics of human gene expression. Nat. Genet. 2007, 39, 1217–1224. [Google Scholar] [CrossRef] [PubMed]
  43. Wieser, M.; Stadler, G.; Jennings, P.; Streubel, B.; Pfaller, W.; Ambros, P.; Riedl, C.; Katinger, H.; Grillari, J.; Grillari-Voglauer, R. Htert alone immortalizes epithelial cells of renal proximal tubules without changing their functional characteristics. Am. J. Physiol. Renal Physiol. 2008, 295, F1365–F1375. [Google Scholar] [CrossRef] [PubMed]
  44. Chen, F.; Ogawa, K.; Nagarajan, R.P.; Zhang, M.; Kuang, C.; Chen, Y. Regulation of TG-interacting factor by transforming growth factor-β. Biochem. J. 2003, 371, 257–263. [Google Scholar] [CrossRef] [PubMed]
  45. Pessah, M.; Prunier, C.; Marais, J.; Ferrand, N.; Mazars, A.; Lallemand, F.; Gauthier, J.M.; Atfi, A. c-Jun interacts with the corepressor TG-interacting factor (TGIF) to suppress Smad2 transcriptional activity. Proc. Natl. Acad. Sci. USA 2001, 98, 6198–6203. [Google Scholar] [CrossRef] [PubMed]
  46. Yan, L.; Womack, B.; Wotton, D.; Guo, Y.; Shyr, Y.; Dave, U.; Li, C.; Hiebert, S.; Brandt, S.; Hamid, R. TGIF1 regulates quiescence and self-renewal of hematopoietic stem cells. Mol. Cell. Biol. 2013, 33, 4824–4833. [Google Scholar] [CrossRef] [PubMed]
  47. Hamid, R.; Patterson, J.; Brandt, S.J. Genomic structure, alternative splicing and expression of TG-interacting factor, in human myeloid leukemia blasts and cell lines. Biochim. Biophys. Acta 2008, 1779, 347–355. [Google Scholar] [CrossRef] [PubMed]
  48. Liborio, T.N.; Ferreira, E.N.; Aquino Xavier, F.C.; Carraro, D.M.; Kowalski, L.P.; Soares, F.A.; Nunes, F.D. TGIF1 splicing variant 8 is overexpressed in oral squamous cell carcinoma and is related to pathologic and clinical behavior. Oral Surg. Oral Med. Oral Pathol. Oral Radiol. 2013, 116, 614–625. [Google Scholar] [CrossRef] [PubMed]
  49. Gabellini, D.; Colaluca, I.N.; Vodermaier, H.C.; Biamonti, G.; Giacca, M.; Falaschi, A.; Riva, S.; Peverali, F.A. Early mitotic degradation of the homeoprotein HOXC10 is potentially linked to cell cycle progression. EMBO J. 2003, 22, 3715–3724. [Google Scholar] [CrossRef] [PubMed]
  50. De la Cruz, C.C.; Der-Avakian, A.; Spyropoulos, D.D.; Tieu, D.D.; Carpenter, E.M. Targeted disruption of HOXD9 and HOXD10 alters locomotor behavior, vertebral identity, and peripheral nervous system development. Dev. Biol. 1999, 216, 595–610. [Google Scholar] [CrossRef] [PubMed]
  51. Fu, Y.; Li, F.; Zhao, D.Y.; Zhang, J.S.; Lv, Y.; Li-Ling, J. Interaction between TBX1 and HOXD10 and connection with TGFβ-BMP signal pathway during kidney development. Gene 2014, 536, 197–202. [Google Scholar] [CrossRef] [PubMed]
  52. Redline, R.W.; Hudock, P.; MacFee, M.; Patterson, P. Expression of abdb-type homeobox genes in human tumors. Lab. Investig. 1994, 71, 663–670. [Google Scholar] [PubMed]
  53. Reddy, S.D.; Ohshiro, K.; Rayala, S.K.; Kumar, R. MicroRNA-7, a homeobox D10 target, inhibits p21-activated kinase 1 and regulates its functions. Cancer Res. 2008, 68, 8195–8200. [Google Scholar] [CrossRef] [PubMed]
  54. Li, X.; Nie, S.; Chang, C.; Qiu, T.; Cao, X. Smads oppose HOX transcriptional activities. Exp. Cell Res. 2006, 312, 854–864. [Google Scholar] [CrossRef] [PubMed]
  55. Eadon, M.T.; Desta, Z.; Levy, K.D.; Decker, B.S.; Pierson, R.C.; Pratt, V.M.; Callaghan, J.T.; Rosenman, M.B.; Carpenter, J.S.; Holmes, A.M.; et al. Implementation of a pharmacogenomics consult service to support the ingenious trial. Clin. Pharmacol. Ther. 2016, 100, 63–66. [Google Scholar] [CrossRef] [PubMed]
  56. O’Donnell, P.H.; Danahey, K.; Jacobs, M.; Wadhwa, N.R.; Yuen, S.; Bush, A.; Sacro, Y.; Sorrentino, M.J.; Siegler, M.; Harper, W.; et al. Adoption of a clinical pharmacogenomics implementation program during outpatient care—Initial results of the university of chicago “1200 patients project”. Am. J. Med. Genet. Part C Semin. Med. Genet. 2014, 166C, 68–75. [Google Scholar] [CrossRef] [PubMed]
  57. Levy, K.D.; Decker, B.S.; Carpenter, J.S.; Flockhart, D.A.; Dexter, P.R.; Desta, Z.; Skaar, T.C. Prerequisites to implementing a pharmacogenomics program in a large health-care system. Clin. Pharmacol. Ther. 2014, 96, 307–309. [Google Scholar] [CrossRef] [PubMed] [Green Version]
  58. Li, J.; Milne, R.W.; Nation, R.L.; Turnidge, J.D.; Coulthard, K. Stability of colistin and colistin methanesulfonate in aqueous media and plasma as determined by high-performance liquid chromatography. Antimicrob. Agents Chemother. 2003, 47, 1364–1370. [Google Scholar] [CrossRef] [PubMed]
  59. Vaara, M.; Vaara, T. The novel polymyxin derivative NAB739 is remarkably less cytotoxic than polymyxin B and colistin to human kidney proximal tubular cells. Int. J. Antimicrob. Agents 2013, 41, 292–293. [Google Scholar] [CrossRef] [PubMed]
  60. Keirstead, N.D.; Wagoner, M.P.; Bentley, P.; Blais, M.; Brown, C.; Cheatham, L.; Ciaccio, P.; Dragan, Y.; Ferguson, D.; Fikes, J.; et al. Early prediction of polymyxin-induced nephrotoxicity with next-generation urinary kidney injury biomarkers. Toxicol. Sci. 2013, 137, 278–291. [Google Scholar] [CrossRef] [PubMed]
  61. Genomes Project Consortium; Abecasis, G.R.; Altshuler, D.; Auton, A.; Brooks, L.D.; Durbin, R.M.; Gibbs, R.A.; Hurles, M.E.; McVean, G.A. A map of human genome variation from population-scale sequencing. Nature 2010, 467, 1061–1073. [Google Scholar] [Green Version]
  62. Genomes Project Consortium; Abecasis, G.R.; Auton, A.; Brooks, L.D.; de Pristo, M.A.; Durbin, R.M.; Handsaker, R.E.; Kang, H.M.; Marth, G.T.; McVean, G.A. An integrated map of genetic variation from 1092 human genomes. Nature 2012, 491, 56–65. [Google Scholar]
  63. Genomes Project Consortium; Auton, A.; Brooks, L.D.; Durbin, R.M.; Garrison, E.P.; Kang, H.M.; Korbel, J.O.; Marchini, J.L.; McCarthy, S.; McVean, G.A.; et al. A global reference for human genetic variation. Nature 2015, 526, 68–74. [Google Scholar] [Green Version]
  64. R Core Team (2014). R: A Language and Environment for Statistical Computing. R Foundation for Statistical Computing: Vienna, Austria. Available online: http://www.R-project.org/ (accessed on 15 January 2017).
  65. Schneider, C.A.; Rasband, W.S.; Eliceiri, K.W. Nih image to imagej: 25 years of image analysis. Nat. Methods 2012, 9, 671–675. [Google Scholar] [CrossRef] [PubMed]
Figure 1. Schematic diagram of experimentation and analyses. Association studies were performed in 68 Yoruban (YRI) cells using 10 million single nucleotide polymorphisms (SNPs) (imputed), baseline gene expression measured by RNA sequencing (RNAseq), and baseline protein expression measured by microwestern and reverse phase protein arrays. Given the pertinence of colistin toxicity to human kidney injury, associations were then validated in human renal proximal tubular cells. GWAS: Genome-wide association study; pQTLs: Protein quantitative trait loci.
Ijms 18 00661 g001
Figure 2. Genetic association studies: (A) Manhattan plot of association between SNPs and colistin half maximal inhibitory concentration (IC50). At p ≤ 0.0013, 12,948 SNPs (2,711 after Linkage Disequilibrium correction) were associated with cytotoxicity. The top SNP was located on chromosome 18, associated at p = 6.49 × 10⁻⁸. (B) Global enrichment analysis of the distribution of expression quantitative trait locus (eQTL) counts in 1000 simulations, each matching the Minor Allele Frequency distribution of all colistin-associated SNPs at p ≤ 0.001 (after LD correction). The black dot (●) represents the observed eQTL count (n = 1402 eQTLs at p ≤ 0.0001) in the colistin susceptibility-associated SNPs. Colistin-associated SNPs are enriched for eQTLs (p ≤ 0.001). (C) The pQTL enrichment analysis of the 441 proteins quantified by microwestern and reverse phase protein arrays. Colistin-associated SNPs at p ≤ 0.001 are enriched for mRNA-independent protein quantitative trait loci (pQTLs) among these (n = 271 pQTLs at p ≤ 0.0001). The black dot (●) represents the observed pQTL count (n = 104) in the colistin susceptibility-associated SNPs (p = 0.015). (D) Quantilequantile (Q–Q) plot representing the observed associations between baseline protein expression and colistin IC50. At p ≤ 0.05, 23 proteins were significantly associated. Solid line indicates a false discovery rate (FDR) of 0.05.
Ijms 18 00661 g002
Figure 3. Association studies of chr18:3417240, TGIF1 (transforming growth factor β (TGFβ)-induced factor-1) and the protein HOXD10 (homeobox protein D10): (A) The SNP chr18:3417240 is associated with colistin cytotoxicity (log2 IC50) at p = 6.47 × 10⁻⁸; (B) Chr18:3417240 was associated with expression of HOXD10 (75 kDa isoform) at p = 7.17 × 10⁻⁵; (C) HOXD10 protein expression (75 kDa) was not significantly associated with colistin cytotoxicity at p = 0.056; however, the direction of effect for this result is consistent with A and B; (D) Chr18:3417240 was not associated with expression of HOXD10 (38 kDa isoform) at p = 0.59; (E) HOXD10 protein expression (38 kDa) was not significantly associated with colistin cytotoxicity at p = 0.11; (F) the homozygous recessive (GG) genotype of chr18:3417240 had significantly lower TGIF1 gene expression than heterozygous (AG, p = 0.031) or homozygous dominant (AA, p = 0.021) lymphoblastoid cell lines; (G) TGIF1 gene expression is associated with HOXD10 protein expression (75 kDa) at p = 0.012 (from Illumina array); and (H) TGIF1 gene expression is associated with HOXD10 protein expression (38 kDa) at p = 0.016 (from Illumina array). The association between TGIF1 gene expression and either 75 kDa or 38 kDa HOXD10 protein expression was not significant as measured by the RNA sequencing platform (see Figure S2).
Ijms 18 00661 g003
Figure 4. Homeobox protein D10 expression is increased in mouse kidney following colistin exposure: (A) HOXD10 immunohistochemistry (IHC) in control mice revealed minimal staining. (B) HOXD10 IHC staining is upregulated in mice after three days of colistin exposure. Subtle, but significant up-regulation of expression is noted in glomeruli (arrowhead) and the brush border of proximal tubules (arrow). (C) HOXD10 IHC is upregulated after 15 days of colistin exposure. Glomeruli, interstitium, S1–S2 proximal tubular brush borders, and S3 proximal tubules were affected. Scale bar = 50 µm. Magnification: 20×. (D) Quantitation of HOXD10 protein expression by IHC reveals increased expression on Day 3 and Day 15 of colistin administration. (E) TGFB3 (transforming growth factor β-3) gene expression was upregulated in mouse kidney tissue. * = p ≤ 0.05.
Ijms 18 00661 g004
Figure 5. Cytotoxicity in LCLs and normal human proximal tubular kidney (NHPTK) cells. A mean of all 68 cytotoxicity curves is provided for the LCLs 72 h after colistin exposure. Normal human proximal tubular kidney cells were more sensitive to colistin than LCLs at 72 h. Normal human proximal tubular kidney cells exposed to colistin had relatively greater survival at 24 h as compared to 72 h.
Ijms 18 00661 g005
Figure 6. Effect of gene knockdown on gene expression, protein expression, and cellular resistance to colistin. Following transfection with small interfering RNA (siRNA), the effect on gene expression (A); protein expression of HOXD10 (BD); and colistin-induced cytotoxicity (E) was determined for a control scramble siRNA (siScramble or siRNA targeting TGIF1, HOXD10, and the combination of both. was determined for: Knockdown was performed with at least three biological replicates (six or more technical replicates). mRNA levels were measured by real-time quantitative polymerase chain reaction (qRT-PCR) 24 h post-siRNA transfection. Gene expression is given as a percentage of expression relative to siScramble after Glyceraldehyde 3-phosphate dehydrogenase (GAPDH) normalization. Protein expression was calculated from densitometry with an Actin-β control and then compared to siScramble. Cytotoxicity was measured 24 h after initial colistin exposure. Cell survival at each concentration was calculated relative to control (no drug). The relative increase in % cell survival is expressed as a ratio of each condition’s knockdown (siCondition) to the siScramble. * = p ≤ 0.05 by Student’s t-test between the scramble siRNA and the siRNA targeting each gene. Baseline HOXD10 gene expression was low in NHPTK cells, contributing to the modest knockdown effect.
Ijms 18 00661 g006

